laboratory studies on thermal fracturing behavior in well …
TRANSCRIPT

LABORATORY STUDIES ON THERMAL FRACTURING BEHAVIOR IN WELL
STIMULATION OF ENHANCED GEOTHERMAL SYSTEMS
A Thesis
by
YUNXING LU
Submitted to the Office of Graduate and Professional Studies of Texas A&M University
in partial fulfillment of the requirements for the degree of
MASTER OF SCIENCE
Chair of Committee, Minsu Cha Committee Members, Marcelo Sanchez Kan Wu Head of Department, Robin Autenrieth
August 2017
Major Subject: Civil Engineering
Copyright 2017 Yunxing Lu

ii
ABSTRACT
Thermal fracturing is aim to increase the permeability of the reservoir formation
through thermal stress cracking. It occurs in enhanced geothermal system (EGS) wells and
other types of geothermal wells where the temperature difference between injection fluid and
reservoir temperature is high. Although the hydraulic fracturing is the effective technology to
improve the production wells with low permeability in EGS, thermal fracturing is observed to
further enhance the permeability of reservoir. However, the mechanism of thermal fracturing
in downhole conditions is still not well understood. In the thesis, we aim to provide a deeper
understanding of the thermal fracturing and thermal shock mechanisms by an experimental
study in a laboratory environment mimicking EGS wellbores.
The laboratory study investigates the behavior of thermal fracturing stimulation by
using room temperature water injected into hot concrete and granite blocks without
confining pressure. An experimental test system and test procedures were developed and
used to apply thermal shock to wellbores in block specimens with elevated temperatures.
Water usage, borehole pressure, and temperature were monitored continuously during the
fracturing process. The direct and indirect assessments of fractures were made by visual
inspection, bubble leakages, pressure decay, and acoustic signatures before and after the
experiments. In addition, the mechanical and thermal properties are measured and
analyzed before and after treatment.
Experimental data showed that the permeability of the treated specimens was
enhanced by the macro/micro cracks induced by thermal loading during thermal

iii
stimulations. The profiles of borehole pressure decay obtained before and after each stage
of stimulation show that the thermal shock increased the permeability of treated specimens.
The thermally driven fractures were usually initiated from the borehole surfaces and
propagated adjacent to the boreholes to some extent. Those fractures was confirmed by
the acoustic measurement and visually demonstrated by bubble leakage tests. These “seed”
fractures created during the thermal stimulations may help reduce the breakdown pressure
levels of pressure-based fracturing methods, and improve fracturing efficiency by creating
multiple thermal fracture surfaces around a wellbore.

iv
CONTRIBUTORS AND FUNDING SOURCES
Contributors
Part 1, faculty committee recognition
This work was supervised by a thesis committee consisting of Professor Minsu
Cha and Professor Marcelo Sanchez of the Department of Civil Engineering and Professor
Kan Wu of the Department of Petroleum Engineering.
Part 2, student/collaborator contributions
All work for the thesis was completed by the student, in collaboration with Dani
Dawson, Jack Kong, Dong Wang, Yong Deng, Xi Luo, Xijun Shi, Jimmy Liu, and the rest
of Aggies in the Department of Civil Engineering.
Funding Sources
Graduate study was supported by a fellowship from Texas A&M University and
the funding contributions from Texas Engineering & Experiment Foundation.

v
TABLE OF CONTENTS
Page
ABSTRACT ....................................................................................................................... ii
CONTRIBUTORS AND FUNDING SOURCES ............................................................. iv
LIST OF FIGURES .......................................................................................................... vii
LIST OF TABLES .......................................................................................................... xiv
1. INTRODUCTION ...................................................................................................... 1
1.1 Motivation and background ....................................................................... 1 1.2 Literature review ........................................................................................ 2 1.3 Objectives and scope of the thesis ............................................................. 3
2. WELLBORE THERMAL STIMULATION IN CONCRETE BLOCK SPECIMENS ............................................................................................................... 5
2.1 Introduction ................................................................................................ 5 2.2 Experimental studies ................................................................................... 6 2.3 Results ...................................................................................................... 17 2.4 Analyses and discussions .......................................................................... 56 2.5 Conclusions .............................................................................................. 65
3. WELLBORE THERMAL STIMULATION IN GRANITE BLOCK SPECIMENS ............................................................................................................. 67
3.1 Introduction .............................................................................................. 67 3.2 Experimental studies ................................................................................. 68 3.3 Results ...................................................................................................... 72 3.4 Conclusions .............................................................................................. 92
4. THERMAL STIMULATION OF CORE SPECIMENS - CHANGES IN PHYSICAL PROPERTIES ....................................................................................... 94

vi
Page
4.1 Introduction ............................................................................................. 94 4.2 Experimental studies ................................................................................ 94 4.3 Experimental results .............................................................................. 101 4.4 Conclusions ........................................................................................... 112
5. CONCLUSIONS ..................................................................................................... 114
5.1 Key findings of the thesis ..................................................................... 114 5.2 Implications and future study ............................................................... 116 REFERENCES ............................................................................................................... 118
vii
LIST OF FIGURES
Page
Figure 2.1 The integrated experimental system for the lab test. ........................................ 7
Figure 2.2 Equipment used for acoustic measurement - pulser, ultrasonic transducers, and the digital oscilloscope. ............................................................................. 8
Figure 2.3 Typical input pulse and received signals from acoustic tests. .......................... 9
Figure 2.4 Temperatures in borehole and outer faces during heating (Test #15; Specimen #7). ................................................................................................. 18
Figure 2.5 Borehole temperature change during water injection (Test #15; Specimen #7). .................................................................................................................. 19
Figure 2.6 Temperatures in borehole and outer faces during water injection (Test #15; Specimen #7). ............................................................................... 20
Figure 2.7 Temperatures in borehole and outer faces during cooling period (Test #15; Specimen #7). ................................................................................................. 20
Figure 2.8 Borehole pressure and flow rate during thermal stimulation (Test #15; Concrete #7). .................................................................................................. 22
Figure 2.9 Borehole pressure and flow rate during thermal stimulation (Test #6; Concrete #15). ............................................................................................... 23
Figure 2.10 Face numbering convention for the block specimens. .................................. 25
Figure 2.11 Fracture observations of Specimen #14. ....................................................... 26
Figure 2.12 Pressure decay test right after the thermal stimulation and continued heating of Specimen 16. ............................................................................... 28
Figure 2.13 Observation of several localized permeation spots/cracks. .......................... 30
Figure 2.14 Comparison of the localized permeation crack and massive bubble generation from bubble leakage test (Specimen #7). .................................... 30
Figure 2.15 Comparison of bubble leakage tests before and after thermal stimulation (Face 1, Specimen #7). .................................................................................. 31

viii
Figure 2.16 Comparison of bubble leakage tests before and after thermal stimulation (Face 2, Specimen #7). .................................................................................. 31
Figure 2.17 Comparison of bubble leakage tests before and after thermal stimulation (Face 3, Specimen #7). .................................................................................. 32
Figure 2.18 Comparison of bubble leakage tests before and after thermal stimulation (Face 4, Specimen #7). .................................................................................. 32
Figure 2.19 Comparison of bubble leakage tests before and after thermal stimulation (Face 5, Specimen #7). .................................................................................. 33
Figure 2.20 Waves measured along Face 1 & 3, 2 & 4, and 5 & 6. (a) Face numbering convention. (b) Locations for acoustic measurement on a face of a specimen. ..................................................................................... 34
Figure 2.21 Acoustic measurements of Specimen #14 (S-wave, from Face 1 to Face 3). .................................................................................................................. 35
Figure 2.22 Acoustic measurements of Specimen #14 (S-wave, from Face 2 to Face 4). .................................................................................................................. 35
Figure 2.23 Acoustic measurements of Specimen #14 (S-wave, from Face 5 to Face 6). .................................................................................................................. 36
Figure 2.24 P-wave velocity calculation of Specimen #18 (from Face 1 to Face 3). ...... 36
Figure 2.25 P-wave velocity calculation of Specimen #18 (from Face 2 to Face 4). ...... 37
Figure 2.26 P-wave velocity calculation of Specimen #18 (from Face 5 to Face 6). ...... 37
Figure 2.27 S-wave velocity calculation of Specimen #18 (from Face 1 to Face 3). ...... 38
Figure 2.28 S-wave velocity calculation of Specimen #18 (from Face 2 to Face 4). ...... 38
Figure 2.29 S-wave velocity calculation of Specimen #18 (from Face 5 to Face 6). ...... 39
Figure 2.30 “Short-cut” fractures initiate from the borehole and propagate to the top surface (Specimen 14). .................................................................................. 40
Figure 2.31 Fracture tortuosity on top surface of specimen #18 ...................................... 41

ix
Figure 2.32 Water bubble indications during pressure decay tests (Specimen #18). ....... 42
Figure 2.33 Water bubble indications during thermal stimulation (water flow) (Specimen #18). ............................................................................................ 43
Figure 2.34 Fracture direction comparisons between Specimen #15 (left side in the figure) & #18 (right side in the figure).......................................................... 44
Figure 2.35 Fractures propagated and widened during the cooling period (Specimen 14) (oven door kept open during cooling). ................................. 45
Figure 2.36 Acoustic signals with assumption of thermal front. ..................................... 46
Figure 2.37 Front of fracture was estimated by ultrasonic wave signals (Specimen #18). .............................................................................................................. 46
Figure 2.38 Breakdown test results with showing the thermal fracture front (Specimen #18). ............................................................................................ 47
Figure 2.39 Thermal fracture comparision between acoustic analysis and breakdown test (Specimen #18). .................................................................. 47
Figure 2.40 Breakdown test results with showing the thermal front (Specimen #12). .... 48
Figure 2.41 Locations of embedded thermocouples at the mid height of the specimen (Plan view). ................................................................................................... 49
Figure 2.42 Temperature behavior of embedded Specimen #2 during heating period. ... 51
Figure 2.43 Temperatures and borehole pressure of the embedded thermocouples during water flow (embedded thermocouple Specimen #2) ........................ 51
Figure 2.44 Borehole pressure and flow rate of the embedded thermocouples Specimen #2 during water flow. ................................................................... 52
Figure 2.45 Sensor numbering for thermal gradient calculation. ..................................... 53
Figure 2.46 Thermal gradient change along with time of each locations ........................ 53
Figure 2.47 Thermal gradients calculated from temperature measured by embedded sensors. .......................................................................................................... 54
x
Figure 2.48 Total time for specimen heating (from room temperature to 190°C). .......... 57
Figure 2.49 Cooling time when specimen borehole surface temperature cooled from 100 to 40 and outside surface temperature cooled from 180 to 40 . .............................................................................................................. 57
Figure 2.50 Peak borehole pressure, constant (~mean) borehole pressure, and flow rate of each specimen. .......................................................................... 58
Figure 2.51 Average temperature of face that without leakage water, borehole temperature and outlet water temperature after thermal stimulations. ......... 61
Figure 2.52 Fracture observations after the thermal stimulations (Specimen #18).......... 62
Figure 2.53 Pressure data records when performing the breakdown test (Specimen #18). ........................................................................................... 63
Figure 2.54 Fracture observations after breakdown test (air gas fracturing) (Specimen #18) ............................................................................................. 63
Figure 2.55 Fracture surfaces after specimen breakdown showing the thermal front. The pink area caused by the phenolphthalein shows the extent of the thermally induced fractures. The uncolored areas are opened up by air pressure (Specimen #18). .............................................................................. 64
Figure 3.1 Temperature during heating of granite block Specimen #2 (the first stimulation). .................................................................................................... 73
Figure 3.2 Temperature changes during thermal stimulation (flow of tap water) of granite block Specimen#2 (the first stimulation). .......................................... 74
Figure 3.3 Temperature changes after stopping water injection of granite block Specimen#2 (the first stimulation). ................................................................ 74
Figure 3.4 Borehole pressure and flow rate during thermal stimulation (water flow, Specimen#2-first stimulation). ........................................................................ 75
Figure 3.5 Borehole pressure and flow rate during thermal stimulation (water flow, Specimen#1-third stimulation). ....................................................................... 76
Figure 3.6 Pressure decay test results for Granite #2 (the first stimulation). ................... 77
Figure 3.7 Pressure decay test results for Granite #1 (the third stimulation). .................. 78

xi
Figure 3.8 Comparison of bubble leakage before and after the first stimulation (Face 1, granite Specimen#2). ......................................................................... 80
Figure 3.9 Comparison of bubble leakage before and after the first stimulation (Face 2, granite Specimen#2). ......................................................................... 81
Figure 3.10 Comparison of bubble leakage before and after the first stimulation (Face 4, granite Specimen#2). ....................................................................... 81
Figure 3.11 Comparison of bubble leakage before and after the first stimulation (Face 4, granite Specimen #2). ...................................................................... 82
Figure 3.12 Locations for acoustic measurements. .......................................................... 84
Figure 3.13 Acoustic waveforms of granite Specimen#1 after the third stimulation (P-wave, from Face 1 to Face 3). .................................................................. 84
Figure 3.14 Acoustic waveforms of granite Specimen#1 after the third stimulation (P-wave, from Face 2 to Face 4). .................................................................. 85
Figure 3.15 Acoustic waveforms of granite Specimen#1 after the third stimulation (P-wave, from Face 5 to Face 6) ................................................................... 85
Figure 3.16 Acoustic waveforms of granite Specimen#1 after the third stimulation (S-wave, from Face 1 to Face 3). .................................................................. 86
Figure 3.17 Acoustic waveforms of granite Specimen#1 after the third stimulation (S-wave, from Face 2 to Face 4). .................................................................. 86
Figure 3.18 Acoustic waveforms of granite Specimen#1 after the third stimulation (S-wave, from Face 5 to Face 6). .................................................................. 87
Figure 3.19 P-wave velocities of granite Specimen#1 after the third stimulation (from Face 1 to Face 3). ................................................................................ 87
Figure 3.20 P-wave velocities of granite Specimen#1 after the third stimulation (from Face 2 to Face 4). ................................................................................ 88
Figure 3.21 P-wave velocities of granite Specimen#1 after the third stimulation (from Face 5 to Face 6). ................................................................................ 88
Figure 3.22 S-wave velocities of granite Specimen#1 after the third stimulation (from Face 1 to Face 3). ................................................................................ 89

xii
Figure 3.23 S-wave velocities of granite Specimen#1 after the third stimulation (from Face 2 to Face 4). ................................................................................ 89
Figure 3.24 S-wave velocities of granite Specimen#1 after the third stimulation (from Face 5 to Face 6). ................................................................................ 90
Figure 3.25 Thermal conductivity changed after thermal treatment. ............................... 91
Figure 3.26 Thermal properties measurement locations 1-3 on the top surface .............. 91
Figure 4.1 X-ray microtomography device (ZEISS Xradia 520 Versa Micro-CT) ......... 99
Figure 4.2 Hot Disc Thermal Property System (Model Number 2500S) ....................... 100
Figure 4.3 Thermocouples attached on core specimen with glue - the glue cured for 12 hours before starting to heat (Granite Core Specimen #1 and Specimen #2). ............................................................................................... 101
Figure 4.4 Temperature of granite core Specimen #1 during heating: total heating for about 20 hours before quenching. ........................................................... 102
Figure 4.5 Temperature changes of granite core Specimen #1 during quenching test. . 102
Figure 4.6 Temperature changes during the quenching test (granite core specimen #2). ................................................................................................................ 103
Figure 4.7 P-wave signature before and after quenching (Granite Core #1). ................ 106
Figure 4.8 S-wave signature before and after quenching (Granite Core #1). ................ 106
Figure 4.9 P-wave signature before and after quenching (Granite Core #2). ................ 107
Figure 4.10 S-wave signature before and after quenching (Granite Core #2). .............. 107
Figure 4.11 S-wave signature before and after quenching (Granite Core #3). .............. 108
Figure 4.12 P-wave signature before and after quenching (Granite Core #3). .............. 108
Figure 4.13 S-wave signature before and after quenching (Granite Core #4; just heating and cooling cycle without quenching). ................................... 109

xiii
Figure 4.14 P-wave signature before and after quenching (Granite Core #4; just heating and cooling cycle without quenching). ................................... 109

xiv
LIST OF TABLES
Page
Table 2-1 Typical properties for concrete (provide literatures and web sources for all values). ............................................................................................................. 11
Table 2-2 Properties of the air-cured mortar concrete block specimens used in the tests. ................................................................................................................. 12
Table 2-3 Pressure decay rate before and after thermal stimulation. ............................... 59
Table 3-1 Mechanical and thermal properties of granite at room temperature. ............... 69
Table 3-2 Mechanical and thermal properties of the granite specimens tested in Chapter 3 at room temperature. ....................................................................... 70
Table 3-3 Changes in permeability of granite block for a different phase. ...................... 78
Table 4-1 Mechanical and thermal properties of granite at room temperature ................ 95
Table 4-2 Mechanical and thermal properties of the granite core specimen tested. ........ 96
Table 4-3 Specimen temperature before quenching tests ............................................... 103
Table 4-4 S-wave velocity changes before and after treatment (Core #1 to #3) ............ 104
Table 4-5 P-wave velocity changes before and after treatment (Core #1 to #3) ............ 105
Table 4-6 Ultrasonic amplitude reduction by percentage. ............................................. 105
Table 4-7 Density change before and after treatment .................................................... 110
Table 4-8 Changes in thermal conductivities before and after the quenching tests ....... 112
Table 4-9 Changes in volumetric specific heat before and after the quenching tests .... 112

1
1. INTRODUCTION
1.1 Motivation and background
The extensive high-temperature resource that exists in the hot, dry rock is always
challenging to utilize economically and optimally due to the low permeability of the
wellbore face and reservoir in the enhanced geothermal system (EGS) (Duchane and
Brown, 2002, Fragaszy et al., 2011). Thermal fracturing is a concept that tries to maximize
the effect of the application of traditional hydraulic fracturing in the EGS. It relies on a
large thermal gradient that between the injection fluid and reservoir temperature to initiate
fractures in the rock under downhole conditions.
The rapid cooling will occur when the cold water is injected into the hot reservoir.
This process will make the rock surface to shrinkage and generate the local tensile stress.
Once this stress is sufficiently build up that exceeds the tensile strength of rock, the new
fractures will generate. These fractures could penetrate deeper inside the reservoir by the
following up borehole pressure. The thermal stimulation has been applied in many
enhanced geothermal system fields, such as in Los Humeros, Mexico; Hellisheidi high-
temperature field, Iceland. It has been proved that it is very efficient to improve the
permeability in the EGS reservoir by re-opening the existing fractures, opening new
fractures or cleaning the debris in the flow channel. However,” the thermal stimualtion
mechanism that occurred in the field and the preferred methodology for the thermal
stimulation application is still not well understood” (Siratovich, 2014).

2
1.2 Literature review
The thermal stimulation has been applied in many enhanced geothermal system
fields, such as in Los Humeros, Mexico; Hellisheidi high-temperature field, Iceland. It has
been proved that it is very efficient to improve the permeability in the EGS reservoir by
re-opening the existing fractures, opening new fractures or cleaning the debris in the flow
channel. However, the thermal stimualtion mechanism that occurred in the field and the
preferred methodology for the thermal stimulation application is still not well understood
(Siratovich, 2014). The literature review in this chapter will include the most important
aspects that related to the thermal stimulation. It will give the relevant knowledge to
understand the performance of the Enhanced Geothermal System better. “Although it is
known that thermal shock could initiate the fracture in the rocks, the mechanism that
responsible for the successful thermal stimulation is not well understood” (Siratovich et
al., 2015). “To date, there also has not been one preferred methodology for application of
thermal stimulations that account for the end of borehole conditions and surface
infrastructure, injection fluid availability, and well completion” (Siratovich et al., 2011).
Cryogenic fracturing is one of the waterless or reduced-water fracturing technologies
in hydrocarbon reservoirs. The method employs sharp thermal gradient surrounding
wellbore created from liquid nitrogen injected to or flowed through wellbore (Alqahtani
et al., 2017). Thermal shock on wellbore surfaces induces tensile fractures on the surfaces.
It is aimed to improve reservoir permeability by thermal shock and also alleviate the
concerns of formation damage, water consumption and environment impact that are

3
associated with the water-based fracturing in the unconventional resources. Wang et al.
(2016) reviewed the current key theories and features of waterless fracturing technologies.
Cha et al. (2014) experimentally investigated the cryogenic fracturing stimulation
by using liquid nitrogen to initiate and propagate fractures on unconfined rock specimens
by strong thermal gradient. The cryogenic fracturing conducted in their study were able to
create cracks in rock blocks and change the rock properties. The rock properties will also
affect the effect of the cryogenic stimulations. The visible fractures were generated in the
cement block by the repeated thermal shock. Those fractures were also detected and
demonstrated by the acoustic signal and CT scan. However, no visible fractures were
observed in the sandstone blocks after several cyclic of treatments. But the signature from
the acoustic measurements suggested that there were invisible fractures generated inside
the sandstone block by the thermal gradient.
Further experimental studies on cryogenic fracturing were performed under true
triaxial loading and an environment better mimic wellbores of oil and gas reservoirs (Cha
et al., 2016b). The cryogenic fracturing under triaxial loading revealed that the
permeability enhanced, breakdown pressure reduced, fracture direction and internal stress
field were altered due to cryogenic treatments (Alqatahni et al., 2016). A study using
transparent specimens allowed to observe radial and vertical (longitudinal) fractures
adjacent a wellbore (Cha et al., 2016a).
1.3 Objectives and scope of the thesis
The thesis aims to emulate the thermal stimulation of geothermal reservoir through
laboratory based investigations and have a better understanding of how the fracture initiate

4
and propagate. Studying the laboratory scale tests of permeability enhancement by
injecting the cold water into hot reservoir rock, we will provide a deeper understanding
thermal fracture mechanism in the enhanced geothermal system.
In Chapter 1, the previous studies, especially on the thermal fracturing mechanism
and case studies, of thermal fracturing in geothermal field are reviewed and summarized.
In Chapter 2, we present an experimental rig designed to resemble EGS thermal
stimulations in laboratory scale and show results gathered from laboratory concrete blocks.
No confining pressure is applied to specimens in this study. Acoustic signal, mechanical
properties and thermal properties are measured and analyzed before and after the treatment.
In Chapter 3, to have more understanding that how thermal stimulation in EGS
may occur, we designed and developed an integrated system to emulate thermal
stimulation under wellbore condition in laboratory scale. We present a laboratory study of
the role of thermal stress on fracture imitation and propagation. The acoustic amplitude
and acoustic velocity are profiled to describe the physical properties. Thermal conductivity,
expansion of thermal diffusivity are also measured before and after the thermal stimulation.
In Chapter 4, we applied thermal shock on granite core specimens by heating and
quenching them. Then we observed how micro and macro properties are altered by some
methods. We characterized mechanical and thermal properties before and after quenching
tests. The physical properties measured include elastic wave velocities, dynamic modulus,
thermal conductivities, the coefficient of thermal expansion, specific heat, and surface
texture.
In Chapter 5, the key findings and implication in this study are concluded.

5
2. WELLBORE THERMAL STIMULATION IN CONCRETE BLOCK SPECIMENS
2.1 Introduction
Thermally induced fractures during EGS well stimulation may help improve its
permeability in the reservoir. Thermal fractures or thermal effect have been indicated by
geophysical indicators in the field, and some numerical studies have been performed by
researchers (Pasikki et al., 2010, Siratovich et al., 2015, Enayatpour and Patzek, 2013,
Arshad et al., 2016), but the mechanism of thermal fractures in downhole conditions is
still not well understood. In particular, there is no controlled laboratory study in an
environment resembling EGS wellbore conditions (e.g., the cold water injected into the
hot reservoir wellbore).
In this chapter, we present an experimental rig designed to resemble EGS thermal
stimulations in laboratory scale and show results gathered from laboratory concrete blocks.
The apparatus allows specimens to be heated to up to 280 °C and then flow the cold water
under low flow pressure (< 20psi) through a borehole drilled in cubic specimens. Concrete
blocks are used for test specimens as common synthetic rocks. There is no confining
pressure applied to specimens in this study. Acoustic velocities and amplitudes are
profiled to assess cracks and damages created due to thermal flows. Thermal properties
such as thermal conductivity and specific heat are also measured before and after the
thermal stimulation. By flowing room-temperature water into the hot specimen, thermal
fractures or thermal damage and were induced. With increasing cycles of thermal
stimulations, we observed decreased acoustic velocities and changed the mechanical

6
properties of our specimens. The laboratory tests of thermal stimulation reasonably
resemble the field conditions provide deeper insight in to thermal fracturing mechanism.
2.2 Experimental studies
2.2.1 Experimental design and equipment
Unlike pressure-induced fracturing, e.g., hydraulic fracturing, to maximize thermal
gradient and thus thermal fracturing, water needs to keep flowing through a borehole by a
circulation path to the outside to quickly cool a borehole. The thermal shock is caused by
injecting and flowing room-temperature tap water under low borehole pressure into a
wellbore of a hot specimen that is placed in an oven. Fracturing by borehole thermal shock
uses local tensile stress resulting from sharp thermal gradient to initiate fractures. With
flowing water continuously through the borehole without pressurization, the borehole will
be cooled as quickly as possible to maximize the thermal gradient near wellbores. Injected
water become warmed and exit through an outlet.
A borehole with 1-inch diameter and 6-inch depth is drilled by using a diamond
embedded coring drill bit from the center of the top surface on each block. A 1" OD
stainless steel tube used as a borehole casing was inserted 2 inches into the borehole and
mounted to the borehole wall using epoxy to seal and resist fluid pressure and high
temperature. To achieve a flow-through path, we built a tube/fitting design that enables
effective flow through a coaxial inlet and outlet (Figure). Water enters the borehole
through the central smaller-diameter inlet tubing, which passes through a larger-size cross-
shaped fitting. Then warmed water exits through the annulus between the inlet tubing and

7
the casing, and then through the space in the cross fitting (Figure). Flow rate can be
controlled by an amount of opening of the inlet valve.
The integrated experimental apparatus for the test is shown in Figure 2.1. A
pressure transducer is attached to the wellhead to monitor the borehole pressure (Figure
2.1). In this thermal shock setup, the pressure inside the borehole may first increase due
to the evaporation of the water and then decrease to the pressure that is similar to the flow
pressure. Because the maximum borehole fluid pressure during the entire test including
pressure decay tests will not exceed 100 psi, it can be safely applied to unconfined
specimens. This experiment equipment employs transport, control, and measurement
systems rated for high temperature. We have set up continuous monitoring and logging of
parameters inside the borehole including pressure, water flow rate and consumption,
temperature. Thermocouples were located at the inlet, borehole air, borehole wall, outlet,
and specimen surfaces to monitor the dynamic evolution of temperatures.
Figure 2.1 The integrated experimental system for the lab test.

8
The monitoring of the stimulation tests is done manually and digitally by visual
gauges that provide the user with information on temperatures and pressures inside the
system while under operation. Digital data is collected by the Keithley data acquisition
device (main body - Keithley 7700; A/D board - Keithley 2701), which allows obtaining
data from thermocouples, pressure transducers and flow meter (Figure 2.1 - at the center).
For acoustic measurements, an OLYMPUS pulser, ultrasonic transducers, and a DSO-X
2004A digital oscilloscope are used (Figure 2.2). Figure 2.3 shows a schematic of the
experimental setup for through-transmission acoustic measurement. The typical waveform
that is captured in the acoustic tests is provided in Figure 2.3.
Figure 2.2 Equipment used for acoustic measurement - pulser, ultrasonic transducers, and the digital oscilloscope.

9
Figure 2.3 Typical input pulse and received signals from acoustic tests.
2.2.2 Specimens
Concrete blocks were also used for specimens as surrogates for rocks. A large
specimen size (8"×8"×8") was selected to create sufficient thermal gradient in the
specimen for an extended time. It is very important that all the specimens were prepared
in a similar way to allow meaningful comparison between tests. There may be a few
variable parameters to investigate and analyze for types of fracture mechanisms. Fresh
concrete with water to cement ratio of 0.55, and sand to cement ratio of 2.5 was poured
into an 8"×8"×8" mold and sealed in a plastic bag. After 24 hours, the seal and mold were
removed, and the concrete was cured either in the air or under water (ASTM, 2014a).

10
Portland cement (commercial grade Portland Cement Quikrete Type I/II) is used (the time
for drilling, setting time, and curing time are all recorded). A few specimens were prepared
with temperature sensors embedded into concrete.
Some index properties of intact specimens were obtained for test specimens.
Elastic constants were obtained from measurements of elastic wave velocities (ASTM,
2008a, Cha and Cho, 2007). Thermal conductivities and specific heat capacity were
obtained by using a hot-disc thermal analyzer (model). Splitting tensile strength and
unconfined uniaxial compressive strength were obtained using procedures from the ASTM
standards (ASTM, 2008b, ASTM, 2014b).
Several researchers (Powers, 1969, Lamond and Pielert, 2006, Bazant and Kaplan,
1996) have worked on the properties of concrete. According to their results, typical
properties of normal strength Portland cement concrete are listed in Table 2-1.

11
Table 2-1 Typical properties for concrete (provide literatures and web sources for all values).
Properties*
Density (kg/m³) 2240-2400
Unconfined compressive strength (MPa) 20-40
Tensile strength (MPa) 2-5
Dynamic Young’s Modulus (GPa) 14-41
Dynamic constraint Modulus (GPa) 30-70
Dynamic shear Modulus (GPa) 10-25
Poisson’s ratio 0.1-0.2
P-wave velocity (Km/s) 4-6
S-wave velocity (Km/s) 2-3
Thermal conductivity (W/m·K) 1.5-2.6
Volumetric specific heat (MJ/(m³K) 1.4-1.7
Thermal diffusivity (mm2/s) 1.0-1.3
Coefficient of thermal expansion (/K) 0.4-0.7×10⁻⁵
* Typical underwater cured concrete (gravel + sand + cement +water)
According to our measurements, the properties of the specimens used in the tests are
tabulated in Table 2-2.

12
Table 2-2 Properties of the air-cured mortar concrete block specimens used in the tests.
Properties* Density (kg/m³) 2223
Dynamic constraint modulus (GPa)
40
Dynamic shear Modulus (GPa) 14 P-wave velocity (m/s) 4.0-4.2 S-wave velocity (m/s) 2.5-2.7
Thermal conductivity (W/m·K) 1.7-1.9 Volumetric specific heat
(MJ/(m³K) 1.65
Thermal diffusivity (mm2/s) 1.1 Coefficient of linear thermal
expansion (K-1) 0.55×10⁻⁵
* Air-cured mortar concrete (Sand + cement + water)
2.2.3 Fracture characterizations
Pressure decay test
The pressure decay test is performed to evaluate the permeability of concrete
specimens. We perform a pre-stimulation pressure decay test on all specimens at their
intact conditions before heating and stimulations. Then, pressure decay tests are performed
after heating, after water flow, during cooling, and after completing a test. For the
specimens that have the continuing heating period, we also have the intermediate pressure
decay test to observe the fractures closed up phenomenon during the reheating process.
Tests provide the rate of pressure decay, indicating the changes in effective air
permeability of the specimen in the vicinity of boreholes. Pressure decay tests were
performed by pressuring the borehole to 40 psi, shutting in the wellbore, and allowing the
pressure to draw down gradually.

13
Acoustic measurement
Acoustic measurements provide the velocities and waveforms of compressional
and shear waves of solid materials. By comparing these signatures before and after
performing the thermal stimulation, the existence of fractures within the rock specimen
medium can be qualitatively estimated. Additionally, with known rock density, the
dynamic elastic modulus and Poisson’s ratio can be calculated from these two velocities.
Bubble leakage tests
We found that induced bubble leakage tests can be utilized to show that permeation
path or cracks created due to the thermal stimulation. To do this, the borehole is
pressurized to about 40 psi by air. A liquid detergent mixed with water that is used to
detect leaks in pressurized pipeline or tank is used for the bubble tests can detect minute
leakage on specimen surfaces. Before the leakage tests, the bubbling agent is applied all
over the surfaces. Minute cracks created during the thermal stimulation are located by the
generation of bubbles in those spots of the outer surfaces. The tests are performed before
and after stimulations to compare.
2.2.4 Procedures
Procedures followed for the experiments of wellbore thermal stimulation in
concrete specimens are detailed below.
① Before specimen heating
• Before putting the specimen in the oven
1) Pressure decay test with the short rig

14
2) Leak detection test (at 40 psi constant borehole pressure) with the short
rig
• After putting the specimen in the oven and fully assembling the rig
1) Pressure decay test
② During specimen heating
• Data logging: Temperature (slow logging)
• Observe epoxy damage/contacts
• Pressure decay test right before treatment
• For granite block sample, should heat at least for 20 hrs.
③ During treatment (flow of water through a borehole)
• Flow rate (2-3 options: e.g. 1, 2, 3 GPM)
• Flow duration (2-3 options: e.g., 20, 40, 60 minutes)
• Target temperatures (Two options: 200 °C and 280 °C (max))
• Data logging: Temperature, flow rate and borehole pressure (intermediate)
• Observe processes and take photos
④ After treatment
• Pressure decay test right after treatment
• Two intermediate pressure decay tests
• Data logging: Temperature (slow logging)
• Continue heating for 6-10 hours
• Pressure decay test right before cooling
⑤ Cooling (two options: closed oven door / open oven door)

15
• Data logging: Temperature (slowest logging)
• One pressure decay test when the specimens are cooled a bit, but still warm
(maybe after 3-5 hrs).
• Cool down sample to ambient temperature (75 °F or 24 °C). Then do pressure
decay test
• Take out the specimen, and then perform:
1) Pressure decay test with the short rig
2) Leak detection test (again at 40 psi borehole pressure) with the short
rig.
We started from preliminary tests to understand system and specimen behaviors.
Then as we gather more understanding, we added more measurement and procedures to
better capture the stimulation behavior. Thus, some experiments have more or fewer data
due to different test conditions. The details for specimens in which experimental
procedures deviated from the procedures stated above are described as follows:
Specimen 13: This specimen was subjected to heating and cooling, without water
injection. We ran this test in an attempt to determine a baseline to compare with
the subsequent tests to see the how the temperature changes might influence the
specimen, such as the creation of the micro-fractures, changes in the physical
properties with the temperature change etc.
Specimen 3: Test procedures were simpler as the first specimen to test. Includes
measurements of the borehole temperatures (hanging in the borehole and attached
to the borehole surface) and temperature on specimen surface (right surface), and
16
borehole pressure measurement; acoustic measurement before and after the
thermal stimulation.
Specimen 12: In addition to the procedures in #3, a thermocouple is added to the
outlet tubing; also added the pressure decay test before and after thermal
stimulation; increased the cycles of injection. The procedures that are different
from the #3 are described as follow:
1. When the borehole temperature arrives 200°C, the test started.
2. First, open the inlet and outlet valve at the same time; let the water flow for
seven minutes (recording the temperature, pressure change and water loss).
3. After seven minutes, remove injection hose and close the inlet and outlet
valve (the pressure inside the borehole will increase and use the outlet valve
to adjust to 75-80 psi. Then start the pressure decay test).
4. After the pressure decay test, wait for the thermal recovery until the
borehole temperature back to 200°C.
5. Then repeat from the first step, repeat for two times
Specimen 14: in additional to the procedures and equipment in #12, a
thermocouple is added to the oven to measure the exact oven temperature; a flow
meter was added to measure the flow rate that was injected into the borehole; the
cooling period temperature after the thermal stimulation was recorded.
Specimen 15: in additional to the procedures in #14, a thermocouple is added on
the right and left surfaces to measure the outside surface temperature of the

17
specimen; the pressure decay test was performed after the specimen cooled to the
room temperature.
Beginning from the Specimen 16, the test procedure of the unconfined air-cured
specimens were more consistent. Thus the #18, #19, #20 were followed the procedures
that same with the “standard” procedure described above.
2.3 Results
This section presents the data that gathered from the thermal stimulation tests for
air cured, water cured, and concrete blocks embedded with temperature sensors. Data
include temperature, pressure, flow rate, an acoustic signal and experimental photos that
show the feature and characteristic of the fracture on the specimens. Because this type of
experiment in enhanced geothermal system was first performed in the lab, it has been
developing until appropriate procedures are identified. These procedures are trying to
replicate the situations that are performed in the field. In this section, we discuss and
analysis the data that gather from those specimens
2.3.1 System behavior – temperature / pressure / flow
Monitoring of some environmental parameters such as borehole pressure,
temperatures at various spots, and water flow allows understanding the behavior of the
laboratory setup. We present the representative data and cases to discuss.
Temperature
As shown in Figure 2.4, the specimen was heated for 16 hours before subjected to
water flow. Pressure decay tests were performed before the heating and at the end of
heating period to observe how the heating process affects the permeability of the specimen.

18
Two thermocouples were placed on the left and right faces of the specimen. The
thermocouple on the right face was placed in the center, and the thermocouple on the left
face was placed in the upper corner. The reason for different locations of the sensors on
the two faces is that we want to investigate the temperature propagation in specimen
surfaces during the heating. Figure 2.4 also indicates that the surface has a faster
temperature increase rate than the borehole temperature.
Figure 2.4 Temperatures in borehole and outer faces during heating (Test #15; Specimen #7).
Upon water injection, the borehole temperature decreased rapidly. The flow of tap
water through the borehole started at t=52 sec, and borehole temperature dropped from
188 ºC to 27 ºC rapidly (Figure 2.5). The temperature of the water that came out of the
outlet suddenly increased from 20 ºC to 78 ºC, and then decrease gradually to the

19
temperatures similar to those in borehole, which become stable at 25 ºC. Throughout the
thermal treatment by the water flow, the difference of temperatures between the borehole
wall and the block faces is observed to be large up to 160 ºC (Figure 2.5). This rapid heat
transfer created a drastic thermal shock to the borehole surface and made it contract. This
shrinkage subjects the surface of the borehole to a tensile stress. If the thermal gradient
between the cooled borehole surface and adjacent hot part of the concrete is large enough,
the specimen will fail in tension. Water injection stopped at t=12.7 mins. Once the water
flow into the borehole is stopped, the temperature began to increase quite fast. A pressure
decay test was performed soon after the water injection to measure the permeability of the
specimen.
Figure 2.5 Borehole temperature change during water injection (Test #15; Specimen #7).

20
Figure 2.6 Temperatures in borehole and outer faces during water injection (Test #15; Specimen #7).
Figure 2.7 Temperatures in borehole and outer faces during cooling period (Test #15; Specimen #7).

21
We observed the small temperature difference between borehole space and the
borehole wall Figure 2.5. When cold fluid contacts a hot solid surface with a large
temperature difference, immediate vaporization created at the contact delays thermal
conduction at the contact. This phenomenon is called Leidenfrost effect or film boiling
effect. In our tests where room-temperature water contacts with much hotter rock surfaces,
there is only minor Leidenfrost effect compared to liquid nitrogen contact on room-
temperature wellbore surface as observed (Cha et al., 2014). Delays in temperature
conduction due to such film boiling effects are unfavorable for thermal shock fracturing.
Flow and borehole pressure
Tap water is flown from water faucet to the borehole. The pressure in the borehole
is mainly created from the pressure in the flow of water. From the pressure profile (Figure
2.8), we see a spike when water initially enters the borehole. This probably is caused by
the rapid evaporation of water in the borehole. As the wellbore become cooler, the pressure
in the borehole became steady and is mostly caused by the water flow pressure (Figure 2.8
& 2.9). The faucet opening was reduced after at three minutes after starting flow water.
The pressure had the same trend with the flow rate. This indicates that the pressure in the
borehole is mostly caused by the fluid flow pressure. The low fluid pressures (about six
psi) in the borehole have little effect in initiating and propagating fractures.
The amount of faucet opening is kept the same, and the flow rate remained fairly
constant through the thermal stimulation. The water was collected at the outlet after it
flows through the borehole. The flow rates measured by the meter was compared with the
flow rates calculated from the collected water and flow time, and they are in reasonable

22
agreement. The small difference is probably due to turbulent flows created in the flow
lines, which affect measurements by a flow meter. For example, in Figure 2.8, the flow
rate recorded by the flow meter in the Test 15 was around 0.78 GPM. The water volume
that flew through the borehole was around 8 Gallons and flow time is about ten mins. Thus,
the calculated flow rate was around 0.8 GPM, which was similar to the flow rate by the
flow meter.
Figure 2.8 Borehole pressure and flow rate during thermal stimulation (Test #15; Concrete #7).
23
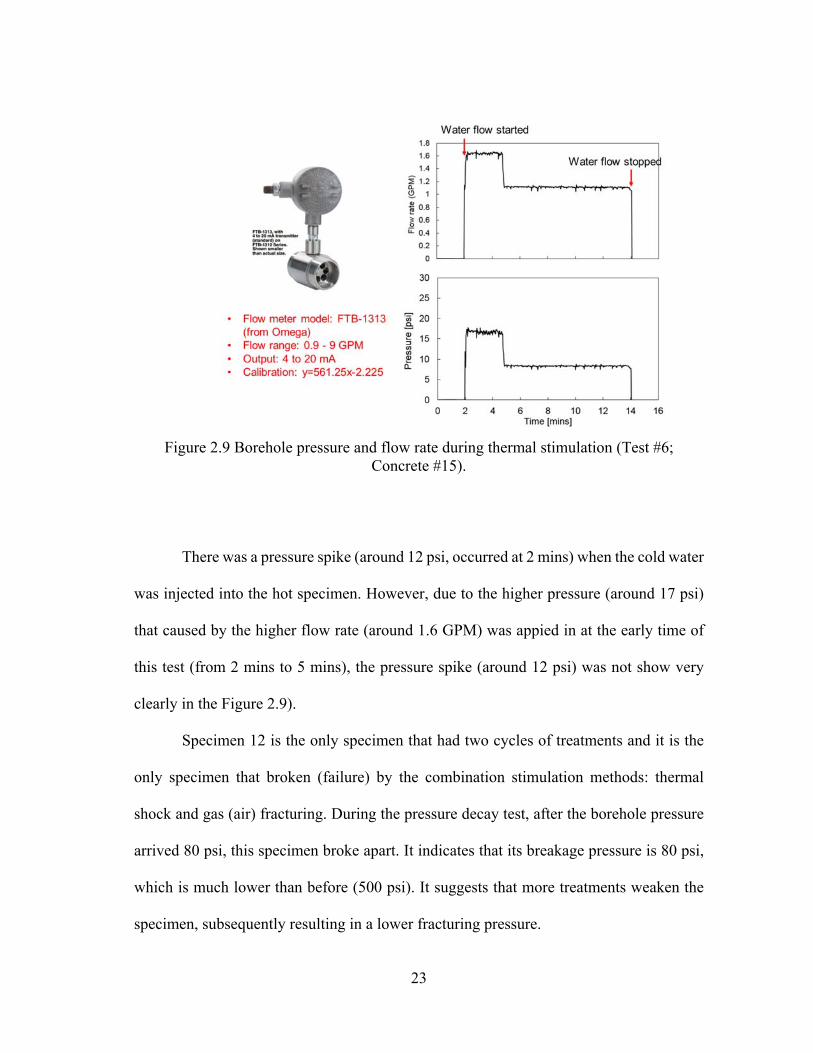
Figure 2.9 Borehole pressure and flow rate during thermal stimulation (Test #6; Concrete #15).
There was a pressure spike (around 12 psi, occurred at 2 mins) when the cold water
was injected into the hot specimen. However, due to the higher pressure (around 17 psi)
that caused by the higher flow rate (around 1.6 GPM) was appied in at the early time of
this test (from 2 mins to 5 mins), the pressure spike (around 12 psi) was not show very
clearly in the Figure 2.9).
Specimen 12 is the only specimen that had two cycles of treatments and it is the
only specimen that broken (failure) by the combination stimulation methods: thermal
shock and gas (air) fracturing. During the pressure decay test, after the borehole pressure
arrived 80 psi, this specimen broke apart. It indicates that its breakage pressure is 80 psi,
which is much lower than before (500 psi). It suggests that more treatments weaken the
specimen, subsequently resulting in a lower fracturing pressure.

24
Thermal shock can explain this increase of the likelihood that of failure with more
treatments. As the borehole surface rapidly cools, the thermal expansion coefficient of the
specimen dictates how much the surface of the borehole will shrink. This shrinkage
subjects the surface of the specimen to a tensile stress. It can be determined from test 3
(Concrete Specimen #12) there is clear indication that the thermal fracturing treatment
increased the permeability of the specimen as the pressure decay test took significantly
less time than that before the first treatment. Furthermore, an increase in the number of
thermal fracturing treatments increases the likelihood that the specimen would fail due to
small fractures that have formed during previous treatment, which added up, significantly
weakened the specimens. The fracture profile of test 3 captured front of thermal fracture
of the first water flow, which strongly proves it. Increasing the cycles of thermal fracturing
treatment and waiting for the thermal recovery between each injection are also suggested
by the industrial geothermal field and be proved an efficient method to open up new
fractures or widen the existing fractures in the reservoir.
During the thermal stimulation, there was always leakage water that covered the
top surface of the sample. Two reasons are causing the water leakage. The first is cracks
that are resulting from the thermal stress grow beyond the epoxy coat. So the water flows
out from these cracks and then accumulate on the top surface. In other situation, where the
epoxy have been weakening or even broken by thermal stress, the cracks occurred on
epoxy coat during water flow and caused by the borehole pressure and fluid pressure.
Under this situation, air leaking was audibly heard and physically felt through the concrete
around epoxy near the borehole during pressure decay test. To prevent water leakage and

25
to keep epoxy in excellent condition after the thermal stimulation, it suggests that the
epoxy coat should be at least one-inch length and quarter inch thickness.
2.3.2 Fracture Characterizations
Visual observations of fractures
After thermal stimulation, often there are visible fractures on the outside surface
of the concrete blocks. Usually, these fractures are initiated from the borehole and then
propagate from inside of the concrete to the outside surface (shown in Figure 2.10). It is
noticed that the fracture that occurred on the surface, especially on the top surface, are
tortuous, not like the linear fracture. This fracture tortuosity reflects the curvature of how
the fracture grows near the borehole and reflects the fracture complexity.
Figure 2.10 Face numbering convention for the block specimens.

26
Figure 2.11 Fracture observations of Specimen #14.
Pressure decay test
Pressure decay tests are performed to evaluate changes in the permeability of the
concrete specimens. We performed a pre-stimulation pressure decay test on all specimens
at their intact condition. We also performed a post-stimulation pressure decay test after
treatments. For specimens that underwent continued heating period after treatment, we
also had one or more intermediate pressure decay tests to observe that the fractures close
during the reheating in the wellbore. These tests provide the rate of pressure decay,
indicating the changes in effective air permeability of the specimen in the vicinity of the

27
borehole. Pressure decay tests were performed by pressurizing a borehole to 40 psi,
shutting in the wellbore, and allowing the pressure to draw down.
Thermal shock can increase the propagation of fractures with increasing cycles of
treatments. There is a clear indication which can be determined from test 3 (Concrete
Specimen #12) that the thermal fracturing treatment increased the permeability of the
specimen as the pressure decay took significantly less time than that before the first
treatment (Figure 2.13). When increasing the cycles of treatment, it will further enhance
the permeability of specimen and lower the breakthrough pressure. After the borehole was
performed the first treatment, some micro fractures and macro fractures caused by thermal
stress initiated on the borehole wall. After waiting for thermal recovery for several hours,
the temperature of the specimen reached the high temperature again. Performing the
second treatment at this moment will propagate the existing fractures and thus further
enhance the permeability.
The fractures caused by the thermal shock increase the permeability of specimen.
This is because the fractures will increase the air flow path when doing the pressure decay
tests. The permeabilities are particularly enhanced right after the treatment when the
borehole is significantly colder than outer surfaces of the block, which is still hot.
However, when a specimen is continued to be heated after stopping water injection,
the permeability of the specimen decreased again (Figure 2.14). This is because as the
wellbore temperature increases, the thermal gradient decreases, making the fractures close
again and thus permeability decreases.

28
When the temperature cools to room temperature, it is found that permeability
increase a bit compared to the permeability of the specimen at the continued heating (hot
borehole). However, this situation tends only to apply when the fractures are a vertical
direction. When the fractures are horizontal directions, the ambient temperature
permeability will decrease due to by the gravity made the transverse cracks sealed when
thermal gradient disappeared after temperature back to ambient temperature.
Figure 2.12 Pressure decay test right after the thermal stimulation and continued heating of Specimen 16.

29
Bubble leakage tests
Bubble leakage tests before and after stimulations show that some indications of
cracks and permeation paths created due to the thermal stimulation. The borehole is
pressurized to about 40 psi by air. The liquid bubble agent used for the bubble tests is
sensitive to tiny leaks of gasses and generate bubbles on the leak spots. Leak holes
generated near epoxy coat and the wellhead that was created during the thermal
stimulation were identified by the massive bubble generation (Figure).
From the Figure 2.17 to Figure 2.21, we could see that massive bubbles generated
after thermal simulations, whereas there was no bubble generation before the thermal
stimulation. After removing these bubbles, there were visible fractures on the borehole
surface. This not only indicates that the thermal stress that caused by cold water injected
into hot specimen is strong enough to create the cracks but also proved that these fractures
were initiated from the borehole wall and then propagate to outside surface.
In the most situation, where the leakage water is not much, the fractures will be
vertical and occur on the face one and three of the specimen. During treatment, the
specimen was treated without the confining pressure. Considering of the gravity, the
minimum principal stress direction inside the specimen should be horizontal. When the
specimen is stimulated with thermal stress, the fracture will initiate and propagate
perpendicular to the minimum principal stress. So the vertical direction fracture occurred
at our most specimen. The reason that the fractures always occurred on the front and back
surface is that the front surface is near the oven door, and its temperature will be easily
influenced by the cooling air flow when open the oven door during the heating and testing

30
to take experimental pictures. Thus the front surface will be weakened by this reason. So
it will be easily broken by thermal stress.
We observed that there are several localized permeation spots (or “leaking holes”)
as shown in Figure 2.15. In Figure 2.16, the bubble leakage test also showed that
permeation through the stone was not homogeneous, and there were invisible pathways
(cracks, holes, or more permeable regions) that allowed preferential permeation of
air/fluid.
Figure 2.13 Observation of several localized permeation spots/cracks.
Figure 2.14 Comparison of the localized permeation crack and massive bubble generation from bubble leakage test (Specimen #7).

31
Figure 2.15 Comparison of bubble leakage tests before and after thermal stimulation (Face 1, Specimen #7).
Figure 2.16 Comparison of bubble leakage tests before and after thermal stimulation (Face 2, Specimen #7).

32
Figure 2.17 Comparison of bubble leakage tests before and after thermal stimulation (Face 3, Specimen #7).
Figure 2.18 Comparison of bubble leakage tests before and after thermal stimulation (Face 4, Specimen #7).
33
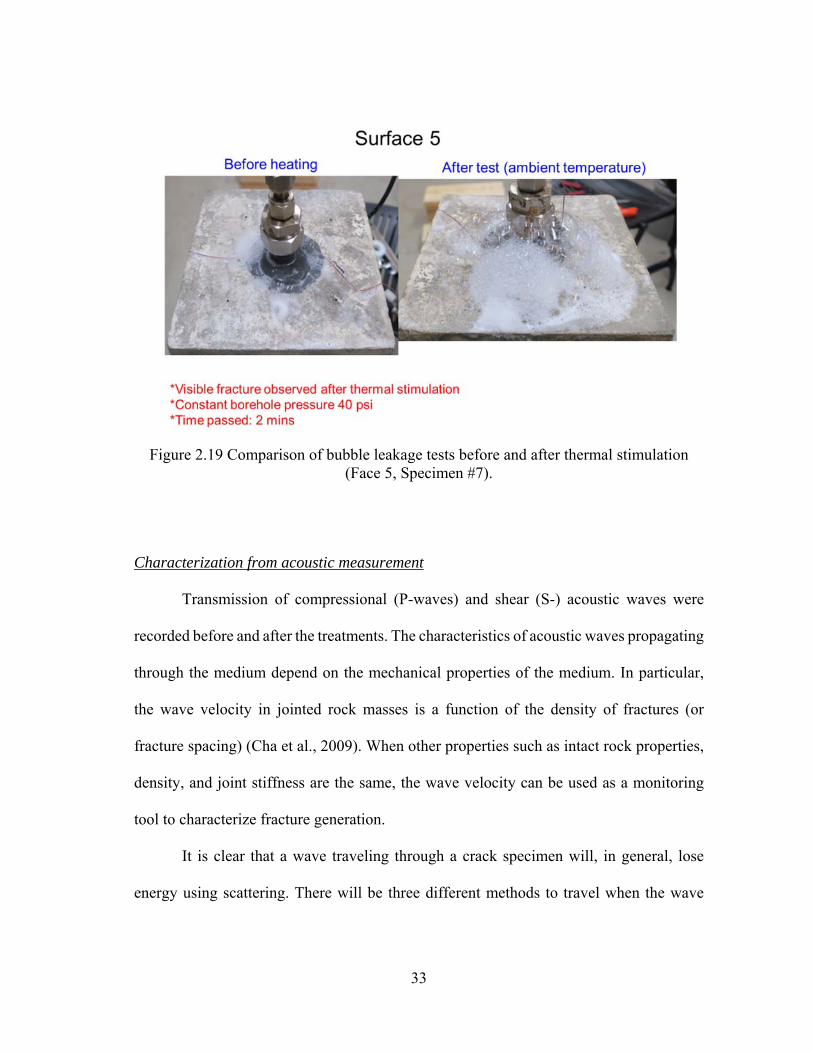
Figure 2.19 Comparison of bubble leakage tests before and after thermal stimulation (Face 5, Specimen #7).
Characterization from acoustic measurement
Transmission of compressional (P-waves) and shear (S-) acoustic waves were
recorded before and after the treatments. The characteristics of acoustic waves propagating
through the medium depend on the mechanical properties of the medium. In particular,
the wave velocity in jointed rock masses is a function of the density of fractures (or
fracture spacing) (Cha et al., 2009). When other properties such as intact rock properties,
density, and joint stiffness are the same, the wave velocity can be used as a monitoring
tool to characterize fracture generation.
It is clear that a wave traveling through a crack specimen will, in general, lose
energy using scattering. There will be three different methods to travel when the wave

34
goes through the interface between fracture and specimen: reflection, refraction, and
transmission. The first two approaches will scatter the direction of the wave out of the
principal direction and cause wave energy loss. Thus the wave attenuation occurs.
Distributed macro/micro cracks often give rise to an increase in attenuation. So the precise
knowledge of the attenuation of ultrasonic waves in cracked media provides a direct
approach for quantifying the material damage. Moreover, the study of elastic wave
scattering from cracks is important for various areas of engineering and geophysics, in
particular in ultrasonic nondestructive evaluation and materials characterization.
Distributed microcracks induced by the thermal stress will increase the length that
wave will travel, thus increase the traveling time, decrease the wave velocity. Changes in
the material response due to the reduction of effective elastic stiffness resulting from
microcrack damage have a significant influence on the physical properties of the materials.
Figure 2.20 Waves measured along Face 1 & 3, 2 & 4, and 5 & 6. (a) Face numbering convention. (b) Locations for acoustic measurement on a face of a specimen.

35
Figure 2.21 Acoustic measurements of Specimen #14 (S-wave, from Face 1 to Face 3).
Figure 2.22 Acoustic measurements of Specimen #14 (S-wave, from Face 2 to Face 4).

36
Figure 2.23 Acoustic measurements of Specimen #14 (S-wave, from Face 5 to Face 6).
Figure 2.24 P-wave velocity calculation of Specimen #18 (from Face 1 to Face 3).

37
Figure 2.25 P-wave velocity calculation of Specimen #18 (from Face 2 to Face 4).
Figure 2.26 P-wave velocity calculation of Specimen #18 (from Face 5 to Face 6).

38
Figure 2.27 S-wave velocity calculation of Specimen #18 (from Face 1 to Face 3).
Figure 2.28 S-wave velocity calculation of Specimen #18 (from Face 2 to Face 4).

39
Figure 2.29 S-wave velocity calculation of Specimen #18 (from Face 5 to Face 6).
Short-cut fractures near the borehole and fracture tortuosity
Combining the fracture observations in the concrete #12 and concrete #14, we
noticed that the fractures would usually initiated from the borehole wall surface near the
casing and then propagated onto the top surface. This is likedy caused by the fact that the
high-viscosity epoxy as a sealant is not thoroughly applied to fill the gap (about 0.04 inch)
between the casing and the borehole, which causes migration of water closer to the top
surface leaving shorter distance for crack propagation to the top surface. The different
thermal conductivities between the stainless steel casing, epoxy, and concrete may also
contribute.

40
Figure 2.30 “Short-cut” fractures initiate from the borehole and propagate to the top surface (Specimen 14).
The fracture observations also indicate that these fractures on the top surface
usually are not straight. They usually are tortuous and even interconnecting with each
other. Thus it forms a complex fracture network on the top surface. This fracture tortuosity
will influence the movement of fluids through the fractures with low permeability. “Most
of the mathematical modeling of flow through a fractured medium assumes that each
fracture is smooth, parallel plates that separated by a uniform distance” (Wang et al., 1982).
However, “the fracture tortuosity may affect the fluid flow in the fracture and decrease the

41
connectivity of fluid flow paths, which can further influence the permeability of reservoir”
(Tsang, 1984).
Figure 2.31 Fracture tortuosity on top surface of specimen #18
Water leakage and bubbles during stimulation
There were three areas on the top surface where water leaked and bubbled under
hot surface temperature during the thermal stimulation. After the test, those three areas
were identified where fractures initiated and propagated. During the pressure decay test
right after the thermal stimulation, there were many bubbles out of the top surface.
However, no bubble was generated on the front face that also had the visible fracture).
This behavior proves that the fracture on top surface was initiated from the borehole, and

42
the fracture on front surface was initiated from outside surface and then propagated into
the concrete. However, the fracture initiated on the front face did not connect to the
borehole surface.
Figure 2.32 Water bubble indications during pressure decay tests (Specimen #18).

43
Figure 2.33 Water bubble indications during thermal stimulation (water flow) (Specimen #18).
Fracture pattern (vertical and transverse directions)
As shown in Figure 2.35, different from the early specimens (#3,#2,#12,#14),
concrete block #15 had transverse direction fracture which showed on the front surface
after the treatment. At the meantime, it had the most water leakage during the water flow.
The leakage water almost covered the upper half part of the concrete. Moreover, the
transverse cracks exactly occurred at the boundary between the leakage water covered part
and dry concrete part. Combined with the results of a later test of specimen #18, it indicates
that the direction and pattern of cracks on the concrete surface were affected by the amount
of water leakage.

44
Figure 2.34 Fracture direction comparisons between Specimen #15 (left side in the figure) & #18 (right side in the figure).
The cracks on the outside surface of concrete became wider as the temperature of
concrete declined over the cooling period. The concrete surface contracts when its
temperature decreases. This shrinkage subjects the surface of the specimen to a tensile
stress, which makes the existing fractures on the outside surface wider. As shown in Figure
2.36, this behavior is observed during the cooling (with oven door open) after the thermal
stimulation.

45
Figure 2.35 Fractures propagated and widened during the cooling period (Specimen 14) (oven door kept open during cooling).
Area of thermally induced fracture
By comparing the acoustic signals before and after the thermal stimulation, we
attempted to roughly estimate the extent of major fractures caused by thermal stress inside
the block. Figure 2.37 shows the fracture front that is estimated by interruption of
ultrasonic signals. We also poured the phenolphthalein into the borehole of the treated
specimen in order to image internal fractures. When the solutin is fully dried in a few days,
we performed the breakdown test. As shown in Figure 2.38, major fractures that are
induced by the thermal stimulation are clearly indicated by the area with pink color caused
by the exposed surface reacting with phenolphthalein. The thermal fracture front indicates
how far the fractures have been propagated. Thus, the speculation about thermal front from
the acoustic signal is verified. As shown in Figure 2.39, the analysis about the fracture
front that we estimated from the signal (Figure 2. 36) is correct.
Right after water injection
Cooling for 5mins
Cooling for 15mins

46
Figure 2.36 Acoustic signals with assumption of thermal front.
Figure 2.37 Front of fracture was estimated by ultrasonic wave signals (Specimen #18).

47
Figure 2.38 Breakdown test results with showing the thermal fracture front (Specimen #18).
Figure 2.39 Thermal fracture comparision between acoustic analysis and breakdown test (Specimen #18).

48
Figure 2.40 Breakdown test results with showing the thermal front (Specimen #12).
Comparing the fractures observation of breakdown test between the Specimen #12
and #18, we could find that the fractures seem always travel from the front surface to back
surface (surface one to surface three). This phenomenon may cause by that the front
surface is near the oven door, and its temperature will be easily influenced by the cooling
air flow when open the oven door during the heating and testing to take experimental
pictures. Thus the front surface will be weakened by this reason. So it will be easily broken
by thermal stress.

49
2.3.3 Temperature propagation - Embedded sensors
The thermal stress inside the concrete specimen is caused by thermal gradient. On
next step, we want to observe the temperature propagation and thermal gradient inside a
specimen during the water flow. We embedded the thermocouples inside the concrete
specimen to investigate the temperature propagation inside the specimen. The locations of
six thermocouples embedded are shown as number one to six in Figure 2.41. In addition
to these, there are four thermocouples placed on the right and left the surface of the
specimen, attached to the borehole surface and hanging in the borehole.
Figure 2.41 Locations of embedded thermocouples at the mid height of the specimen (Plan view).
The Figure 2.42 shows how the temperature propagated from borehole into the
specimen. At t = 2 mins, the room-temperature tap water began to flow into the borehole.
The temperature of borehole dropped rapidly from 190 °C to 25ºC in about 3 seconds. The

50
borehole temperature dropped along with first borehole pressure spike (around 30 psi in
Figure 2.43) that caused by the rapid evaporation of water when it contacted with the hot
borehole surface. After about one minute, the temperature of location 3 and 4 began to
drop and also corresponded with the second borehole pressure spike, which was around
65 psi and much higher than the first spike. The fracture occurred, and water evaporation
may cause the second spike. When thermal stress is greater than the then tensile strength
of the material itself, the fracture will occur. The concrete is described as the thermo-
elastic material. It means that the elastic energy inside the concrete will be released when
the fracture occurs. This amount of energy will induce the shock wave and propagate along
the fractures and tubing, and then captures by the pressure meter. Also, when the new
fracture occurs, the cold water will continually contact with the deeper area of the
specimen which is still very hot. It will cause the water evaporate again. This may be
another reason that the second spike is greater than the first.
Similarly, the third pressure increase during the water flow corresponded with a
temperature drop at position 2 & 5 and fourth pressure increase corresponded with a
temperature drop at position 1 & 6. This phenomenon indicates when and where the
fracture occurred inside the specimen and also showed temperature propagation.

51
Figure 2.42 Temperature behavior of embedded Specimen #2 during heating period.
Figure 2.43 Temperatures and borehole pressure of the embedded thermocouples during water flow (embedded thermocouple Specimen #2)

52
Figure 2.44 Borehole pressure and flow rate of the embedded thermocouples Specimen #2 during water flow.
The thermal gradient results in Figure 2.45 show the thermal gradient at varying
locations inside the specimen over time. It indicates that when cold water is flowing into
the hot borehole, the thermal gradient initiated from the borehole wall and then propagates
to the outside surface. As the flow time went on, the magnitude of thermal gradient inside
the specimen decreased, and thermal gradient away from the borehole increased.

53
Figure 2.45 Sensor numbering for thermal gradient calculation.
Figure 2.46 Thermal gradient change along with time of each locations

54
Figure 2.47 Thermal gradients calculated from temperature measured by embedded sensors.
The rock tensile stress and the minimum horizontal stress have a predominant
influence on the fracture initiation pressure. There is no confining pressure for our test
specimens, the rock tensile strength which can be of the order of 5-10 MPa, will be the
main stress to overcome during the thermal fracturing process. In order to elucidate the
natural of thermal fracturing, it is necessary to determine how changes in reservoir
temperature affect the state of stress of the rock. When the reservoir is cooled, the rock
tends to contract and a decrease in original stress of rock occurs. The tangential component
of thermal stresses on a planar surface subject to temperature changes is given as (Tarasovs
and Ghassemi (2014)):

55
(z) 1
th
T
E is static Young’s modulus (MPa), α is linear thermal expansion coefficient (ºC-1), T
is the temperature change (ºC), is the Poisson’s ratio. The properties of our specimen
are: 340 10E MPa , 50.55 10 , 0.15 . When the room temperature water is
flow through the hot borehole, the thermal stress that applied on the borehole wall is:
3 5 140 10 0.55 10 160 /1 0.15 41.41boreholewall MPa C C MPa
Whereas the tensile strength of concrete is around 2-5 MPa . The thermal stress that caused
by the room water injection is much higher that the tensile strength of concrete. So the
borehole wall cracked and these fractures continued to propagated into the specimen as
the water continuously flow through the borehole. As the cracks continuously propagated
into specimen, the thermal stress of location 3&4, 2&5, 1&6 were calculated as followed.
3 5 13&4 40 10 0.55 10 80 /1 0.15 20.70MPa C C Pa
3 5 12&5 40 10 0.55 10 35 /1 0.15 9.05MPa C C MPa
3 5 11&6 40 10 0.55 10 40 /1 0.15 10.35MPa C C MPa
From the above calculation, we could know that once a fracture has been created, it
can be propagated with a lower injection pressure.
Our calculation shows that there is a strong possibility of fractures developing when
the room temperature water flow through the hot specimen. Furthermore, once the fracture
is initiated, cooling in its immediate vicinity is promoted by lower propagation pressure
and a large leakoff area, thus encourage further fracture growth.

56
2.4 Analyses and discussions
When heating the specimens from the room temperature to the 190 (the target
temperature), the specimens (#14, #15, #18, #19 and #20) took almost the same time to
arrive the target temperature 190 (for both of borehole surface and out surface of
concrete). The heating rate details are described in Figure 2.48 and 2.49. The total heating
time and heating rate are similar, which may indicate that the specimens before the
stimulations were homogeneous and intact.
After the thermal stimulations, although the cooling time and cooling rate may
seem similar, there are some slight differences. Figure 2.4 and 2.49 showed that total
cooling time and cooling rate when specimen were cooled from 105 to 40 . Note that
all the cooling conditions were the same (i.e., oven was turned off, and oven door was
open). From these two figures, we noticed that the #14 and #18 cooling time are obviously
shorter than other three specimens are. Especially for the borehole cooling time, the
specimen #14 and #18 are 30% shorter than other specimens. While the outside surface
cooling time of all the five specimens are almost the same. This may be caused by the
more open fractures caused by the stimulation during the water flow. Because more open
fractures exist in the specimen #14 and #18, there will be more air circulating during the
cooling period, which caused the borehole temperature decreased faster compared with
other three specimens that have more closed fractures. This phenomenon was also verified
by the fracture profiles that showed later in this section. These fracture profiles showed
that there more open fractures in Specimen #14 and #18 than Specimen #15, #19 and #29.

57
Figure 2.48 Total time for specimen heating (from room temperature to 190°C).
Figure 2.49 Cooling time when specimen borehole surface temperature cooled from 100℃ to 40℃ and outside surface temperature cooled from 180 to 40 .
All the borehole pressure during the thermal stimulation were collected. However,
due to the flow meter failure and repair time, flow data for some specimens were collected.

58
Also, due to the flow meter malfunction, some flow data were calculated by the collected
the flow water volume and flowed time.
In the Figure 2.52, peak borehole pressure and constant (mean) borehole pressure
during the thermal stimulation (water flow) are presented. The constant borehole pressure
depended mainly on the flow rate, and is caused by the flow pressure/rate when the water
is circulated in the borehole and tubing systems. Although the peak pressure also has the
similar trend with the flow rate, it is likely to be caused by the quick evaporation of water
when the injected cold water first contact with the hot borehole wall. The outlet is open to
atmosphere, and the low fluid pressure in the borehole is considered as a minor contributor
for initiating and propagating fractures. The initial water evaporation pressure may help
to initiate the fractures on the borehole wall. The thermal gradient created by the water
flow through the borehole is the major driving force to fracture inside the blocks.
Figure 2.50 Peak borehole pressure, constant (~mean) borehole pressure, and flow rate of each specimen.

59
The pressure decay tests results have been presented in the section 2.3.2. From
these results, we can get the permeability change information (pressure decay rate) due to
the thermal stimulation. These data is present in Table 2.3. The method of calculating the
pressure decay rate is that we first increase the borehole pressure up to 40 psi and then
record the time of the borehole pressure decreases to zero. Then the pressure decay rate
equals to borehole pressure (40 psi) over the decreasing time. Table 2.3 shows that the
permeability indicated from pressure decay test has been increased after thermal
stimulation due to the fractures or microfractures caused by the thermal shock.
Table 2-3 Pressure decay rate before and after thermal stimulation.
Before thermal stimulation
(psi/sec) After thermal
stimulation (psi/sec) #14 0.046 0.17 #15 0.46 16.5 #18 0.069 14.3 #19 0.29 15 #20 0.15 22.5
The temperature change during the water flow were presented in the first section
of this chapter. Here we look into more details to check how much temperature changed
during the thermal stimulation. All the specimens were heating to 190 and waited for it
until the specimen arrive the homogeneous temperature conditions (the borehole and
outside temperature both arrive the targeted temperature) before starting the test.

60
As we can see in the Figure 2.51, the borehole temperature dropped fast after the
water was injected into the borehole and became constant around 30 during the thermal
stimulation. However, the outside surface temperature decreased very differently. Several
factors may influence the outside surface temperature after the heat stimulation. The first
one is the flow time. The #18 had the longest water flow time among the specimens.
Therefore its final temperature is the lowest.
The test results also showed that Specimen #18 had the most open fractures among
other treated specimen. This indicates that the flowing time not only influences specimen
temperature, but it will also affect fractures propagation.
Another factor is the leakage water during the thermal stimulation. There was some
leakage water came from the micro-cracks around the casing caused by the thermal stress
and the cracks on the epoxy during the water flow.
The water evaporation takes the heat from the specimen and made the temperature
of specimen lower (endothermic water evaporation). For example, although Specimen #19
and #20 had the same flow time, there was more leakage water during the test of #20 than
#19, so the final temperature of #20 is lower than #19.
An interesting observation is that regardless of the flow time for specimen
temperature, the temperature of the water at the outlet was always about 40°C at its steady
state.
At its steady state temperature at the borehole, the heat may be continuously
transferred from the outside of the concrete to the inner part of the specimen (borehole)

61
and then transfer to the water that contact with the borehole wall. This phenomenon may
be helpful to the EGS topics such as the life span of EGS reservoir.
Figure 2.51 Average temperature of face that without leakage water, borehole temperature and outlet water temperature after thermal stimulations.
The breakdown test is performed after thermal stimulation. The aim of this test to
know the breakage pressure change due to the thermal stimulation. The fracture profiles
before and after the test, pressure profile during the breakdown test and fracture
complexity are provided to characterize the fractures.
After the breakthrough test, although the specimen did not fall apart (shown in
Figure 2.55), the fractures on the outside surface are wider than before. Most importantly
is that the fractures on the bottom of the borehole and the borehole wall are clearly

62
observed, which was not observed before the breakthrough test (Figure 2.53). It is
presumed that the thermal stimulation (thermal stress) initiated the micro-fracture on the
borehole wall that previously was not easily observed. When the borehole pressure
followed up to induce deeper fracture penetration, the existing micro-fractures became
wider. The phenomenon also indicates that the seed fractures created during thermal
stimulation will reduce breakdown pressure levels.
Figure 2.52 Fracture observations after the thermal stimulations (Specimen #18)

63
Figure 2.53 Pressure data records when performing the breakdown test (Specimen #18).
Figure 2.54 Fracture observations after breakdown test (air gas fracturing) (Specimen #18)

64
Figure 2.55 Fracture surfaces after specimen breakdown showing the thermal front. The pink area caused by the phenolphthalein shows the extent of the thermally induced
fractures. The uncolored areas are opened up by air pressure (Specimen #18).
From our thermal stress calculation, we could know that there is a strong possibility
of fractures initiating and propagating when the room temperature water flow through the
hot specimen. The maximum thermal stress (around 40 MPa) that generated at the
beginning of the water flow is much greater than the tensile stress of the concrete. As the
fracture imitated from borehole and continuously propagated into specimen, the thermal
stress that generated inside the specimen is lower than the thermal stress that generated on
the borehole wall. It indicates that once the pressure that needs for propagation is usually
lower than for the initiation.

65
2.5 Conclusions
We developed an experimental rig designed to study thermal stimulations in a
laboratory environment resembling EGS downhole conditions. By water flowing, we
created fractures in unconfined concrete specimen, thus enhanced its permeability and
lower its breakthrough pressure by thermal stimulation. After experiencing the thermal
flow, the mechanical and thermal properties are also changed.
With flowing water continuously through the borehole without pressurization, the
borehole is cooled as quickly as possible to maximize the thermal gradient near
wellbores, and then injected water become warmed and exit through an outlet.
The continuous water flow lead to occurrence of different thermal zones (cooled
zone, diffusion zone and ambient temperature zone) in the specimens.
Only minor film boiling effect is observed between the injected water and the
much hotter borehole surface with 190°C, as we observed the small temperature
difference between borehole space and the borehole wall. This implies efficient
temperature conduction from borehole fluid to formation surface, which is
favorable for thermal shock treatment.
Thermally driven fractures were initiated from the borehole surfaces and
propagated adjacent to the boreholes to some extent (thermal fracture front is
clearly showed by our breakthrough test with phenolphthalein), indicating that
borehole pressure may need to follow in order to induce deeper fracture penetration.
Most of our experimental results showed that we created two-winged fractures
after thermal stimulation. For the fracture initiation pressure, the rock tensile stress
66
and the minimum horizontal stress have a predominant position. Without confining
pressure for our test specimens, the overburden pressure (the gravity of specimen
itself) will be the maximum pressure and the minimum pressure direction will be
horizontal. This explained why the fracture always initiated and propagated from
face one to face three.
The profiles of borehole pressure decay obtained before and after each stage of
stimulation show that water flows increase the permeability of treated specimens.
Especially, the multiple treatments showed that increasing number of stimulations
increases permeability possibly by furthering fracture propagation and creating
new fractures.
Acoustic measurements confirm that the stimulations generate micro-fractures
inside the blocks, which will increase the matrix permeability. Bubble leakage tests
visually demonstrated localized or distributed permeation spots (or leaking holes)
that enhanced permeability.

67
3. WELLBORE THERMAL STIMULATION IN GRANITE BLOCK SPECIMENS
3.1 Introduction
The reservoir’s permeability can be improved by the sharp thermal gradient that
caused by the cold water injected into the hot wellbore. Thermal fractures have been
studied by many researchers. However, fracture formation as a result of rapid cooling of
rock formation at downhole conditions in Enhanced Geothermal Systems is not well
understood. In this study, we present laboratory results of emulating thermal stimulation
under downhole conditions to give a deeper understanding of thermal fracturing
mechanism.
To have more understanding that how thermal stimulation in EGS may occur, we
designed and developed an integrated system to emulate thermal stimulation under
wellbore condition in laboratory scale. We developed an apparatus to allow granite to be
heated to 200 - 300°C without the confining pressure and rapidly injecting the cold water
into the borehole in the specimen. We present a laboratory study of the role of thermal
stress on fracture imitation and propagation. The acoustic amplitude and acoustic velocity
are profiled to describe the physical properties. Thermal conductivity, expansion of
thermal diffusivity are also measured before and after the thermal stimulation. Our results
indicate that through thermal stimulation, especially after cycles of thermal simulations,
porosity increased, density decreased, acoustic waves attenuated and the mechanical
properties changed. We conclude that through our methods we have confirmed the process
believed to be responsible for the application of successful thermal stimulation in
geothermal fields.

68
3.2 Experimental studies
3.2.1 Experimental design and equipment
For the experimental design of granite block specimens, we designed the borehole
thermal shock with the tubing and fitting system. The cold water is injected into 1-inch
diameter boreholes, which are drilled 6 inches deep from the center of the top face into
the eight cubic specimens. Cracking by borehole thermal shock only uses tensile stress
resulting from sharp thermal gradient at borehole surfaces to initiate fractures. With
flowing water continuously through the borehole under low fluid pressure, the borehole
will be cooled as quickly as possible to maximize the thermal gradient across the contact
surface.
Water flows from the tap water to the specimen, and injected into the borehole and
then directed to an outlet at atmosphere pressure. A pressure transducer is attached to the
wellhead to monitor the borehole pressure. Because borehole pressure will not exceed 100
psi throughout all stimulation tests and pressure decay tests, it can be safely applied to
unconfined specimens. This experiment equipment employs specialized water rate
transport, control, and measurement systems. We have set up real-time monitoring and
logging of various parameters inside the borehole including pressure, water flow rate and
consumption, temperature and acoustic signal. During the thermal shock tests, several
thermocouples were attached to the inlet, borehole, outlet and Specimen surface to monitor
the dynamic evolution of temperatures.

69
3.2.2 Specimens
It is important that all the specimens were prepared in a similar way. To ensure
this, all the granite specimens to be tested are processed into 8-inch cubic blocks, an
intermediate scale between cores and reservoirs. Westerly granite was chosen as the test
material because they are common and inexpensive, and its properties are well known.
The outside surface and borehole wall surface were polished at the factory. Several
researchers (Yu et al., 2014, Haimson and Chang, 2000, Yong and Wang, 1980) have
studied the change of mechanical and thermal properties of granite when it is heated to
high temperature. According to their results, the granite’s mechanical and thermal
properties at room temperature are stated in Table 3.1.
Table 3-1 Mechanical and thermal properties of granite at room temperature.
Properties Density (g/cm³) 2.5-2.8
Unconfined compressive strength (MPa)
200-300
Tensile strength (MPa) 8-20 Dynamic Young’s Modulus (GPa) 60-80
Dynamic constraint Modulus (GPa)
40-90
Dynamic shear Modulus (GPa) 15-30 Poisson’s ratio 0.2-0.3
P-wave velocity (Km/s) 4.6-6 S-wave velocity (Km/s) 2.5-3.5
Thermal conductivity(W/m·K) 2-5 Volumetric specific heat
(MJ/(m³K) 1.5-4.0
Thermal diffusivity (mm2/s) 1.5-1.8 Coefficient of thermal expansion
(/K) 2 10

70
Table 3-2 Mechanical and thermal properties of the granite specimens tested in Chapter 3 at room temperature.
Properties Density (g/cm³) 2.6-2.7
Dynamic constraint Modulus (GPa)
42-44
Dynamic shear Modulus (GPa) 16-17 P-wave velocity (Km/s) 4-4.1 S-wave velocity (Km/s) 2.5-2.6
Thermal conductivity(W/m·K) 3.0-3.1 Volumetric specific heat
(MJ/(m³K) 1.9
Thermal diffusivity (mm2/s) 1.60 Coefficient of thermal expansion
(/K) 2.2 10
3.2.3 Procedures
For the assessment of fractures, the methods used for the concrete specimens in
Chapter 2 were employed for the granite specimen tests as well. Procedures followed for
the experiments of wellbore thermal stimulation in granite block specimens are detailed
below.
① Before heating
• Before putting the Specimens the oven
1) Pressure decay test with the short rig
2) Leak detection test (at 50 psi constant borehole pressure) with the short
rig
• After putting the Specimens the oven and fully assembling the rig

71
1) Pressure decay test
② During heating
• Data logging: Temperature (slow logging)
• Observe epoxy damage/contacts
• Pressure decay test right before treatment
• For granite block specimen, should heat at least for 20 hrs.
③ During treatment
• Flow rate (2-3 options: e.g. 1, 2, 3 GPM)
• Flow duration (2-3 options: e.g., 20, 40, 60 minutes)
• Target temperatures (Two options: 200 °C and 280 °C (max))
• Data logging: Temperature, flow rate and borehole pressure (intermediate)
• Observe processes and take photos
④ After treatment
• Pressure decay test right after treatment
• Two intermediate pressure decay tests
• Data logging: Temperature (slow logging)
• Continue heating for 6-10 hours
• Pressure decay test right before cooling
⑤ Cooling (two options: closed oven door / open oven door)
• Data logging: Temperature (slowest logging)
• One pressure decay test when the specimens are cooled a bit, but still warm
(maybe after 3-5 hrs).

72
• Cool down specimen ambient temperature (75 °F or 24 °C). Then do pressure
decay test
• Take out the specimen, and then perform:
1) Pressure decay test with the short rig
2) Leak detection test (again at 50 psi borehole pressure) with the short
rig
3.3 Results
3.3.1 System behavior – temperature / pressure / flow
We are trying to emulate in a laboratory scale the thermal stimulation under
wellbore condition that is conducted in the enhanced geothermal system field. Therefore,
the system behaviors are important for us to observe and analyze. In this section, we will
present temperature evolution during a whole test, which includes initial heating, water
flow, continued heating, and cooling, and flow and present pressure data recorded during
the flow period. Pressure decay tests are performed in each period above.
Temperature
A specimen is placed in the oven, and then the oven is turned on for gradual heating
(Figure 3.2). If the specimen is placed while the oven is at its target temperature, the
specimen will undergo high thermal loading at the surface, which is undesirable. Upon the
flow of water, the borehole temperature decreased rapidly from ~190°C to ~25°C in 3-5
seconds. This rapid heat transfer creates a sharp thermal gradient and thermal shock to the
borehole surface. Through the whole treatment that lasted about 5-20 minutes, the
temperature difference between the inside of borehole and the block face is observed to

73
be large (about 160°C). Thus, the average thermal gradient between the borehole surface
and the outside of the block is maintained high. The thermal gradient caused by cold water
injected into the hot borehole is considered as the major driving force to initiate cracks
inside the blocks. It is observed that compared with concrete specimens, granite specimens
have slightly faster rates of heating and cooling (compared with Figure 2.4 and Figure 3.1)
This may be caused by different thermal properties - thermal capacity, thermal
conductivity and thermal expansion coefficient - between concrete and granite. This is
because the granite has higher thermal diffusivity (1.6 mm2/s) than that of the concrete
(1.1 mm2/s); temperature is better propagated in the granite blocks.
Figure 3.1 Temperature during heating of granite block Specimen #2 (the first stimulation).

74
Figure 3.2 Temperature changes during thermal stimulation (flow of tap water) of granite block Specimen#2 (the first stimulation).
Figure 3.3 Temperature changes after stopping water injection of granite block Specimen#2 (the first stimulation).

75
Borehole pressure and flow rate
The pressure inside the borehole first tends to increase possibly due to the rapid
water evaporation and then decrease to the more constant pressure governed by flow
pressure (Figure 3.4 and 3.5). During the flow of water, spikes of borehole pressure that
reached up to 80-160 psi. The outlet is open to atmosphere, and the average fluid pressure
in the borehole (around 30 psi) would contribute little to fracture propagation. The
magnitudes of the flow rates apparently affected the fluid pressures in the borehole. Lower
flow rates corresponded to lower borehole pressure, and higher flow rate corresponded to
higher borehole pressure, as the outlet is open to atmosphere. Water was collected at the
outlet during the stimulation and compared with flow meter data (Figure 3.4). The flow
rate calculated from the collected water is a bit higher than the flow rate from the meter.
This may be caused by the turbulent flow created along the flow line.
Figure 3.4 Borehole pressure and flow rate during thermal stimulation (water flow, Specimen#2-first stimulation).

76
Figure 3.5 Borehole pressure and flow rate during thermal stimulation (water flow, Specimen#1-third stimulation).
3.3.2 Fracture Characterization
Pressure decay tests
The permeability of a specimen increased right after the treatment, indicated by
faster decay in pressure decay tests (Figure 3.2). This is because the fractures created by
the thermal shock, and the fractures will increase the air flow path when doing the pressure
decay tests. However, after stopping the water injection, the permeability of the specimen
will decrease back, as the wellbore become heated up. The disappearance of the thermal
gradient closes fractures, and thus permeability decreased. However, when the specimen
cooled down to room temperature, it is found that the permeability of the specimen

77
increased again. It is possible that either fracture were created during gradual cooling or
simply fractures were reopened at room temperature.
Figure 3.6 Pressure decay test results for Granite #2 (the first stimulation).

78
Figure 3.7 Pressure decay test results for Granite #1 (the third stimulation).
Table 3-3 Changes in permeability of granite block for a different phase.

79
For phase 1&3&4: Granite permeability decreased after heating. This may be
caused by thermal expansion of granite/tubing/epoxy, causing closure of micro
cracks.
For Phase 2: Granite permeability increased after treatment. This may be caused
by thermal shock caused micro cracks inside the specimen. The reason that G1-2
is different from others may cause by the presentence of water in the cracks. It
prevents the pathway of air.
For Phase 5: Granite permeability increased dramatically after completing the test.
It is caused by the cracks on epoxy.
Bubble leakage tests
Bubble leakage tests can show changes in permeability due to the thermal
stimulation before and after the treatments, by detecting the leaking crack. The liquid used
for the bubble tests is specially formulated for sensitive leak tests in pressurized equipment
such as Dewar or gas tank. Leak holes created during the thermal stimulation is located
from the massive bubble generation. Then the bubbling agent is applied all over the faces
to detect the leak cracks before the borehole is pressurized to about 40 psi by air.
Intuitively, more cycles of thermal treatments will increase the chances that cracks
are generated, and cracks formed during previous treatment may propagate, which further
weaken the specimen. Increasing the cycles of thermal treatment and waiting for the
thermal recovery between each treatment are also suggested by the industrial geothermal
field. It has been proved an efficient method to open up new fractures or widen the existing
fractures in the reservoir (Bradford et al., 2015).

80
The results from the leakage bubble test showed the permeability changed
significantly after the first water injection. It is speculated that thermal fracturing method
may destroy the microstructures of grains inside the granite block during the first treatment.
However, after completing four treatments to Granite #1, there are no further fractures
observed on outside faces of granite. During the treatment and pressure decay test, there
were no indications of short-cut cracks occurred on the borehole surface near the casing.
At least regarding bubble leakage tests, with increasing cycles of treatment on granite
blocks, the number and massiveness of leak points outside granite specimens only slightly
increased.
Figure 3.8 Comparison of bubble leakage before and after the first stimulation (Face 1, granite Specimen#2).
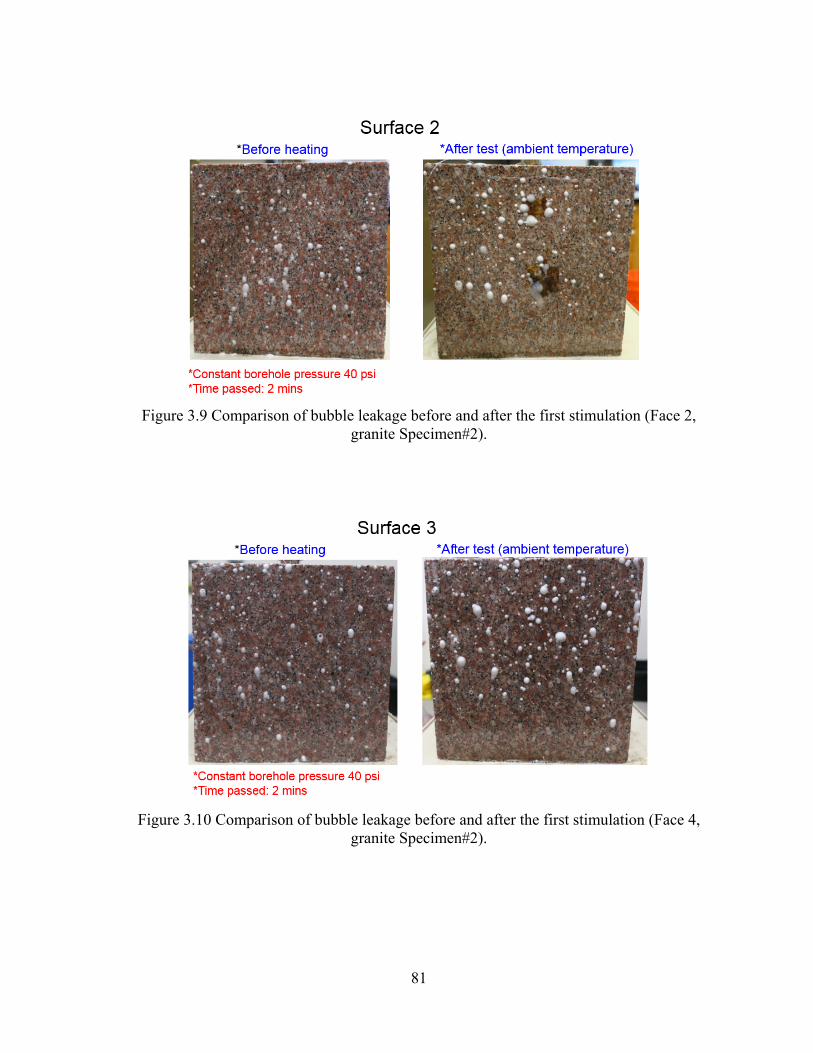
81
Figure 3.9 Comparison of bubble leakage before and after the first stimulation (Face 2, granite Specimen#2).
Figure 3.10 Comparison of bubble leakage before and after the first stimulation (Face 4, granite Specimen#2).

82
Figure 3.11 Comparison of bubble leakage before and after the first stimulation (Face 4, granite Specimen #2).
Acoustic measurement results
Transmission of compressional (P-waves) and shear (S-) acoustic waves were
recorded before and after the treatments. The characteristics of acoustic waves propagating
through the medium depend on the mechanical properties of the medium. In particular,
the wave velocity in jointed rock masses is a function of the density of fractures (or
fracture spacing) (Cha et al. 2009). When other properties such as intact rock properties,
density, and joint stiffness are the same, the wave velocity can be used as a monitoring
tool to characterize fracture generation.
A wave traveling through a cracked specimen, in general, loses energy faster due
to dissipation and scattering. When the wave goes through the interface and fractures in
the specimen, three modes of wave travel path includes reflection, refraction, and

83
transmission. The first two will scatter the direction of the wave out of the principal
direction and cause wave energy loss, and the wave attenuation occurs. Distributed
macro/micro cracks often give rise to an increase in attenuation. The knowledge of the
attenuation of waves in cracked media provides an approach for quantifying the material
damage.
The results from our acoustic measurement before and after the treatment confirms
that the influence of thermal shock on the granite specimen. After all the treatments in our
studies, the amplitudes of waveforms decreased significantly, which means the wave
energy was dissipated through cracks and damages generated by the thermal stimulation.
According to our measurement data, the range of reduction percentage for P-wave is from
20% to 85% and for S-wave is from 10% to 80%.
Distributed microcracks induced by the thermal stress will increase the length that
wave will travel, thus increase the traveling time, decrease the wave velocity. Changes in
the material response due to the reduction of effective elastic stiffness resulting from
microcrack damage have a significant influence on the physical properties of the materials.
All the signals showed the time delays, which mean the velocities, were decreased
(P-wave velocity decreased about 25%-40% and S-wave velocity decreased about 15%-
30%. There is an inverse relation between the velocities and the damage induced by the
thermal shock.

84
Figure 3.12 Locations for acoustic measurements.
Figure 3.13 Acoustic waveforms of granite Specimen#1 after the third stimulation (P-wave, from Face 1 to Face 3).

85
Figure 3.14 Acoustic waveforms of granite Specimen#1 after the third stimulation (P-wave, from Face 2 to Face 4).
Figure 3.15 Acoustic waveforms of granite Specimen#1 after the third stimulation (P-wave, from Face 5 to Face 6)

86
Figure 3.16 Acoustic waveforms of granite Specimen#1 after the third stimulation (S-wave, from Face 1 to Face 3).
Figure 3.17 Acoustic waveforms of granite Specimen#1 after the third stimulation (S-wave, from Face 2 to Face 4).

87
Figure 3.18 Acoustic waveforms of granite Specimen#1 after the third stimulation (S-wave, from Face 5 to Face 6).
Figure 3.19 P-wave velocities of granite Specimen#1 after the third stimulation (from Face 1 to Face 3).

88
Figure 3.20 P-wave velocities of granite Specimen#1 after the third stimulation (from Face 2 to Face 4).
Figure 3.21 P-wave velocities of granite Specimen#1 after the third stimulation (from Face 5 to Face 6).

89
Figure 3.22 S-wave velocities of granite Specimen#1 after the third stimulation (from Face 1 to Face 3).
Figure 3.23 S-wave velocities of granite Specimen#1 after the third stimulation (from Face 2 to Face 4).

90
Figure 3.24 S-wave velocities of granite Specimen#1 after the third stimulation (from Face 5 to Face 6).
Thermal properties
After thermal stimulation, the thermal properties, especially thermal conductivity
(shown in Figure 3.25), are reduced by the thermal stress. The seven measurement
locations are at different locations on the top surface and around surfaces. After the water
flow through the borehole, the thermal conductivity on the top surface, especially the area
near the casing, significantly reduced by the thermal stress. The thermal conductivity on
face one to face four, which are away from the borehole and didn’t have stronger thermal
gradient, didn’t reduced much. The reason that caused the face one and face two have the
different value of thermal conductivity with face three and four may cause by the leakage
water.

91
Figure 3.25 Thermal conductivity changed after thermal treatment.
Figure 3.26 Thermal properties measurement locations 1-3 on the top surface

92
3.4 Conclusions
In this chapter, we successfully applied thermal stress into downhole condition of
the unconfined granite specimen by water flowing. By using the thermal stress, we created
the micro fractures to enhance permeability of the specimen. Also, the mechanical and
thermal properties are changed after experiencing the thermal flow.
Different from the concrete specimen, we didn’t create visible fractures on granite
due to its stronger mechanical properties (higher tensile strength and Young’s
modulus). But the profiles of borehole pressure decay obtained before and after
each stage of stimulation show that water flows increase the permeability of treated
specimens.
Results from our Micro-CT showed that the permeability change is caused by
micro fractures that caused by thermal stress. These small fractures that have
formed during thermal treatment, which added up, significantly weakened the
specimen. Also, this micro-fracturing in rocks is an indication of the occurrence of
a failure, which could further lower the breakthrough pressure.
Acoustic measurements confirm that the stimulations generate micro-fractures
inside the blocks, which will increase the matrix permeability. Bubble leakage tests
visually demonstrated localized or distributed permeation spots (or leaking holes)
that enhanced permeability.
Thermal treatment also changes the mechanical and thermal properties of granite,
the effect enhanced with increasing number of cycles of the treatment. The thermal
shock treatment decreased density (thus increasing porosity) and reduced acoustic

93
amplitudes and velocities (thus decreasing elastic constants). The thermal shock
decreased thermal conductivity and specific heat of the treated specimens. This is
because the treatment created minute cracks, and thus creating air voids, which
have lower thermal conductivity and specific heat than mineral solids.

94
4. THERMAL STIMULATION OF CORE SPECIMENS - CHANGES IN PHYSICAL
PROPERTIES
4.1 Introduction
In previous chapters, we conducted thermal stimulations to wellbores in large
block specimens. In this chapter, we applied thermal shock on granite core specimens by
heating and quenching them. Then we observed how micro and macro properties are
altered by some methods. Granite core specimens were heated in the oven to the
temperature of 150°C or 280°C and then submerge into the room-temperature water to
rapidly cool the specimens. We characterized mechanical and thermal properties before
and after quenching tests. The physical properties measured include elastic wave velocities,
dynamic modulus, thermal conductivities, the coefficient of thermal expansion, specific
heat, and surface texture. We also utilize micro-CT to evaluate the alterations of
microstructure in 3D of the specimens and supplement our macro property investigations.
The results of our investigation and implications for well stimulation in enhanced
geothermal system are also discussed in this chapter.
4.2 Experimental studies
4.2.1 Specimens
All the granite core specimens are processed into 4-inch length and 2-inch diameter
cylinder shape. Westerly granite was chosen because they are relatively inexpensive and
its properties are known. Also, they are a kind of granite, which is the most common target
formation for EGS. Both end surfaces were polished for the convenience of the acoustic
and thermal measurements.

95
Researchers (Yu et al., 2014, Haimson and Chang, 2000, Yong and Wang, 1980)
have studied the change of mechanical and thermal properties of granite when it is heated
to high temperature. According to their results, the granite’s mechanical and thermal
properties at room temperature are stated in Table 4.1.
Table 4-1 Mechanical and thermal properties of granite at room temperature
properties
Density (g/cm³) 2.5-2.8
Unconfined compressive strength (MPa) 200-300
Tensile strength (MPa) 8-20
Dynamic Young’s Modulus (GPa) 60-80
Dynamic constraint Modulus (GPa) 40-90
Dynamic shear Modulus (GPa) 15-30
Poisson’s ratio 0.2-0.3
P-wave velocity (Km/s) 4.6-6
S-wave velocity (Km/s) 2.5-3.5
Thermal conductivity(W/m·K) 2-5
Specific heat (J/(kg·K)) 1.5-4.0
Coefficient of thermal expansion (/K) 2×10⁻⁵

96
Table 4-2 Mechanical and thermal properties of the granite core specimen tested.
Properties Density (g/cm³) 2.6-2.7
Dynamic constraint Modulus (GPa)
42-44
Dynamic shear Modulus (GPa) 16-17 P-wave velocity (Km/s) 4-4.1 S-wave velocity (Km/s) 2.5-2.6
Thermal conductivity(W/m·K) 3.0-3.1 Specific heat (J/(kg·K) 1.9
Coefficient of thermal expansion (/K)
2.2×10⁻⁵
4.2.2 Experimental design and procedures
The experiment is performed to assess overall cracks and damages due to thermal
shock that is induced by submerging heated granite core specimens into room-temperature
water (quenching). The granite core specimens instrumented with temperature sensors at
an outer surface were placed in the oven to slowly heat the specimen. After the internal
temperature of the specimen reached the target temperature and become steady state, the
core is submerged into tap water. The core is kept underwater for about 1 hour. Before
and after tests, acoustic and thermal properties are measured. CT scans are performed for
selected specimens to visualized internal microcracks, and microscopy is utilized to
observe surface cracks and textures.
Detailed procedures for the experiments of quenching granite core specimens are
as follows:
① Before heating

97
Measure the volume and mass (to calculate density).
Using microscopy to observe target area and save the picture (focusing on
surface textures, color, and cracks).
Acoustic measurement (using alcohol to clean the coupling agent after
measurement).
Place thermocouple on the specimen (glue and tape).
② During heating
Set up the target temperature, for example, one specimen 280C and another
150C.
To avoid creating the thermal shock, place specimen in the oven first and then
turn on the oven. Do not place specimen while the oven temperature is already
very hot.
Data logging: temperature & time (to calculate heating rate).
③ During treatment
Quenching time: according to the cooling data from previous block specimen
(oven turn off & oven door closed & cooling in the air), it will take around 10 hrs
to cool from 200C to room temperature. If the specimen is quenched in the water
and cool down to room temperature, it will probably take 5 hours.
Data logging: temperature & time (to calculate cooling rate).
④ After treatment
Measure the volume and mass (to calculate density).

98
Using microscopy to observe target area and save the picture (focusing on
surface textures, color, and cracks).
Acoustic measurement
4.2.3 Measurements
Acoustic measurement
In an ultrasonic transmission test, pulse energy generated from an ultrasonic
transducer located at one end of a core specimen propagates through the core and is
received by another transducer placed at the opposite end of the core specimen. A timing
device measures the transmit time of the ultrasonic pulse through the material. With
known propagation length, the pulse velocity can be calculated from the path length
divided by the transmit time. Acoustic measurements give the velocity of compressional
and shear waves that inside materials. By comparing these velocities before and after
performing the thermal stimulation, the existence of cracks and damages within the rock
specimen medium can be qualitatively assessed. Additionally, with known density rock
density, the dynamic elastic modulus and Poisson’s ratio can be calculated from these two
velocities.
Micro-CT scan
As shown in Figure 4.1, the ZEISS Xradia 520 Versa Micro-CT is a non-
destructive imaging technique capable of reproducing 3D material microstructure from
shadow images based on X-ray absorption by material volume elements through the
mechanism of contrast formation. A computer processing of the projected shadow pictures
of different intensity is then used to reconstruct the 3D microstructure of the object. In our

99
project, the micro CT-scanner is used to get high-resolution 3D images of fracture planes
and fracture network connectivity before and after thermal treatment.
Figure 4.1 X-ray microtomography device (ZEISS Xradia 520 Versa Micro-CT)
The boundaries of mineral grains in the rock will determine a possible location that
will occur the thermally induced cracks. Because in these boundaries, different mineral
components will have different thermal expansion. When the microscopic fracturing
connected to a network, the macroscopic permeability and the fluid transport properties of
the rock changed remarkably. So two mechanisms have been suggested for thermal
cracking. First, most rock-forming minerals are anisotropic, and, if there is a mismatch in
the thermo-elastic behavior of minerals across a grain boundary, internal stresses may be
generated as the rock is subjected to different temperatures and the stresses may be large
enough to cause the formation of new cracks. The second model considers the effect of

100
the temperature gradient. Local variations in the temperature gradient in rocks generate
thermal stress that in turn will initiate the new fractures or propagate the existing cracks.
Thermal properties
The hot disc thermal conductivity analyzer we used can provide thermal properties
including coefficient of thermal expansion, thermal conductivity (0.001 to 1000 W/mK),
thermal diffusivity, and volumetric specific heat. Applicable types of materials include
solid, liquid, paste, and powder. It can also measure directional (axial & radial) properties,
and can cover homogeneous, heterogeneous, isotropic, and anisotropic orientations.
Figure 4.2 Hot Disc Thermal Property System (Model Number 2500S)

101
4.3 Experimental results
4.3.1 Temperatures
The thermocouple was attached to the specimen surface to measure the
temperature during the heating and quenching. To ensure the specimen is thoroughly
heated internally to targeted temperature, the cores are heated for at least 16 hours before
the quenching (Figure 4.5). Once the hot specimen was submersed into the water, the
temperature of specimen dropped rapidly, and the temperature of water increased slightly
(Figure 4.6 and 4.7). The quenching will create thermal stress to the specimen, and micro
fractures will be created.
Figure 4.3 Thermocouples attached on core specimen with glue - the glue cured for 12 hours before starting to heat (Granite Core Specimen #1 and Specimen #2).
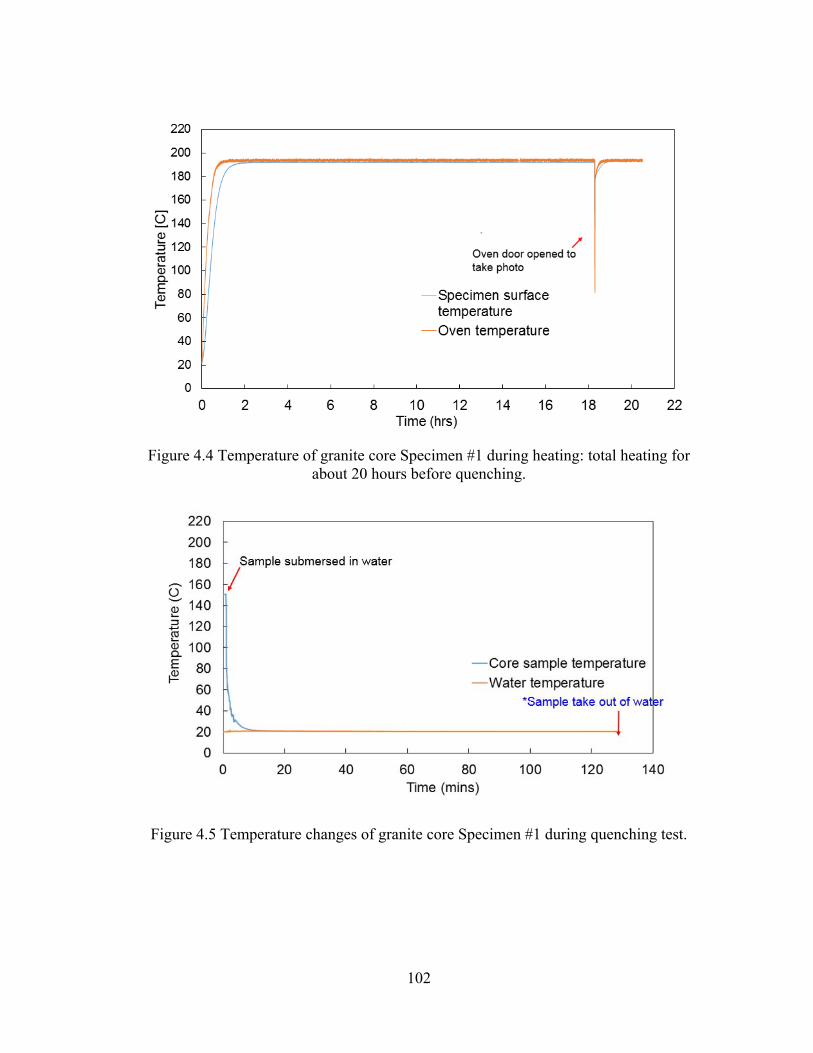
102
Figure 4.4 Temperature of granite core Specimen #1 during heating: total heating for about 20 hours before quenching.
Figure 4.5 Temperature changes of granite core Specimen #1 during quenching test.
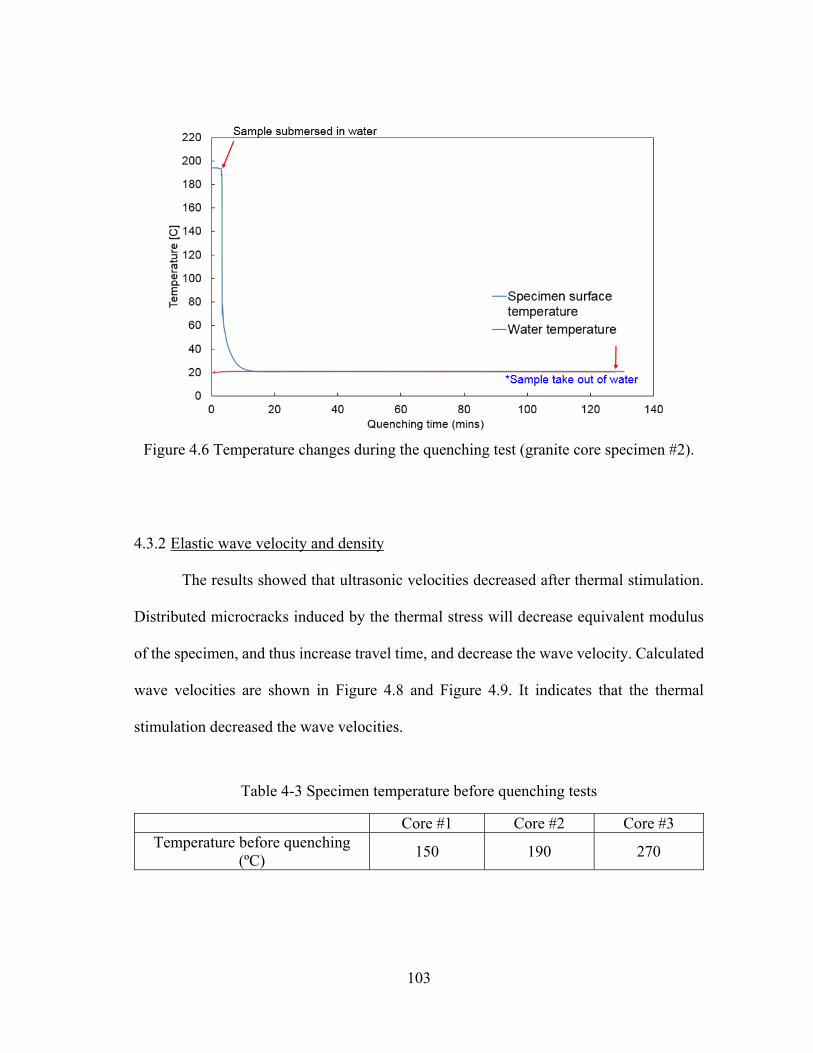
103
Figure 4.6 Temperature changes during the quenching test (granite core specimen #2).
4.3.2 Elastic wave velocity and density
The results showed that ultrasonic velocities decreased after thermal stimulation.
Distributed microcracks induced by the thermal stress will decrease equivalent modulus
of the specimen, and thus increase travel time, and decrease the wave velocity. Calculated
wave velocities are shown in Figure 4.8 and Figure 4.9. It indicates that the thermal
stimulation decreased the wave velocities.
Table 4-3 Specimen temperature before quenching tests
Core #1 Core #2 Core #3 Temperature before quenching
(ºC) 150 190 270

104
The granite core specimens #1, #2 and #3 were heated to a different temperature
(Table 4.2). When the target temperature of the specimen is higher, it will cause stronger
thermal stress when performing the quenching test. Thus, the more thermal damage will
occur on the specimen. Combining the Table 4.2 and Figure 4.8 and Figure 4.9, we see
that there is an inverse relation between the specimen temperature and ultrasonic velocity
after the thermal stimulation. For comparison or as the control experiment, Granite Core
#4 is heated to 200ºC, and then slowly cooled to room temperature. This gradual heating
and cooling (without quenching) will also create micro fractures and change core
properties. Because most rock-forming minerals are anisotropic, and, if there is a
mismatch in the thermo-elastic behavior of minerals across a grain boundary, internal
stresses may be generated as the rock is subjected to different temperatures and the stresses
may be large enough to cause the formation of new cracks.
Table 4-4 S-wave velocity changes before and after treatment (Core #1 to #3)
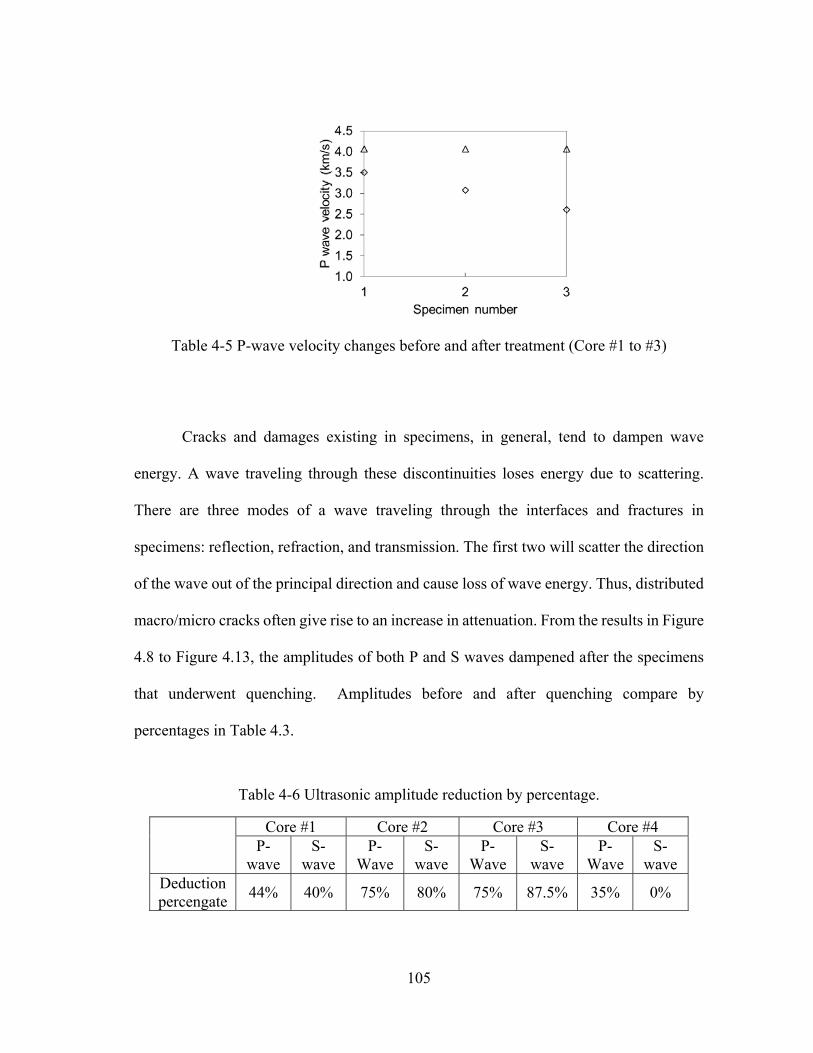
105
Table 4-5 P-wave velocity changes before and after treatment (Core #1 to #3)
Cracks and damages existing in specimens, in general, tend to dampen wave
energy. A wave traveling through these discontinuities loses energy due to scattering.
There are three modes of a wave traveling through the interfaces and fractures in
specimens: reflection, refraction, and transmission. The first two will scatter the direction
of the wave out of the principal direction and cause loss of wave energy. Thus, distributed
macro/micro cracks often give rise to an increase in attenuation. From the results in Figure
4.8 to Figure 4.13, the amplitudes of both P and S waves dampened after the specimens
that underwent quenching. Amplitudes before and after quenching compare by
percentages in Table 4.3.
Table 4-6 Ultrasonic amplitude reduction by percentage.
Core #1 Core #2 Core #3 Core #4
P-wave
S-wave
P-Wave
S-wave
P-Wave
S-wave
P-Wave
S-wave
Deduction percengate
44% 40% 75% 80% 75% 87.5% 35% 0%

106
Figure 4.7 P-wave signature before and after quenching (Granite Core #1).
Figure 4.8 S-wave signature before and after quenching (Granite Core #1).

107
Figure 4.9 P-wave signature before and after quenching (Granite Core #2).
Figure 4.10 S-wave signature before and after quenching (Granite Core #2).
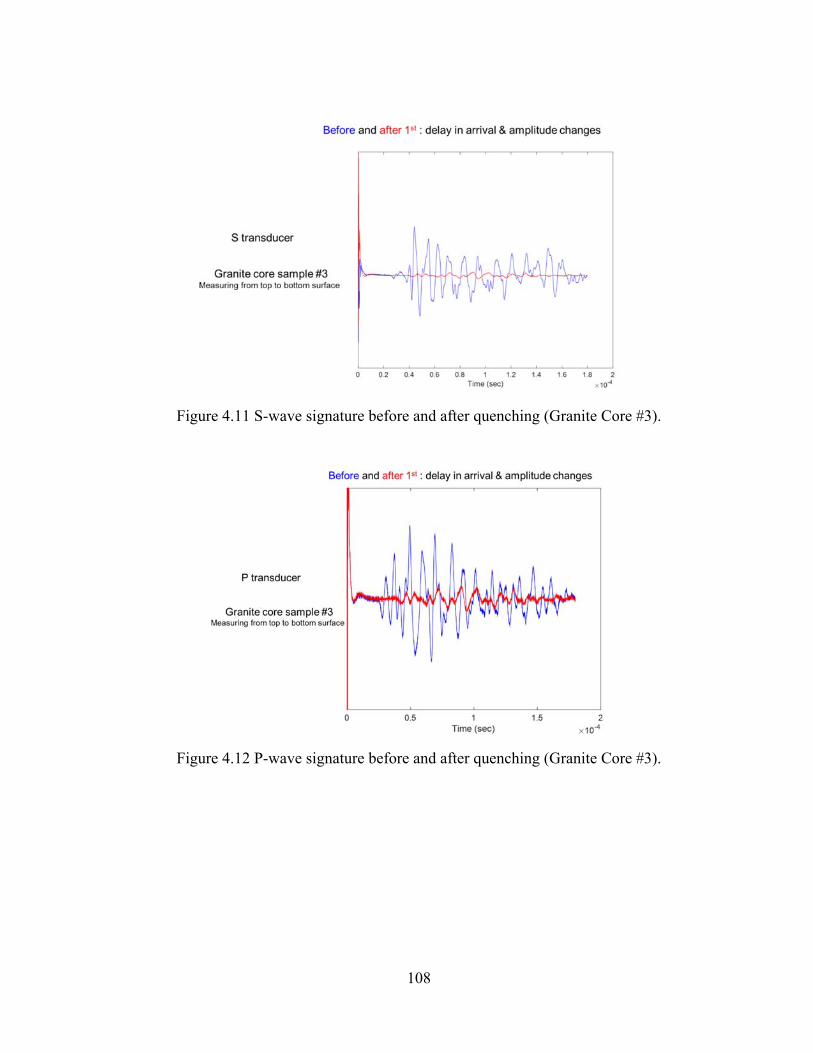
108
Figure 4.11 S-wave signature before and after quenching (Granite Core #3).
Figure 4.12 P-wave signature before and after quenching (Granite Core #3).
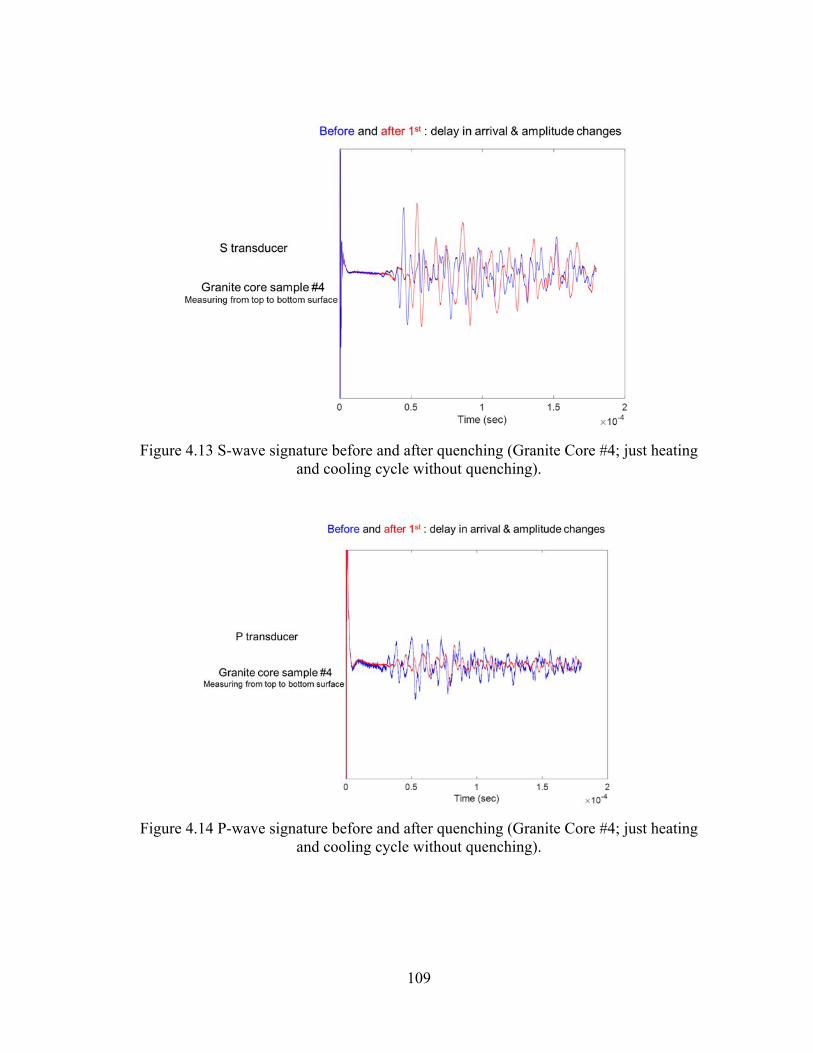
109
Figure 4.13 S-wave signature before and after quenching (Granite Core #4; just heating and cooling cycle without quenching).
Figure 4.14 P-wave signature before and after quenching (Granite Core #4; just heating and cooling cycle without quenching).

110
As shown in Table 4.4, the thermal stimulation that occurred during the quenching
test decreased the specimen density. We observed density decreases in all specimens
subject to thermal treatment. Furthermore, a decrease in density of the rapidly quenched
specimen is slightly greater than those that were slowly cooled (Specimen #4 in Table 4.4
is slowly cooling in the oven without quenching). The quenching will create a greater
thermal stress that will induce microfractures inside the specimen, which is also the
mechanism that may be responsible for the density decrease. Besides, the thermal gradient
may also induce the dissolution of quartz and feldspar and re-deposition of this mineral
within the specimen, which will also lead to the density decrease (Arshad et al., 2016).
Table 4-7 Density change before and after treatment
Density (g/cm³)
Specimen #1 Specimen #2 Specimen #3 Specimen #4
Before treatment
2.70 2.66 2.65 2.65
After treatment 2.65 2.64 2.62 2.63
Density change percentage
0.46% 0.54% 1.09% 0.40%
4.3.3 Micro-CT scan
Microscopic cracks of the granite specimen may be associated with the
macroscopic property changes. The leakage bubble tests showed that macroscopic
permeability changed after we perform the thermal stimulation on the granite specimen.
Our micro-CT scan shows the microscopic fractures that caused by thermal stress

111
connected to a network after the thermal stimulation. So the results of micro-CT explain
why the macroscopic permeability and the fluid transport properties of the rock changed
remarkably after thermal stimulation. This phenomenon also indicates that the implication
of thermal fracturing to the enhanced geothermal system is very important.
Two mechanisms have been suggested for thermal cracking. First, most rock-
forming minerals are anisotropic, and, if there is a mismatch in the thermo-elastic behavior
of minerals across a grain boundary, internal stresses may be generated as the rock is
subjected to different temperatures and the stresses may be large enough to cause the
formation of new cracks. The second model considers the effect of the temperature
gradient. Local variations in the temperature gradient in rocks generate thermal stress that
in turn will initiate the new fractures or propagate the existing cracks.
4.3.4 Thermal properties
Thermal gradient leads to a differential contraction of the rock, which in turn
creates thermal stresses. It could conclude that this thermal stresses that happened during
the thermal stimulation process will lead to the reduction of thermal conductivity of the
rock, the shear modulus and constrained modulus, the tensile strength and the density. The
changes of thermal properties before and after the quenching tests are listed in Table 4.5
and Table 4.6. The main reason behind the decreased thermal conductivities after
quenching tests can be explained by micro cracks generated in the specimens due to
quenching. Micro cracks introduce air or void in the specimen. The air has lower thermal
conductivity (0.024 W/(m·K)) than the mineral comprising the granite, thus lowering

112
overall thermal conductivities of the treated granite. Similarly, the volumetric specific heat
of the air is much lower than the granite.
Table 4-8 Changes in thermal conductivities before and after the quenching tests
Thermal
conductivity
(W/m·K)
Specimen #1 Specimen #2 Specimen #3 Specimen #4
Before 3.012 3.056 3.042 3.014
After 2.964 2.876 2.814 2.980
Table 4-9 Changes in volumetric specific heat before and after the quenching tests
Specific heat (MJ/m³K)
Specimen #1 Specimen #2 Specimen #3 Specimen #4
Before 1.989 1.978 1.951 1.967
After 1.951 1.832 1.813 1.879
4.4 Conclusions
In our research, we successfully applied thermal shock on granite core specimens
by heating and quenching them. The micro and macro properties alternation indicates that
the thermal fracturing is efficient for enhancing the permeability of granite core specimen.
The thermal stimulation mechanism can not only create new fractures but also will change
the mechanical and thermal properties of our original material. Through thermal
stimulation, especially after many cycles of thermal stimulations, we have increased
porosity and permeability, decreased density, attenuated acoustic velocities, decreased

113
Shear Modulus and Constrained Modulus, decreased compressive and tensile strength,
decreased thermal conductivity and specific heat.
Above results clearly show that by changing the properties of the granite, the
thermal fracturing mechanism could maximum the hydraulic fracturing by further
enhancing reservoir permeability, lowering breakthrough pressure level and improving
fracturing efficiency. This also implies that circulation of cold water in the wellbore at low
pressure in the enhanced geothermal system can be applied as a near-wellbore formation
damage remediation mechanism. The thermal fracturing offers much promise as a new
fracturing mechanism will potentially increase the permeability of reservoir in Enhanced
Geothermal System and ultimately make it economically exploitable.

114
5. CONCLUSIONS
5.1 Key findings of the thesis
This research investigated the effect of thermal stimulation on fracture creation
and permeability changes by laboratory studies. We developed an experimental rig
designed to study thermal stimulations in a laboratory environment resembling EGS
downhole conditions. Water is flown through wellbores of unconfined hot dry granite and
concrete blocks. Unlike pressure-based fracturing, such as hydraulic fracturing, in this
study, the wellbore is subject to continuous flow under flow pressure to maximize thermal
shock effects. Additional insights are obtained by quenching tests using core-sized
specimens. We have reached the following key conclusions.
Only minor film boiling effect is observed between the injected water and the
much hotter borehole surface with 190°C, as we observed the small temperature
difference between borehole space and the borehole wall. This implies efficient
temperature conduction from borehole fluid to formation surface, which is
favorable for thermal shock treatment.
Temperature propagation into the rock formation is significantly delayed during
both the heating and water flow as expected. In terms of laboratory testing, this
means significantly more heating is required after the boundary measurements
reached the target temperature.
Thermally driven fractures were initiated from the borehole surfaces and
propagated adjacent to the boreholes to some extent, indicating that borehole
pressure may need to follow in order to induce deeper fracture penetration. The

115
seed fractures created during thermal stimulation may reduce breakdown pressure
levels.
The profiles of borehole pressure decay obtained before and after each stage of
stimulation show that water flows increase the permeability of treated specimens.
Multiple treatments showed that increasing number of stimulations increases
permeability possibly by furthering fracture propagation and creating new
fractures.
Acoustic measurements confirm that the stimulations generate micro-fractures
inside the blocks, which will increase the matrix permeability.
Bubble leakage tests visually demonstrated localized or distributed permeation
spots (or leaking holes) that enhanced permeability. Permeation through the rock
was not homogeneous, and there were invisible pathways (cracks, holes, or more
permeable regions) that allowed preferential permeation of air/fluid.
Mechanical and thermal properties of formation rock affect the effect of thermal
stimulations. The granite blocks were harder to create fractures and increase
permeability with the same amount of temperature difference and water flow.
The core specimens manifested indirect indications of cracks - changes in
mechanical and thermal properties - after experiencing the thermal flow. The effect
enhanced with increasing number of cycles of the treatment.
The thermal shock treatment decreased density (thus increasing porosity) and
reduced acoustic amplitudes and velocities (thus decreasing elastic constants).

116
The thermal shock decreased thermal conductivity and specific heat of the treated
specimens. This is because the treatment created minute cracks, and thus creating
air voids, which have lower thermal conductivity and specific heat than mineral
solids.
5.2 Implications and future study
The knowledge obtained in this study may be applicable to wellbores that need
stimulation such as enhanced geothermal wellbores and other underground resources and
environmental projects. Thermal fracturing may also be used in combination with other
stimulation technologies. In particular, the technique may help in the field to lower the
breakdown pressure by creating seed fractures prior to a pressure-based treatment. Thus,
the thermal fracturing mechanism may potentially increase the efficiency of hydraulic
fracturing.
If lower breakdown pressure is achieved due to thermally induced fractures, It may
also related to reduce environmental concerns (e.g., by reduced induced seismicity)
associated with fracturing, and possibly lower stimulation cost, although economic
analysis is needed to verify.
To further develop this thermal fracturing mechanism, future research must go past
the unconfined testing presented in this study. A few topics for further studies have been
identified. Thermal fracturing at reservoir stress levels by thermal shock and the added
effect of borehole pressurization such as hydraulic loading are still poorly understood. The
effect of stress level and stress anisotropy on the characteristics of thermal fracturing can
be investigated by using a triaxial loading system. The effects of various material

117
properties on fracturing behavior should be thoroughly investigated. A dimensional
analysis considering relevant parameters will serve as a frame of understanding and will
guide the scaling up of laboratory studies to potential field applications.

118
REFERENCES
Alqahtani, N. B., Miskimins, J. L., Huang, C. & Cha, M. (2017) 3D Finite Element
Modeling of Thermally-induced Stress during a Cryogenic Fracturing Experiment
In Proceedings of 51st US Rock Mechanics/Geomechanics Symposium, American
Rock Mechanics Association.
Alqatahni, N. B., Cha, M., Yao, B., Yin, X., Kneafsey, T. J., Wang, L., Wu, Y.-S. &
Miskimins, J. L. (2016) Experimental Investigation of Cryogenic Fracturing of
Rock Specimens Under True Triaxial Confining Stresses. In SPE Europec featured
at 78th EAGE Conference and Exhibition.) Society of Petroleum Engineers.
Arshad, M., Nakagawa, M., Jahanbakhsh, K. & Dunnington, L. (2016) An Insight in
Explaining the Stress Distribution in and around EGS. arXiv preprint
arXiv:1611.00596.
ASTM (2008a)D2845-08 Standard Test Method for Laboratory Determination of Pulse
Velocities and Ultrasonic Elastic Constants of Rock, ASTM International.
ASTM (2008b)D3967 Standard Test Method for Splitting Tensile Strength of Intact Rock
Core Specimens.
ASTM (2014a)ASTM C192/C192M Standard Practice for Making and Curing Concrete
Test Specimens in the Laboratory.
ASTM (2014b)D7012 Standard Test Methods for Compressive Strength and Elastic
Moduli of Intact Rock Core Specimens under Varying States of Stress and
Temperatures.
119
Bazant, Z. P. & Kaplan, M. F. (1996) Concrete at high temperatures: material properties
and mathematical models. Longman.
Bradford, J., Moore, J., Ohren, M., Mclennan, J., Osborn, W. L., Majer, E., Nash, G.,
Podgorney, R., Freifeld, B. & Nye, R. (2015) Recent Thermal and Hydraulic
Stimulation Results at Raft River, ID EGS Site. In 40th Workshop on Geothermal
Reservoir Engineering.), pp. 561-571.
Cha, M., Alqahtani, N., Yao, B., Wang, L., Yin, X., Wu, Y. & Kneafsey, T. (2016a)
Studying cryogenic fracturing process using transparent specimens In Proceedings
of The 1st International Conference on Energy Geotechnics, August 29-31, 2016,
pp. 211-216.
Cha, M., Alqahtani, N. B., Yao, B., Yin, X., Wu, Y. S. & Kneafsey, T. J. (2016b)
Development of laboratory system for cryogenic fracturing study In Proceedings
of ICEGT 2016, pp. 381-388.
Cha, M., Cho, G.-C. & Santamarina, J. C. (2009) Long-wavelength P-wave and S-wave
propagation in jointed rock masses. Geophysics 74(5):E205-E214.
Cha, M. & Cho, G. C. (2007) Compression wave velocity of cylindrical rock specimens:
engineering modulus interpretation. Japanese Journal of Applied Physics Part 1-
Regular Papers Brief Communications & Review Papers 46(7B):4497-4499.
Cha, M., Yin, X., Kneafsey, T., Johanson, B., Alqahtani, N., Miskimins, J., Patterson, T.
& Wu, Y.-S. (2014) Cryogenic fracturing for reservoir stimulation–Laboratory
studies. Journal of Petroleum Science and Engineering 124:436-450.

120
Duchane, D. & Brown, D. (2002) Hot dry rock (HDR) geothermal energy research and
development at Fenton Hill, New Mexico. Geo-Heat Centre Quarterly Bulletin
23(4):13-19.
Enayatpour, S. & Patzek, T. (2013) Thermal Shock in Reservoir Rock Enhances the
Hydraulic.) Unconventional Resources Technology Conference (URTEC).
Fragaszy, R., Santamarina, J., Amekudzi, A., Assimaki, D., Bachus, R., Burns, S., Cha,
M., Cho, G., Cortes, D., Dai, S., Espinoza, D., Garrow, L., Huang, H., Jang, J.,
Jung, J., Kim, S., Kurtis, K., Lee, C., Pasten, C., Phadnis, H., Rix, G., Shin, H.,
Torres, M. & Tsouris, C. (2011) Sustainable development and energy
geotechnology — Potential roles for geotechnical engineering. KSCE Journal of
Civil Engineering 15(4):611-621.
Haimson, B. & Chang, C. (2000) A new true triaxial cell for testing mechanical properties
of rock, and its use to determine rock strength and deformability of Westerly
granite. International Journal of Rock Mechanics and Mining Sciences 37(1):285-
296.
Lamond, J. F. & Pielert, J. H. (2006) Significance of tests and properties of concrete and
concrete-making materials.) ASTM West Conshohocken, PA.
Pasikki, R. G., Libert, F., Yoshioka, K. & Leonard, R. (2010) Well stimulation techniques
applied at the salak geothermal field. In Proceedings of the World Geothermal
Congress.), pp. 11.
Powers, T. C. (1969) The properties of fresh concrete.

121
Siratovich, P., Cole, J., Heap, M., Villeneuve, M., Reuschlé, T., Swanson, K., Kennedy,
B., Gravley, D. & Lavallée, Y. (2015) Experimental thermal stimulation of the
Rotokawa Andesite.
Siratovich, P. A. (2014) Thermal Stimulation of the Rotokawa Andesite: A Laboratory
Approach.
Siratovich, P. A., Sass, I., Homuth, S. & Bjornsson, A. (2011) Thermal stimulation of
geothermal reservoirs and laboratory investigation of thermally-induced fractures.
In Proc., Geothermal Resources Council Annual Meeting.), pp. 1529-1535.
Tarasovs, S. & Ghassemi, A. (2014) Self-similarity and scaling of thermal shock fractures.
Physical Review E 90(1):012403.
Tsang, Y. (1984) The effect of tortuosity on fluid flow through a single fracture. Water
Resources Research 20(9):1209-1215.
Wang, J., Tsang, C. & Sterbentz, R. (1982) The state of the art of numerical modeling of
thermohydrologic flow in fractured rock masses. Environmental Geology 4(3-
4):133-199.
Wang, L., Yao, B., Cha, M., Alqahtani, N. B., Patterson, T. W., Kneafsey, T. J., Miskimins,
J. L., Yin, X. & Wu, Y.-S. (2016) Waterless fracturing technologies for
unconventional reservoirs-opportunities for liquid nitrogen. Journal of Natural
Gas Science and Engineering 35:160-174.
Yong, C. & Wang, C. Y. (1980) Thermally induced acoustic emission in Westerly granite.
Geophysical Research Letters 7(12):1089-1092.

122
Yu, W., Bao-Lin, L., Hai-Yan, Z., Chuan-Liang, Y., Zhi-Jun, L. & Zhi-Qiao, W. (2014)
Thermophysical and mechanical properties of granite and its effects on borehole
stability in high temperature and three-dimensional stress. The Scientific World
Journal 2014.