laboratory soil classification - college of engineering...
TRANSCRIPT
Lin Li, Ph.D.
Center for Environmentally Sustainable Transportation in Cold Climates University of Alaska Fairbanks
June 6th, 2016
2016 Summer Transportation Institute, Fairbanks, AK
Laboratory Soil Classification

2
Introduction Unified Soil Classification System (USCS) Sieve analysis and Hydrometer test Atterberg limits Examples
Outline

3
Introduction
Coarse < 0.075 mm < Fine
4
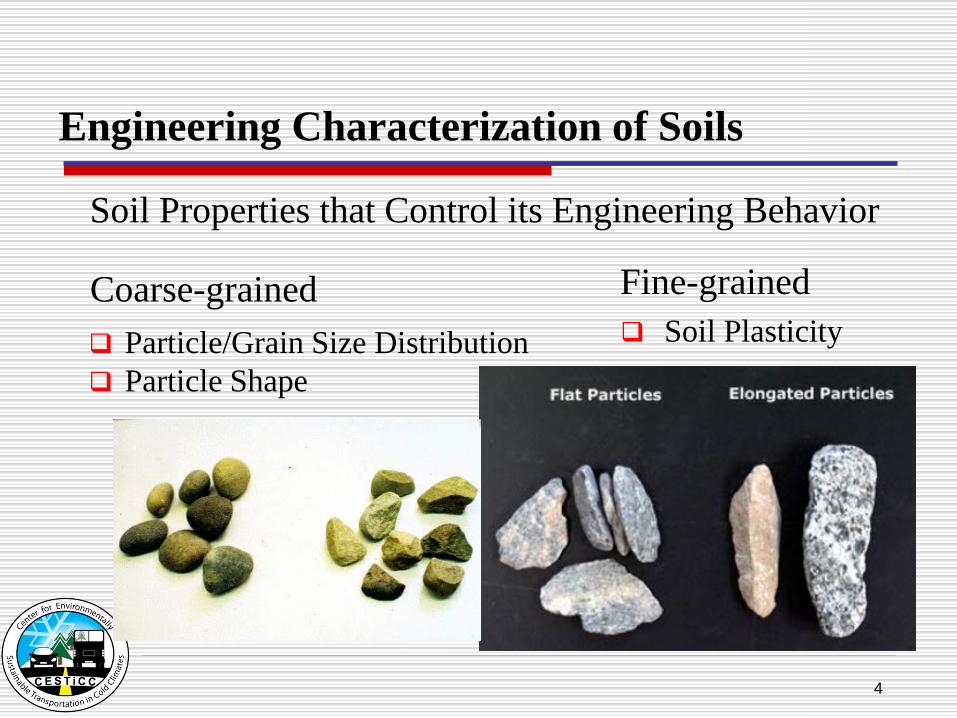
Engineering Characterization of Soils
Soil Properties that Control its Engineering Behavior
Particle/Grain Size Distribution Particle Shape
Soil PlasticityFine-grainedCoarse-grained

5
Coarse Aggregate Application

6
Fine-Grained Soil Application

7
Problems
Frost heave
Sand liquefaction
Non-uniform settlement

8
Purpose
Classifying soils into groups with similar behavior
Simple indicesGSD, LL, PI
Classification system
(Language)
Estimate engineering properties
Achieve engineering
purposesUse the
accumulated experience
Communicate between
engineers

9
Classification Systems
Two commonly used systems:
Unified Soil Classification System (USCS) American Association of State Highway and
Transportation Officials (AASHTO) System

10
Unified Soil Classification System
Origin of USCS: Developed by Professor A. Casagrande (1948) Modified by Professor Casagrande, the U.S. Bureau of
Reclamation, and the U.S. Army Corps of Engineers Four major divisions: Coarse-grained Fine-grained Organic soils Peat

11
Organic Soils
Highly organic soils- Peat (Group symbol PT) Composed primarily of vegetable tissue in various stages
of decomposition, Has a fibrous to amorphous texture, a dark-brown to
black color, and an organic odor. Organic clay or silt ( group symbol OL or OH):
Liquid limit (LL) after oven drying is less than 75 % ofits liquid limit before oven drying.

12
General Guidance
Coarse-grained soils:
Gravel Sand
Fine-grained soils:
Silt ClayNO.200
0.075 mm
•Grain size distribution •PL, LL•Plasticity chart
50 %
NO. 44.75 mm
Required tests: Sieve analysisAtterberg limits
LL>50 LL <50
50%

13
Symbols
Soil symbols: G: Gravel S: Sand M: Silt C: Clay O: Organic Pt: Peat
Liquid limit symbols: H: High LL (LL>50) L: Low LL (LL<50)Gradation symbols: W: Well-graded P: Poorly-graded
Examples: SW, Well-graded sandSC, Clayey sandSM, Silty sand

14
Particle Size Analysis
Sieve analysis – used for particle sizes larger than 0.075 mm in diameter (larger than the No. 200 sieve), ASTM C136
Hydrometer analysis – used for particle sizes smaller than 0.075 mm in diameter (passing the No. 200 sieve), ASTM D422

15
Step 1: a) Clean each sieve to remove
any left over soil. (use fine brush for the sieve with smaller mesh, don’t destroy the mesh)
b) Determine the masses of each sieve and the pan.
Sieve Analysis

16
Assemble the sieves in order with the sieve with the largest size opening on top and the pan underneath.
Place the soil sample into the top sieve.
4104080
200
Sieve Analysis

17
Place the stack of sieves on the shaker and secure them with the screws.
Set the shaker’s intensity level on 4 or 5 and the timer on 5 minutes.
Sieve Analysis

18
Remove the sieves from the shaker. Tap each sieve over a sheet of paper to make sure all of the appropriate particles have passed through.
Put any material that falls through into the next sieve.
Sieve Analysis

19
Sieve Analysis
Sieve # Diameter (mm)
Mass of soil retained on
each sieve (g)
% of soil retained on each sieve
% passing (% finer)
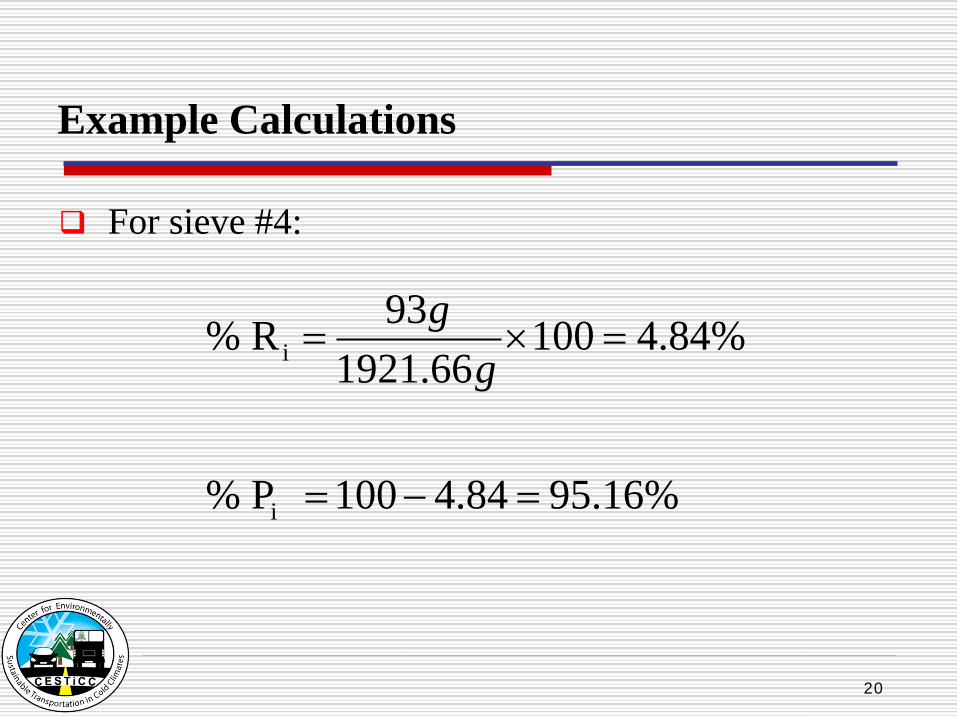
4 4.750 93.0 4.84 95.16
10 2.000 404.1
40 0.425 623.2
80 0.180 411.8
200 0.075 304.3
Pan - 85.2
Total weight of soil = 1921.6
20
Example Calculations
For sieve #4:
i
i
93% R 100 4.84%1921.66
% P 100 4.84 95.16%
gg
= × =
= − =

21
Gradation Chart

22
Connecting two Methods

23
Hydrometer Analysis
Based on the principle of spherical particle sedimentation in water.
In order to perform this test, a small amount of soil is mixed into a suspension
and the change in specific gravity due to the settling of the suspension is observed over time.

24
Using an 10-15 g of soil, determine the water content. (Microwave Oven Method)
Obtain the equivalent of 50 g of dry soil from the material passing the #200 sieve.
Hydrometer Analysis

25
Hydrometer Analysis
Mix the soil into a thick slurry using 125 mL of the distilled water-dispersing agent solution. (The deep blue one)
Mix the slurry in the stirring apparatus for 60 seconds.

26
Transfer to the sedimentation cylinder and fill with distilled water up to the 1000 mL mark.
Cover the cylinder using a rubber glove and mix it by turning the cylinder upside down and back for 1 minute.
Hydrometer Analysis

27
Place the cylinder down Insert the hydrometer, Take readings at 4, 15, 30, 60,
90, and 120 seconds.
Hydrometer Analysis

28
Connecting two Methods

29
Atterberg Limits
The physical and mechanical behavior of soils can be correlated to the liquid limit, plastic limit, and shrinkage limit. These form the boundaries between four states:
Solid Semisolid Plastic Liquid

30
Liquid Limit
The moisture content (%) at which a length of 13 mm along the bottom of the groove of the liquid limit device cup closes when receiving 25 blows.

31
Liquid Limit
Use portion of sample passing #40 (425mm) sieve.
Mix soil sample with water thoroughly with a spatula.
Using the spatula, spread the soil sample evenly over the bottom 2/3 of the cup.
Make a groove through the soil sample. Crank the cam (2 blow/sec) until you see the
groove in the sample close a distance alongthe groove of 13mm.

32
Liquid Limit
Liquid Limit
34 blows, 39%23 blows, 47%19 blows, 52%

33
Plastic Limit
Plastic Limit - Moisture content at which the soil crumbles when rolled into threads of 1/8 in diameter (3.175 mm).
Select about 1.5 to 2.0 g. Roll over the plate to slowly and evenly dry the soil.
Roll until the soil crumbles at 1/8 in. Collect at least 6 grams of soil, obtain a water content. This
water content is the plastic limit, PL.

34
Plasticity Index
Plasticity Index (PI) - The difference between the Plastic Limit and the Liquid Limit is called the Plasticity Index.
PI (%) Description0 Non plastic1-5 Slightly plastic5-10 Low plasticity10-20 Medium plasticity20-40 High plasticity>40 Very high plasticity
PI = LL - PL

35
Plasticity Chart
36
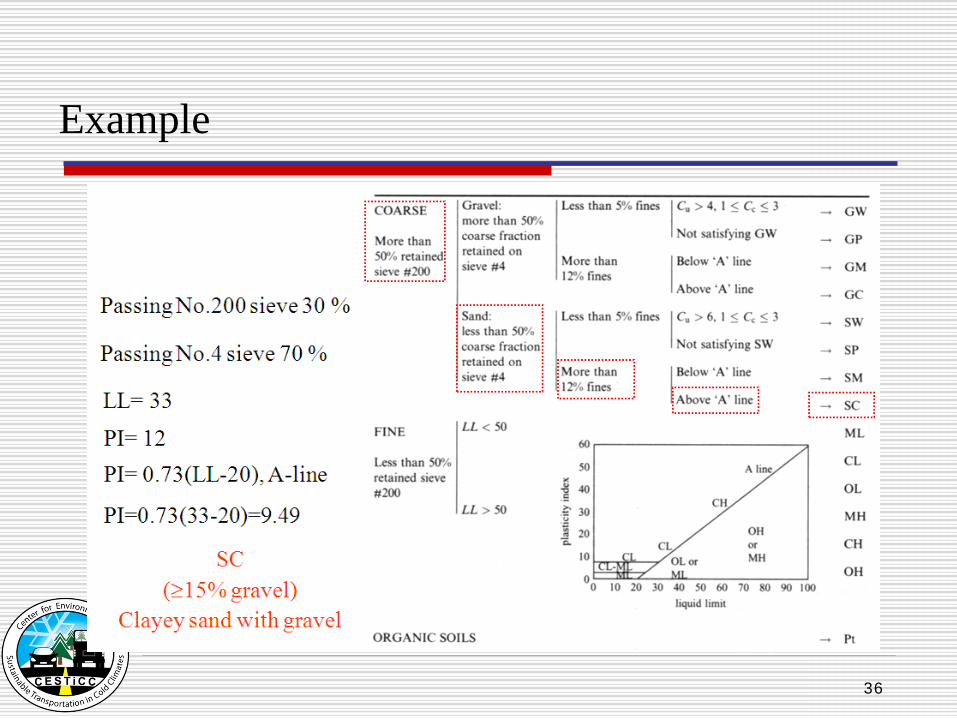
Example