laboratory 1. the scientific · pdf filelaboratory 1. the scientific method materials •...
TRANSCRIPT

| B I O 1 5 0 L a b o r a t o r y 1 1
Laboratory 1. The Scientific Method
MATERIALS
• Radish seeds • Petri dishes with germinating radish seeds LEARNING OUTCOMES Upon completion of the exercises in this laboratory, you should be able to: 1. List and Explain the stages of the scientific method 2. Establish a hypothesis 3. Collect, record and present experimental data 4. Perform simple statistical analyses 5. Write a scientific report (paper) Understanding our world and its surroundings is not a simple task. To accurately and reliably represent the world and its natural phenomena, scientists have adopted an unbiased approach to minimize personal, cultural, and/or religious beliefs. Throughout history, scientists have developed and fine-tuned a series of steps to perform unbiased studies, known as the scientific method. The scientific method is used to acquire new knowledge or to correct and improve upon previously established knowledge concerning the world and its phenomena. Exercise 1. The Process of Scientific Inquiry In its most basic form, the scientific method starts with an observation of a phenomenon and is followed by question(s) related to that observation. These questions can be easily grouped into “who, what, when, where, and how” categories. To answer such questions, a scientist will first perform background research to find out what is already known about an observed phenomena and/or similar events. This will speed up one’s scientific inquiry, and avoid unnecessary repetition of previously known and established facts, about a phenomenon. Equipped with that background knowledge, a scientist can then tentatively answer questions by establishing what is known as a hypothesis. A hypothesis is a possible (proposed) explanation for an observed phenomenon. This hypothesis might be valid (correct), partially valid, or completely invalid (wrong). How can one validate a hypothesis? The most accurate way scientists alter, confirm, or reject hypotheses is by performing carefully designed experiments that yield quantifiable data (information). An experimental design provides the necessary materials and procedures (protocols) necessary to produce meaningful data to alter, prove, or disprove a hypothesis. Experiments are carefully conducted and ideally only one component in their design (an independent variable) is affected by a procedure. This ensures that a measurable outcome of an experiment (a dependent variable) will be solely affected by alterations of an independent variable. The measured outcomes of an experiment are collected, documented, and organized for statistical analyses. This data can also be represented in the form of tables, graphs, and pictures. Analyzed data (also known as results) is discussed and

| B I O 1 5 0 L a b o r a t o r y 1 2
will be used to accept or reject a hypothesis. Ultimately, experimental results determine the validity of a hypothesis to explain an observed phenomenon (reach a conclusion). When a hypothesis is confirmed (accepted) by experimentation it adds to existing knowledge about a phenomenon and is therefore established as a scientific fact. If enough scientific facts concerning a phenomenon are collected, and all are consistent and supportive of each other, a scientific theory may be established. Contrary to the everyday usage of “theory” which suggests doubt, scientific usage of “theory” represents well-established scientific truths (facts) based upon experimental results. As an example, the Theory of Evolution (first proposed by Charles Darwin over 100 years ago) is a valid explanation for how life changed on our planet over the course of time. This theory has been established by countless hypotheses producing consistent experimental results to support its validity. The “Theory of Evolution” is the “Fact of Evolution” to a scientist. Alternatively, a hypothesis may be rejected or require revision. An altered hypothesis requires further experimentation to determine its own validity (see Figure 1.1). However, the rejection of a hypothesis is not seen as a failure to a scientist. Results based upon an invalid hypothesis may still provide valuable data for other experimentation. After any experiment results are briefly summarized and presented as conclusions. A scientist’s experimental design (materials and methods), collected and organized data (results), and conclusions are presented to other scientists in the form of scientific papers. These papers are found in scientific journals and can be read by others throughout the world. In this way, scientific papers (see Exercise 5) provide the background knowledge that others research prior to further experimentation. The entire process advances our understanding of our world and its phenomena.
Figure 1.1 The Scientific Method

| B I O 1 5 0 L a b o r a t o r y 1 3
Exercise 2. The Scientific Method Life on Earth thrives in many environments ranging from excessively hot to extremely cold, and from wet and humid to exceedingly dry. While some species, such as humans, can survive in a wide range of these conditions, others can only inhabit and successfully reproduce in more limited environments. Plants are found in many parts of the world, but specific species typically tolerate narrow environmental conditions permissive or optimal for growth and reproduction. All metabolic functions of plants begin to fail as conditions vary from their optimal range. One important factor affecting plant growth is typically the pH of the soil it resides in. For example, members of the Ericaceae family (azalea, bilberry, blueberry, cranberry) prefer soils with a pH range of 4.5 – 5.0, whereas lilac (Syringa vulgaris), a member of the Oleaceae family (jasmine, forsythia) prefers a pH range of 7.1 – 8.0. The wild radish (Raphanus raphanistrum) belongs to the family Brassicaceae (cabbage, broccoli, mustard). There are more than 20 varieties of radish plants, which are planted and grow in many areas of the world. Radish seeds can be used in germination studies as they germinate in moist environments without any special equipment or monitoring. Observations
Soils have different chemical and physical properties. Plants prefer certain soil properties, including specific pH range. The goal of every farmer is to produce the most produce, in this case radishes, with the available soil in the field. Modification of the soil’s properties is possible, and the first task will be to determine the optimal conditions for germination and growth of one variety of radishes for which the seeds are provided. Question
What is the optimal pH of the environment for increased germination rates of radish seeds? To be able to establish a hypothesis, some previous information related to the question should be researched. Background Knowledge
Using internet resources obtain information that is related to the observations and the question above to facilitate establishment of a hypothesis. In the space below write down any information that might be useful and help the establishment of a hypothesis.

| B I O 1 5 0 L a b o r a t o r y 1 4

| B I O 1 5 0 L a b o r a t o r y 1 5
Hypothesis
Equipped with the gathered knowledge try to answer the question about radishes from the previous page with a statement that can be experimentally tested. The hypothesis (statement) does not need to be very well defined, since the experimental portion of the scientific method will add some specificity. However, it should provide direction and include a statement about a variable, something to measure, so it leads to easier experimental design. For example, the observation that decreased temperature leads to the decline in the growth rate of many plants may lead to a very simple hypothesis: “Decreased temperature will affect the growth of plants.” But is this a well-written hypothesis? It repeats a known observation and does not provide direction for any experimental design. Another possible hypothesis could be: “Temperatures lower than 10 oC will decrease the growth of plants.” This is a more detailed hypothesis than the first as it provides some direction, states a variable, and the implies the possibility for measurements. However, it is too specific with a limited temperature range that not all plants might be affected by, and yet it is also too vague concerning what specific plant could be affected. Another hypothesis might be “The growth of the tobacco plant (family Nicotiana) will be affected by a decrease in temperature outside of its ambient range.” This hypothesis limits the research subject (the plant) to one family known to grow in a narrow range of temperatures. Background research would have shown that tobacco’s ambient temperature for optimal growth is 10 – 18 oC. It is still somewhat vague in what the effect might be, but the hypothesis provides a starting point for experimentation, and could be modified later based upon results. Formulate a hypothesis based upon the question concerning radishes on the previous page:
Rationale
State the reason(s) that led to the formulation of your hypothesis:
| B I O 1 5 0 L a b o r a t o r y 1 6
Testing the Hypothesis — Experimental Design
Experimental procedures must be carefully designed with a prepared list of appropriate materials (chemicals, equipment, etc.) prior to its execution. This is not a simple task. The procedure has to provide enough information for testing of the hypothesis. Go back to the original question about radishes and determine what variable should be tested in the experiment. The procedure should describe a specific condition to be altered, while all other conditions remain constant. The condition that will be altered is the independent variable in the experiment. What is the independent variable in this experiment?
What else needs to be included in the experimental design?
Except for the independent variable, all other components should remain constant in the experiment. What components, or conditions, need to be held constant?
Each experimental procedure must include controls. Controls establish that only an independent variable, and no others, are affecting results (changes in a dependent variable). Control measurements therefore serve as a point for comparison to data produced by altering an independent variable. Note that experiments concerning plant growth typically involve water which has its own pH value. Considering this information what are appropriate control(s) for the experiment:

| B I O 1 5 0 L a b o r a t o r y 1 7
Based on the experimental design, list or describe all the materials needed for the experiment:
The next step is to establish an experimental procedure that is a simple approach for testing a hypothesis. The approach establishes how data will be measured and collected for unbiased analyses. Simple experiments may provide data used to define more complex experiments in the future. Using the materials and equipment listed above, describe an experimental procedure testing the hypothesis concerning radish growth. The procedure should be simple and precise so that it could be consistently performed by any other scientist:
What would be measured in the experiment? This is the dependent variable. The experiment determines if this variable depends upon (is altered by) changes of the independent variable.
How can the collected data be clearly organized?
How can the data be presented in more visual ways to further clarify the results?

| B I O 1 5 0 L a b o r a t o r y 1 8
Collecting and Analyzing Data
The goal of an experiment is to provide useful and meaningful data for further analyses. To assure a successful outcome, an experiment must be carried out carefully and with precision. Careful note-taking is an integral part of any experiment, since it provides documentation of exactly how a procedure was performed. Since germination of radish seeds is a long process, experimental samples will be provided to you. The seeds were germinated upon Whatman paper moistened with 10 ml of various pH buffers for 5 days enclosed in 90 mm polystyrene Petri dishes. The germinating seedlings were kept in sunlight for 12 hours each day and additional buffers were added to replenish any loss due to evaporation. What needs to be measured to determine the germination rate of the radish seeds?
Organize the data in a table that is simple to understand. These are the results of the experiment. Two sets of data will be collected: one set from each group of 2-3 students, and another from the entire class. Why is it necessary to collect both group and entire class data?
| B I O 1 5 0 L a b o r a t o r y 1 9
Illustrating the Results
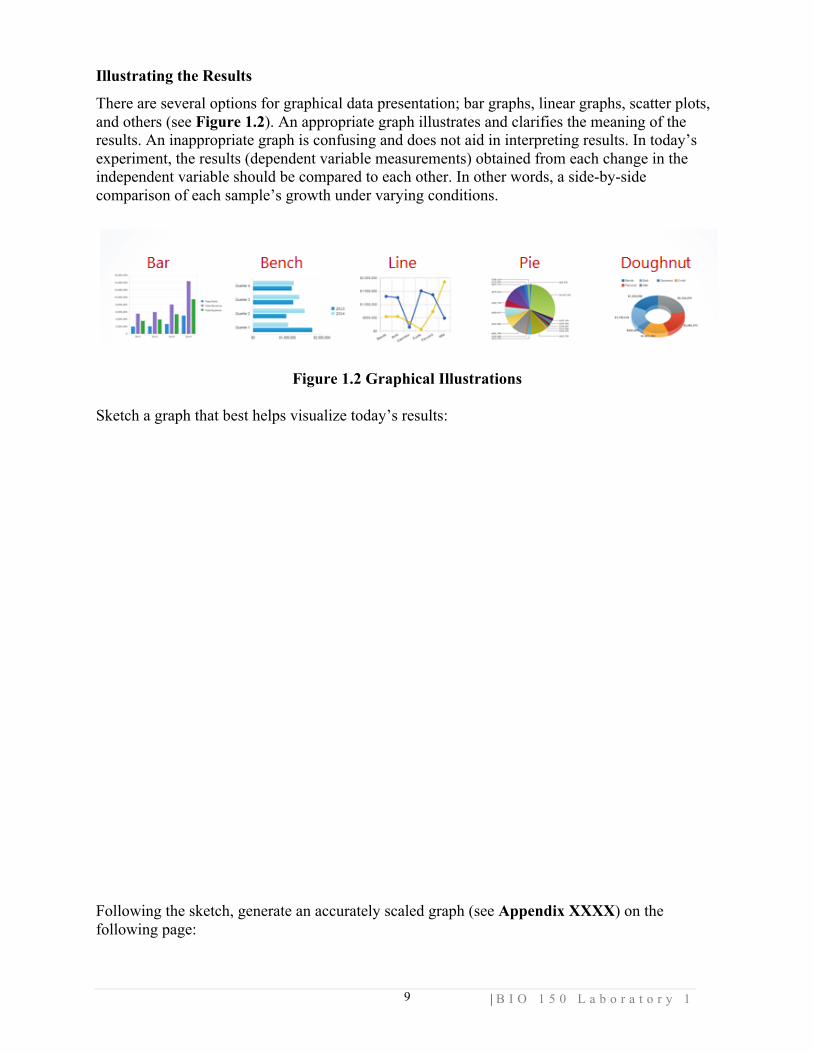
There are several options for graphical data presentation; bar graphs, linear graphs, scatter plots, and others (see Figure 1.2). An appropriate graph illustrates and clarifies the meaning of the results. An inappropriate graph is confusing and does not aid in interpreting results. In today’s experiment, the results (dependent variable measurements) obtained from each change in the independent variable should be compared to each other. In other words, a side-by-side comparison of each sample’s growth under varying conditions.
Figure 1.2 Graphical Illustrations Sketch a graph that best helps visualize today’s results: Following the sketch, generate an accurately scaled graph (see Appendix XXXX) on the following page:

| B I O 1 5 0 L a b o r a t o r y 1 10

| B I O 1 5 0 L a b o r a t o r y 1 11
Additional Data
To further illustrate the value of graphical data presentation Table 1.1 lists the results of monitoring radish plant growth with variable pH soil conditions over the course of 15 days. Measurements of 10 random plants grown in soil with differing pH were taken every 5 days. The data represents an average for each time point. Table 1.1 Average heights (mm) of tobacco plants grown at various pH conditions.
Soil pH Day 0 Day 5 Day 10 Day 15 4 1.2 1.3 1.3 0.0 (dead) 7 5.3 6.8 7.9 8.3 8 6.2 7.1 8.3 9.1 10 2.1 2.5 2.9 3.1
What would be the clearest type of graph to illustrate the results in Table 1.1? Is it the same graph type used to illustrate today’s results?
Sketch two different types of graphs and decide which is best for illustrating accurately on graph paper:

| B I O 1 5 0 L a b o r a t o r y 1 12

| B I O 1 5 0 L a b o r a t o r y 1 13
Analyzing Results — Discussion
Presentation of results is accompanied by explanations of those results in scientific papers. In this discussion section, a scientist explains their interpretation of the results and its significance. The section provides the “who, what, when, where, and how” comparisons amongst the illustrated samples. Ask a question related to the experiments that begins with “what” and try to answer it, using the background knowledge, the results, and logic:
Follow that with a question starting with “how” and try to answer it:
Looking critically at the results, compare those of several groups. Do they differ or are they similar? Do any results stand out? Are any tendencies observed?
How can you explain any gross discrepancies in results between groups?
Conclusions – Accepting or Rejecting the Hypothesis
Do the results of the experiments support (accept) or not agree with (reject) your initial hypothesis concerning the growth of radish plants under variable soil pH? The previous discussion of the results should answer this.
If the hypothesis is accepted, does this mean that the observations are fully explained? What else can be done to strengthen the hypothesis?

| B I O 1 5 0 L a b o r a t o r y 1 14
If the hypothesis is rejected, how can you restate (reformulate) the hypothesis and retest it?
Conclusions
Based upon the complete analyses of the results, state in one or two sentences what the overall conclusion of the experiment is. Essentially, the conclusion should represent a short answer to the question first proposed at the beginning of the lab.

| B I O 1 5 0 L a b o r a t o r y 1 15
Exercise 3. Reporting Scientific Findings (The Laboratory Report) The results and conclusions drawn from scientific research are presented in formal papers. All scientific literature is presented in similar ways to aid other researchers. Various guidelines have been established (listed below) which will assist you in writing a scientific report of today’s experiment. Lab Report Guidelines
1. The paper must be solely written by the author (not a group) in his/her own words. Any quotations from other sources should be identified and correctly referenced. Plagiarism is considered academic dishonesty, and as such is not allowed.
2. The paper should be typed on a computer and then printed on standard 8.5” x 11” white paper. The font should be minimally 12 points, and lines double spaced. The sections described below (Introduction, Materials and Methods, etc.) should be labeled as such and serve to separate the paper into parts.
3. A cover page should contain the following information:
a. The title of the paper: A short descriptive sentence that gives the general purpose of the experiment (e.g. The effect of XXXX on YYYY”).
b. List of authors: The individual writer of the paper is the first author, followed by all contributing individuals (members of the lab group).
c. A due date and actual date of submission.
4. The first section of the paper is entitled as the “Introduction” and provides brief (approximately 2 – 3 paragraphs) and relevant background information (referenced material), the overall question(s), and a hypothesis.
a. Since today’s lab deals with plant germination and growth, one paragraph should be sufficient. Include information on what germination is, the importance of its investigation, and how it relates to plant biology.
b. Referenced material (not original to you) is written in the present tense and must be cited and included within the Bibliography section. Referencing previously published literature is similar to quoting facts. Facts are (present tense) and exist at any time.
An example:
The harpsichord is difficult to tune and is surpassed by the more versatile piano in popular music (Doe, R.E. et. al., p.40).
c. The introduction should also describe the purpose of the experiments, but not the materials or methods to perform it.
| B I O 1 5 0 L a b o r a t o r y 1 16
5. The second section is entitled “Materials and Methods” and must be descriptive enough so that other researchers can reproduce the same experiment(s). This section is written in paragraph format (not a list) and includes a description of all materials used in any experiments (chemicals, equipment, solutions). It should be written in the past tense, stating what was done by the authors, and not written as directions to an individual (as in a laboratory manual).
For example:
Test tubes were placed in a water bath at 37 oC for 15 minutes. CORRECT.
I placed the test tubes in a water bath at 37 oC for 15 minutes. INCORRECT
6. The third “Results” section should include all the measured data in tables and represented in graphs and/or illustrations. The section also describes the data in paragraph form drawing attention to important points and tendencies. It is written in the past tense. Do not explain the results since that belongs in the next section.
7. In the fourth section labeled “Discussion” results are interpreted.
a. This section is used to explain what the data means and point out any flaws, or weaknesses, in the investigation. This is the most important section of the lab report because it shows how well the outcomes of the investigation are understood.
b. All the results and their significance to the initial question and hypothesis are included. A statement about the acceptance or rejection of the hypothesis should be made.
c. Any sources of error or difficulties that arose during the experiments are also included in this section.
d. This section is also written in the past tense unless describing other literature. Discussing previously published literature is similar to quoting facts. Facts are (present tense) and exist at any time.
e. The discussion should also have recommendations for future research that will guide other researchers to explore the topic in more detail
8. The fifth section is labeled “Conclusions” and is relatively brief. It summarizes the results, discussion, and significance of the data generated by the experiment(s). This section is written in the past tense.
9. The final section is labeled “Bibliography” or “References” and lists all sources that were used in the preparation of the report. References should be listed alphabetically by the primary author’s last name.
Typical examples (journal, book, web-page):
1. Crisp, R., Plasm, I.D., and Plan, T. (2003). The principles of splicing and ligation. Journal of Nucleic Acids 33 (15): 33-45.
2. Watts, O. N. (1965) The DNA Discovery and Perspectives; an Overview. Cold Spring Harbor Publishing.
3. Stud, N.T. (2007) My Ancestors Did not Define Me and Other Random Thoughts. www.randomthoungts.com/history/heredity.php

| B I O 1 5 0 L a b o r a t o r y 1 17
Appendix 1. The Metric System Scientists use the metric system as a simple, unifying, logical, and consistent system for measurement. The international system of metric or SI units (from the French for Le Système International d’Unités) was initially developed in France at the end of the 18th century. With modifications and improvements, it became the system universally used today. The United States, Myanmar, and Liberia are the only countries that do not routinely use metric units. The simplicity of the SI system’s metric units is multifold:
1. A set of seven base metric units (Table A 1.1) are used to mathematically describe all other units.
Table A 1.1 – SI Units
Measurement SI Unit Symbol Alternative Mass kilogram kg gram (g)
Length meter m Time second s
Temperature Kelvin K Celsius (oC) Amount of substance mole mol
Electrical current ampere A Luminosity candela cd
2. The metric system is decimal, based upon powers of ten, which greatly simplifies calculations. The system always follows the same rules eliminating confusion.
3. The system uses standard prefixes (see Table A 1.2) to alter the degree of a particular measurement that is universally and recognizably abbreviated.
For example, a meter (m) can be divided into 10 smaller decimeters (dm) so that a decimeter = 1/10 of a meter.
Table A 1.2 – Metric (SI) prefixes
Prefix Symbol Meaning Decimal Format Factor tera T trillion 1,000,000,000,000 1012 giga G billion 1,000,000,000 109 mega M million 1,000,000 106 kilo k thousand 1,000 103 hecto h hundred 100 102 deca da ten 10 101 base units m, l, g, etc. meter, liter, gram, etc. 1 100 deci d tenth 0.1 10–1 centi c hundredth 0.01 10–2 milli m thousandth 0.001 10–3 micro µ millionth 0.000001 10–6 nano n billionth 0.000000001 10–9 pico p trillionth 0.000000000001 10–12

| B I O 1 5 0 L a b o r a t o r y 1 18
4. Volume is a derived unit such that one cubic decimeter (dm3) of water is equivalent to one liter (l or L). One liter (1 L) of pure water at standard temperature and pressure (STP) has a mass of one kilogram (1 kg). One cubic centimeter (1 cm3 or 1 cc) of water at STP is a milliliter (ml or mL) with a mass of 1 gram (1 g).
5. Internationally temperature in everyday life is measured in degrees Celsius (°C). The Celsius scale is determined by the freezing (0 °C), and boiling (100 °C) points of pure water at STP. Between these two set points the scale is divided into 100 equal degrees (gradations) and so the scale is also known as Centigrade. The Fahrenheit scale divides the same points (pure water’s freezing at 32 °F and boiling at 212 °F) into 180 units. Normal human body temperature is 37 °C (98.6°F).
6. It is possible to convert measurements between older systems (such as the English system preferred by Americans) and the metric system. For example, 1 meter = 39.3701 inches (see Figure A 1.1).
Figure A 1.1 – Comparing Metric and English Measurements of Length