label-free quantitative proteomic analysis of the
TRANSCRIPT

RESEARCH Open Access
Label-free quantitative proteomic analysisof the inhibition effect of Lactobacillusrhamnosus GG on Escherichia coli biofilmformation in co-cultureHuiyi Song1, Ni Lou2, Jianjun Liu1, Hong Xiang1 and Dong Shang1,3*
Abstract
Background: Escherichia coli (E. coli) is the principal pathogen that causes biofilm formation. Biofilms are associatedwith infectious diseases and antibiotic resistance. This study employed proteomic analysis to identify differentiallyexpressed proteins after coculture of E. coli with Lactobacillus rhamnosus GG (LGG) microcapsules.
Methods: To explore the relevant protein abundance changes after E. coli and LGG coculture, label-free quantitativeproteomic analysis and qRT-PCR were applied to E. coli and LGG microcapsule groups before and after coculture,respectively.
Results: The proteomic analysis characterised a total of 1655 proteins in E. coli K12MG1655 and 1431 proteins inthe LGG. After coculture treatment, there were 262 differentially expressed proteins in E. coli and 291 in LGG. Geneontology analysis showed that the differentially expressed proteins were mainly related to cellular metabolism, thestress response, transcription and the cell membrane. A protein interaction network and Kyoto Encyclopaedia ofGenes and Genomes (KEGG) pathway analysis indicated that the differentiated proteins were mainly involved in theprotein ubiquitination pathway and mitochondrial dysfunction.
Conclusions: These findings indicated that LGG microcapsules may inhibit E. coli biofilm formation by disruptingmetabolic processes, particularly in relation to energy metabolism and stimulus responses, both of which are criticalfor the growth of LGG. Together, these findings increase our understanding of the interactions between bacteriaunder coculture conditions.
Keywords: Biofilm inhibition, Label-free quantitative proteomics, Lactobacillus rhamnosus GG microcapsules,Escherichia coli, Coculture
© The Author(s). 2021 Open Access This article is licensed under a Creative Commons Attribution 4.0 International License,which permits use, sharing, adaptation, distribution and reproduction in any medium or format, as long as you giveappropriate credit to the original author(s) and the source, provide a link to the Creative Commons licence, and indicate ifchanges were made. The images or other third party material in this article are included in the article's Creative Commonslicence, unless indicated otherwise in a credit line to the material. If material is not included in the article's Creative Commonslicence and your intended use is not permitted by statutory regulation or exceeds the permitted use, you will need to obtainpermission directly from the copyright holder. To view a copy of this licence, visit http://creativecommons.org/licenses/by/4.0/.The Creative Commons Public Domain Dedication waiver (http://creativecommons.org/publicdomain/zero/1.0/) applies to thedata made available in this article, unless otherwise stated in a credit line to the data.
* Correspondence: [email protected] Laboratory of Integrative Medicine, First Affiliated Hospital of DalianMedical University, 222 Zhongshan Road, Dalian 116023, P. R. China3The Third Department of General Surgery, First Affiliated Hospital of DalianMedical University, Dalian, Liaoning, P. R. ChinaFull list of author information is available at the end of the article
Song et al. Proteome Science (2021) 19:4 https://doi.org/10.1186/s12953-021-00172-0

BackgroundBiofilms are complex bacterial community structuresthat can attach to surfaces. They connect to a surfacevia extracellular polymeric substances (EPS), whichform a matrix composed primarily of polysaccharides,proteins and DNA; this encapsulates the bacteria [1].Biofilms not only cause economic losses but alsopresent a public health hazard. This is because thebacteria present within biofilms are much more resist-ant to antibiotics, disinfectants [2] and host immunesystem effectors [3]. Therefore, it is critical to developeffective non-toxic—or less toxic—antifungal agentswith novel modes of action.A recent study suggested that probiotic superna-
tants have antibiofilm formation properties [4], whichimplies that probiotics may inhibit biofilm formationthrough cell-cell communication. However, there hasbeen little progress in this field to date. In our previ-ous study, bacteria immobilised in microcapsulesshowed superior biofilm inhibition capacity comparedto probiotic sterile culture supernatant. Accordingly, aLactobacillus rhamnosus GG (LGG) microcapsule–planktonic Escherichia coli (E. coli) coculture modelwas established to evaluate the biofilm inhibition ef-fect [5]. However, the possible antibiofilm molecularmechanisms of LGG microcapsules have not yet beeninvestigated.Proteomic analysis for global protein identification is a
powerful tool and has emerged as an important approachfor extracting detailed information on cellular regulatorymechanisms at the protein level. Label-free quantitativeproteomics provides a straightforward option for large-scale analysis of biological samples. In contrast to label-based methods, label-free quantitative proteomics has sev-eral advantages as it is cost-effective and does not requireexpensive labeling reagents. Also, label-free quantitativeproteomics is not time-consuming compared to somelabel-based methods as these require tedious labelingsteps [6]. For all these reasons, label-free quantitative pro-teomics has gained widespread acceptance in biomedicalresearch, such as for the analysis of bodily fluids (blood,plasma, saliva, and urine), cell lines and tissues [7, 8].In the present study, coculture experiments and prote-
omic analyses were performed to further advance under-standing of such interactions and the potentialunderlying mechanisms. A label-free quantitative prote-omic approach was used to identify proteins with signifi-cantly changed expression profiles during the E. coli andLGG microcapsule coculture process. Ultimately, thesefindings will contribute to an increased understanding ofthe possible molecular action of LGG microcapsulesagainst E. coli biofilm formation and provide a powerfulplatform for future mechanistic studies of bacterialinteractions.
Materials and methodsBacterial strains and materialsLGG and E. coli K12MG165 were obtained from theAmerican Type Culture Collection (ATCC 53103 andATCC 47076). LGG was cultured in a modified MRSbroth in which glucose was replaced by galactose underanaerobic conditions at 37 °C. E. coli strains were cul-tured at 37 °C in Luria-Bertani broth [9]. Cell suspen-sions were subsequently used as described below.Sodium alginate was purchased from the Qingdao
Crystal Salt Bioscience and Technology Corporation(Qingdao, Shandong, China). Chitosan was degradedfrom raw chitosan using the chemical method (YuhuanOcean Biomaterials Corporation, China). All other re-agents and solvents were of analytical grade and wereused without further purification.
Preparation of LGG microcapsulesLGG alginate beads were prepared using the emulsifica-tion/internal gelation technique, as described previously[10]. Briefly, sodium alginate powder was dissolved in0.9% (w/v) NaCl solution to obtain a final concentrationof 1.5% (w/v). The cell pellet was obtained by centrifuga-tion at 10,000 rpm for 5 min. The cells and micro-crystalline CaCO3 powder were finely dispersed in sterilesodium alginate solution. Then, the alginate-calciumsalt-cell suspension and 200 mL of liquid paraffin con-taining 0.5% (v/v) Span 85 were stirred in a turbine re-actor at 200 rpm for 30 min. After 30 min ofemulsification, glacial acetic acid was added for gelifica-tion following which 500 mL of deionised water wasadded with stirring for 30 min at 200 rpm. The cell-entrapped calcium alginate beads with an initial cellnumber of about 1.0 × 10⁶ CFU/mL beads were thenrinsed with 1% (v/v) Tween 80 solution and distilledwater and were then stored in water at 4 °C.
Preparation of LGG alginate–chitosan microcapsulesChitosan solution was dissolved in 0.1M acetate buffer.The cell-entrapped calcium alginate beads wereimmersed in 0.5% (w/v) chitosan solution by gentlyshaking at a bead/solution ratio of 1:5 (v/v). After rinsingand liquefication for 6 min using 0.055M sodium citrate,the cell-entrapped alginate-chitosan microcapsules wereformed.
Characterisation of microcapsulesMicrocapsule size was examined with a Counter CoulterLS130 particle size analyser, which has a size range of0.1 to 1000 μm. Optical images were observed under aNikon Eclipse TE2000 Inverted Research Microscope(Nikon Corp., Japan).
Song et al. Proteome Science (2021) 19:4 Page 2 of 14

Biofilm thickness detection by confocal microscopyBiofilm thickness was detected according to a previouslypublished method, with minor modification [11]. Afterincubation, the microscope slides with biofilm from eachgroup were gently rinsed with deionised water to removeunattached cells and then stained with SYTO9/propi-dium iodide according to the instructions of the L13152LIVE/DEAD BacLight bacterial viability kit (InvitrogenMolecular Probes, USA). After staining for 30 min, ster-ile PBS was used to remove the planktonic dyes and bac-teria, and the stained coverslips were visualised under aconfocal laser scanning microscope (Leica SP8,Germany) at an excitation wavelength of 488 nm and200× magnification. Three-dimensional biofilm imageswere obtained using CLSM software. Image stacks ofthree random spots were collected from three sets ofbiofilm samples and saved in “tif” format.
Preparation of cell samples and experimental groupingBriefly, LGG microcapsules were cocultured with plank-tonic E. coli for 48 h for biofilm inhibition, as reportedpreviously [5]. At the end of coculture, the biofilm wasmeticulously scraped off the well wall using a sterilescalpel. The E. coli cells in the biofilm were collected bysonication using high-intensity focused ultrasound(UTR2000, Hielscher); these were denoted as group A.Group A was lysed in medium containing 4% w/v so-dium dodecyl sulphate (SDS), 0.1 mM dithiothreitol(DTT), and 100 mM Tris-HCl at pH 8.2. At the sametime, the LGG microcapsules were collected after cocul-ture and the entrapped LGG cells were released fromthe microcapsules according to a previously describedmethod [12]; these were denoted as group B. E. coli pureculture (denoted as group C) and 48 h LGG microcap-sules pure culture (denoted as group D) were used asthe negative controls.
Protein extraction and digestionTo the samples was added 1mL of lysis buffer contain-ing 8M urea and 10% protease inhibitor and the result-ing mixture carefully transferred 1.5 mL microfugetubes. The samples were sonicated using a probe sonica-tor, then centrifuged at 14,000×g for 30 min, followingwhich the supernatant was collected. The protein con-centration was determined using the Bradford methodand the remainder of the sample was frozen to − 80 °C.From each sample, 50 μg of total protein was used for
further analysis. The samples were diluted with ammo-nium bicarbonate (ABC) buffer, which allowed for asteady pH value of approximately 7.0 for eight times,and then reduced with 200 mM of DTT solution and in-cubated at 37 °C for 1 h. The samples were digestedovernight with trypsin (trypsin:protein = 1:25) at 37 °C.After concentration using a Speedvac (Thermo Savant
SPD121P, Thermo Scientific, Wohlen, Switzerland), eachsample was reconstituted in 3% acetonitrile (ACN) and0.1% formic acid (FA).
Protein fractionation by reverse-phase liquidchromatographyThe next day, 50 μL of 0.1% formic acid (FA) was addedto the incubated mixture to terminate the digestion. AC18 column was washed with 100% ACN followed by0.1% FA and centrifuged at 1200 rpm for 3 min. TheEppendorf (EP) tube was replaced and the sample (≤30 μg) was added and then centrifuged at 1200 rpm for3 min. The samples were washed once with 100 μL ofpH 10 water. After this process, the sample was elutedwith 10 gradients of ACN in pH 10 water at the follow-ing concentrations: 6% (i.e. 60 μL ACN, 940 μL pH 10water), 9, 12, 15, 18, 21, 25, 30, 35 and 50%. Next, theeluent from the 6, 12, 15, 25 and 35% gradients werecombined in one tube while the 9, 18, 21, 30 and 50%gradients were combined in another tube, thus dividingthe sample into two fractions. The sample fractions werethen lyophilised and stored at − 80 °C until loading.
Peptide identification by liquid chromatography withtandem mass spectrometry (LC-MS/MS)Samples were injected onto an in-house pulled andpacked tip column (length 8 cm) carrying Magic C18AQ beads (3 μm bead size, 200 Å pore size; BishoffChromatography, Leonberg, Germany), 75 μm ID, 375OD capillary, coupled to an Eksigent nanoLC-1D device(ABSciex, Zug, Switzerland). They were then separatedusing a binary solvent system with a flow rate of 200 nL/min, eluted using a gradient from 2 to 30% B over 60min (A:1% ACN, 0.1% FA, B: 100% ACN, 0.1% FA) andacquired using an LTQ Orbitrap (ThermoScientific,Wohlen, Switzerland) equipped with a nanospray ionsource running a standard collision-induced data-dependent (CID-DDA) method of one survey (MS) scanfollowed by ten dependent scans (MS/MS) loopedthroughout the run. The survey scan was acquired from300 to 2000m/z units in profile mode with a resolutionof 30,000 in the Orbitrap. The dependent scans were ac-quired in centroid mode in the ion trap with a collisionenergy of 35, activation energy of 0.25 and 30 ms activa-tion time, excluding singly charged ions for fragmenta-tion. Dynamic exclusion was applied with a list size of500 that was repeated every 30 s and with a duration of90 s.
Protein identificationThe Uniprot_Escherichia coli (2019.4.20 download) data-base and the Uniprot_Lactobacillus rhamnosus(2019.7.25 download) database were used. The MS/MSdata were processed using Maxquant 1.5.2.8 software
Song et al. Proteome Science (2021) 19:4 Page 3 of 14

and the identification parameters set with a precursorion mass tolerance of ±15 ppm, fragment ion mass toler-ance of ±0.5 Da, maximum of two missed cleavages,static modification with carboxyamidomethylation(57.021 Da) of the Cys residues, and dynamic modifica-tion with oxidation modification (+ 15.995 Da) of theMet residues. According to the primary data analyses,protein and peptide FDR were set to 0.01 (1%), thedecoy database was set to revert and the minimum pep-tide number was 1 for the identified proteins. Data withp ≤ 0.05 and a difference ratio of ≥1.2 were selected forfurther analysis. The statistical analyses of the LC-MS/MS data were performed using Perseus (v1.4.1.3).
Bioinformatic analysis of identified proteins andprediction of promoters in intergenic regionsA functional category gene enrichment test was per-formed using Blast 2GO to determine whether there wasenrichment in any functional subcategories. The numberof differentially expressed proteins was imported intoIPA (Ingenuity Pathway Analysis) software and used toperform protein biological pathway analysis based on theGene Ontology (GO) and UniProt databases.
Quantitative real-time PCR (qRT-PCR) analysisLGG microcapsules were cocultured with planktonic E.coli for 48 h. The cells were then pelleted by centrifuga-tion at 5000 rpm for 5 min at 4 °C and then resuspendedin 1 mL TRIzol (Invitrogen, Carlsbad, CA) for total RNAisolation, according to the manufacturer’s protocol. Re-sidual genomic DNA was then removed by treating iso-lated RNA with a Turbo DNAfree kit (Ambion, Austin,TX). Then, cDNA was synthesised using the PrimeScriptRT Master Mix (Takara), according to the manufac-turer’s instructions. qRT-PCR amplifications were per-formed with at least three biological replicates using 2 ×SYBR Premix Ex TaqTM II (DRR081A, Takara) withStratagene MX3000P (Agilent Technologies, CA, USA).The housekeeping gene 16S rRNA was used as a controlfor normalisation. The qRT-PCR primers are providedin Table S1. The data were normalised against 16SrRNA and the p-values from Student’s t-tests are re-ported as follows: * ≤ 0.05, ** ≤ 0.01, and *** ≤ 0.001.
Detection of antibiotic resistanceThe antibiotic resistance of the E. coli coculture withLGG microcapsules was determined using the inhibitionzone method [13]. The E. coli culture before and aftercoculture was used as the test strain and inoculated intoLB solid medium at 1% of the total amount. After solidi-fication, 1 cm diameter filter paper with 500 μg/mL,50 μg/mL or 5 μg/mL ampicillin (Amp) was impregnatedon the inoculated agar plates and incubated for 24 h at37 °C. The blank medium was the negative control. After
incubation, the diameter of the inhibition zone (accurateto 0.1 mm) was measured.
ResultsThe inhibition effect of LGG microcapsules on E. colibiofilm formationThe LGG microcapsules appeared spherical, were welldispersed in the solution and were relatively uniform insize. Because of the high cell count of the microcapsulesat the end of culturing, which resulted in the appearanceof dark microcapsule density, the cells occupied almostall of the inner space (Fig. 1 a and b). The diameter ofthe microcapsules entrapped with LGG was about200 μm (Fig. 1c). The observed reduction in the intensityof fluorescence provided evidence of biofilm inhibition,with the confocal software analysis showing that the E.coli biofilm thickness was decreased from 25.2 ± 1.3 μmto 12.3 ± 0.9 μm after coculture (Fig. 1d).
Global proteomic analysis of E. coli and LGG before andafter coculture treatmentE. coli in the biofilm functional genome was evaluated atthe proteome level in response to LGG microcapsules,before and after coculture. The experiments were per-formed in biological triplicates. Proteins from total bac-terial lysates were extracted and digested in solution andthe resulting peptides were analysed using LC-MS/MS[14]. In total, 76,382 matched spectra resulted in 12,236matched peptides assembled into 1655 proteins ingroups A and group C, and 58,028 matched spectra ledto 10,321 matched peptides assembled into 1431 pro-teins in groups B and D (Additional files 1 and 2). Dif-ferential expression was considered as proteins that weresignificantly different with an ANOVA p-value < 0.05and with at least a 1.2-fold change (cut-off value), asshown in the Venn diagram in Fig. 2a. For E. coli, therewere 20 proteins not identified in group C but identifiedin group A, while 68 proteins identified in group C werenot identified in group A. For LGG, there were 35 pro-teins not identified in group D but identified in group B,while there were 16 proteins identified in group D thatwere not identified in group B. Detailed information onthese differentially expressed proteins is given in Add-itional files 3 and 4. Hierarchical cluster analysis wasperformed for the coculture and control groups. Asshown in Fig. 2b, the common differentially expressedproteins in the coculture groups did not cluster with theones in the control groups.The next focus was on the common differentially
expressed proteins identified both before and after co-culture. As shown in Table 1 and Fig. S1, for E. coli atotal of 262 differentially expressed proteins were identi-fied in groups A and C, among which 31 proteins wereupregulated and 231 proteins were downregulated. For
Song et al. Proteome Science (2021) 19:4 Page 4 of 14

LGG, 291 proteins were identified in groups B and D,among which 104 proteins were upregulated and 187proteins were downregulated. The top 10 most differen-tially expressed proteins in both strains are shown in Ta-bles 2 and 3.
Functional categorisation of common differentiallyexpressed proteins in E. coli and LGGThe possible functions of the common differentiallyexpressed proteins were investigated. The functions ofthe regulated bacterial proteins were enriched accordingto GO terms, with the redundant GO terms summarisedand unified.
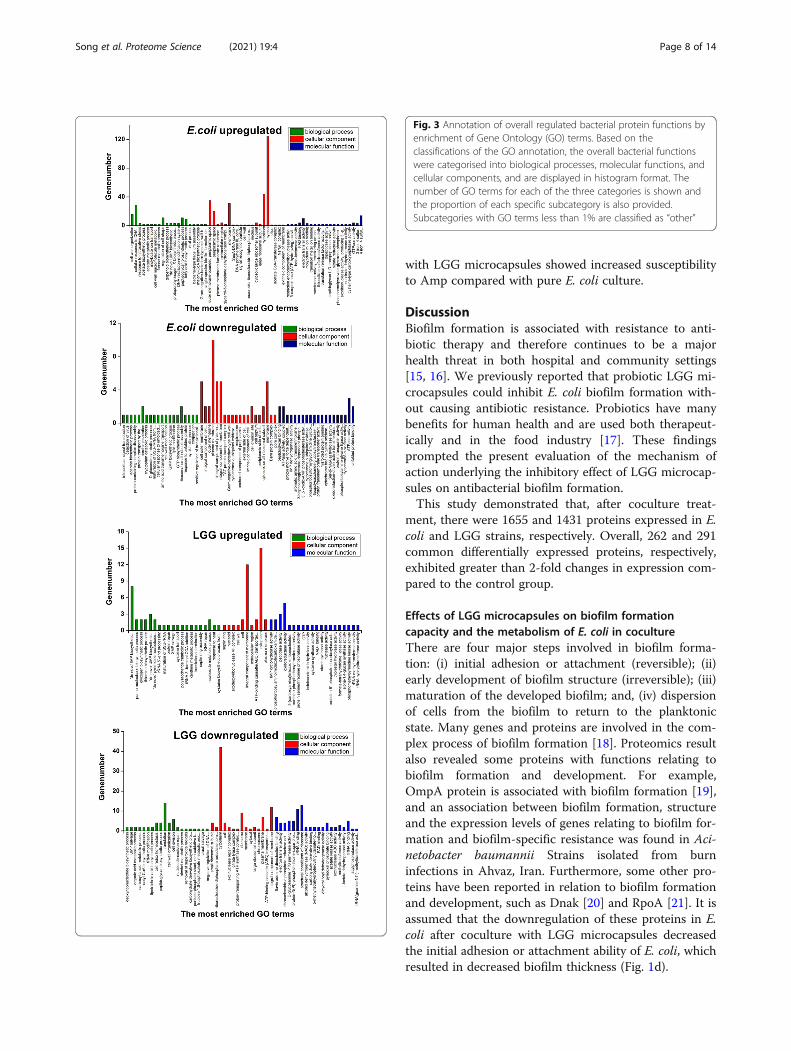
Functional categorisation of common differentiallyexpressed E. coli proteinsA total of 358, 356 and 50 GO terms relating to molecu-lar function, biological processes and cellular compo-nents, respectively, were generated based upon theupregulated proteins in E. coli after coculture; a total of56, 57 and 26 GO terms, respectively, were generatedbased upon the downregulated proteins. Among the GOterms for biological processes, “cellular response toDNA damage stimulus” (22.75%) was the most commonfunction in upregulated proteins in the E. coli coculture
group. Among the GO terms for cellular components,the most common upregulated proteins belonged to“cytosol” (33.86%), while the most common downregu-lated proteins belonged to “plasma membrane” (12.58%).For molecular function, 13.51% of up- and 11.69% ofdownregulated proteins were related to “4 iron, 4sulphur cluster binding” and “ATPase activity”, respect-ively (Fig. 3).
Functional categorisation of common differentiallyexpressed LGG proteinsA total of 211, 138 and 20 GO terms for molecular func-tion, biological processes and cellular components, re-spectively, were generated: 85, 50 and 10 GO terms,respectively, were related to upregulated proteins inLGG after coculture, while 150, 102 and 15 GO terms,respectively, were related to downregulated proteins.Among the GO terms for biological processes, “carbohy-drate metabolic process” (22.75%) was the most com-mon function in upregulated proteins in the coculturegroup. Among the GO terms for cellular components,the most common upregulated proteins belonged to“cytoplasm” (33.86%), while the most common downreg-ulated proteins belonged to “ATP binding” (12.58%). Formolecular function, 17.92% of up- and 16.55% of
Fig. 1 Optical images of LGG microcapsules produced by the emulsification/internal gelation technique (bar = 100 μm) at (a) 0 h culture and (b)24 culture. c Size distribution of LGG microcapsules produced by the emulsification/internal gelation technique. d Confocal laser scanningmicroscopy images of E. coli biofilm formation after coculture with LGG microcapsules for 24 h
Song et al. Proteome Science (2021) 19:4 Page 5 of 14

downregulated proteins were related to “oxidoreductaseactivity” and “structural constituent of ribosome”, re-spectively (Fig. 3).
Pathway analysisAs shown in Table 4, in E. coli the common differen-tially expressed upregulated proteins were enriched inthe fatty acid biosynthesis, biotin metabolism and ni-trogen metabolism pathways and the common differ-entially expressed downregulated proteins wereenriched in the purine metabolism, oxidative phos-phorylation and protein export signaling pathways.However, in LGG strains, as shown in Table 5, therewere no upregulated pathways enriched in the KEGGanalysis, and the common downregulated signalingpathways were galactose metabolism, amino sugar andnucleotide sugar metabolism, and metabolic pathways.By exploring the possible global protein-protein inter-actions (PPIs; Fig. 4), and in combination with Tables2 and 3, several genes in E. coli and LGG were iden-tified for subsequent analysis.
Confirmation of the target proteins of E. coli and LGG atthe mRNA level in the coculture modelqRT-PCR analysis of selected targets was conducted tovalidate the observed differentially expressed protein levels(Fig. 5). In line with the findings from the global prote-omic analysis, increased bioD2, panD and ygiW mRNAlevels in E. coli were observed. The mRNA levels of bamEand dnaK, which encode downregulated expression at thetranscription level, were also quantified. Additionally,given the extensive effect of LGG microcapsules on bio-film inhibition, the mRNA expression levels of purD andpurM were found to be upregulated 3.1-fold and 7.3-fold,respectively. The mRNA levels of murB, murF and ackAwere also decreased after coculture with E. coli for 48 h.
Antibiotic resistanceThe antibiotic resistance of E. coli obtained from pureculture and after coculture with LGG microcapsules wasdetermined. The results showed that the E. coli anti-biotic resistance was concentration-dependent: the in-hibition zone of the E. coli pure culture was 9.1 ± 1.2
Fig. 2 a Venn diagram summarising the common and differentially expressed proteins before and after coculture. b Hierarchical cluster ofproteins differentially expressed in (a) E. coli before coculture (group C) and after coculture (group A), and (b) LGG before coculture (group D) andafter coculture (group D). Red represents high expression and blue represents low expression. Two main clusters of proteins can be observed,one upregulated (right) and the other downregulated (left)
Song et al. Proteome Science (2021) 19:4 Page 6 of 14

mm, 2.1 ± 0.2 mm and 0.2 ± 0.03 mm at the three de-creasing Amp concentrations, respectively; furthermore,the inhibition zone of E. coli after coculture was 11.1 ±0.93 mm, 3.4 ± 0.76 mm and 0.98 ± 0.03 mm, respect-ively, each of which was significantly larger than the in-hibition zone of the E. coli pure culture at different Ampconcentrations. Negative controls did not show any in-hibitory effect on the growth of tested bacteria (Fig. 6).Antibiogram results revealed that E. coli after coculture
Table 1 Number of common differentially expressed proteinsthat were modified 2-fold (up- or downregulation) in differentexperimental groups
Strains Comparisons (Before coculture/After coculture)
Upregulated proteins Downregulatedproteins
E.coli (groupA+groupC) 31 231
LGG (groupB+groupD) 104 187
Table 2 Most highly common differentially upregulated anddownregulated proteins in E.coliUpregulatedprotein
ProteinID
p value Log2FC Protein description
bioD2 P0A6E9 2.10E-05
1.71 ATP-denpendent dethiobiotinsynthetase BioD2
panD P0A790 5.20E-05
3.63 Aspartate 1-decarboxylase
rpsP P0A7T3 2.83E-04
1.86 30S ribosomal protein S16
hybC P0ACE0 3.31E-04
2.01 Hydrogenase-2 large chain
rhIB P0A8J8 3.77E-04
1.06 ATP-dependent RNAhelicase RhlB
mlaC P0ADV7 4.10E-04
3.60 Intermembrane phospholipidtransport system bindingprotein MlaC
fimA P04128 5.11E-04
1.81 Type-1 fimbrial protein,A chain
hdeA P0AES9 7.83E-04
1.17 Acid stress chaperoneHdeA
cysQ P22255 1.89E-03
1.41 3′(2′),5′-bisphosphatenucleotidase CysQ
ygiW P0ADU5 2.06E-0 2.17 Protein YgiW
Downregulatedprotein
ProteinID
P value Log2FC Protein description
bamE P0A937 9.90E-04
−0.90 Outer membrane proteinassembly factor BamE
yejL P0AD24 1.29E-03
−3.09 UPF0352 protein YejL
rpsN P0AG59 2.60E-03
−2.17 30S ribosomal protein S14
gpmA P62707 4.76E-03
−0.52 2,3-bisphosphoglycerate-dependent phosphoglyceratemutase
dnaK P0A6Y8 9.35E-03
−0.27 Chaperone protein DnaK
sohB P0AG14 1.43E-02
−0.45 Probable protease SohB
ychF P0ABU2 1.63E-02
−0.35 Ribosome-binding ATPaseYchF
guaB P0ADG7 2.64E-02
−0.97 Inosine-5′-monophosphatedehydrogenase
ftsX P0AC30 3.38E-02
−2.46 Cell division protein FtsX
ompA P0A910 4.93E-02
−1.08 Outer membrane protein A
Table 3 Most highly common differentially upregulated anddownregulated proteins in LGGUpregulatedprotein
Protein ID p value Log2FC Protein description
CCE29_04955 A0A1Y0DVK9 2.40E-05
1.76 Pilus assemblyprotein
LRHMDP2_922 K8QM21 4.30E-05
1.15 NADPH:quininereductase relatedZn-dependentoxidoreductase
CCE29_07950 A0A1Y0DXE7 9.90E-05
2.01 Iron-sulfur clusterbiosynthesis familyprotein
AAULR_10650 F3N0G5 1.11E-04
3.68 Membrane protein
CCE29_03735 A0A2A5L8F8 1.23E-04
4.07 ABC transportersubstrate-bindingprotein
CCE29_04965 A0A1Y0DVP1 2.67E-04
2.78 Pilus assembleprotein
N507_1524 A0A249N5Y8 6.08E-04
0.80 Uncharacterizedprotein
LRHMDP2_518 K8QF03 7.93E-04
1.54 Uncharacterizedprotein
purD A0A1Y0DZS2 1.60E-03
1.79 Phosphoribosylamine-glycine ligase
purM A0A1Y0DZP0 1.63E-03
1.79 Phosphoribosylfomyglycinamidinecyclo-ligase
Downregulatedprotein
Protein ID p value Log2FC Protein description
rpoC K8QEG2 8.00E-06
−0.55 DNA-directed RNA polymerasesubunit beta′
secA A0A249DE52 9.30E-05
−0.87 Protein translocase subunit SecA
murB A0A3S4R547 2.81E-04
−2.82 UDP-N-acetylenolpyruvoylglucosamine reductase
murF A0A2A5L3G4 3.21E-04
−0.82 UDP-N-acetylmuramoyl-tripeptide-D-alanyl-D-alanineligase
rplV K8Q8J1 3.43E-04
−0.96 50S ribosomal protein L22
ddl A0A1Y0DWH7 3.73E-04
−1.54 D-alanine-D-alanine ligase
LRHMDP2_1796
K8Q7G6 4.26E-04
−2.21 6-phospho-beta-glucosidase
N507_1229 A0A249N444 4.62E-04
−2.42 50S ribosomal protein L16
ackA K8Q7E5 8.56E-04
−0.64 Acetate kinase
lpdA A0A1Y0DTI9 1.75E-03
−1.08 Outer membrane protein A
Song et al. Proteome Science (2021) 19:4 Page 7 of 14
with LGG microcapsules showed increased susceptibilityto Amp compared with pure E. coli culture.
DiscussionBiofilm formation is associated with resistance to anti-biotic therapy and therefore continues to be a majorhealth threat in both hospital and community settings[15, 16]. We previously reported that probiotic LGG mi-crocapsules could inhibit E. coli biofilm formation with-out causing antibiotic resistance. Probiotics have manybenefits for human health and are used both therapeut-ically and in the food industry [17]. These findingsprompted the present evaluation of the mechanism ofaction underlying the inhibitory effect of LGG microcap-sules on antibacterial biofilm formation.This study demonstrated that, after coculture treat-
ment, there were 1655 and 1431 proteins expressed in E.coli and LGG strains, respectively. Overall, 262 and 291common differentially expressed proteins, respectively,exhibited greater than 2-fold changes in expression com-pared to the control group.
Effects of LGG microcapsules on biofilm formationcapacity and the metabolism of E. coli in cocultureThere are four major steps involved in biofilm forma-tion: (i) initial adhesion or attachment (reversible); (ii)early development of biofilm structure (irreversible); (iii)maturation of the developed biofilm; and, (iv) dispersionof cells from the biofilm to return to the planktonicstate. Many genes and proteins are involved in the com-plex process of biofilm formation [18]. Proteomics resultalso revealed some proteins with functions relating tobiofilm formation and development. For example,OmpA protein is associated with biofilm formation [19],and an association between biofilm formation, structureand the expression levels of genes relating to biofilm for-mation and biofilm-specific resistance was found in Aci-netobacter baumannii Strains isolated from burninfections in Ahvaz, Iran. Furthermore, some other pro-teins have been reported in relation to biofilm formationand development, such as Dnak [20] and RpoA [21]. It isassumed that the downregulation of these proteins in E.coli after coculture with LGG microcapsules decreasedthe initial adhesion or attachment ability of E. coli, whichresulted in decreased biofilm thickness (Fig. 1d).
Fig. 3 Annotation of overall regulated bacterial protein functions byenrichment of Gene Ontology (GO) terms. Based on theclassifications of the GO annotation, the overall bacterial functionswere categorised into biological processes, molecular functions, andcellular components, and are displayed in histogram format. Thenumber of GO terms for each of the three categories is shown andthe proportion of each specific subcategory is also provided.Subcategories with GO terms less than 1% are classified as “other”
Song et al. Proteome Science (2021) 19:4 Page 8 of 14

Proteomic analysis detected differentially expressed E.coli proteins before and after coculture. These differ-ences were related to cellular responses to DNA damagestimulus and cell wall organisation. Thus, these findingsindicated that the proteins involved in response to theenvironment changed during coculture. Based on this,the stress response of E. coli was focused on in the co-culture model. Accordingly, increased mRNA levels ofthe bioD2 gene were observed. The bioD2 protein is anATP-dependent dethiobiotin synthetase that encodes ahomolog of dethiobiotin synthetase, which is the penul-timate enzyme in the biotin synthesis pathway. There-fore, it is likely that this upregulated bioD2 expression inthe presence of LGG microcapsules enhanced the de-grader’s requirement for biotin, which is synthesised denovo under the acidic, osmotic and oxidative stress con-ditions with the involvement of different isozymes. This
explanation was supported by the upregulated expres-sion observed in both the proteomics and qRT-PCR ana-lyses and was further validated by the inhibitory effect ofLGG microcapsules on E. coli biofilm formation.Aspartate 1-decarboxylase (PanD) is the only enzyme
capable of β-alanine synthesis in E. coli. In bacteria,fungi and plants, β-alanine is a precursor to pantothen-ate which, in turn, is a required metabolite for the syn-thesis of coenzyme A (CoA) in all organisms [22].Research indicates that chloroplast engineering of thebeta-alanine pathway by overexpression of E. coli panDenhances thermotolerance of photosynthesis and bio-mass production following high-temperature stress [23].During the coculture process, E. coli strains were fre-
quently confronted by acid stress produced by LGG me-tabolism. The ygiW protein is reported to be involved inthe stress response associated with exposure to H2O2,cadmium and acid [24]. An earlier study also reportedthat the expression of functional YgiW and QseC pro-teins is necessary for optimal biofilm growth of Aggrega-tibacter actinomycetemcomitans [25]. Comparison of theexpression levels of the ygiW gene between LGG micro-capsules and coculture conditions revealed a 4.0-foldchange.Proteomic analysis revealed the downregulation of sev-
eral virulence-related proteins, including bamE anddnaK, when E. coli was treated with LGG microcapsules.The most downregulated protein, bamE (MHC class IIanalog protein, log2FC = − 9.2), is an integral outermembrane β-barrel protein (OMP) that is assembled bythe beta-barrel assembly machine (Bam) complex inGram-negative bacteria [26]. Another downregulatedprotein, DnaK, is an important factor in all threeantibiotic-related persister formation pathways. The de-creased persistence phenotype, as well as the growth de-fect of dnaK, seem to depend on functional (p) ppGpp[27]. Heterogeneous expression of the dnaK gene in Ali-cyclobacillus acidoterrestris can significantly enhance theresistance of host bacteria E. coli against heat and acidstresses [28]. Furthermore, the DnaK protein has alsobeen reported to play an important role in bacterial bio-film formation [29, 30].EPS is the characteristic that distinguishes biofilms
from planktonic bacteria. The EPS matrix is the mediumthrough which bacterial cells are attached to the surfaceand facilitate cell-to-cell as well as cell-to-surface
Table 4 Common pathway in E.coli groups
Pathway p value Enrichment
Up-enrichment
Fatty acid biosynthesis 0.0257 1.5887
Biotin metabolism 0.0502 1.2987
Nitrogen metabolism 0.0535 1.2716
Taurine and hypotaurine metabolism 0.0636 1.1959
Fatty acid metabolism 0.0664 1.1775
Peptidoglycan biosynthesis 0.0664 1.1775
Glutathione metabolism 0.1295 0.8875
Pyruvate metabolism 0.1478 0.8301
Terpenoid backbone biosynthesis 0.1489 0.8269
Propanoate metabolism 0.1551 0.8093
Down-enrichment
Purine metabolism 0.0398 1.3991
Oxidative phosphory 0.0827 1.0823
Bacterial secretion 0.1857 0.7310
Protein export 0.1857 0.7310
RNA degradation 0.1997 0.6996
Ribosome 0.2042 0.6898
Phosphotransferase 0.2661 0.5749
Galactose metabolism 0.2661 0.5749
Lipopolysacharide biosynthesis 0.2912 0.5357
Methane metabolism 0.3390 0.4697
Table 5 Common pathway in LGG groups
Pathway p value Enrichment
Down-enrichment
Galactose metabolism 1 0
Amino sugar and nucleotide sugar metabolism 1 0
Metabolic pathways 1 0
Song et al. Proteome Science (2021) 19:4 Page 9 of 14

interactions. It provides support to biofilm cells andgives the biofilm a three-dimensional architecture, thusproviding a protective as well as structural role. Water isone of the major components of the EPS, along withextrapolymeric polymers, proteins, nucleic acids, nutri-ents, lipids and other metabolites. An EPS inhibition ef-fect has been reported in many papers [31]. However, inthe present study no differentially expressed proteinsthat were downregulated in E. coli in the coculturemodel related to EPS formation.In summary, it is believed that the LGG microcapsules
inhibited E. coli biofilm formation and decreased anti-biotic resistance mainly through the disruption of cellmetabolism and by decreasing the expression of stress-related proteins.
Effects of E. coli on the growth and metabolism of LGGmicrocapsules in cocultureProteomic analysis indicated that E. coli coculture withLGG microcapsules elicited a cellular response in LGG andE. coli strains that was related to a certain intracellularmechanism. Coculture with LGG microcapsules placesenvironmental stress on E. coli and this, in turn, raises a cel-lular response in LGG as well [32]. For LGG, the possibleresponses to E. coli coculture include physiological and de-velopmental changes, reprogramming of the resistance geneor proteins, and alterations to how energy is supplemented.In the present study, proteomic analysis revealed that co-culture with E. coli significantly upregulated two nucleotidemetabolism–related genes, purD and purM. The pur-operon (purEKCSQLFMNHD) is responsible for the
Fig. 4 Protein-protein interaction networks in E. coli and LGG, respectively
Song et al. Proteome Science (2021) 19:4 Page 10 of 14

catalysis of de novo synthesis of inosine monopho-sphate (IMP) from phosphoribosyl pyrophosphate[33]. In Staphylococcus aureus, purine biosynthesis en-zymes have been closely implicated in the virulence,persistence and tolerance of stresses such as antibioticresistance [34, 35]. Such extensive effects could be at-tributed to the potential modulation of transcriptionof the operon by bacteria-secreted extracellular com-pounds. In another study, purD and purF mutantswere constructed in macrophage-like RAW264.7 andHeLa cells. The purD and purF mutants showed sig-nificantly decreased intracellular survival, and comple-mentation of these mutants with intact copies of thepurD or purF genes of Brucella abortus strain RB51
restored these defects. These findings suggest thatgenes encoding the early stages of purine biosynthesis(purD and purF) are required for intracellular survivaland virulence of the RB51 strain [36]. Therefore, itmay be that LGG strains maintain intracellular sur-vival and homeostasis by upregulating the purD andpurM genes.Coculture of LGG microcapsules with E. coli appeared
to downregulate murB gene expression and to completelyabolish expression of the murF gene. Bacteria generallysynthesise their own active form of N-acetylmuramic acid,UDP-N-acetylmuramic acid [37], and the MurB enzyme(UDP-N-acetylglucosamine pyruvate enol ether reductase)plays an important role in the biosynthesis of this
Fig. 5 Relative mRNA expression of selected targets from global proteomics analysis. Total RNA isolated from coculture treatment or pure cultureof E. coli and LGG was reversed transcribed and cDNA was quantified by qRT-PCR using target-specific primers. The data represents the mean ±SD of triplicate experiments normalised to 16S RNA. Statistically significant differences between coculture treatment and pure culture treatment,as determined by Student’s t-test analysis (unpaired, two-tailed), are represented as *p≤ 0.5, **p≤ 0.1 and ***p≤ 0.01
Song et al. Proteome Science (2021) 19:4 Page 11 of 14

substance [38]. The MurB enzyme converts UDP-N-acetylglucosamine pyruvate enol ether to UDP-N-acetylmuramic acid by reducing its double bond [39].Inhibition of the MurB enzyme reduces or blocks the syn-thesis of peptidoglycan, resulting in an incomplete bacter-ial cell wall; this eventually leads to the production of lyticbacteria under the pressure of permeation [40]. Therefore,downregulation of the murB and murF genes implies sup-pressed LGG cell membrane biosynthesis, to some extent,when LGG was cocultured with E. coli.Metabolism refers to the basic physiological processes
that maintain a living organism. Coculture of LGG micro-capsules with E. coli was associated with the downregula-tion of metabolism-related genes. Acetate presumablyprovides a relevant nutrient for Enterobacteria as well asother bacteria [41, 42]. In E. coli, the primary pathway ofacetate production involves two enzymes that are intimatelyconnected to central metabolism, phosphotransacetylase(Pta) and acetate kinase (AckA) [43]. During exponentialgrowth, acetyl-CoA, the product of glycolysis and the con-sumable substrate for the tricarboxylic acid (TCA) cycle,can be converted into acetylphosphate (AcP) by Pta andthen into acetate by AckA. E. coli also takes up acetate,using the Pta-AckA pathway in reverse, resulting in thesynthesis of acetyl-CoA. This pathway typically operates athigh extracellular acetate concentrations (≥ 8mM) [44].Disruption of the Pta-AckA pathway during overflow me-tabolism causes a significant reduction in the growth rateand viability of the bacteria, although this is not due to
intracellular ATP depletion [45, 46]. Hence, downregula-tion of the ackA gene will affect LGG metabolism.
ConclusionsAs far as is known, the present study is the first publishedattempt to determine protein expression differences associ-ated with a probiotic E. coli in situ coculture. Label-freequantitative proteomic analysis indicated that E. coli andmicroencapsulated LGG may impact cellular metabolism,the stress response, transcription, and the cell membranethrough regulating the expression of PanD, YgiW, BioD2,DamE and DnaK proteins in E. coli, and PurD, PurM,AckA, MurB, MurF and RpoC proteins in LGG. The cocul-ture with LGG microcapsules also decreased the E. coli re-sistance to Amp. Taken together, these findings furtherunderstanding of the possible molecular action of LGG mi-crocapsules against E. coli biofilm formation. Future studieswill focus on the analysis of posttranslational modificationsof differentially expressed proteins as well as endogenousprotein complexes and protein-protein interactions.
Supplementary InformationThe online version contains supplementary material available at https://doi.org/10.1186/s12953-021-00172-0.
Additional file 1 : Table S1. Primers used in this study.
Additional file 2: Figure S1. Volcano plots of differentially expressedproteins after E. coli and LGG microcapsule coculture. Volcano plots weregenerated based on the fold-change of protein levels using averaged
Fig. 6 Inhibition zone to evaluate the antibiotic resistance of E. coli before and after coculture with LGG microcapsules. Amp was used as thestandard antibiotic at 500 μg/mL, 50 μg/mL or 5 μg/mL
Song et al. Proteome Science (2021) 19:4 Page 12 of 14

spectral counts from biological triplicates. The x-axis indicates a log2-foldchange and the y-axis indicates -log10 p-values based on Student’s t-test.The horizontal line indicates a p-value < 0.5 and the vertical lines repre-sent a fold-change > 1.5. In all plots, the green dots represent upregu-lated proteins in the upper left quadrant, whereas downregulatedproteins are shown as red dots in the upper right quadrant. Black dots in-dicate proteins for which differences in abundance were not statisticallysignificant.
Additional file 3: Table S2. Most highly differentially upregulated anddownregulated proteins in E. coli after coculture.
Additional file 4: Table S3. Most highly differentially upregulated anddownregulated proteins in LGG microcapsules after coculture.
AcknowledgementsNot applicable.
Authors’ contributionsSong HY and Shang D designed and planned the study. Lou N and Liu JianJ conducted the experiments. Xiang H contributed the analytical tools andanalysed the data. Song HY wrote the manuscript. All authors were involvedin editing the manuscript and all made substantial contributions to thecontent and approved the final version.
Authors’ informationDong Shang is a professor in First Affiliated Hospital of Dalian MedicalUniversity. He performed his research as a senior visiting scholar at ThomasJefferson University Hospitals and the University of Pittsburgh Medical Center(UPMC) in Pennsylvania, USA. Currently, he is Chief Surgeon of theDepartment of General Surgery, Pancreatic-Biliary Center, The First AffiliatedHospital of Dalian Medical University, Dalian, China, as well as the leader ofthe National Clinical Key Specialist-Department of Acute Abdominal Surgery,at the First Affiliated Hospital of Dalian Medical University. His fields of ex-pertise are the clinical and experimental biomedical sciences of pancreaticdisease, including the molecular mechanism and innovative drug develop-ment of AP, CP, and PC.Huiyi Song is an associate professor in First Affiliated Hospital of DalianMedical University. Her current research interests include understanding thebiomaterials-bio interactions and using nanotechnologies for immunother-apy, anti-resistant bacterial coating.
FundingThe materials used in this manuscript were supported by the NationalNatural Science Foundation of China (grant number 81601734). Theproteomic analysis work was supported by the National Natural ScienceFoundation of China (grant number 81873156) and the Liaoning ProvincialNatural Science Foundation of China (grant number 20180530062)supported the publishing charges.
Availability of data and materialsThe datasets generated and/or analysed during the current study areavailable in the [figshare] repository, [https://doi.org/10.6084/m9.figshare.11923542].
Declarations
Ethics approval and consent to participateNot applicable.
Consent for publicationWritten informed consent for publication was obtained from all participants.
Competing interestsThe authors declare that they have no competing interests.
Author details1Clinical Laboratory of Integrative Medicine, First Affiliated Hospital of DalianMedical University, 222 Zhongshan Road, Dalian 116023, P. R. China.2Institute (College) of Integrative Medicine, Dalian Medical University, Dalian,China. 3The Third Department of General Surgery, First Affiliated Hospital ofDalian Medical University, Dalian, Liaoning, P. R. China.
Received: 27 October 2020 Accepted: 25 February 2021
References1. Monnappa AK, Dwidar M, Seo JK, Hur JH, Mitchell RJ. Bdellovibrio
bacteriovorus inhibits Staphylococcus aureus biofilm formation and invasioninto human epithelial cells. Sci Rep. 2014;4:3811.
2. Hetrick EM, Shin JH, Paul HS, Schoenfisch MH. Anti-biofilm efficacy of nitricoxide-releasing silica nanoparticles. Biomaterials. 2009;30(14):2782–9.
3. Beloin C, Roux A, Ghigo JM. Escherichiaia coli biofilms. Curr Top MicrobiolImmunol. 2008;322:249–89.
4. Matsuda Y, Cho O, Sugita T, Ogishima D, Takeda S. Culture supernatants ofLactobacillus gasseri and L. crispatus inhibit Candida albicans biofilmformation and adhesion to HeLa cells. Mycopathologia. 2018;183(4):691–700.
5. Song HY, Zhang JB, Qu JL, Liu JJ, Yin PY, Zhang GX, Shang D. Lactobacillusrhamnosus GG microcapsules inhibit Escherichiaia coli biofilm formation incoculture. Biotechnol Lett. 2019;41(8–9):1007–14.
6. Abdallah C, Dumas-Gaudot E, Renaut J, Sergeant K. Gel-based and gel-freequantitative proteomics approaches at a glance. Int J Plant Genomics. 2012;2012:494572.
7. Yan W, Chen SS. Mass spectrometrybased quantitative proteomic profiling.Brief Funct Genomic Proteomic. 2005;4(1):27–38.
8. Megger DA, Bracht T, Meyer HE, Sitek B. Label-free quantification in clinicalproteomics. Biochim Biophys Acta. 2013;1834(8):1581–90.
9. Dekeersmaecker SC, Vanderleyden J. Constraints on detection ofautoinducer-2 (AI-2) signaling molecules using Vibrio harveyi as a reporter.Microbiology. 2003;149(Pt 8):1953–6.
10. Song HY, Yu WT, Liu XD, Ma XJ. Improved probiotic viability in stressenvironments with post-culture of alginate-chitosan microencapsulated lowdensity cells. Carbohydr Polym. 2014;108:10–6.
11. Zhang JY, Poh CL. Regulating exopolysaccharide gene wcaF allows controlof Escherichiaia coli biofilm formation. Sci Rep. 2018;8(1):13127.
12. Xue WM, Yu WT, Liu XD, Wang HW, Ma XJ. Chemical method of breakingthe cell-loaded sodium alginate/chitosan microcapsule. Chem J Chin Univ.2004;25:1342–6.
13. Wu J, Xu GQ, Jin YY, Sun C, Zhou L, Lin GD, Xu R, Wei L, Fei H, Wang D,et al. Isolation and characterization of Bacillus sp GFP-2, a novel Bacillusstrain with antimicrobial activities, from Whitespotted bamboo sharkintestine. AMB Express. 2018;8(1):84.
14. Silva JC, Gorenstein MV, Li GZ, Vissers JP, Geromanos SJ. Absolutequantification of proteins by LCMSE: a virtue of parallel MS acquisition. MolCell Proteomics. 2006;5(1):144–56.
15. Rasmussen RV, Fowler VG, Skov R, Bruun NE. Future challenges andtreatment of Staphylococcus aureus bacteremia with emphasis on MRSA.Future Microbiol. 2011;6(1):43–56.
16. Grundmann H, Aires-de-Sousa M, Boyce J, Tiemersma E. Emergence andresurgence of meticillin-resistant Staphylococcus aureus as a public-healththreat. Lancet. 2006;368(9538):874–85.
17. Vieco-Saiz N, Belguesmia Y, Raspoet R, Auclair E, Gancel F, Kempf I, Drider D.Benefits and inputs from lactic acid bacteria and their bacteriocins asalternatives to antibiotic growth promoters during food-animal production.Front Microbiol. 2019;10:57.
18. Sharma G, Sharma S, Sharma P, Chandola D, Dang S, Gupta S, Gabrani R.Escherichiaia coli biofilm: development and therapeutic strategies. J ApplMicrobiol. 2016;121(2):309–19.
19. Amin M, Navidifar T, Shooshtari FS, Rsahno M, et al. Association betweenbiofilm formation, structure, and the expression levels of genes related tobiofilm formation and biofilm-specific resistance of Acinetobacter baumanniistrains isolated from burn infection in Ahvaz. Iran Infect Drug Resist. 2019;12:3867–81.
20. Jain S, Smyth D, O’ Hagan BMG, Heap JT, McMullan G, Minton NP, TernanNG. Inactivation of the dnaK gene in Clostridium difficile 630 △erm yields atemperature-sensitive phenotype and increases biofilm-forming abiligy. SciRep. 2017;7(1):17522.
21. Wang C, Zhang QL, Wang Y, Tang XD, An YN, Li SL, Xu HY, et al.Comparative proteomics analysis between biofilm and planktonic cells ofMycobacterium tuberculosis. Comparative study. 2019;40(20):2736–46.
22. Webb ME, Smith AG, Abell C. Biosynthesis of pantothenate. Nat Prod Rep.2004;21(6):695–721.
Song et al. Proteome Science (2021) 19:4 Page 13 of 14

23. Fouad WM, Altpeter F. Transplastomic expression of bacterial L-aspartate-alpha-decarboxylase enhances photosynthesis and biomassproduction in response to high temperature stress. Transgenic Res.2009;18(5):707–18.
24. Lee J, Hiibel SR, Reardon KF, Wood TK. Identification of stress-relatedproteins in Escherichiaia coli using the pollutant cis-dichloroethylene. J ApplMicrobiol. 2010;108(6):2088–102.
25. Juárez-Rodríguez MD, Torres-Escobar A, Demuth DR. ygiW and qseBC are co-expressed in Aggregatibacter actinomycetemcomitans and regulate biofilmgrowth. Microbiology. 2013;159(Pt 6):989–1001.
26. Rigel NW, Ricci DP, Silhavy TJ. Conformation-specific labeling of BamA andsuppressor analysis suggest a cyclic mechanism for β-barrel assembly inEscherichiaia coli. Proc Natl Acad Sci U S A. 2013;110(13):5151–6.
27. Liu S, Wu N, Zhang S, Yuan Y, Zhang W, Zhang Y. Variable persister geneinteractions with (p) ppGpp for persister formation in Escherichiaia coli.Front Microbiol. 2017;8:1795.
28. Xu X, Jiao L, Feng X, Ran J, Liang X, Zhao R. Heterogeneousexpression of DnaK gene from Alicyclobacillus acidoterrestris improvesthe resistance of Escherichiaia coli against heat and acid stress. AMBExpress. 2017;7(1):36.
29. Grudniak AM, Wlodkowska J, Wolska KI. Chaperone DnaJ influences theformation of biofilm by Escherichiaia coli. Pol J Microbiol. 2015;64(3):279–83.
30. Veen SVD, Abee T. HrcA and DnaK are important for static and continuous-flow biofilm formation and disinfectant resistance in listeriamonocytogenes. Microbiology (Reading). 2010;156(Pt 12):3782–90.
31. Vijayakumar K, Thirunanasambandham R. 5-Hydroxymethylfurfural inhibitsacinetobacter baumannii biofilms: an in vitro study. Arch Microbiol. 2020;Online ahead of print.
32. Dahl JU, Koldewey P, Salmon L, Horowitz S, Bardwell JC, Jakob U. HdeBfunctions as an acid-protective chaperone in bacteria. J Biol Chem. 2015;290(16):9950.
33. Diether M, Nikolaev Y, Allain FH, Sauer U. Systematic mapping of protein-metabolite interactions in central metabolism of Escherichiaia coli. Mol SystBiol. 2019;15(8):e9008.
34. Kriegeskorte A, Block D, Drescher M, Windmüller N, Mellmann A, Baum C,Neumann C, et al. Inactivation of thyA in Staphylococcus aureus attenuatesvirulence and has a strong impact on metabolism and virulence geneexpression. MBio. 2014;5(4):e01447–14.
35. Yee R, Cui P, Shi W, Feng J, Zhang Y. Genetic screen reveals the role ofpurine metabolism in Staphylococcus aureus persistence to rifampicin.Antibiotics (Basel). 2015;4(4):627–42.
36. Truong QL, Cho Y, Barate AK, Kim S, Watarai M, Hahn TW. Mutation of purDand purF genes further attenuates Brucella abortus strain RB51. MicrobPathog. 2015;79:1–7.
37. Karl HS, Otto K. Peptidoglycan types of bacterial cell walls and theirtaxonomic implications. Bacteriol Rev. 1973;37(2):258.
38. Benson TE, Walsh CT, Hogle JM. Crystallization and preliminary X-raycrystallographic studies of UDP-N-acetylenolpyruvylglucosamine reductase.Protein Sci. 1994;3(7):1125–7.
39. Lees WJ, Benson TE, Hogle JM, Walsh CT. (E)-enolbutyryl-UDP-N-acetylglucosamine as a mechanistic probe of UDP-N-acetylenolpyruvylglucosamine reductase (MurB). Biochemistry. 1996;35(5):1342–51.
40. Weidel W, Pelzer H. Bagshaped macromolecules - a new outlook onbacterial cell walls. Adv Enzymol Relat Subj Biochem. 1964;26:193–232.
41. Rowland I, Gibson G, Heinken A, Scott K, Swann J, Thiele I, Tuohy K. Gutmicrobiota functions: metabolism of nutrients and other food components.Eur J Nutr. 2018;57(1):1–24.
42. Wolfe AJ. The acetate switch. Microbiol Mol Biol Rev. 2005;69(1):12–50.43. De Mets F, Van Melderen L, Gottesman S. Regulation of acetate metabolism
and coordination with the TCA cycle via a processed small RNA. Proc NatlAcad Sci U S A. 2019;116(3):1043–52.
44. Enjalbert B, Millard P, Dinclaux M, Portais JC, Létisse F. Acetate fluxes inEscherichiaia coli are determined by the thermodynamic control of the Pta-AckA pathway. Sci Rep. 2017;7:42135.
45. Marshall DD, Sadykov MR, Thomas VC, Bayles KW, Powers R. Redox imbalanceunderlies the fitness defect associated with inactivation of the Pta-AckApathway in Staphylococcus aureus. J Proteome Res. 2016;15(4):1205–12.
46. Sadykov MR, Thomas VC, Marshall DD, Wenstrom CJ, Moormeier DE,Widhelm TJ, Nuxoll AS, et al. Inactivation of the Pta-AckA pathway causescell death in Staphylococcus aureus. J Bacteriol. 2013;195(13):3035–44.
Publisher’s NoteSpringer Nature remains neutral with regard to jurisdictional claims inpublished maps and institutional affiliations.
Song et al. Proteome Science (2021) 19:4 Page 14 of 14