lab vent optimization - appa.org · reports lab safety surveys benchmark operation tab and...
TRANSCRIPT

1
Exposure Control Technologies, Inc.
Copyright ©2018
5/31/2018
May 2018 Copyright © 2018
Exposure Control Technologies, Inc.
919-319-4290
Thomas C. SmithPresident
SMART LABS™️ - Roadmap to High Performance Laboratories
Hoy Bohanon Engineering, PLLC336-972-1626
Hoy Bohanon, PEPresident
May 2018 Copyright © 2018
Hoy Bohanon
Hoy Bohanon, P.E., is owner of Hoy Bohanon
Engineering, PLLC. During his 43-year engineering
career, Mr. Bohanon has run his own consulting
engineering business and worked at manufacturing
corporations as a product design engineer, project
engineer, facilities engineer, facilities manager, indoor
air quality researcher, and environmental engineer.
He has published and presented numerous papers and
articles on indoor air quality and serves as chair of
ASHRAE SSPC 62.1, Ventilation for Acceptable Indoor
Air Quality.

2
Exposure Control Technologies, Inc.
Copyright ©2018
5/31/2018
May 2018 Copyright © 2018
Research is SERIOUS Work
May 2018 Copyright © 2018
Labs are specially designed to provide safe and
controlled environments that promote science
Hazards
• Chemical
• Biological
• Radiological
• Physical

3
Exposure Control Technologies, Inc.
Copyright ©2018
5/31/2018
May 2018 Copyright © 2018
°T
dPdP
The purpose of a lab ventilation system is to protect
people and provide appropriate air quality
Source
CaptureDilution
& Removal
RISK
• Control Airborne Hazards
– Source Capture (ECDs)
– Dilution and Removal
– Isolation
Condition Lab Environment•Temperature–
Humidity–
May 2018 Copyright © 2018
Laboratories are expensive and complicated
• Average Lab Size ≈ 100,000 ft2
• Construction(USA) ≈ $45 Million to $100 Million
• Energy Cost ≈ $700,000/year ( Avg. $7 per ft2)
• Lab HVAC and Fume Hoods ≈ 30% of Construction Cost
• Fume Hood Installation ≈ $25,000 - $50,000 each
• Fume Hood Annual Cost ≈ $2,400 – $5,000 per year
Lab HVAC Energy Use
45% to 85% of the energy is consumed by Fume Hoods and the Lab HVAC Systems
As much as 50% of HVAC energy is wasted by excess airflow,
inefficient fume hoods and improper modulation of flow

4
Exposure Control Technologies, Inc.
Copyright ©2018
5/31/2018
May 2018 Copyright © 2018
“Good science can happen in a bad building, but a
bad building can affect good science”
Poor control of environmental conditions•
Failure to meet occupant needs•
Loss of talent and poor recruitment•
Inefficient and costly to operate•
Increased risk and greater potential for liability•
Troubling Deferred Maintenance•
May 2018 Copyright © 2018
Why The Waste?
How Did It Happen?
• Misunderstanding of risk and risk aversion
• Labs design based on old rules of thumb
• New labs incorporating complex systems that often run at maximum capacity
• Lack of training and resources
• Failure to manage change coupled with run to failure
• Lack of standard practices to achieve and manage performance

5
Exposure Control Technologies, Inc.
Copyright ©2018
5/31/2018
May 2018 Copyright © 2018
Old Rules
• All labs require 12 ACH
• More airflow is better and safer
• All hoods require the same face velocity
• Airflow quantity is more important than airflow distribution
• Lab exhaust must be 3000 fpm and and 10 feet above the roof
• Design, Construction and Operations are separate activities
May 2018 Copyright © 2018
Organizations can improve safety, reduce waste
and operate more effectively
• Attract & retain top talent
• Improve safety and reduce risk
• Minimize waste
• Maximize sustainability
• Improve resilience
• Mitigate deferred maintenance
Enhance Return on Investment

6
Exposure Control Technologies, Inc.
Copyright ©2018
5/31/2018
May 2018 Copyright © 2018
The Roadmap to High Performance Labs
and Critical Control Environments
May 2018 Copyright © 2018
– President/CEO, Exposure Control Technologies, Inc.
– BSME (NCSU), MSEE – Industrial Hygiene (UNC-CH)
– Chair, AIHA/ANSI Z9 Ventilation Standards for Safety and Health
– Chair, ASHRAE TC 9.10 – Laboratory Systems
– Vice Chair, ASHRAE/ANSI 110 – Method of Testing Fume Hoods
– Board of Directors – International Institute for Sustainable Labs
– NCSU Mechanical/Aerospace Engineering Alumni Hall of Fame
– 50+ Professional Papers and Presentations
Thomas C. Smith

7
Exposure Control Technologies, Inc.
Copyright ©2018
5/31/2018
May 2018 Copyright © 2018
Sm
art L
abs
1994
2000
2008
2012
2017
Exposure Control Technologies, Inc.
Founded to test laboratory fume hoods. Transformed to provide services and products to improve safety, reduce waste and help facilitate success.
U.S. EPA – Lab Controls Optimization Project
LCOP - Scalable and replicable program for optimizing lab safety and energy efficiency
UCI - Smart Labs™
Upgraded performance of lab buildings. Improved safety performance, occupant satisfaction and reduced energy use >50%
ANSI Lab Standards
Hazard Evaluation and Risk AssessmentLab Ventilation Management Program
DOE Smart Labs Accelerator
National partnership program based on success at EPA, UCI and elsewhere
Smart Labs™ evolved over 25 years
May 2018 Copyright © 2018
Smart Labs™ provides a roadmap to success
IssuesGoals
Plan
Assess
Optimize
Manage
SafeEfficient
Sustainable
• Safety• Energy Efficiency• Lab Conditions• Operating Costs• Deferred Maintenance• Reliability
Smart Lab
Qualitative Scoping Study
Quantitative Performance
Audit
Construction/Renovation
Performance Management
Plan

8
Exposure Control Technologies, Inc.
Copyright ©2018
5/31/2018
May 2018 Copyright © 2018
The roadmap describes a systematic approach that
includes a series phases and tasks
Plan
Assess Quantitative Performance Audit
Qualitative Scoping Study
OptimizeConstruction, Renovation,
Upgrade Project
ManageLifecycle Performance
Management Plan
Phase 1A
Phase 1B
Phase 2
Phase 3
May 2018 Copyright © 2018
• Select & Prioritize Best Projects First
– Facility and Building Qualifying Tool
• Based on Key Performance Indicators
– Size & Space Utilization
– Energy Use & Operating Costs
– Facility Condition and Asset Value
• Building Profile Report– Classification and Categorization
– Potential for Energy Reduction
– Estimated Level of Effort, Project Costs & Potential Payback
The Qualitative Scoping Study is deployed to evaluate and prioritize building opportunities
Attribute Lab Building Profile Category
• Safety and State of the Systems
• Energy Reduction Potential
• Project LOE & Complexity
• Return on Investment (Payback)
Class A
Class B
Class C
Class D

9
Exposure Control Technologies, Inc.
Copyright ©2018
5/31/2018
May 2018 Copyright © 2018
Roadmap to High Performance Labs
Building Design & Operating Documents
LVRA Phase 1B
Assessment
Phase 2Optimization
Phase 3Management
Airflow & Operating
Specifications
Systems Operation Tests
Energy & Operating Cost
Analysis
Engineering & Specifications
Implement Performance Improvement
Measures
Implement Performance
Management Plan
Maintenance & Functional Tests
BAS Performance Monitoring
Change Management
LVMP Team Coordination
Lab Building Inventory
Phase 1APlan
Lab Condition Status
Lab Building Condition Profile
Project Optimization
Priority For
Phase 1B
PerformanceStatus
Reports
Lab Safety Surveys
BenchmarkOperation
TAB and Commission (CX)
Building Performance
Management Plan (PMP)
for Phase 3
Quantitative Performance Audit
May 2018 Copyright © 2018
Ventilation drives both safety and energy use
RM 204RM 201 RM 202B RM 203RM 202A
LFH3
LFH2LFH1
AHU(s)
45
VFD%
Ex.
Fan(s)
45
VFD% OABD%VFD%
45 ∆T
Boiler
Chiller & Cooling
Tower
SupplyEnergy
Average
Min
Max
ER Coil
ER Pumps ER Coil
ECAV1 EVAV2 EVAV4 EVAV5 EVAV6EVAV3
dP°T °T°T
SVAV2 SVAV3 SVAV4
OCC
DAQSP
BAS Total Flow
DAQ
SVAV2
SP
SVAV1
DCV
Sensors
S
DCV
S
45
VFD%
∆T
Boiler
Chiller & Cooling
TowerAHU(s)
Exhaust

1
0
Exposure Control Technologies, Inc.
Copyright ©2018
5/31/2018
May 2018 Copyright © 2018
• Chemical Labs
• Biology Labs (BSL 2-4)
• Radiological Labs
• Nanotechnology Labs
• Clean Rooms
• Equipment Labs
Different types of labs have different design and
operating requirements
Risk + Functional Requirements = Demand for Ventilation
May 2018 Copyright © 2018
The Demand for Ventilation establishes the
design and operating requirements
Minimum flow and range of modulation required to meet the functional needs of the occupants
• Safety (Risk)
– Fume Hood Flow
– Contaminant Removal (ACH)
– Isolation (Lab Pressurization)
• Comfort & Productivity
– Temperature
– Humidity
• Occupancy & Utilization

1
1
Exposure Control Technologies, Inc.
Copyright ©2018
5/31/2018
May 2018 Copyright © 2018
Demand for Ventilation & Lab Utilization
Labs may be unoccupied or not in
use more than 75% of the time!74%
26%
Occupied
Max Flow
Unoccupied
Min. Flow
• Lab Time vs. Office Time
– Experiments in Lab
– Analysis in Office
• Nights and Weekends
• Holidays and Leave
May 2018 Copyright © 2018
Modulate flow to meet the demand for ventilation Max Supply
Min Supply
Max Exhaust
Min Exhaust
80000
90000
100000
110000
120000
130000
140000
9/1
/12
12
:00
:00
AM
PD
T
9/1
/12
6:0
0:0
0 A
M P
DT
9/1
/12
12
:00
:00
PM
PD
T
9/1
/12
5:3
0:0
0 P
M P
DT
9/1
/12
11
:00
:00
PM
PD
T
9/2
/12
5:0
0:0
0 A
M P
DT
9/2
/12
11
:00
:00
AM
PD
T
9/2
/12
5:0
0:0
0 P
M P
DT
9/2
/12
11
:00
:00
PM
PD
T
9/3
/12
5:0
0:0
0 A
M P
DT
9/3
/12
11
:00
:00
AM
PD
T
9/3
/12
5:0
0:0
0 P
M P
DT
9/3
/12
11
:00
:00
PM
PD
T
9/4
/12
5:3
0:0
0 A
M P
DT
9/4
/12
11
:30
:00
AM
PD
T
9/4
/12
5:0
0:0
0 P
M P
DT
9/4
/12
11
:00
:00
PM
PD
T
9/5
/12
5:0
0:0
0 A
M P
DT
9/5
/12
11
:00
:00
AM
PD
T
9/5
/12
4:3
0:0
0 P
M P
DT
9/5
/12
10
:30
:00
PM
PD
T
9/6
/12
4:3
0:0
0 A
M P
DT
9/6
/12
10
:30
:00
AM
PD
T
9/6
/12
4:0
0:0
0 P
M P
DT
9/6
/12
10
:00
:00
PM
PD
T
9/7
/12
4:0
0:0
0 A
M P
DT
9/7
/12
10
:00
:00
AM
PD
T
9/7
/12
3:3
0:0
0 P
M P
DT
9/7
/12
9:3
0:0
0 P
M P
DT
9/8
/12
3:3
0:0
0 A
M P
DT
9/8
/12
9:3
0:0
0 A
M P
DT
9/8
/12
3:3
0:0
0 P
M P
DT
9/8
/12
9:3
0:0
0 P
M P
DT
9/9
/12
3:3
0:0
0 A
M P
DT
9/9
/12
9:3
0:0
0 A
M P
DT
9/9
/12
3:0
0:0
0 P
M P
DT
9/9
/12
9:0
0:0
0 P
M P
DT
Flo
w -
cfm
BAS Trend of Combined Flow for AHUs 11&12,13&14,15&16,19&20 (Week September 1 - September 9, 2012)
Average Minimum Flow - cfm Maximum Flow - cfm Aggregate AHU 11-20 - Flow - cfm
Max Flow
Min Flow
AverageFlow
M T W H F

1
2
Exposure Control Technologies, Inc.
Copyright ©2018
5/31/2018
May 2018 Copyright © 2018
Optimize Airflow Control and Energy Consumption
SupplyEnergy
Average
Min
Max
Exhaust
$/ft2 cfm/ft2 $/cfm
Maximum savings are achieved by reducing
total airflow and improving system efficiency
Energy Airflow Efficiency
Demand Operation Energy
May 2018 Copyright © 2018Proprietary & Confidential. Copyright © 2018 3 Flow, inc. All rights reserved.
Achieving proper modulation requires establishing
appropriate airflow specifications
How Much Flow is Required?
Where is the Flow Required?
When is the Flow Required?
1
3
Exposure Control Technologies, Inc.
Copyright ©2018
5/31/2018
May 2018 Copyright © 2018
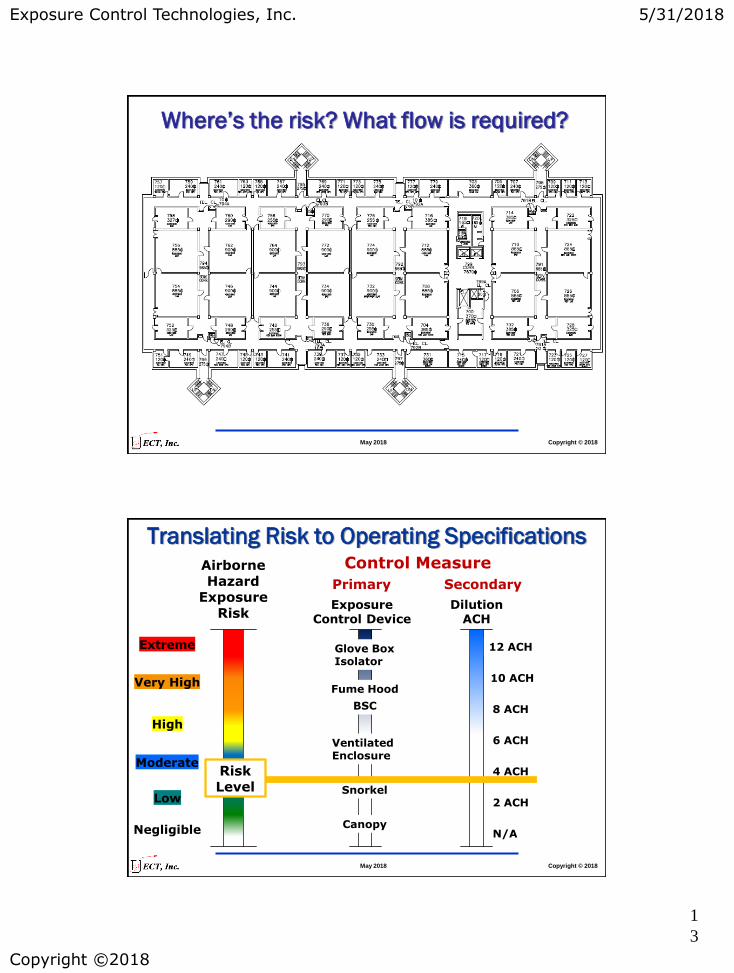
Where’s the risk? What flow is required?
May 2018 Copyright © 2018
Translating Risk to Operating Specifications
Extreme Exposure Control Device
DilutionACH
Control Measure
Primary Secondary
Glove BoxIsolator
Fume Hood
BSC
Ventilated Enclosure
Canopy
Snorkel
10 ACH
8 ACH
6 ACH
2 ACH
4 ACH
12 ACH
Airborne Hazard
Exposure Risk
Risk Level
N/ANegligible
Extreme
Low
High
Moderate
Very High
1
4
Exposure Control Technologies, Inc.
Copyright ©2018
5/31/2018
May 2018 Copyright © 2018
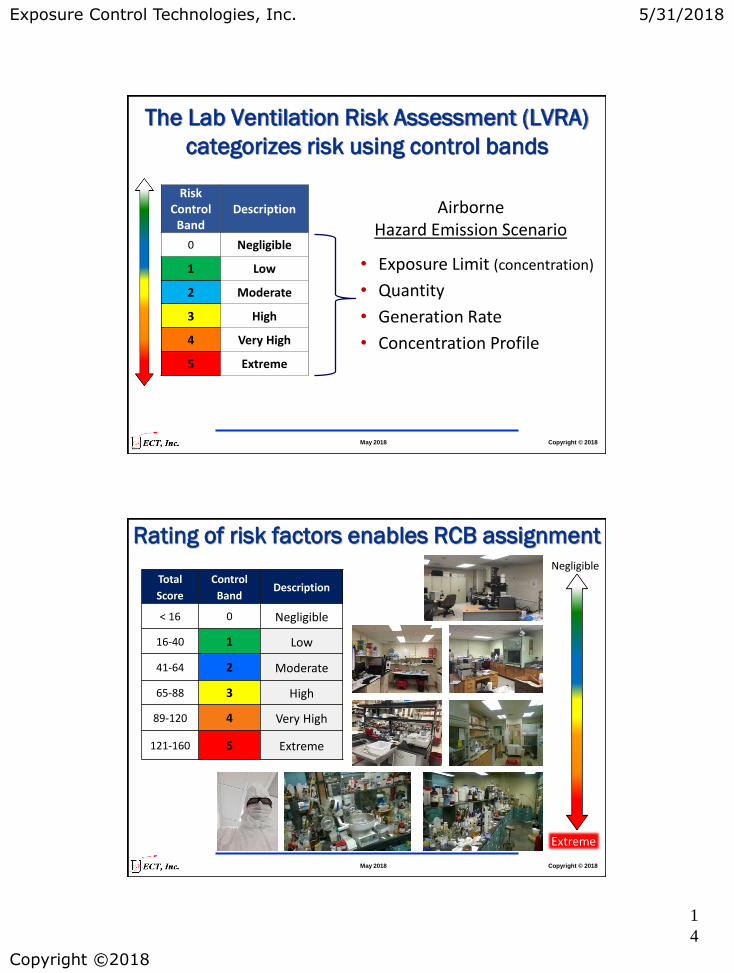
The Lab Ventilation Risk Assessment (LVRA)
categorizes risk using control bands
• Exposure Limit (concentration)
• Quantity
• Generation Rate
• Concentration Profile
Risk Control
BandDescription
0 Negligible
1 Low
2 Moderate
3 High
4 Very High
5 Extreme
Airborne Hazard Emission Scenario
May 2018 Copyright © 2018
Rating of risk factors enables RCB assignment
Total
Score
Control
BandDescription
< 16 0 Negligible
16-40 1 Low
41-64 2 Moderate
65-88 3 High
89-120 4 Very High
121-160 5 Extreme
Negligible
Extreme

1
5
Exposure Control Technologies, Inc.
Copyright ©2018
5/31/2018
May 2018 Copyright © 2018
RCBs differentiate labs, identify areas of concern
and help determine airflow requirements
May 2018 Copyright © 2018
Distribution of Labs by Risk Control BandsSuny Chemistry UCI Natural Sciences II
VA Tech - Chemistry Oak Ridge – Energy Lab

1
6
Exposure Control Technologies, Inc.
Copyright ©2018
5/31/2018
May 2018 Copyright © 2018
Roadmap to High Performance Labs
Building Design & Operating Documents
LVRA Phase 1B
Assessment
Phase 2Optimization
Phase 3Management
Airflow & Operating
Specifications
Systems Operation Tests
Energy & Operating Cost
Analysis
Engineering & Specifications
Implement Performance Improvement
Measures
Implement Performance
Management Plan
Maintenance & Functional Tests
BAS Performance Monitoring
Change Management
LVMP Team Coordination
Lab Building Inventory
Phase 1APlan
Lab Condition Status
Lab Building Condition Profile
Project Optimization
Priority For
Phase 1B
PerformanceStatus
Reports
Lab Safety Surveys
BenchmarkOperation
TAB and Commission (CX)
Building Performance
Management Plan (PMP)
for Phase 3
May 2018 Copyright © 2018
• Remove or Hibernate Unnecessary Hoods
• Modify Inefficient Hoods
• Replace & Retrofit Traditional Fume Hoods
• Upgrade CAV & VAV Controls
• Optimize Temperature & Humidity Controls
• Install Demand Control Ventilation
• Reduce / Reset System Static Pressure
• Optimize Exhaust Fan and AHU Operation
• Implement Energy Recovery
Identify measures that improve performance (PIMs)
and conserve energy (ECMs)
Before Retrofit
After Retrofit
1
7
Exposure Control Technologies, Inc.
Copyright ©2018
5/31/2018
May 2018 Copyright © 2018
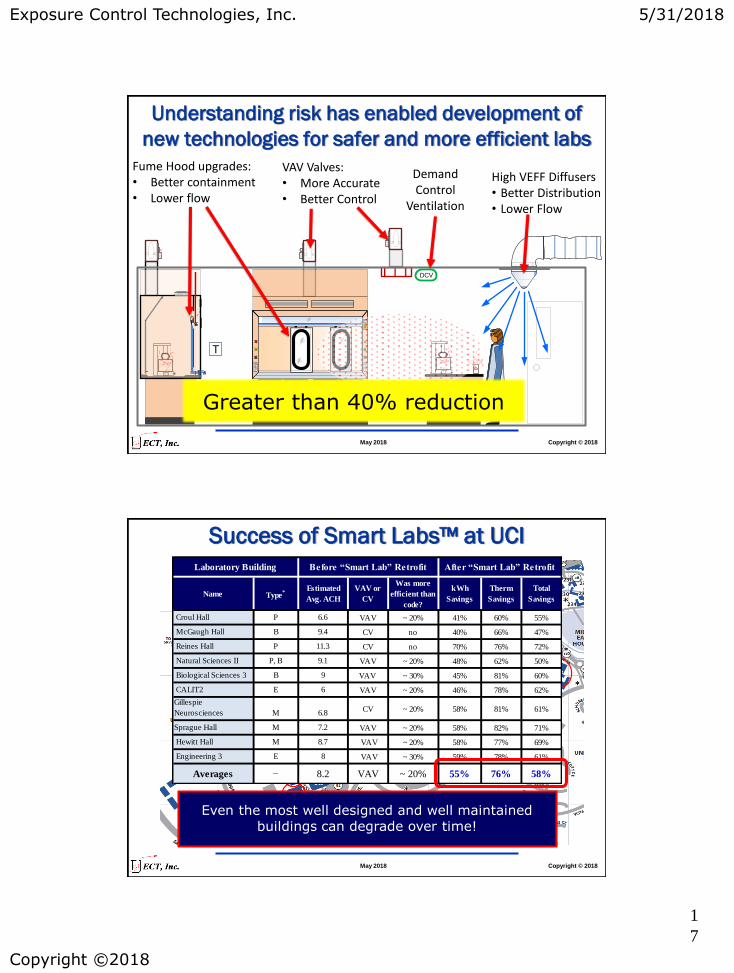
Understanding risk has enabled development of
new technologies for safer and more efficient labs
Fume Hood upgrades:• Better containment• Lower flow
High VEFF Diffusers• Better Distribution• Lower Flow
T
100
DCV
Demand Control
Ventilation
Greater than 40% reduction
VAV Valves:• More Accurate• Better Control
May 2018 Copyright © 2018
Success of Smart Labs™ at UCI
Name Type*
Estimated
Avg. ACH
VAV or
CV
Was more
efficient than
code?
kWh
Savings
Therm
Savings
Total
Savings
Croul Hall P 6.6 VAV ~ 20% 41% 60% 55%
McGaugh Hall B 9.4 CV no 40% 66% 47%
Reines Hall P 11.3 CV no 70% 76% 72%
Natural Sciences II P, B 9.1 VAV ~ 20% 48% 62% 50%
Biological Sciences 3 B 9 VAV ~ 30% 45% 81% 60%
CALIT2 E 6 VAV ~ 20% 46% 78% 62%
Gillespie
Neurosciences M 6.8CV ~ 20% 58% 81% 61%
Sprague Hall M 7.2 VAV ~ 20% 58% 82% 71%
Hewitt Hall M 8.7 VAV ~ 20% 58% 77% 69%
Engineering 3 E 8 VAV ~ 30% 59% 78% 61%
Averages − 8.2 VAV ~ 20% 55% 76% 58%
Laboratory Building Before “Smart Lab” Retrofit After “Smart Lab” Retrofit
Even the most well designed and well maintained buildings can degrade over time!

1
8
Exposure Control Technologies, Inc.
Copyright ©2018
5/31/2018
May 2018 Copyright © 2018
Success requires a combination of efforts
Lab Ventilation Management Plan
• Design and Mechanical Attributes
− High performance fume hoods
− Airflow Control Systems
− High efficiency mechanical systems
− Building information and control systems
• Leadership and Management
− Occupant Information and Floor Plans
− Ventilation Safety Demand Assessment
− System Diagrams and Airflow Specifications
− Lab Ventilation Management Program (LVMP)
− LVMP Coordinator/Manager
May 2018 Copyright © 2018
Roadmap to High Performance Labs
Building Design & Operating Documents
LVRA Phase 1B
Assessment
Phase 2Optimization
Phase 3Management
Airflow & Operating
Specifications
Systems Operation Tests
Energy & Operating Cost
Analysis
Engineering & Specifications
Implement Performance Improvement
Measures
Implement Performance
Management Plan
Maintenance & Functional Tests
BAS Performance Monitoring
Change Management
LVMP Team Coordination
Lab Building Inventory
Phase 1APlan
Lab Condition Status
Lab Building Condition Profile
Project Optimization
Priority For
Phase 1B
PerformanceStatus
Reports
Lab Safety Surveys
BenchmarkOperation
TAB and Commission (CX)
Building Performance
Management Plan (PMP)
for Phase 3

1
9
Exposure Control Technologies, Inc.
Copyright ©2018
5/31/2018
May 2018 Copyright © 2018
Maximum safety and minimum energy use are achieved when the airflow systems dynamically modulate operation to meet the demand for ventilation.
Key Components of an Lab Ventilation Management Program (LVMP)
Risk, Demand for Ventilation & Airflow Specifications
High Performance Hoods and Airflow Control Systems
Building Information, Dashboards & Analytics
Management, Operations & Maintenance Plan
I
II
III
IV
May 2018 Copyright © 2018
A successful program requires leadership and
a coordinated team effort
• Stakeholder and LVMP Team (In-house and Contractors)
– Facilities and Energy Engineers
– Environmental Health and Safety
– Lab Staff Representatives
– HVAC Systems Engineer
– Laboratory Hood Specialist
– Building Controls Operator
– Mechanical Maintenance
– TAB Contractor
– Commissioning Contractor
• Program Manager/Coordinator

2
0
Exposure Control Technologies, Inc.
Copyright ©2018
5/31/2018
May 2018 Copyright © 2018
The program provides the Operating Manual and
training to achieve and maintain performance
• System Line Diagrams and Drawings
• Equipment Inventories
• Lab Ventilation Risk Matrix
• Airflow Specifications
• Effective Control Sequences
• Key Performance Indicators and Metrics
• Proper Procedures and Guidelines
- Routine Tests & Maintenance Tasks
- Schedules and Management of Change
• Training for Stakeholders
Protect Return On Investment
May 2018 Copyright © 2018
Smart Labs™ includes training for all stakeholders
• Lab Personnel• Maintenance • Building Operators
• Program Managers & Supervisors
- Facilities Engineering
- Operations and Maintenance
- EH&S
- Lab Management LVMP Manager Coordinator

2
1
Exposure Control Technologies, Inc.
Copyright ©2018
5/31/2018
May 2018 Copyright © 2018
The roadmap accelerates implementation, reduces
risk and yields more predictable results
3-6 Months 3-18 Months 6-12 Months
1 - 3 years
6-10 years
Plan Assess Optimize ManageMulti-BuildingScoping Study
Lab Building 1 Demand Assessment
Building 1Optimization
Project
Smart Labs Lifecycle Management & Maintenance Program
Building 2Phase 2
Optimization Project
Building 3Phase 2
Optimization Project
Building 4Phase 2
Optimization Project
Building 5Phase 2
Optimization Project
Smart Labs™
Phase 1 - Level II Assessment Project
Smart Labs™
Phase 1 - Level II Assessment Project
Smart Labs™
Phase 1 - Level II Assessment Project
Smart Labs™
Phase 1 - Level II Assessment Project
Lab Building 2 Demand Assessment
Lab Building 3 Demand Assessment
Lab Building 4 Demand Assessment
Lab Building 5 Demand Assessment
Building 2Optimization
Project
Building 3Optimization
Project
Building 4Optimization
Project
Building 5Optimization
Project
Prioritize and Select Building
May 2018 Copyright © 2018
New methods, technologies and training deliver
benefits of safer and more energy efficient labs
UniversitiesGovernment PharmaceuticalChemical
Biotechnology Industry

2
2
Exposure Control Technologies, Inc.
Copyright ©2018
5/31/2018
May 2018 Copyright © 2018
Smart Labs Accelerator
Become a
Partner
May 2018 Copyright © 2018
Growing List of Smart Labs Accelerator Partners
▪ University of California Irvine
▪ University of Illinois (Chicago)
▪ University of Minnesota
▪ University of New Hampshire
▪ Colorado University (Boulder)
▪ Wesleyan University
▪ Emory University
▪ University of California Irvine Health
▪ Los Alamos National Laboratory
▪ Pacific Northwest National Laboratory
▪ Lawrence Berkeley National Laboratory
▪ National Renewable Energy Laboratory
▪ USDA ARS – Edward T. Schafer Argricultural Research Center
https://betterbuildingssolutioncenter.energy.gov/accelerators/smart-labs

2
3
Exposure Control Technologies, Inc.
Copyright ©2018
5/31/2018
May 2018 Copyright © 2018
Interested organizations can receive access to
references, training and other services
I. Strategic Planning
II. Team Responsibilities and Training
III. Systems Theory
IV. Implementation
A. Phase 1 – Plan and Assess
B. Phase 2 – Optimize
C. Phase 3 - Manage
V. Airflow Management Program
Recently Published Guide
May 2018 Copyright © 2018
The right flow in the right place at
the right time!™
2
4
Exposure Control Technologies, Inc.
Copyright ©2018
5/31/2018
May 2018 Copyright © 2018
Thank You!
Special Thanks and Acknowledgements:
• APPA, Leadership in Educational Facilities • The Smart Labs™ Team at the University of California Irvine (UCI)• The Better Building Alliance and the U.S. Department of Energy • The International Institute for Sustainable Labs (I2SL)
Exposure Control Technologies, Inc.
919-319-4290
Thomas C. SmithPresident
Hoy Bohanon Engineering, PLLC336-972-1626
Hoy Bohanon, PEPresident
Questions