lab manual nov2010
TRANSCRIPT

Diagnosis of Hemophilia and Other Bleeding DisordersA LABORATORY MANUAL Second Edition
Steve Kitchen
Angus McCraw
Marión Echenagucia
Published by the World Federation of Hemophilia (WFH)
© World Federation of Hemophilia, 2010
The WFH encourages redistribution of its publications for educational purposes by not-for-profit hemophilia organizations. For permission to reproduce or translate this document, please contact the Communications Department at the address below.
This publication is accessible from the World Federation of Hemophilia’s website at www.wfh.org. Additional copies are also available from the WFH at:
World Federation of Hemophilia1425 René Lévesque Boulevard West, Suite 1010Montréal, Québec H3G 1T7CANADATel.: (514) 875-7944Fax: (514) 875-8916
E-mail: [email protected]: www.wfh.org

Diagnosis of Hemophilia and Other Bleeding DisordersA LABORATORY MANUALSecond Edition (2010)
on behalf of The WFH Laboratory Sciences CommitteeChair (2010): Steve Kitchen, Sheffield, U.K. Deputy Chair: Sukesh Nair, Vellore, India
This edition was reviewed by the following, who at the time of writing were members of the World Federation of Hemophilia Laboratory Sciences Committee:
Mansoor Ahmed Clarence LamNorma de Bosch Sukesh NairAmpaiwan Chuansumrit Alison StreetMarión Echenagucia Alok Srivastava Andreas Hillarp
Some sections were also reviewed by members of the World Federation of Hemophilia von Willebrand Disease and Rare Bleeding Disorders Committee.
Acknowledgement: Several of the methods described are based on laboratory standard operating procedures drafted by Annette Bowyer at the Sheffield Haemophilia Centre, whose contribution is therefore gratefully acknowledged.
Cautionary Note: Where a commercial source is given in this manual, it is an example suitable at the time of writing. This is not intended as an endorsement by the World Federation of Hemophilia (WFH), the authors, or the WFH Laboratory Sciences Committee. Nor does it indicate that other sources are unreliable or unsuitable in any way. Manufacturers of materials used in laboratory tests may alter the composition of materials. Therefore, the future reliability of these sources is unknown at the time of writing.
Author contact [email protected]@nhs.net
Steve KitchenWFH Laboratory Training SpecialistSheffield Haemophilia and Thrombosis CentreRoyal Hallamshire HospitalSheffield, U.K.
Angus McCrawWFH Laboratory Training SpecialistKatharine Dormandy Haemophilia Centre and Thrombosis UnitThe Royal Free HospitalLondon, U.K.
Marión Echenagucia (co-author, Automation)Banco Municipal de Sangre del D.C.Universidad Central de VenezuelaCaracas, Venezuela

1 Laboratory Equipment ... . . . . . . . . . . . . . . . . . . . . . . . . . . . . . . . . . . . . . . . . . . . . . . . . . . . . . . . . . . . . . . . . . . . . . . . . . . . . . . . . . . . . . . . . . . . . 1
2 Checking Pipette and Weighing Balance Calibration ... . . . . . . . . . . . . . . . . . . . . . . . . . . . . . . . . . . . . . 3
3 Laboratory Safety ... . . . . . . . . . . . . . . . . . . . . . . . . . . . . . . . . . . . . . . . . . . . . . . . . . . . . . . . . . . . . . . . . . . . . . . . . . . . . . . . . . . . . . . . . . . . . . . . . . . . . . . 5
4 Sample Collection and Pre-Analytical Variables ... . . . . . . . . . . . . . . . . . . . . . . . . . . . . . . . . . . . . . . . . . . . 11
5 Internal Quality Control and External Quality Assessment ... . . . . . . . . . . . . . . . . . . . . . . . 14
6 Manual Tilt-Tube Technique ... . . . . . . . . . . . . . . . . . . . . . . . . . . . . . . . . . . . . . . . . . . . . . . . . . . . . . . . . . . . . . . . . . . . . . . . . . . . . . . . . 20
7 Preparation and Calibration of Pooled Normal Plasma (PNP) ... . . . . . . . . . . . . . . . . . 22
8 Establishing a Normal Reference Range ... . . . . . . . . . . . . . . . . . . . . . . . . . . . . . . . . . . . . . . . . . . . . . . . . . . . . . . . . . . 24
9 Reagents ... . . . . . . . . . . . . . . . . . . . . . . . . . . . . . . . . . . . . . . . . . . . . . . . . . . . . . . . . . . . . . . . . . . . . . . . . . . . . . . . . . . . . . . . . . . . . . . . . . . . . . . . . . . . . . . . . . . . . 28
10 Platelet Count ... . . . . . . . . . . . . . . . . . . . . . . . . . . . . . . . . . . . . . . . . . . . . . . . . . . . . . . . . . . . . . . . . . . . . . . . . . . . . . . . . . . . . . . . . . . . . . . . . . . . . . . . . . . 30
11 Bleeding Time .... . . . . . . . . . . . . . . . . . . . . . . . . . . . . . . . . . . . . . . . . . . . . . . . . . . . . . . . . . . . . . . . . . . . . . . . . . . . . . . . . . . . . . . . . . . . . . . . . . . . . . . . . . 35
12 Prothrombin Time (PT) ... . . . . . . . . . . . . . . . . . . . . . . . . . . . . . . . . . . . . . . . . . . . . . . . . . . . . . . . . . . . . . . . . . . . . . . . . . . . . . . . . . . . . . . . . . 37
13 Activated Partial Thromboplastin Time (APTT) ... . . . . . . . . . . . . . . . . . . . . . . . . . . . . . . . . . . . . . . . . . . . . 40
14 Mixing Tests For Further Investigation of Abnormal PT and APTT .... . . . . . . . 45
15 Thrombin Clotting Time .... . . . . . . . . . . . . . . . . . . . . . . . . . . . . . . . . . . . . . . . . . . . . . . . . . . . . . . . . . . . . . . . . . . . . . . . . . . . . . . . . . . . . . . 49
16 Thrombin Time in the Presence of Protamine Sulphate to Detect Presence of Heparin ... . . . . . . . . . . . . . . . . . . . . . . . . . . . . . . . . . . . . . . . . . . . . . . . . . . . . . . . . . . . . . . . . . . . . . . . . . . . . . . . . . . . . . . . . . . . . . . . 51
17 Reptilase Time .... . . . . . . . . . . . . . . . . . . . . . . . . . . . . . . . . . . . . . . . . . . . . . . . . . . . . . . . . . . . . . . . . . . . . . . . . . . . . . . . . . . . . . . . . . . . . . . . . . . . . . . . . . 52
18 Fibrinogen (Modifi ed Clauss Assay) ... . . . . . . . . . . . . . . . . . . . . . . . . . . . . . . . . . . . . . . . . . . . . . . . . . . . . . . . . . . . . . . . . . 55
19 Removal of Heparin from Plasma .... . . . . . . . . . . . . . . . . . . . . . . . . . . . . . . . . . . . . . . . . . . . . . . . . . . . . . . . . . . . . . . . . . . . . . 58
20 Fibrinogen Antigen Assay by Radial Immunodiffusion (RID) ... . . . . . . . . . . . . . . . . . . 60
21 Factor XIII Screen ... . . . . . . . . . . . . . . . . . . . . . . . . . . . . . . . . . . . . . . . . . . . . . . . . . . . . . . . . . . . . . . . . . . . . . . . . . . . . . . . . . . . . . . . . . . . . . . . . . . . . 62
ContentsContents
22 Assays Based on Prothrombin Time (Factors II, V, VII, or X) ... . . . . . . . . . . . . . . . . . . . . . 64
23 Factor Assays Based on APTT (One-Stage Assay of FVIII:C, FIX, FXI, or FXII) ... . . . . . . . . . . . . . . . . . . . . . . . . . . . . . . . . . . . . . . . . . . . . . . . . . . . . . . . . . . . . . . . . . . . . . . . . . . . . . . . . . . . . . . . . . . . . . . . . . . . . . . . . . . . . . . 67
24 Factor VIII:C Assays in Cryoprecipitate ... . . . . . . . . . . . . . . . . . . . . . . . . . . . . . . . . . . . . . . . . . . . . . . . . . . . . . . . . . . . 70
25 Two-Stage Clotting Assay for Factor VIII:C ... . . . . . . . . . . . . . . . . . . . . . . . . . . . . . . . . . . . . . . . . . . . . . . . . . . . . 7125.1 Production of Combined Reagent for Two-Stage Factor FVIII:C Assay ... . . . . 73
26 Chromogenic FVIII:C Assay ... . . . . . . . . . . . . . . . . . . . . . . . . . . . . . . . . . . . . . . . . . . . . . . . . . . . . . . . . . . . . . . . . . . . . . . . . . . . . . . . 76
27 One-Stage Intrinsic Assay of Prekallikrein (PKK) and High Molecular Weight Kininogen (HMWK) .... . . . . . . . . . . . . . . . . . . . . . . . . . . . . . . . . . . . . . . . . . . . . . . . . . . . . . . . . . . 79
28 Clotting Factor Inhibitor Screen Based on APTT .... . . . . . . . . . . . . . . . . . . . . . . . . . . . . . . . . . . . . . . . . . . 81
29 Ristocetin Cofactor Activity/von Willebrand Factor Activity (VWF: RCo or VWF:Act) ... . . . . . . . . . . . . . . . . . . . . . . . . . . . . . . . . . . . . . . . . . . . . . . . . . . . . . . . . . . . . . . . . . . . . . . . . . . . . . . . . . . . . . . . 8329.1 Fixed Platelet Preparation ... . . . . . . . . . . . . . . . . . . . . . . . . . . . . . . . . . . . . . . . . . . . . . . . . . . . . . . . . . . . . . . . . . . . . . . . . . . . . . . . . 85
30 Von Willebrand Factor Antigen by Elisa (VWF:Ag) ... . . . . . . . . . . . . . . . . . . . . . . . . . . . . . . . . . . . . . 87
31 Von Willebrand Factor Collagen Binding Assay (VWF:CB) ... . . . . . . . . . . . . . . . . . . . . . . . 90
32 Factor VIII Binding Assay for Diagnosis of von Willebrand Disease Normandy .... . . . . . . . . . . . . . . . . . . . . . . . . . . . . . . . . . . . . . . . . . . . . . . . . . . . . . . . . . . . . . . . . . . . . . . . . . . . . . . . . . . . . . . . . . . . . . . . . 93
33 VWF Multimer Analysis .. . . . . . . . . . . . . . . . . . . . . . . . . . . . . . . . . . . . . . . . . . . . . . . . . . . . . . . . . . . . . . . . . . . . . . . . . . . . . . . . . . . . . . . . 99
34 Quantitative Measurement of FVIII Inhibitors ... . . . . . . . . . . . . . . . . . . . . . . . . . . . . . . . . . . . . . . . . . . . . . 108
35 Factor IX Inhibitor Assay ... . . . . . . . . . . . . . . . . . . . . . . . . . . . . . . . . . . . . . . . . . . . . . . . . . . . . . . . . . . . . . . . . . . . . . . . . . . . . . . . . . . . . 113
36 Factor XIII Activity Assay.... . . . . . . . . . . . . . . . . . . . . . . . . . . . . . . . . . . . . . . . . . . . . . . . . . . . . . . . . . . . . . . . . . . . . . . . . . . . . . . . . . . 114
37 Lupus Anticoagulant and Anti-Phospholipid Antibodies ... . . . . . . . . . . . . . . . . . . . . . . . . 117
38 Dilute Russell’s Viper Venom Time (DRVVT) ... . . . . . . . . . . . . . . . . . . . . . . . . . . . . . . . . . . . . . . . . . . . . . . 12038.1 Preparation of Washed Platelets for DRVVT .... . . . . . . . . . . . . . . . . . . . . . . . . . . . . . . . . . . . . . . . . . . . . . . 123
39 Platelet Function Testing ... . . . . . . . . . . . . . . . . . . . . . . . . . . . . . . . . . . . . . . . . . . . . . . . . . . . . . . . . . . . . . . . . . . . . . . . . . . . . . . . . . . . . . 12439.1 Clot Retraction ... . . . . . . . . . . . . . . . . . . . . . . . . . . . . . . . . . . . . . . . . . . . . . . . . . . . . . . . . . . . . . . . . . . . . . . . . . . . . . . . . . . . . . . . . . . . . . . . . . 12539.2 Measurement of Platelet Aggregation ... . . . . . . . . . . . . . . . . . . . . . . . . . . . . . . . . . . . . . . . . . . . . . . . . . . . . . . . . . . 126
40 Lyophilization of Plasma .... . . . . . . . . . . . . . . . . . . . . . . . . . . . . . . . . . . . . . . . . . . . . . . . . . . . . . . . . . . . . . . . . . . . . . . . . . . . . . . . . . . . 135
41 Evaluation and Use of Coagulometers ... . . . . . . . . . . . . . . . . . . . . . . . . . . . . . . . . . . . . . . . . . . . . . . . . . . . . . . . . . . . 137
42 Molecular Genetic Analysis ... . . . . . . . . . . . . . . . . . . . . . . . . . . . . . . . . . . . . . . . . . . . . . . . . . . . . . . . . . . . . . . . . . . . . . . . . . . . . . . . 144

LABORATORY EQUIPMENT 1
Laboratory Equipment 1
Any laboratory involved in the diagnosis and treatment of bleeding disorders employing some or all of the techniques described in this manual will require a minimum of basic equipment. Note that evaluation and use of semi-automated and fully automated coagulometers are dealt with in Section 41.
THE BASIC EQUIPMENT REQUIREMENTS ARE:
A 4°C refrigerator for reagent storage Reagents should normally be maintained at 2°C–8°C unless otherwise stated by the manufacturer. A good-quality domestic-grade unit may be adequate.
A deep freeze able to maintain at least -35°CA lower temperature, such as -70°C, is useful for more prolonged storage. Clotting factors are stable at this temperature for at least six months (Woodhams et al., 2001). Freezers of -20°C are typically inadequate for storage of plasmas and reagents for many tests of hemostasis. Freezers with an auto defrost cycle are completely unsuitable.
Regulated water bath(s) capable of maintaining temperatures of 37°C ± 0.5°C Dry hot blocks may or may not be suitable, depending on the unit. Temperature is normally better maintained in a water bath.
A pH meter
A light source (for example, an Anglepoise lamp)
Stopwatch(es)
Calibrated automatic pipettes capable of accurate and precise delivery of sample and reagent volume in the range of 0 µl–200 µl and up to 1000 µl It is important that the accuracy of these is checked (see Section 2).
A calibrated pipette for delivery of liquid volumes up to 5 ml
A centrifuge capable of generating at least 1700 g For most coagulation analyses, centrifugation at room temperature (20°C–25°C) is acceptable. (In some techniques, 2500 g and centrifugation at 4°C are recommended.)
DIAGNOSIS OF HEMOPHILIA AND OTHER BLEEDING DISORDERS2
A calibrated analytical weighing scale/balance capable of accurate measurement of grams to three decimal places See Section 2 for a procedure to check accuracy.
Additional equipment is required for some procedures, including:
a microtitre plate reader for enzyme-linked immunosorbent techniques (ELISA)
a platelet aggregometer
equipment specifi ed on particular method sheets.
Air conditioning in each room is a great advantage in countries where temperatures are high.
There should be an adequate supply of consumables. Re-use of laboratory test tubes and pipette tips after washing should be avoided, since residual material can adversely affect results, causing wastage of reagents and time.
REFERENCE
Woodhams B, Girardot O, Blanco MJ, Colesse G, and Gourmelin Y. Stability of coagulation proteins in frozen plasma. Blood Coagul Fibrinolysis 2001; 12:229–36.

CHECKING PIPETTE AND WEIGHING BALANCE CALIBRATION 3
2Checking Pip ette and Weighing Balance Calibration
To aid quality management, balance calibration and pipette volume calibration should be checked every three to six months. Apparatus signifi cantly out of calibration should be immediately removed from use until recalibration has been done. All pipettes should carry a unique identifi er.
METHOD FOR CHECKING PIPETTE CALIBRATION
1 Pipettes may be for a single volume, for two or three volumes, or have a continuous range of volumes.
Pipettes with one or two fi xed settings are checked at each setting.
Pipettes with three fi xed settings are checked at minimum and maximum setting.
Pipettes with a continuous range of volume settings: check the maximum setting as well as a volume of around 25% of the maximum setting. That is:
10 ml pipette — 10 ml and 2.5 ml
5 ml pipette — 5 ml and 1.25 ml
1 ml pipette — 1 ml (1000 µl) and 0.25 ml (250 µl)
0.2 ml pipette — 0.2 ml (200 µl) and 0.05 ml (50 µl)
0.1 ml pipette — 0.1 ml (100 µl) and 0.025 ml (25 µl)
50 µl pipette — 50 µl and 15 µl
2 Check calibration by weighing fi ve replicate volumes of distilled water (at room temperature) on a balance. Each weight is recorded in grams (to three decimal places). For practical purposes, 1.000 ml weighs 1.000 g.
RESULTS
Results and any action taken should be recorded.
When a pipette is shown to be inaccurate because the mean pipetted volume differs by more than 10% from stated volume, it must be taken out of use

DIAGNOSIS OF HEMOPHILIA AND OTHER BLEEDING DISORDERS4
immediately and not used until re-calibrated following manufacturer’s instructions. Pipettes should preferably be accurate within signifi cantly less than 10%.
Note: If a pipette is inaccurate beyond the following limits (mean weight), it must be taken out of use immediately.
METHOD FOR CHECKING BALANCES
To ensure their accuracy, calibrated weights are weighed at six-month intervals, and the values recorded.
1 Zero the balance.
2 Weigh the three calibrated weights, one at a time. Record the weights to three decimal places (e.g. 1.003 g).
3 If any weights are outside the stated limits (by >2%), remove them from use until the problem is rectifi ed.
10 ml pipette10 ml: 9.000 g - 11.000 g2.5 ml: 2.250 g - 2.750 g
5 ml pipette5 ml: 4.500 g - 5.500 g1.25 ml: 1.125 g - 1.375 g
1 ml pipette 1 ml: 0.900 g - 1.100 g0.25 ml: 0.225 g - 0.275 g
0.2 ml pipette0.2 ml: 0.180 g - 0.220 g0.05 ml: 0.045 g - 0.055 g
0.1 ml pipette0.1 ml: 0.090 g - 0.110 g025 ml: 0.225 g - 0.0275 g
50 µl pipette 50 µl: 0.045 g - 0.055 g15 µl: 0.013 g - 0.165 g

LABORATORY SAFETY 5
3Laboratory Safety
Laboratories that handle chemicals and biological samples are potentially hazardous places.
In recent years, there has been an increasing appreciation of the importance of safe working practices in industry, for both health and environmental reasons. This awareness has lead to greater stress on issues such as safety documentation, staff training, and risk assessment.
Employers have a responsibility to provide the necessary protective clothing and equipment, and they are required to provide training in safe working practices.
If safe working practices are in place, the probability of serious injury to yourself, your colleagues, and members of the public should be greatly reduced.
SAFETY OFFICERS
It is important to appoint a safety offi cer or offi cers for each department. These people will take on the responsibilities of introducing and maintaining safety procedures. Nevertheless, safety is the responsibility of all staff in the laboratory.
SAFETY MANUAL
There should be a comprehensive safety manual that covers all aspects of safe working practices for the whole department.
All staff members must read the manual and sign a declaration to indicate that they have understood it.
Copies should be kept with the safety offi cers and also made available in places that are easily accessible to all members of the staff.
SAFETY MEASURES: UNIVERSAL PRECAUTIONS
The system of universal precautions requires that any danger of infection from any source will be avoided or minimized by good working practices.
All blood samples, blood products (including plasma-based reagents and kits), and other human body materials should be regarded as posing a possible danger of infection.
DIAGNOSIS OF HEMOPHILIA AND OTHER BLEEDING DISORDERS6
The fullest possible protective measures should always be taken when working with any material.
No other classifi cation of risk should be made. All body fl uids and materials other than blood, whether collected or brought into the unit for testing or any other purpose, should be handled with the same care as that given to blood.
The Laboratory
The laboratory should always be clean and tidy. Paperwork should be kept separate from laboratory testing areas. Try not to use the laboratory for storage of bulk items. Try to ensure that everyone participates in keeping the laboratory orderly.
Protective Clothing
Everyone who enters the laboratory, including visitors, should wear a laboratory coat. They should immediately replace the coat if it becomes contaminated.
Disposable Gloves
Many people do not like to use gloves, but every sample handled in the laboratory is potentially hazardous. Gloves should always be worn when handling toxic material.
Gloves and coats will obviously not protect against a needlestick-type accident, but they will prevent, for example, HIV positive serum or a toxin coming into contact with any cuts or abrasions on your skin.
Always replace gloves immediately if they are broken or punctured.
Eye Washing
Many infections can be easily acquired by contact with the mucous membranes of the eyes.
Wash your eyes immediately with lots of cold running water if contact with a possible infectious material may have occurred.
Sharps
Sharps, in the form of needles and broken glass, present a great danger: use a sharp box capable of containing sharps without being punctured.
There have been cases of workers becoming infected as a result of needlestick injuries.
Aerosols
Avoid all practices in the open laboratory that may cause splashing or the release of airborne droplets or dust.

LABORATORY SAFETY 7
Operations that cause aerosols must always be carried out in a suitable fume cupboard, and safety glasses must be worn.
All spills should be cleaned up immediately, using bleach or a neutralizing agent as necessary.
Toxic and Flammable Substances
Toxic or fl ammable materials must always be contained within a fume cupboard or suitable safe box.
Electrical Equipment
Take special care with any equipment that uses liquids, such as electrophoresis tanks and water baths.
Always leave installation, servicing, and repairs to qualifi ed personnel.
Personal Possessions and Behaviour
Never take personal items, such as pens, bags, and combs, into the laboratory.
Avoid bringing your hands into contact with your face or mucosae (eyes, nose, and mouth) while in the laboratory but if you must do this, always wash your hands fi rst.
Food, cigarettes, and cosmetics must never be brought into the laboratory.
Never mouth a pipette.
Always wash hands thoroughly before leaving the laboratory.
Accidents
All accidents should be reported immediately and should be recorded in an accident book kept by the unit Safety Offi cer. This is particularly important in relation to needlestick injuries. In these situations, follow local hospital systems for recording and reporting, along with any locally recommended or mandated actions.
THE CONTROL OF SUBSTANCES HAZARDOUS TO HEALTH (COSHH)
This legislation, used in U.K. laboratories, is a useful guide in identifying risks and hazards.
Hazard and Risk
The hazard presented by a substance is its potential to cause harm. The risk from that substance is the likelihood of its harming someone under the actual conditions of use.

DIAGNOSIS OF HEMOPHILIA AND OTHER BLEEDING DISORDERS8
Identifi cation of Hazards
The identifi cation of hazards is an essential prerequisite of risk assessment. The time spent in identifying the hazards will vary according to the substance.
Risk Assessment
Consider the following facts:
the hazards
the conditions of use
the amounts to be used
the likely routes or sites of exposure (inhalation, ingestion, skin, or eyes)
The outcome of the risk assessment will determine:
the storage conditions
the handling procedures
the disposal procedures
the requirement of monitoring and health surveillance
the emergency procedures
Risk assessment must be reviewed annually and updated if necessary.
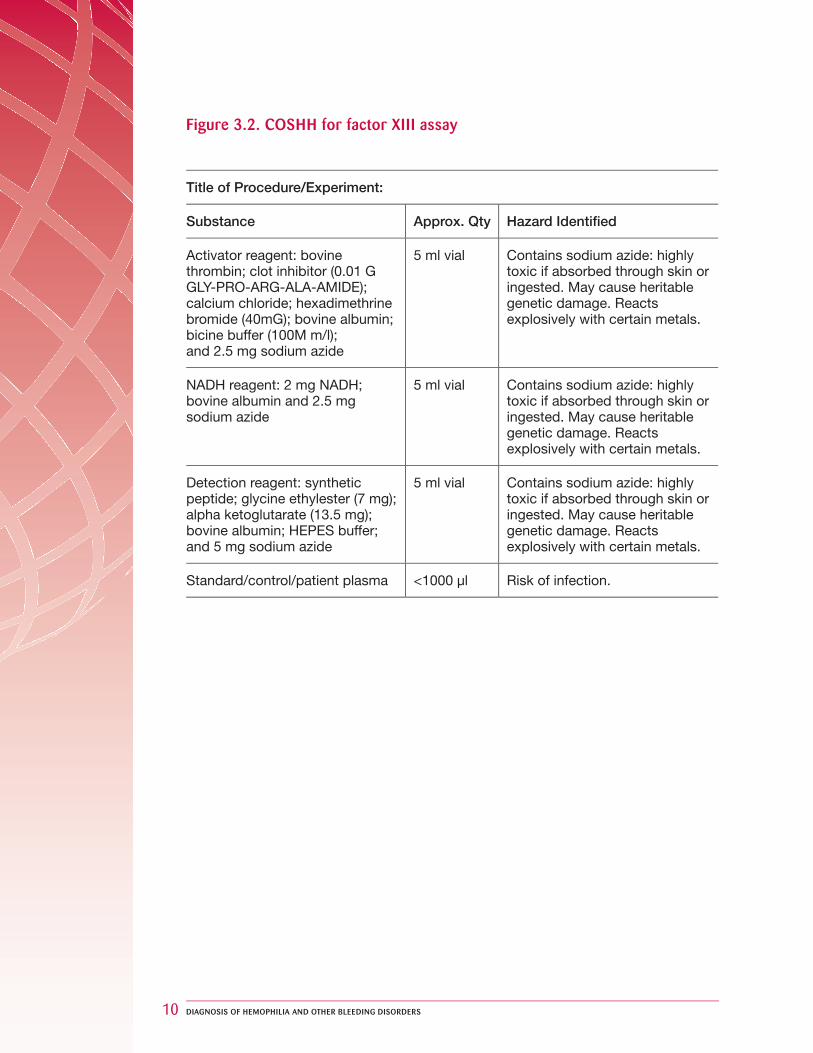
See fi gures 3.1 and 3.2, below, for examples of how to record information for risk assessments, in these cases using the COSHH procedure.
The purpose of this form is to identify the hazards and control measures associated with equipment used in a particular procedure. Only staff documented as competent should perform any procedure, and they should perform that procedure only after reviewing the health and safety documentation related to that particular test.

LABORATORY SAFETY 9
Figure 3.1. COSHH for prothrombin time and APTT-based clotting factor assay
COSHH Ref. No. Assays 1 Lab. Ref. One-Stage II, V, VII, VIII, IX, X, XI and XII Assay
Title of Procedure/Experiment:
Substance Approx. Qty Hazard Identifi ed
Glyoxaline (imidazole) buffer, contains (see**)
<5 ml Harmful if ingested.
**Imidazole 3.4 g/l Corrosive: causes burns. Harmful if inhaled, ingested, or absorbed through skin. Irritating to eyes.
**Sodium chloride 5.85 g/l Irritating to eyes and lungs. Avoid skin contact.
Factor-de� cient plasma 1 ml Risk of infection
Thromboplastin 2 ml Low risk
APTT Reagent 2 ml Low risk
0.025M calcium chloride 5 ml Low risk
Owren’s buffer <500 ml Contains barbitone. Harmful if swallowed. May cause sensitization by contact to skin or inhalation.
Coagulation analyser wash solution 1
<50 ml Causes burns: harmful to eyes, skin, etc. Do not mix with other disinfectants.Corrosive. Contact with combustible materials may cause � re. Contact with acid liberates toxic gas. Reacts violently with ammonium salts; organic solvent — explosive risk.
Coagulation analyser wash solution 2
<50 ml Contains 0.16% hydrochloric acid and detergent. Irritant: may harm eyes and skin.
Standard/control/patient plasma <1000 µl Risk of infection.
DIAGNOSIS OF HEMOPHILIA AND OTHER BLEEDING DISORDERS10
Figure 3.2. COSHH for factor XIII assay
Title of Procedure/Experiment:
Substance Approx. Qty Hazard Identifi ed
Activator reagent: bovine thrombin; clot inhibitor (0.01 G GLY-PRO-ARG-ALA-AMIDE); calcium chloride; hexadimethrine bromide (40mG); bovine albumin; bicine buffer (100M m/l); and 2.5 mg sodium azide
5 ml vial Contains sodium azide: highly toxic if absorbed through skin or ingested. May cause heritable genetic damage. Reacts explosively with certain metals.
NADH reagent: 2 mg NADH; bovine albumin and 2.5 mg sodium azide
5 ml vial Contains sodium azide: highly toxic if absorbed through skin or ingested. May cause heritable genetic damage. Reacts explosively with certain metals.
Detection reagent: synthetic peptide; glycine ethylester (7 mg); alpha ketoglutarate (13.5 mg); bovine albumin; HEPES buffer; and 5 mg sodium azide
5 ml vial Contains sodium azide: highly toxic if absorbed through skin or ingested. May cause heritable genetic damage. Reacts explosively with certain metals.
Standard/control/patient plasma <1000 µl Risk of infection.

SAMPLE COLLECTION AND PRE-ANALYTICAL VARIABLES 11
4Sample Collection and Pre-Analytical Variables
SAMPLE COLLECTION
A number of detailed guidelines describe the procedures for collection and processing of blood samples for tests of hemostasis (CLSI 2007, 2008a, 2008b).
When possible, venous blood should be collected from veins in the bend of the elbow, using a tourniquet to facilitate collection. The tourniquet should be applied just before sample collection. The needle should not be more than 21-gauge for adults, and the sample should be collected using a syringe and/or an evacuated collection system that allows rapid collection of the blood sample. The blood should be drawn gently into the syringe. For infants, a 22- or 23-gauge needle may be necessary.
Any sample that is not obtained quickly with an immediately successful venipuncture should be discarded because of possible activation of coagulation. The blood should not be passed back through the needle after collection into a syringe. The needle should be removed before passing the blood from the syringe into the container with anticoagulant. There should be no delay between collection and mixing with anticoagulant.
Once blood and anticoagulant are mixed, the container should be sealed and mixed by gentle inversion fi ve times. Avoid vigorous shaking. Some authors recommend that the fi rst 5 ml of blood drawn should not be used for tests of hemostasis.
If an evaluated collection system is employed, it should be noted that mixing by fi ve gentle inversions is still required after the blood has been drawn into anticoagulant.
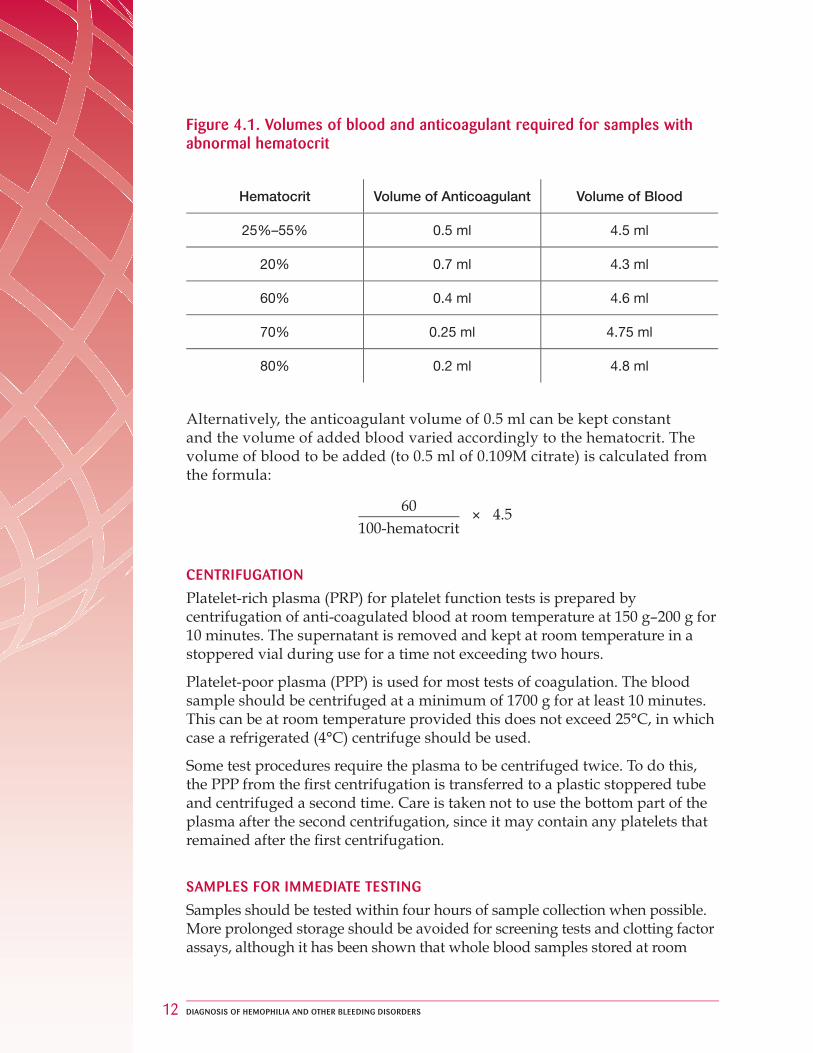
The blood should be mixed with sodium citrate anticoagulant in the proportion 9 parts blood: 1 part anticoagulant. This should be 0.109M (3.2% trisodium citrate dihydrate) or similar (e.g. 0.105M citrate anticoagulant is successfully used in some evacuated systems). Anticoagulant solution can be stored at 4°C for up to three months, but it should be inspected prior to use and discarded if particulate material is present — for example, when contamination has occurred. The sample container should not induce contact activation (i.e. use plastic or siliconized glass). If the patient has a reduced hematocrit, or particularly if the hematocrit is raised, results can be affected. The volume of anticoagulant should be adjusted to take account of the reduced plasma volume. Figure 4.1., below, is a guide to the volume of anticoagulant required for a 5 ml sample.
DIAGNOSIS OF HEMOPHILIA AND OTHER BLEEDING DISORDERS12
Figure 4.1. Volumes of blood and anticoagulant required for samples with abnormal hematocrit
Hematocrit Volume of Anticoagulant Volume of Blood
25%–55% 0.5 ml 4.5 ml
20% 0.7 ml 4.3 ml
60% 0.4 ml 4.6 ml
70% 0.25 ml 4.75 ml
80% 0.2 ml 4.8 ml
Alternatively, the anticoagulant volume of 0.5 ml can be kept constant and the volume of added blood varied accordingly to the hematocrit. The volume of blood to be added (to 0.5 ml of 0.109M citrate) is calculated from the formula:
60× 4.5
100-hematocrit
CENTRIFUGATION
Platelet-rich plasma (PRP) for platelet function tests is prepared by centrifugation of anti-coagulated blood at room temperature at 150 g–200 g for 10 minutes. The supernatant is removed and kept at room temperature in a stoppered vial during use for a time not exceeding two hours.
Platelet-poor plasma (PPP) is used for most tests of coagulation. The blood sample should be centrifuged at a minimum of 1700 g for at least 10 minutes. This can be at room temperature provided this does not exceed 25°C, in which case a refrigerated (4°C) centrifuge should be used.
Some test procedures require the plasma to be centrifuged twice. To do this, the PPP from the fi rst centrifugation is transferred to a plastic stoppered tube and centrifuged a second time. Care is taken not to use the bottom part of the plasma after the second centrifugation, since it may contain any platelets that remained after the fi rst centrifugation.
SAMPLES FOR IMMEDIATE TESTING
Samples should be tested within four hours of sample collection when possible. More prolonged storage should be avoided for screening tests and clotting factor assays, although it has been shown that whole blood samples stored at room
SAMPLE COLLECTION AND PRE-ANALYTICAL VARIABLES 13
temperature may be stable for prothrombin time measurements (Baglin and Luddington 1997). Samples for screening tests and assay of factor VII should be maintained at room temperature to avoid the possibility of cold activation.
HIGH-RISK SAMPLES
Care should be taken when handling all plasma samples because of the risk of transmission of hepatitis, HIV, and other viruses.
See Section 2, Laboratory Safety.
DEEP-FREEZING PLASMA
Samples can be stored deep frozen for testing at a later stage. Storage at -70°C or lower is preferable. Clotting factors are stable at this temperature for at least six months (Woodhams et al. 2001). Short-term sample storage at -35°C is adequate for most tests. Storage at -20°C is usually inadequate. Double centrifugation (see Centrifugation, above) should be used if samples are deep-frozen prior to analysis for lupus anticoagulant.
Freezing and thawing is best avoided before APTT determinations, since results obtained by some techniques can be affected. Any frozen plasmas must be transferred immediately to a 37°C water bath, thawed for four to fi ve minutes, and mixed by gentle inversion prior to analysis. A slow thaw at lower temperature should be avoided to prevent the formation of cryoprecipitate, which reduces the FVIII:C, VWF, and fi brinogen content of the supernatant plasma.
REFERENCES
Baglin T, Luddington R. Reliability of delayed INR determination: implications for decentralised anticoagulant care with off-site blood sampling. Br J Haem 1997; 96:431-4.
Clinical and Laboratory Standards Institute (CLSI). Procedures for the collection of diagnostic blood specimens by venipunture: Approved standard, 6th ed. 2007; Clinical and Laboratory Standards Institute Document H3-A6: 27(26).
Clinical and Laboratory Standards Institute (CLSI). Procedures and devices for the collection of diagnostic capillary blood specimens: Approved standard, 6th ed. 2008 (a); Clinical and Laboratory Standards Institute Document H4-A6: 28(25).
Clinical and Laboratory Standards Institute (CLSI). Collection, transport, and processing of blood specimens for testing plasma-based coagulation assays and molecular hemostasis assays: Approved guideline, 5th ed. 2008 (b); Clinical and Laboratory Standards Institute Document H21-A5: 28(5).
Woodhams B, Girardot O, Blanco MJ, Colesse G, Gourmelin Y. Stability of coagulation proteins in frozen plasma. Blood Coagul Fibrinolysis 2001; 12:229-36.

DIAGNOSIS OF HEMOPHILIA AND OTHER BLEEDING DISORDERS14
Quality assurance (QA) is an overall term that may be used to describe all measures taken to ensure the reliability of laboratory testing and reporting. This includes the choice of test, the collection of a valid sample from the patient, analysis of the specimen and the recording of results in a timely and accurate manner, through to interpretation of the results, where appropriate, and communication of these results to the referring clinicians.
Internal quality control (IQC) and external quality assessment (EQA) (sometimes referred to as profi ciency testing) are two distinct, yet complementary, components of a laboratory quality assurance program. IQC is used to establish whether a series of techniques and procedures are performing consistently over a period of time. It is therefore deployed to ensure day-to-day laboratory consistency. EQA is used to identify the degree of agreement between one laboratory’s results and those obtained by other centres.
In large EQA schemes, retrospective analysis of results obtained by participating laboratories permits the identifi cation, not only of poor individual laboratory performance, but also of reagents and methods that produce unreliable or misleading results.
The primary function of EQA is profi ciency testing of individual laboratory testing. The World Federation of Hemophilia International EQA scheme includes analyses of particular relevance to the diagnosis and management of bleeding disorders (for further information, contact the WFH). Data from this scheme have been published in the following references:
Jennings I, Kitchen S, Woods TAL, Preston FE. Development of a World Federation of Hemophilia External Quality Assessment Scheme: results of a pilot study. Haemophilia 1996; 2: 4-46
Jennings I, Kitchen S, Woods TAL, Preston FE. Laboratory performance of haemophilia centres in developing countries: 3 years’ experience of the World Federation of Hemophilia External Quality Assessment Scheme. Haemophilia 1998; 4: 739-746.
Jennings I, Kitchen DP, Woods TA, Kitchen S, Walker ID, Preston FE. Laboratory performance in the WFH EQA programme 2003-2008. Haemophilia. 2009; 15:571-7.
5 Internal Quality Control and External Quality Assessment
INTERNAL QUALITY CONTROL AND EXTERNAL QUALITY ASSESSMENT 15
WFH EQA SCHEME CONTACT INFORMATION (2010)
Director: Prof. F. Eric PrestonScientifi c Director: Dr. Steve Kitchen
Rutledge Mews3 Southbourne RoadSheffi eld S10 2QNUnited KingdomTel: + 44 - 114 - 267 3300Fax: + 44 - 114 - 267 3309Website: www.ukneqasbc.org
Larger EQA schemes can provide information concerning the relative performance of analytical procedures, including the method principle, reagents, and instruments. Continued participation in EQA schemes has been linked to improved laboratory performance. This has been seen not only in the overall performance, evidenced by a reduction of the variability of results between laboratories, but also in respect of individual laboratories.
The assessment of individual laboratory performance is an essential component of EQA schemes. The WFH EQA scheme compares participants’ results with the results on the same samples when analysed in up to 700 centres from around the world who participate in the U.K. National External Quality Assessment Scheme (UK NEQAS) for Blood Coagulation.
There are many reasons why a laboratory might produce results that are considered unsatisfactory. While the cause for this might be immediately apparent, the identifi cation of the underlying problem is not always simple. Larger schemes are able to identify performance problems that relate specifi cally to reagent differences or differences of methodology.
Total confi dentiality is an important feature of all EQA schemes. In the International EQA referred to above, information regarding individual laboratory performance is divulged to anyone other than the nominated head of the department only with written authorization.
INTERNAL QUALITY CONTROL
Internal quality control is used to establish whether a series of techniques and procedures are performing consistently over a period of time. The expression “quality control” is commonly used to describe the set of procedures used to check that the results of laboratory investigations are reliable enough to be released to assist clinical decision making, monitoring of therapy, and diagnosis of hemostatic abnormalities. Quality control procedures should be applied in a way that ensures immediate and constant control of result generation.
DIAGNOSIS OF HEMOPHILIA AND OTHER BLEEDING DISORDERS16
Within a laboratory setting, the quality of results obtained is infl uenced by many factors, including:
appropriate sample collection and handling
selection of suitable techniques and maintenance of an up-to-date manual of standard operational procedures
use of reliable reagents and reference materials
selection of suitable automation and adequate maintenance
adequate records
reporting system for results
In addition, the quality of results obtained in routine practice is highly dependent on the selection, training, and motivation of an appropriate complement of suitable personnel.
Internal quality control is particularly useful to identify the degree of precision of a particular technique — precision being the degree of agreement among repeat measurements on one sample. It is important to recognize that a precise technique is not necessarily accurate, accuracy being a measure of the closeness of an estimated value to the true value.
QUALITY CONTROL MATERIALS
To assess the precision of a particular method, it is necessary to perform repeated analyses of aliquots of the same sample. It is important to include quality control (QC) samples with normal and abnormal values to ensure that a method is under control at different levels of a particular analyte, since relatively minor changes in an analytical process may be more apparent when testing an abnormal control.
The control material should be similar in properties to test samples and be analysed concurrently. Quality control materials of human origin are more likely to closely resemble human test samples. All vials or aliquots of the control material should be practically identical, so that any variation in test results is not a consequence of vial-to-vial variation.
The QC material should also be stable for its intended period of use. In respect of hemostatic tests and assays, plasma samples have to be deep frozen (preferably at -35°C or lower) or lyophilized in order ensure adequate stability for use as QC material. For reconstitution of lyophilized samples, it is important to use distilled water with pH 6.8–7.2 and to allow at least fi ve minutes for reconstitution.
If commercial QC material is used, this should be reconstituted according to manufacturer’s instructions using an accurate pipetting system. If deep frozen

INTERNAL QUALITY CONTROL AND EXTERNAL QUALITY ASSESSMENT 17
QC material is used, this should be thawed rapidly at 37°C for fi ve minutes. In the selection of QC material, the risk of transmission of blood-borne viruses should be considered. High-risk material should not be used.
At least one QC material should be included with each group of screening tests or assays. For screening tests, it may be most appropriate to include a normal QC in this way and to test abnormal QC materials once per day or shift, or when doubt exists about whether a method is under control. For a guide to troubleshooting problems with PT/APTT IQC problems when analyzing two different levels, see Figure 5.1, below.
Figure 5.1. IQC troubleshooting
PT Level 1 IQC
PT Level 2 IQC
APTT Level 1 IQC
APTT Level 2 IQC
Conclusion/Check
Out In In In PT Level 1 IQC material
Out Out In In PT reagent
In In Out In APTT Level 1 IQC material
In In Out Out APTT reagent
Out Out Out Out Instrument
A QC material with a reduced level should be included with tests used for the diagnosis and monitoring of congenital defi ciency states associated with bleeding.
In all cases, the control material must be treated exactly like test samples, if possible. Since some variation will necessarily occur as a result of biological, technical, and analytical variation, each QC result should be recorded and assessed against the range considered to be acceptable, as described below.
ACCEPTABLE LIMITS OF VARIATION
For commercial IQC, samples manufacturers often provide a target range of acceptable values. In the case of screening tests and occasional assays, the results obtained will be dependent on the reagents and endpoint detection system used to perform the tests. The target range must take account of these effects. Where a target range is not available for a particular technique, this can be established locally.

DIAGNOSIS OF HEMOPHILIA AND OTHER BLEEDING DISORDERS18
The IQC material is tested repeatedly (minimum 10 times) on different days when the method is known to be under control (as indicated, for example, by within target results on an alternative QC material).
The mean and standard deviation (SD) of these results are then calculated. The SD is the square root of the sum of d2 divided by n-1, where d is the difference of individual results from the mean and n is the number of determinations. The SD is a measure of the spread of results: the larger the SD, the greater the spread of results. Another important parameter is the coeffi cient of variation (CV), which is the SD expressed as a percentage of the mean (CV = SD divided by mean, multiplied by 100%). The CV of results on different days for prothrombin time and activated partial thromboplastin times of a QC sample should always be less than 8%, and preferably lower. For assays such as FVIII:C and FIX, CVs of less than 10% should be attainable for tests performed over a number of days.
In most cases, results obtained for an IQC sample will show a normal (Gaussian) distribution. It is common practice to set the target range for IQC results as the mean ± 2 SD, since this should include 95% of values.
Individual results should be recorded on a chart that identifi es the target range. An example is shown in Figure 5.2, opposite. Any future values that lie within these limits are considered acceptable.
Results outside this range indicate that the QC material has deteriorated or been handled incorrectly, or that the method is not properly controlled. Repeat testing of further QC material will then differentiate between these two possibilities, further out-of-limit results confi rming that the test system is out of control. Medium or long-term drift in QC test results — for example, due to instrument or reagent deterioration or change — will become apparent by scrutiny of cumulative record charts.

INTERNAL QUALITY CONTROL AND EXTERNAL QUALITY ASSESSMENT 19
Fact
or V
III:C
act
ivity
(iu/
dl)
50
Date of test
60
70
80
90
1-2-
98
2-2-
98
3-2-
98
4-2-
98
5-2-
98
6-2-
98
7-2-
98
8-2-
98
9-2-
98
10-2
-98
11-2
-98
12-2
-98
13-2
-98
14-2
-98
15-2
-98
16-2
-98
17-2
-98
18-2
-98
19-2
-98
20-2
-98
21-2
-98
22-2
-98
23-2
-98
24-2
-98
25-2
-98
26-2
-98
27-2
-98
28-2
-98
Each point is a different assay on the same material. The solid lines represent the mean and two standard deviations of 20 assays on this material, considered to represent the limits of acceptable results.
Figure 5.2. Results of FVIII:C assays on an internal quality control sample assayed on different days

DIAGNOSIS OF HEMOPHILIA AND OTHER BLEEDING DISORDERS20
6
Although many different instruments for coagulation tests are available (see Section 41 on automation) and in use throughout the world, the manual tilt-tube technique is still employed successfully by many centres. Even where automation is in use, it may be necessary to perform some tests manually because of the incompatibility of occasional samples and the particular instrument in use. This may be the case in the presence of grossly elevated plasma lipid concentrations, in the analysis of icteric samples, or where the clot formation pattern in the sample differs markedly from normal samples, particularly when the fi brinogen concentration is markedly reduced.
Manual clotting tests are best performed in glass tubes. A convenient size is 75 × 10 mm. Different types of glass can be used successfully, but they may infl uence the clotting times obtained, particularly in screening tests such as activated partial thromboplastin time (APTT). If the source (manufacturer or composition) of test tubes is changed, the possibility that results have been infl uenced should be considered. This could be done by comparing a small number of tests, such as APTT, with the two types of tube. If systematic differences are present, a new normal range should be established. Washing of test tubes for re-use should be avoided when possible.
Because of the many variables and possible sources of contamination associated with manual techniques, these should involve duplicate tests. In any case, if clotting times of duplicate tests differ by more than 10%, the test should be repeated.
When using manual tilt-tube technique, the following features are important:
Reagents must be pre-warmed to 37°C for at least fi ve minutes before use in clotting tests.
Mixtures of test plasma and reagent should be mixed immediately after addition of the last component of the mixture by rapid controlled shaking of the test tube for one to two seconds, and a stop-watch started simultaneously.
The mixture should then be tilted through 90° three times every fi ve seconds under observation while recording the clotting time. This procedure is shown in Figure 6.1, opposite.
Manual Tilt-Tube Technique

MANUAL TILT-TUBE TECHNIQUE 21
The test tube should be immersed in a 37°C (±0.5°C) water bath between tilting operations so that the base of the test tube is approximately 3-4 cm below the surface, to help maintain the temperature of the incubation mixture as close to 37°C as possible.
The clotting mixture should be scrutinized visually under an Anglepoise lamp or similar light source and the clotting time recorded.
Figure 6.1. Manual tilt-tube technique for tests of coagulation
seconds
Tilt 3 times every 5 seconds
× 3
05
DIAGNOSIS OF HEMOPHILIA AND OTHER BLEEDING DISORDERS22
7
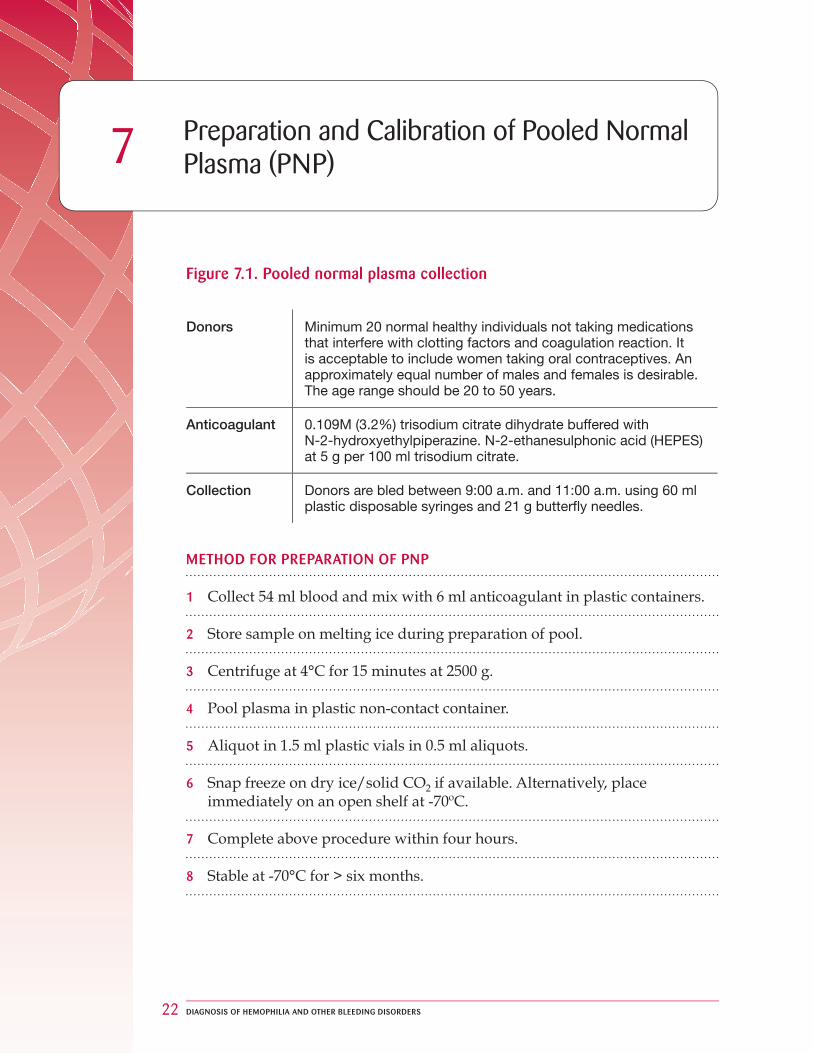
Figure 7.1. Pooled normal plasma collection
Donors Minimum 20 normal healthy individuals not taking medications that interfere with clotting factors and coagulation reaction. It is acceptable to include women taking oral contraceptives. An approximately equal number of males and females is desirable. The age range should be 20 to 50 years.
Anticoagulant 0.109M (3.2%) trisodium citrate dihydrate buffered with N-2-hydroxyethylpiperazine. N-2-ethanesulphonic acid (HEPES) at 5 g per 100 ml trisodium citrate.
Collection Donors are bled between 9:00 a.m. and 11:00 a.m. using 60 ml plastic disposable syringes and 21 g butter¦ y needles.
METHOD FOR PREPARATION OF PNP
1 Collect 54 ml blood and mix with 6 ml anticoagulant in plastic containers.
2 Store sample on melting ice during preparation of pool.
3 Centrifuge at 4°C for 15 minutes at 2500 g.
4 Pool plasma in plastic non-contact container.
5 Aliquot in 1.5 ml plastic vials in 0.5 ml aliquots.
6 Snap freeze on dry ice/solid CO2 if available. Alternatively, place immediately on an open shelf at -70ºC.
7 Complete above procedure within four hours.
8 Stable at -70°C for > six months.
Preparation and Calibration of Pooled Normal Plasma (PNP)

PREPARATION AND CALIBRATION OF POOLED NORMAL PLASMA (PNP) 23
A pooled normal plasma (PNP) prepared in this way will have levels of factors II, V, VII, IX, X, XI, XII, HMWK, and prekallikrien of around 1 U/ ml or 100 U/dl, although the levels of FVIII and von Willebrand factor (VWF) vary widely in different pools of PNP. Such a local PNP should be calibrated in International Units (IU), since international standards are now available for all the above-mentioned clotting factors, with the exception of FXII. The pool can be used uncalibrated with an assumed potency of 100 U/dl or 1 U/ml for FXII. To calibrate in IU, it is necessary either to obtain calibrated WHO reference preparations (which are held at the National Institute for Biological Standards and Control, South Mimms, Potters Bar, Herts, U.K.) or to purchase a suitable commercial reference plasma that has been calibrated in IU by the manufacturer. Consideration should be given to replacing such a plasma pool every 12 to 18 months, unless there is evidence from internal quality control results that stability has been maintained.
METHOD FOR CALIBRATION OF LOCAL PNP
1 Obtain calibrated standard e.g. WHO International Standard (IS) (minimum two vials).
2 On two different days, use one vial of IS and four aliquots of local PNP.
3 On day one test IS, local, local, local, local, IS, and repeat this using fresh dilutions of each plasma.
4 On day two test local, local, IS, IS, local, local, and repeat this using fresh dilutions of each plasma.
5 Calculate potency of each aliquot of local standard against average of results with the two IS.
The mean result of 4 aliquots × 2 dilutions × 2 days (n = 16) is assigned to the local standard as its potency.

DIAGNOSIS OF HEMOPHILIA AND OTHER BLEEDING DISORDERS24
8
To properly interpret the result of any laboratory test, it is important to have data related to results of the test in healthy normal subjects. Health is not a well-defi ned condition and is often a relative term. The ideal group in some cases could be closely matched with the population under investigation in respect of age, sex, and, in the case of FVIII/VWF, ABO blood group.
However, such careful selection is not essential for many coagulation tests. In practice, the selection of healthy normal subjects for establishment of a normal range will be infl uenced by practical considerations. Healthy hospital employees not receiving any medication and healthy blood donors or asymptomatic partners of adult patients under investigation can be successfully used. There are a number of important considerations in relation to normal ranges, which are given below.
The condition of the normal subjects when blood is collected can infl uence the results obtained. Some of these pre-analytical variables were recently reviewed in an ISTH guideline that related to women’s health issues (Blomback et al. 2007). This includes a review of the evidence for the effects of physical stress (up to 10-hour persistence of a 2.5-fold increase in FVIII/VWF for example), mental stress (increase in FVIII and VWF after acute mental stress), hormone effects, circadian variations, and the effects of posture and diet. Some general recommendations were made, which were not restricted to investigation of female patients. These were as follows:
Abstain from intense physical exercise for 24 hours prior to venipuncture.
Use an environment where physical and mental stress are lessened.
Abstain from fatty foods and smoking on the morning of venipuncture.
Obtain samples early in the morning (7 a.m. to 9 a.m.), after the subject has sat in a relaxed position for 20 to 30 minutes.
A normal range should always be established locally. Literature and manufacturer’s information should be used only as a guide.
The normal samples should be collected, processed, and analysed using as near as possible identical techniques to that for patient samples.
Establ ishing a Normal Reference Range
ESTABLISHING A NORMAL REFERENCE RANGE 25
For screening tests in particular (PT, APTT), the possibility that a new batch/lot of reagent from the same manufacturer has a different normal range than previous similar material should be considered. Internal QC data overlapping any change should be carefully scrutinized. Any changes indicate the need for a different normal range.
For assays, the literature and manufacturer’s information should be used only as a guide. The most suitable assay techniques are those for which the locally established normal range is broadly similar to those in the literature.
Normal ranges of some coagulation tests are different in newborns (pre-term or full-term) and children than in adults (Andrew et al. 1987, 1990, 1992).
Normal ranges, particularly of screening tests, should be used only as an aid to clinical information. Some patients with appropriate personal and family history require further investigations in the presence of normal screening test results. Other patients with abnormal screening tests may not be further investigated where the cause of abnormality is apparent. Normal limits may therefore not be equal to decision and intervention limits.
There are statistical reasons why at least 120 normal subjects are needed to construct a fully valid reference range, but for practical purposes, a close approximation can be obtained by testing a much smaller number, which is considered acceptable for clinical purposes by a number of experts in the fi eld (CLSI 2008). The number of normal subjects selected for analysis should not be less than 30 for tests of hemostasis related to investigation of bleeding disorders.
When constructing normal ranges, the samples from normal subjects should be collected, processed, and analysed locally using identical techniques to those used for the analysis of the patient samples. If the normal practice is for samples to be stored deep-frozen for batch analysis, then this should also be done for normal samples. If patient samples are processed after a delay during which samples are transported to the laboratory over several hours, then a similar delay should be used between collection of samples and testing for the samples from normal subjects used to derive reference intervals. The literature and reagent manufacturer’s information should only be used as a guide.
For each test, the results obtained in samples from healthy, normal subjects are used to construct a normal reference range. The distribution of results of most tests related to investigation of bleeding disorders show a normal or Gaussian distribution. It is useful to confi rm this by visual inspection of the data in graphical form, as shown in Figure 8.1. Clear outliers that stand unexpectedly far from most other reference values are probably aberrant results. It is acceptable to exclude these from further calculations.

DIAGNOSIS OF HEMOPHILIA AND OTHER BLEEDING DISORDERS26
The frequently used convention is that the reference or normal range should include the central 95% of values. If the distribution differs markedly from that shown in Figure 8.1 — for example, skewed in one direction — additional normal samples may be required. It is convenient to exclude 2.5% of values from either end, leaving the central 95%.
If the distribution is normal, it is appropriate to calculate the mean and standard deviation of the normal values (as described in Section 5), and to use the mean plus 2SD and the mean minus 2SD as the upper and lower limits respectively.
In any case, the normal range should be used only as a guide and aid to clinical interpretation.
For a fuller discussion on establishment of reference ranges, see CLSI (2000).
APTT (sec)
Num
ber
of r
esul
ts a
mon
gst
norm
al s
ubje
cts
test
ed
6
8
10
4
2
020 22 24 26 28 30 32 34 36 38
Mean APTT 30 secstandard deviation 2.9 secNormal range 24–36 sec
40
Note: The data show a normal distribution, evenly distributed on either side of the mean value.
Figure 8.1. The distribution of results of APTT in healthy, normal subjects

ESTABLISHING A NORMAL REFERENCE RANGE 27
REFERENCESAndrew M, Paes B, Johnston M. Development of the hemostatic system in the neonate
and young infant. Am J Pediatr Hematol Oncol 1990; 12:95–104.
Andrew M, Paes B, Milner R, et al. Development of the human coagulation system in the full-term infant. Blood 1987; 70:165–72.
Andrew M, Vegh P, Johnston, Bowker J, Ofosu F, Mitchell L. Maturation of the hemostastic system during childhood. Blood 1992; 80:1998–2005.
Blomback M, Konkle BA, Manco-Johnson MJ, Bremme K, Hellgren M, Kaaja R on behalf of the ISTH SSC on Women’s Health Issues. Preanalytical conditions that affect coagulation testing, including hormonal status and therapy. Thromb Haemost2007; 5:855–858.
Clinical and Laboratory Standards Institute (CLSI). How to defi ne and determine reference intervals in the clinical laboratory: Approved guideline, 2nd ed. 2000; Clinical and Laboratory Standards Institute Document C28-A2.
Clinical and Laboratory Standards Institute (CLSI). One-stage prothrombin time (PT) test and activate partial thromboplastin time (APTT) test: Approved guideline, 2nd ed. 2008; Clinical and Laboratory Standards Institute Document H47-A2.
DIAGNOSIS OF HEMOPHILIA AND OTHER BLEEDING DISORDERS28
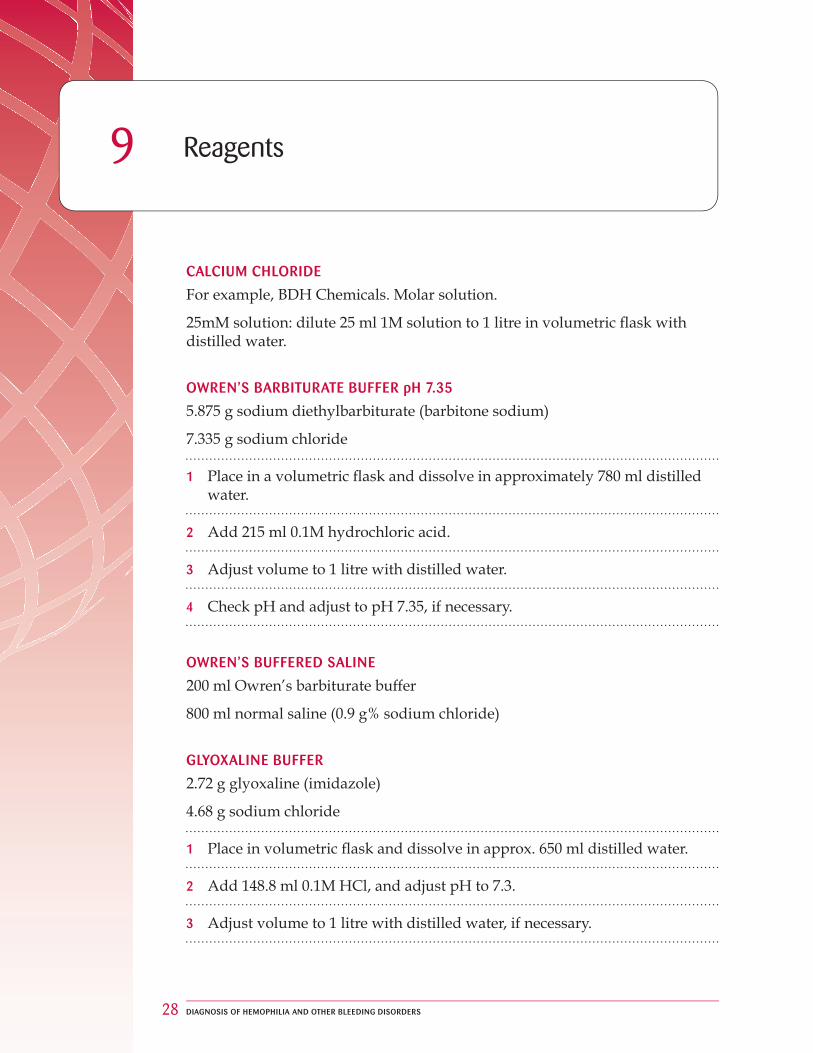
CALCIUM CHLORIDE
For example, BDH Chemicals. Molar solution.
25mM solution: dilute 25 ml 1M solution to 1 litre in volumetric fl ask with distilled water.
OWREN’S BARBITURATE BUFFER pH 7.35
5.875 g sodium diethylbarbiturate (barbitone sodium)
7.335 g sodium chloride
1 Place in a volumetric fl ask and dissolve in approximately 780 ml distilled water.
2 Add 215 ml 0.1M hydrochloric acid.
3 Adjust volume to 1 litre with distilled water.
4 Check pH and adjust to pH 7.35, if necessary.
OWREN’S BUFFERED SALINE
200 ml Owren’s barbiturate buffer
800 ml normal saline (0.9 g% sodium chloride)
GLYOXALINE BUFFER
2.72 g glyoxaline (imidazole)
4.68 g sodium chloride
1 Place in volumetric fl ask and dissolve in approx. 650 ml distilled water.
2 Add 148.8 ml 0.1M HCl, and adjust pH to 7.3.
3 Adjust volume to 1 litre with distilled water, if necessary.
9 Reagents

REAGENTS 29
REAGENTS FOR SCREENING TESTS
In the initial stages of investigation and diagnosis of bleeding disorders, selection and application of suitable screening test reagents, particularly for prothrombin time (PT) and activated partial thromboplastin time (APTT) tests, are of great importance. Many different reagents are available throughout the world. Where a wide choice is available, selection should take account of the variation in sensitivity. In screening for a bleeding disorder by PT and APTT, the following sources of information in relation to the likely performance of a particular reagent can be considered:
comparative data in relation to other reagents from EQA schemes, such as the International EQA scheme (see Section 5)
published data
local testing of plasma from patients with known defects
manufacturers’ data sheets
Local production of PT and APTT reagents may be fi nancially attractive, but it can cause standardization diffi culties and therefore is best avoided.
It should also be noted that some manufacturers offer different reagents. In addition, the composition of reagents bearing the same name may be altered from time to time. This means that recommendations for the use of a particular source of material cannot be given.

DIAGNOSIS OF HEMOPHILIA AND OTHER BLEEDING DISORDERS30
PRINCIP LE
Blood is mixed with a diluent that causes hemolysis of red cells. A hemocytometer is fi lled with the diluting fl uid, and the platelets are counted under the microscope, preferably by using phase-contrast, if available.
MATERIALS/EQUIPMENT
Flat-bottom, thin counting chamber (phase-contrast hemocytometer with Neubauer ruling)
Phase-contrast microscope equipped with long-working-distance phase condenser, if available; otherwise an ordinary light microscope
20 µl pipette
2 ml graduated pipette
12 × 75 mm tube
Mechanical mixer
REAGENT
Diluting fl uid: 1% ammonium oxalate in distilled water. Store in the refrigerator, and always fi lter just before using.
SPECIMEN
If the blood sample is from a fi nger prick, the puncture must be clean and the blood free-fl owing. Wipe away the fi rst drop of blood. If the blood sample is from venous blood, it must be collected into a dry plastic (or siliconized glass) syringe with a short needle not smaller than 21 gauge. The needle must be removed before the blood is delivered into a plastic container with EDTA. The blood and anticoagulant must be mixed gently, to avoid frothing, without any delay.
METHOD
1 Pipette 0.38 ml of diluting fl uid into a test tube.
2 Fill the 20 µl pipette to the mark and wipe off the outside of the pipette.
10 Platelet Count

PLATELET COUNT 31
3 Expel the contents of the pipette into the diluting fl uid, and wash out the pipette by drawing up the blood and expelling it into the tube a few times. Mix for at least 10 minutes by hand or, preferably, by mechanical mixer.
4 Fill the hemocytometer, as described below.
5 Cover the chamber with a petri dish for 10 to 20 minutes to allow the platelets to settle. Leave a piece of wet cotton or fi lter paper in the dish to prevent evaporation.
6 Using a microscope, count the platelets in the large 1 mm squares (= 0.1 µl). Count the platelets in as many squares as necessary to reach a count of at least 100. The platelets appear round or oval, and their internal granular structure and purple sheen allow them to be distinguished from debris. Ghosts of the red cells that have been lysed by the ammonium oxalate are seen in the background. If phase contrast is not available, an ordinary light microscope can be used, provided the condenser is racked down to provide a low intensity of light.
7 Calculate the number of platelets per litre of blood according to the formula below.
THE HEMOCYTOMETER
The hemocytometer counting chamber, with Neubauer or improved Neubauer ruling, is constructed so that the distance between the underside of the cover glass and the surface of the chamber is 0.1 mm. The surface of the chamber contains two specially ruled areas with dimensions as shown in Figure 10.1. The central 1 mm2 has double or triple boundary lines. In the central areas are 25 squares in the improved Neubauer and 16 squares in the Neubauer ruling. Each square has an area of 0.04 mm2 (0.2 × 0.2 mm). These squares are, in turn, divided into smaller squares, each 0.0025 mm2 (0.05 × 0.05 mm). The outer quadrants of the ruled area are each 1 mm2 and are divided into 16 squares.
CALCULATIONS
The formula for calculating the cell count is:
Count (cells/l) = N × D/A × 10 × 106
Where N = total number of cells counted D = dilution A = total area counted (in mm2) 10 = factor to calculate volume in µl from area (in mm2) and depth of chamber (0.1 mm) 106 = factor to convert count/µl to count/l

DIAGNOSIS OF HEMOPHILIA AND OTHER BLEEDING DISORDERS32
3 mm
1 mm
3 mm
1 mm
1 mm
(a)
(b)
Figure 10.1. Hemocytometer counting chamber (a) Neubauer and (b) Improved Neubauer

PLATELET COUNT 33
SOURCES OF ERROR IN CELL COUNTING
When capillary blood is used, a free-fl owing drop must be obtained.
When anti-coagulated blood is used, the specimen must be carefully mixed by inverting the tube of blood at least 20 times before a sample is taken. Do not shake the tube, because shaking introduces foam, which makes accurate pipetting impossible. Tilt the well-mixed tube to an angle of 45° or slightly more, and pipette from the lip of the tube, following the same procedures as for capillary blood.
The blood-sampling pipettes must be clean and dry.
The pipette must be fi lled quickly, and the blood must be drawn accurately by using a pipette suction device attached to the pipette, fi lling up to the desired line. If the line is overshot slightly, the excess blood may be expelled by touching the lip of the pipette on a piece of fi lter paper or soft tissue. If the line is overshot, a fresh pipette must be used.
No air bubbles should be present in the blood column.
The outside of the pipette must be wiped free of blood (being careful not to pull blood from the tip) before it is introduced into the diluting fl uid.
After the contents of the pipette have been discharged into the diluent, diluting fl uid must then be drawn into the pipette with steady suction several times, to ensure that all the blood is discharged into the fl uid.
The tube containing the diluted blood must be shaken gently for at least two minutes by hand or, preferably, in a mechanical shaker. After the tube has been shaken, the chamber is immediately fi lled by means of a Pasteur pipette or capillary tube.
The chamber is fi lled by capillary action, with the fl ow of fl uid from the pipette or capillary regulated so that it fi lls quickly and smoothly. It must be fi lled completely, but fl uid must not spill over into the moats. Allow the cells to settle in the counting area for 10 to 20 minutes, then proceed with the counting.
The hemocytometer chamber and glass cover must be clean and dry before they are used. Important errors can be introduced by fi ngerprints or an oily fi lm.
A suffi cient number of cells must be counted to reduce error due to chance distribution of cells. In practice, at least 100 cells should be counted. As a further check on correct distribution of cells in the chamber, the number of cells counted in each area (i.e. in the large squares) should not differ by more than 10%.
CONTROLS
Two dilutions must be made, and the mean of the two counts taken; the two counts should agree within 10%.
DIAGNOSIS OF HEMOPHILIA AND OTHER BLEEDING DISORDERS34
SOURCES OF ERROR IN PLATELET COUNTING
Blood obtained by a venipuncture is preferable to capillary blood, because platelets adhere to the wound and successive dilutions from a fi nger prick are not always reproducible.
The general errors of pipetting and hemocytometry are described above. In addition, special attention must be paid to ensuring that the counting chamber is scrupulously clean, since dirt and debris may be counted as platelets. Wash the chamber with soapy water, then rinse with distilled water, allow to drain dry, and wipe with lint-free tissue. Be sure that the cover slip is clean before using it.
The presence of platelet clumps precludes reliable counts. If the sample contains clumps, a fresh sample must be collected.
The ammonium oxalate diluent should be kept refrigerated and must be discarded if there is evidence of bacterial contamination.
The specimen must be counted within three hours of collection.

BLEEDING TIME 35
11Bleeding Time
PRINCIPLE
The bleeding time is the time taken for a standardized skin cut of fi xed depth and length to stop bleeding.
Prolongation of the bleeding time occurs in patients with thrombocytopenia, von Willebrand disease, Glanzmann’s thrombasthenia, Bernard-Soulier syndrome, storage pool disease, and other platelet disorders. Fibrinogen is required, and a role for FV has been suggested. The bleeding time can therefore be prolonged in patients defi cient in fi brinogen or FV. Prolongation also occurs in some patients with renal disease, dysproteinemias, and vascular disorders.
MATERIALS/EQUIPMENT
sphygmomanometer
cleansing swabs
template bleeding time device
fi lter paper 1 mm thick
stopwatch
METHOD
1 The sphygmomanometer cuff is placed around the upper arm and infl ated to 40 mm of mercury. This pressure is maintained throughout the test.
2 The dorsal surface of the forearm is cleaned, and the bleeding time device placed fi rmly against the skin without pressing. The trigger is depressed and the stopwatch started.
3 Superfi cial veins, scars, and bruises should be avoided.
4 At 30-second intervals, blot the fl ow of blood with fi lter paper. Bring the fi lter paper close to the incisions without touching the edge of the wound.
5 Record the time from puncture to cessation of bleeding.
DIAGNOSIS OF HEMOPHILIA AND OTHER BLEEDING DISORDERS36
INTERPRETATION
The normal range in adults is up to eight minutes but may vary according to method used.
NOTES
At the time of writing, there are two commercially available disposable devices for performing the bleeding time. A normal range should be established locally, regardless of the device used.
The incision should be made in a direction parallel to the length of the arm. Cuts made perpendicular bleed longer.
An abnormal result should be repeated.
It is not necessary to record endpoints if bleeding continues beyond 20 minutes.
The effect of drugs interfering with platelet function should be considered. For example, drugs containing Aspirin can cause prolongation. So, where possible, these should not be taken for seven days prior to testing.
There is a possibility of scarring at the site of bleeding time incisions. This should be brought to the attention of patients prior to performing the incision.
REFERENCE
Mielke CH. Measurement of the bleeding time. Thromb Haemost 1984; 52:210–211.
PROTHROMBIN TIME (PT) 37
PRINCIPLE
This test refl ects the overall effi ciency of the extrinsic system. It is sensitive to changes in factors V, VII, and X, and less so to factor II (prothrombin). It is also unsuitable for detecting minor changes in fi brinogen level, but may be abnormal if the fi brinogen level is very low or if an inhibitor is present. The sensitivity of the test is infl uenced by the reagent and technique used, and it is important to establish a reference range locally.
The pathway measured by the prothrombin time is shown in Figure 12.1, on page 39. The PT reagent, often termed thromboplastin, contains tissue factor and phospholipids.
Many suitable reagents are commercially available. Notes on reagent selection are included in Section 9.
REAGENTS
Thromboplastin (this may contain calcium chloride)
25mM calcium chloride (required only if thromboplastin reagent does not contain calcium)
METHOD: MANUAL
1 To the fi rst two tubes, add 0.1 ml normal plasma and warm to 37°C for 2 minutes.
2 Add 0.2 ml pre-warmed (to 37°C) thromboplastin reagent (if calcium is present in the reagent).
3 Start stopwatch, mix, and record clotting times.
4 Repeat for each test sample.
5 Report patient’s clotting time in seconds.
12Prothrombin Time (PT)

DIAGNOSIS OF HEMOPHILIA AND OTHER BLEEDING DISORDERS38
For manual technique, perform all tests in duplicate. Duplicate clotting times should not differ by more than 10%. For automated tests with a between assay CV of less than 5%, single tests will normally be acceptable, provided prolonged results are checked.
NOTES
If thromboplastin reagent does not contain calcium, the test procedure is 0.1 ml plasma, 0.1 ml thromboplastin, and clot with 0.1 ml pre-warmed 25mM calcium chloride.
Activation of FIX by tissue factor:FVII occurs in vivo. Under the conditions of most PT tests, FX is so strongly activated that the assay is insensitive to defi ciency of FIX or FVIII.
Thromboplastin/calcium chloride should be pre-warmed for 5 to 30 minutes prior to use.
Clotting times are normally infl uenced by the use of different coagulometers, depending on how and when the end point is detected. This further emphasizes the importance of establishing normal ranges for the method currently in use in the laboratory.
In the presence of mild defi ciencies of factor II, V, VII, or X, the degree of prolongation may be minimal. In the case of FII defi ciency, the PT may be within the normal range.
Some PT reagents can be affected by the presence of lupus anticoagulants/anti-phospholipid antibodies, and some rare types of antibody may prolong the PT without any prolongation of APTT. Reagents with lower phospholipid concentrations are more likely to be affected, including some reagents that are constructed by lipidating recombinant tissue factor.
The presence of activated FVII, either following therapy with recombinant VIIa or when native FVII has been activated, can shorten the PT. The effect is dependent on the tissue factor reagent used. Reagents containing bovine tissue factor are particularly susceptible to this effect (Kitchen et al. 1992). Blood samples should not be stored at 2°C–8°C prior to determination of PT, since cold activation of FVII may occur.
Whole blood for PT determination may be stable for at least 24 hours, depending on the reagent used (Baglin and Luddington 1997).
PTs determined with reagents containing human tissue factor may be different from those obtained with reagents containing tissue factor from other species, such as rabbit. In such cases, the result obtained with human tissue factor reagents may be more indicative of bleeding risk.
For a full discussion of issues related to determination of PT, see CLSI (2008).

PROTHROMBIN TIME (PT) 39
Fig 12.1. Pathway measured by the prothrombin time test
REFERENCES
Baglin T, Luddington R. Reliability of delayed INR determination: implications for decentralised anticoagulant care with off-site blood sampling. Br J Haem 1997; 96:431-4.
Clinical and Laboratory Standards Institute (CLSI). One-Stage Prothrombin time (PT) Test and Activated Partial Thromboplastin Time (APTT) Test: Approved guideline, 2nd ed. 2008. Clinical and Laboratory Standards Institute Document H47-A2.
Kitchen S, Malia RG, Preston FE. A comparison of methods for the measurement of activated factor VII. Thromb Haemost 1992; 68:301-5.
Ca++/PL/Tissue Factor + Factor VII
Factor X Factor Xa with Ca++/PL/Factor V
Prothrombin Thrombin(Factor II) (Factor IIa)
Fibrinogen Fibrin
PL = Phospholipid = Activation

DIAGNOSIS OF HEMOPHILIA AND OTHER BLEEDING DISORDERS40
PRINCIPLE
This is a non-specifi c test of the intrinsic system. Taken in conjunction with a normal prothrombin time, it is the most useful screening test for detecting defi ciencies of factors VIII, IX, XI, and XII.
The APTT will also be prolonged in any defi ciency involving the common pathways (defi ciencies of factors V, X, II and, to a lesser extent, fi brinogen,) and in the presence of inhibitors. The presence of some therapeutic inhibitors of coagulation such as heparin will also prolong APTT. It is important to exclude the possibility that such treatments have been employed in the initial investigation of prolonged APTTs.
The APTT is prolonged in the presence of prekallikrein (PKK) or high-molecular-weight kininogen (HMWK) defi ciency unless the test is performed using a reagent that contains ellagic acid as the activator. In that case, the APTT will be normal, even in the complete absence of these factors.
The pathway measured by the APTT is shown in Figure 13.2.
REAGENTS
APTT reagent
25mM calcium chloride
METHOD
1 Place tube containing calcium chloride at 37°C for fi ve minutes prior to use.
2 Pipette 0.1 ml of APTT reagent into two glass clotting tubes at 37°C.
3 Pipette 0.1 ml control plasma into fi rst tube.
4 Start master stopwatch. Mix.
5 Add 0.1 ml control plasma to second tube. Mix.
Activated P artial Thromboplastin Time (APTT)13

ACTIVATED PARTIAL THROMBOPLASTIN TIME (APTT) 41
6 After recommended incubation time*, add 0.1 ml calcium chloride to each tube in succession, starting a new stopwatch for each tube. Mix. Time clot formation.
For manual technique, perform all tests in duplicate. Duplicate clotting times should not differ by more than 10%. For automated tests with a between assay coeffi cient of variation of less than 5%, single replicates will normally be acceptable, provided prolonged results are checked.
* The reagent manufacturer’s recommendation should be followed. This is normally in the range of two to fi ve minutes. It is important that the incubation is timed exactly, since deviations from this will normally affect the results, with longer incubations giving shorter clotting times for any particular reagent.
INTERPRETATION
A normal range should be established locally.
A long APTT with a normal PT indicates a possible defi ciency of factor VIII, IX, XI, XII, high-molecular-weight kininogen, prekallikrein, or the presence of an inhibitor. In cases of a long APTT, an equal mixture of normal and test plasma should be tested (i.e., a mixture of 1 part test and 1 part normal plasma, called a 50:50 mix, below). If the APTT corrects by more than 50% of the difference between the clotting times of the normal and test plasma, a factor defi ciency is indicated. Poor correction suggests an inhibitor, possibly to one of the clotting factors in the system or of the non-specifi c type, such as lupus anticoagulant (see Section 25).
Figure 13.1. An example of interpretation of APTT
Sample Result
APTT control 35 seconds
Test 60 seconds
If 50:50 mix42 seconds(this is a good correction, so there is probably a factor de� ciency)
If 50:50 mix52 seconds(this is a poor correction, so an inhibitor is probably present)
DIAGNOSIS OF HEMOPHILIA AND OTHER BLEEDING DISORDERS42
NOTES
Many suitable reagents are commercially available. These include materials with different sensitivities. Notes on reagent selection are included in Section 9.
As for PT, clotting times can be infl uenced by the use of a coagulometer.
Within test plasmas, high levels of one clotting factor can compensate for lower levels of other factors. For example, a markedly raised FVIII during acute phase reaction can lead to a normal APTT in the presence of reductions of FIX or FXI, which could be clinically important. If a patient has the appropriate personal or family history suggestive of a bleeding disorder, fuller investigation, including specifi c factor assays, may be justifi ed in the presence of a normal APTT, particularly if the result lies in the upper part of the reference range.
The concentration of phospholipid varies markedly between reagents. This is one reason why reagents vary markedly in their sensitivity to the presence of lupus anticoagulants. If a lupus-sensitive reagent is used for the initial APTT, it is useful to perform a second APTT using a reagent such as Actin FS (Dade Behring, Marburg, Germany), which has a very high phospholipid concentration (Kitchen et al. 1999). If the prolongation with the fi rst reagent is caused by lupus anticoagulant, then the second APTT is almost always normal, since very few lupus anticoagulants prolong APTT when Actin FS is used.
INVESTIGATION OF ISOLATED PROLONGED APTT
For patients with a normal prothrombin time and prolonged APTT, the normal sequence of investigation to follow is:
1 Determine thrombin time (see Section 15). If it is normal, proceed to steps 2 and 3. If thrombin time is prolonged, repeat in the presence of protamine sulphate (see Section 16). If the thrombin time is corrected to normal, this suggests that heparin is present, and further tests below are not required. If the patient is not known to be receiving heparin of any kind, a repeat sample should be requested.
2 Determine APTT on mixtures of normal and patient plasma (see Section 14) using a 1:1 (50%) mixture of normal:patient. Failure of the 50% mixture to correct the APTT to normal indicates presence of an inhibitor.
3 Determine APTT with a second reagent that contains high concentration phospholipids, such as Actin FS (Dade Behring). If the initial APTT is clearly prolonged (by at least three seconds over the upper limit of normal in use) and the Actin FS is normal, then lupus anticoagulant is the

ACTIVATED PARTIAL THROMBOPLASTIN TIME (APTT) 43
likely cause. This can be confi rmed later by specifi c tests such as dilute Russell’s viper venom time (DRVVT; see Section 38), although this is not normally necessary in the absence of any requirement to investigate possible lupus anticoagulant (LAC) as a risk factor for thrombosis. Very rarely, defi ciency of prekallikrein is the other possible cause of normal APTT with Actin FS and marked prolongation of APTT with a reagent that uses silica or kaolin as activator. Like most cases of LAC, this is not associated with any bleeding risk. Therefore, again, confi rmation may not be required.
4 When initial APTT is clearly prolonged (three or more seconds) and Actin FS APTT is normal, there is no need to perform factor assays.
5 If both APTTs are prolonged, perform FVIII:C, FIX, and FXI assays as required (see Section 23). A FXII assay can be performed if required, since defi ciency is relatively common and detection of this can then explain the prolongation of APTT. This is not necessary to exclude the presence of a bleeding disorder, since defi ciency of FXII is not associated with increased bleeding risk.
6 Reagents such as Actin FS, which employ ellagic acid as the contact activator, are associated with normal results in the presence of even severe defi ciency of prekallikrein.
Where necessary, steps 1 to 3 can be performed concurrently to save time.
NOTES
A normal APTT with Actin FS, combined with an initial prolonged APTT, normally excludes the presence of FVIII, FIX, or FXI defi ciency, and in this case there is no need for factor assays.
Rarely, a normal APTT with any reagent can occur when FIX or FXI are mildly reduced (30-50 U/dl) and FVIII is markedly elevated.
APTT with Actin FS is frequently normal when FXII is reduced in the range of 20 U/dl-50 U/dl and APTT with kaolin or silica-based activation is mildly elevated. This defect has no clinical relevance.
A few powerful lupus anticoagulants prolong APTT with Actin FS.
Specifi c antibodies to FVIII (or FIX or FXI) prolong APTT, irrespective of reagent.
For a full discussion of issues related to determination of APTT, see CLSI (2008).

DIAGNOSIS OF HEMOPHILIA AND OTHER BLEEDING DISORDERS44
Figure 13.2. The pathway measured by APTT
REFERENCES
Clinical and Laboratory Standards Institute (CLSI). One-Stage Prothrombin time (PT) Test and Activated Partial Thromboplastin Time (APTT) Test: Approved guideline, 2nd ed. 2008. Clinical and Laboratory Standards Institute Document H47-A2.
Kitchen S, Cartwright I, Woods TA, Jennings I, Preston FE. Lipid composition of 7 APTT reagents in relation to heparin sensitivity Br J Haematol 1999; 106:801-8.
Contact Activation involving Prekallikrein, High Molecular Weight Kininogen and negatively charged surface
Factor XII Factor XIIa
Factor II Factor IIa
Fibrinogen Fibrin
Factor XI Factor XIa with Ca++/PL
Factor IX Factor IXa with Ca++/PL/Factor VIII
Factor X Factor Xa with Ca++/PL/Factor V
PL = Phospholipid = Activation
MIXING TESTS FOR FURTHER INVESTIGATION OF ABNORMAL PT AND APTT 45
PRINCIPLE
Plasma samples found to have abnormal screening tests (i.e. PT/APTT) may be further investigated to defi ne the abnormality by performing mixing tests. First of all, it is important to demonstrate that the defect in patients’ plasma is corrected with normal plasma in order to eliminate the presence of an inhibitor. Correction of the abnormality by the addition of one of the reagents described below indicates that the added reagent must contain the substance defi cient from the test sample.
Abnormal screening tests are repeated on equal volume mixtures (termed 50:50 below) of additive and test plasma.
The following agents can be used for mixing tests:
normal plasma
aged plasma
adsorbed plasma
FVIII-defi cient plasma
FIX-defi cient plasma
AGED PLASMA
1 Normal venous blood is added to a 1/9th volume of 0.1M sodium oxalate.
2 The blood is centrifuged to obtain platelet-poor plasma, separated under sterile conditions and incubated at 37°C for two to three days.
3 The prothrombin time at the end of this time should exceed 90 seconds with sensitive thromboplastins.
4 The plasma is then aliquoted in plastic containers and stored at -35°C (or lower).
Aged plasma is defi cient in factors V and VIII.
Mixing Tests For Further Investigation of Abnormal PT and APTT 14

DIAGNOSIS OF HEMOPHILIA AND OTHER BLEEDING DISORDERS46
ADSORBED PLASMA
1 Aluminum hydroxide gel (alumina) is prepared by mixing 1 g of moist gel with 4 ml of distilled water to a smooth suspension.
2 Citrated platelet-poor plasma is collected from fi ve normal donors and pooled.
3 A 1/10th volume of aluminum hydroxide is added to pre-warmed plasma, mixed, and incubated for three minutes at 37°C.
4 The mixture is then centrifuged immediately (1700 g, three minutes, room temperature) to sediment the gel.
5 The supernatant plasma is put into plastic containers and may be stored at -35°C for several weeks.
Adsorbed plasma is defi cient in factors II, VII, IX, and X (vitamin K-dependent factors). This should have a prothrombin time of >60 seconds with a sensitive reagent.
Note: Care must be taken in the adsorption time, as over-adsorption will result in the loss of other clotting factors.
FVIII/FIX-DEFICIENT PLASMA
Plasma from patients with isolated severe defi ciency (< 1 IU/dl) of FVIII or FIX are very useful for mixing studies. Where available, they should be used in preference to aged plasma and absorbed plasma. Plasma selected for this purpose should have a normal PT, confi rming that the other clotting factors synthesized in the liver are likely to be at normal levels.
Such plasmas can be lyophilized for long-term storage or stored as plasma at -35°C (or lower) for at least three months.
By using 50:50 mixtures of additive and patient’s plasma, an abnormality can be characterized.
In situations where there is an isolated prolongation of the APTT, FVIII-defi cient plasma is preferable to aged plasma. Similarly, FIX-defi cient plasma is preferable to adsorbed plasma.
NOTES
Aluminum hydroxide is available from BDH, Poole, BH15 ITD, England.
Non-specifi c inhibitors affecting APTT (such as lupus anticoagulant) typically show no correction, although plasmas containing weaker or low titre inhibitors may be partially corrected by normal plasma.

MIXING TESTS FOR FURTHER INVESTIGATION OF ABNORMAL PT AND APTT 47
Specifi c inhibitors against FVIII may be associated with lack of immediate correction of APTT by added normal plasma. In other cases, there is an immediate correction by normal plasma, followed by lengthening of APTT in the mixture over time. A mix of test and normal plasma can be tested after one hour at 37°C, together with APTT determinations on normal and test plasmas that have been incubated separately at the same time.
Specifi c inhibitors against other clotting factors are particularly rare but can occur. It is not possible to generalize about their behaviour in mixing experiments, except that FIX inhibitors are typically fast-acting.
Some examples of APTTs in subjects with acquired hemophilia A showing the titre of anti-FVIII antibody and the effect of adding 20% and 50% pooled normal plasma are given in Figure 14.2. The APTT method used has 37 seconds as the upper limit of the normal range. This illustrates that in the presence of such anti-FVIII antibody, there can be full correction in a 50:50 mix of patient and pooled normal plasma in some cases. If these mixtures are incubated at 37°C, there is a progressive increase in the APTT, as anti-FVIII antibody inhibits FVIII.
Figure 14.1. Pattern of mixing test results in the presence of individual factor defi ciencies
Defect in test plasma APTT
Aged or FVIII-defi cient
Adsorbed or FIX-defi cient
Normal plasma
FVIII abn no corr corr corr
FIX abn corr no corr corr
FXI/FXII abn corr corr corr
Inhibitor abn no corr no corr no corr
Defect in test plasma PT APTT
Aged plasma
Adsorbed plasma
Normal plasma
FII abn abn corr no corr corr
FV abn abn no corr corr corr
FVII abn norm corr no corr corr
FX abn abn corr no corr corr
abn = abnormal; no corr = no correction; corr = correction

DIAGNOSIS OF HEMOPHILIA AND OTHER BLEEDING DISORDERS48
Figure 14.2. Mixing studies in acquired hemophilia A
Bethesda titre(U/ml)
APTT (seconds)
APTT + 20% normal plasma (seconds)
APTT + 50% normal plasma (seconds)
1.0 210 137 77
1.1 83 52 38
2.0 82 43 34
6.6 107 51 37
8.4 150 55 39
21 145 62 48
23 123 127 55
120 69 50 38

THROMBIN CLOTTING TIME 49
15Thrombin Clotting Time
PRINCIPLE
The thrombin time refl ects the reaction between thrombin and fi brinogen.
Thrombin
Fibrinogen Fibrin
It is prolonged when the fi brinogen level is very low (less than 1.0 g/l); in the presence of heparin and heparin-like substances; in the presence of other inhibitors, such as fi brin(ogen) degradation products (FDPs); and when fi brinogen is qualitatively abnormal (dysfi brinogenemia), including both congenital and acquired defects secondary to liver disease.
REAGENT
Thrombin solution, which induces clotting of normal plasma in about 15 seconds.
Stronger solutions give shorter clotting times and may be normal in the presence of mild defects.
METHOD: MANUAL
1 Into a glass clotting tube, pipette 0.2 ml plasma.
2 Warm to 37°C.
3 Add 0.2 ml thrombin.
4 Start stopwatch. Time clot.
5 A normal range should be established locally.
6 Test in duplicate.
DIAGNOSIS OF HEMOPHILIA AND OTHER BLEEDING DISORDERS50
NOTES
The thrombin concentration used should be that which gives a clotting time of around 15 seconds with pooled normal plasma (control). If concentrated thrombin is used, dilute to around 10-15 U/ml in saline, and further dilute as required until the appropriate control time is obtained.
Reconstituted thrombin can be stored at -35°C or lower and diluted prior to use.
Diluted thrombin at room temperature will deteriorate.
A pooled normal plasma control should be included with each group of tests.

THROMBIN TIME IN THE PRESENCE OF PROTAMINE SULPHATE TO DETECT PRESENCE OF HEPARIN 51
16Thrombi n Time in the Presence of Protamine Sulphate to Detect Presence of Heparin
The presence of unfractionated and some low-molecular-weight heparin can cause prolongation of thrombin time.
The larger forms of heparin, which prolong thrombin time, can be neutralized by the addition of protamine sulphate (PS). Protamine sulphate is available from many hospital pharmacies, where it is used as a therapeutic agent for reversal of heparin effect.
The concentration of drug in therapeutic preparations is normally much higher than is useful for laboratory testing purposes. Therefore, if necessary, the drug should be diluted in saline to a concentration of 40 mg% as a working solution. A working solution of thrombin with PS is prepared by mixing nine parts of thrombin reagent with one part of 40 mg% PS. This is then used in place of the thrombin solution described in Section 15. A normal control should be analysed. If the thrombin time is prolonged but corrects to within two seconds of control result, the presence of heparin is confi rmed.
DIAGNOSIS OF HEMOPHILIA AND OTHER BLEEDING DISORDERS52
PRINCIPLE
Reptilase is a snake venom obtained from Bothrops atrox. It is a thrombin-like enzyme and acts directly on fi brinogen to convert it to fi brin. It is not inhibited by antithrombin, so it is not affected by the presence of heparin. Therefore, it can be used to assess the rate of fi brinogen → fi brin conversion in the presence of heparin.
It is useful to check whether a prolonged thrombin time is caused by the presence of heparin in the sample. If thrombin time is prolonged and reptilase is normal, the most likely cause is the presence of heparin. In the presence of dysfi brinigonemia, the reptilase time may be more sensitive (i.e. more prolonged) than thrombin time.
REAGENTS
Reptilase (Sigma Aldrich, Code V5375) dissolved at a concentration of 25 mg in 15 ml Owren’s buffer. This crude venom is hazardous, and care must be taken to avoid inhaling the powder. The operator should wear gloves and a mask while handling the crude venom. The stock solution should be stored deep-frozen at -70°C in 0.5 ml aliquots. It is stable for at least two years under these conditions.
To prepare ready-to-use reagent, thaw and dilute stock reagent 1/10 in Owren’s buffer; aliquot and re-freeze at -70°C for further use. This ready-to-use reagent is stable under these conditions for at least three months.
Ready-to-use frozen aliquots should be thawed in a 37°C water bath for at least three minutes. This is then stable for use for at least 12 hours at ambient temperatures of 20°C–25°C.
Normal plasma: Pooled normal plasma prepared as described in Section 7. Thaw in a 37°C water bath for approximately three minutes.
METHOD
Perform all tests in duplicate.
1 Place suffi cient 75 × 10 mm glass clotting tubes in a water bath at 37°C (two per patient, plus two for the control).
17 Reptila se Time
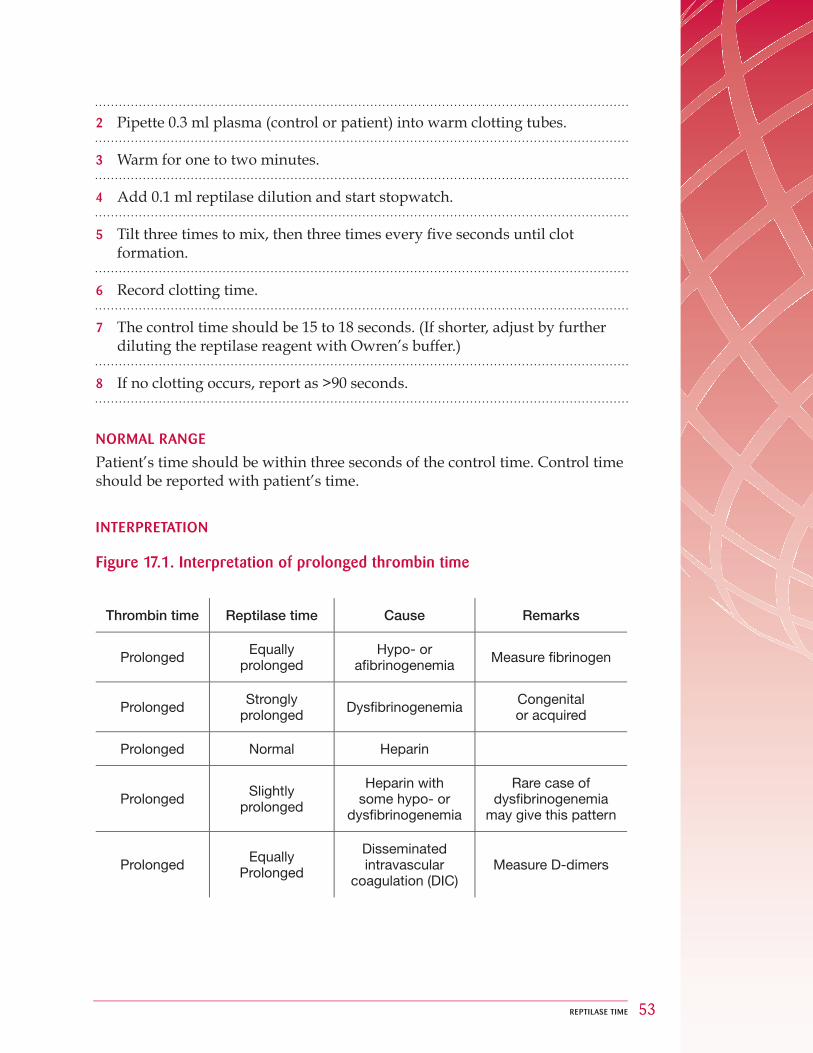
REPTILASE TIME 53
2 Pipette 0.3 ml plasma (control or patient) into warm clotting tubes.
3 Warm for one to two minutes.
4 Add 0.1 ml reptilase dilution and start stopwatch.
5 Tilt three times to mix, then three times every fi ve seconds until clot formation.
6 Record clotting time.
7 The control time should be 15 to 18 seconds. (If shorter, adjust by further diluting the reptilase reagent with Owren’s buffer.)
8 If no clotting occurs, report as >90 seconds.
NORMAL RANGE
Patient’s time should be within three seconds of the control time. Control time should be reported with patient’s time.
INTERPRETATION
Figure 17.1. Interpretation of prolonged thrombin time
Thrombin time Reptilase time Cause Remarks
Prolonged Equally prolonged
Hypo- or a� brinogenemia Measure � brinogen
Prolonged Strongly prolonged Dys� brinogenemia Congenital
or acquired
Prolonged Normal Heparin
Prolonged Slightly prolonged
Heparin with some hypo- or
dys� brinogenemia
Rare case of dys� brinogenemia
may give this pattern
Prolonged Equally Prolonged
Disseminated intravascular
coagulation (DIC)Measure D-dimers
DIAGNOSIS OF HEMOPHILIA AND OTHER BLEEDING DISORDERS54
NOTE
Reptilase reagents are available at a ready-to-use concentration from several commercial manufacturers. The advantage of these is that there is no need to handle the crude venom, with its health and safety issues. If using one of these, follow the manufacturer’s instructions for use. The normal range may be different to that described above, but interpretation of results is as listed in Figure 17.1. Where reptilase is an expensive reagent, the protamine neutralization/thrombin time method (Section 16) can be used to confi rm the presence of heparin in the test sample.
FIBRINOGEN (MODIFIED CLAUSS ASSAY) 55
PRINCIPLE
Dilutions of standard normal plasma with known fi brinogen content are prepared in glyoxaline buffer. The clotting time is measured after the addition of thrombin, and a graph is constructed.
The clotting time is proportional to the concentration of fi brinogen, and the 1/10 dilution is taken to represent the value in the standard preparation. The test plasma is diluted 1/10, and the result read from the standard line.
REAGENTS
Standard or reference plasma with known fi brinogen concentration
Thrombin 30 U/ml–100 U/ml (concentration may vary according to source).
Imidazole buffer (glyoxaline) or Owren’s buffer pH 7.35
METHOD
1 Prepare 1/5, 1/10, 1/15, and 1/20 dilutions of standard plasma in imidazole buffer.
2 Pipette duplicate 0.2 ml volumes of each dilution into glass clotting tubes.
3 Warm to 37°C for two minutes.
4 Add 0.2 ml thrombin (30 U/ml–100 U/ml) and time the clot formation.
5 For manual techniques, test in duplicate. This is not necessary for most coagulometers when the test is automated.
6 Plot the mean clotting time versus fi brinogen concentration on log/log graph paper, taking the 1/10 dilution to represent the standard value.
7 Dilute the test plasma 1/10, determine the clotting time, and read the value off the graph.
18Fibrinogen (Modifi ed Clauss Assay)
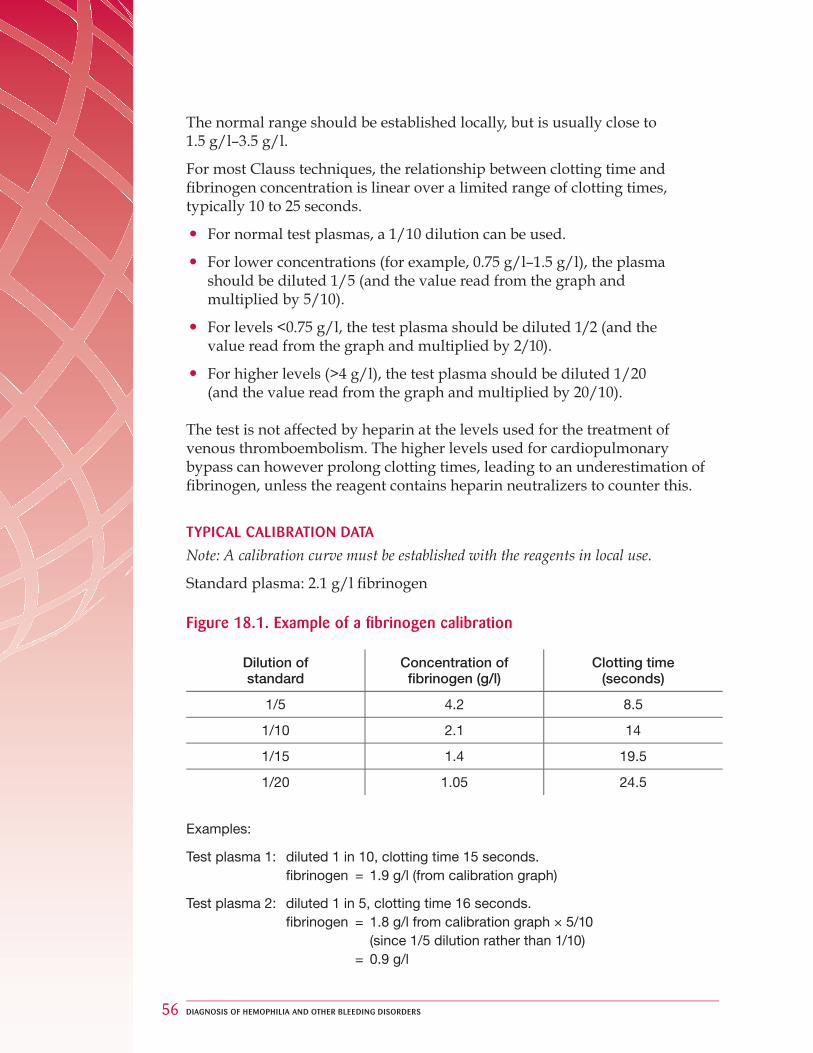
DIAGNOSIS OF HEMOPHILIA AND OTHER BLEEDING DISORDERS56
The normal range should be established locally, but is usually close to 1.5 g/l–3.5 g/l.
For most Clauss techniques, the relationship between clotting time and fi brinogen concentration is linear over a limited range of clotting times, typically 10 to 25 seconds.
For normal test plasmas, a 1/10 dilution can be used.
For lower concentrations (for example, 0.75 g/l–1.5 g/l), the plasma should be diluted 1/5 (and the value read from the graph and multiplied by 5/10).
For levels <0.75 g/l, the test plasma should be diluted 1/2 (and the value read from the graph and multiplied by 2/10).
For higher levels (>4 g/l), the test plasma should be diluted 1/20 (and the value read from the graph and multiplied by 20/10).
The test is not affected by heparin at the levels used for the treatment of venous thromboembolism. The higher levels used for cardiopulmonary bypass can however prolong clotting times, leading to an underestimation of fi brinogen, unless the reagent contains heparin neutralizers to counter this.
TYPICAL CALIBRATION DATA
Note: A calibration curve must be established with the reagents in local use.
Standard plasma: 2.1 g/l fi brinogen
Figure 18.1. Example of a fi brinogen calibration
Dilution of standard
Concentration of fi brinogen (g/l)
Clotting time (seconds)
1/5 4.2 8.5
1/10 2.1 14
1/15 1.4 19.5
1/20 1.05 24.5
Examples:
Test plasma 1: diluted 1 in 10, clotting time 15 seconds. � brinogen = 1.9 g/l (from calibration graph)
Test plasma 2: diluted 1 in 5, clotting time 16 seconds. � brinogen = 1.8 g/l from calibration graph × 5/10 (since 1/5 dilution rather than 1/10) = 0.9 g/l

FIBRINOGEN (MODIFIED CLAUSS ASSAY) 57
A number of coagulation analysers can estimate the level of fi brinogen during determination of prothrombin time. This is possible because the change in light scatter or transmission as a consequence of clot formation is proportional to the initial fi brinogen concentration. These methods are commonly referred to as PT-derived fi brinogen.
There are limitations to most of the PT-derived methods. In particular, the results obtained are often much higher than those obtained by Clauss assay when there are either very low levels (<1.5 g/l) or raised levels (above 5 g/l) of fi brinogen. Results are usually normal in the presence of dysfi brinogenemia. For a review of these issues, see Mackie et al. (2003).
There are Clauss fi brinogen methods that are suitable for assaying undiluted test plasma, but results may not be interchangeable with the results of the widely used Clauss assays employing diluted test plasma (Jennings et al. 2009).
REFERENCES
Jennings I, Kitchen DP, Woods TA, Kitchen S, Walker ID. Differences between multifi brin U and conventional Clauss fi brinogen assays: data from the UK National External Quality Assessment scheme. Blood Coagul Fibrinolysis 2009; 20:388-90.
Mackie IJ, Kitchen S, Machin SJ, Lowe GD. Guidelines on fi brinogen assays. Br J Haematol 2003; 121: 396-404.

DIAGNOSIS OF HEMOPHILIA AND OTHER BLEEDING DISORDERS58
19 Removal of Heparin from Plasma
PRINCIPLEHeparinase 1 (the active component of Hepzyme®) is specific for heparin, which it cleaves at multiple sites per molecule, producing oligosaccharides that have lost their antithrombotic activity. Hepzyme® is a purified bacterial heparinase 1 produced in Flavobacterium heparinum. It is able to remove up to 2 IU heparin per ml in plasma. Hepzyme® can be used to neutralize the effect of heparin in a sample, so that the underlying coagulation status can be assessed. It is particularly used in instances of heparin contamination.
REAGENTHepzyme®, a vial containing dried preparation of heparinase 1 with stabilizers
Manufacturer: Dade Behring
Storage: 4ºC
Stability: as per manufacturer’s expiry date. Each vial is used for one test patient only.
METHOD
1 Add 1.0 ml of platelet-poor citrated plasma to a vial of Hepzyme®.
2 Re-stopper and invert gently 5 to 10 times.
3 Leave at room temperature for 15 minutes.
4 Transfer to a 2 ml plastic sample cup, and allow a few moments for any bubbles to disappear.
5 Perform required test.
The thrombin time should be included to check that all the heparin has been successfully removed.
Tests should be performed as soon as possible (i.e. within testing guidelines for that procedure).

REMOVAL OF HEPARIN FROM PLASMA 59
INTERPRETATION
This enzyme does not remove any clotting factors (unlike some of the alternative techniques for removing heparin), so substantial shortening of clotting times in APTT, thrombin time, or PT after treatment with hepzyme indicates that heparin was present. Both unfractionated heparin and low-molecular forms are degraded by this enzyme.
DIAGNOSIS OF HEMOPHILIA AND OTHER BLEEDING DISORDERS60
INTRODUCTION
Dysfi brinogenemia (type II fi brinogen defi ciency) is suspected when the Clauss fi brinogen assay result is signifi cantly lower than the prothrombin time-derived fi brinogen or fi brinogen antigen results.
The Clauss assay determines fi brinogen level by determining the rate of fi brin formation after addition of a high concentration of thrombin, whereas the derived assay measures optical density/light scatter through a formed fi brin clot after clot formation is complete.
The fi brinogen antigen assay detects dysfi brinogenemia as low activity by Clauss assay in the presence of a normal antigen level.
Afi brinogenemia may be associated with bleeding due to defective plasma coagulation and platelet function. A multitude of defects cause dysfi brinogenemia, which may be characterized by impaired release of fi brinopeptide A/B and impaired fi brin monomer polymerization. Type II defects may be asymptomatic, but some variants have been associated with predisposition to bleeding or thrombosis. A patient’s bleeding or thrombotic tendency may be unrelated to dysfi brinogenemia, which may be a chance fi nding.
MATERIALS
NOR-Partigen Fibrinogen R.I.D. Plate
Manufacturer: Dade Behring
Each plate has 12 wells.
REAGENTS
A calibration plasma with known fi brinogen concentration that is traceable back to a WHO International Standard for fi brinogen.
Test Plasma: Citrated plasma is normally tested undiluted, or diluted in saline to give a level of around 2.5 g/l if the level is anticipated to be greater than 5 g/l. Results of less than 0.5 g/l are reported as <0.5 g/l (lower limit of sensitivity).
20 Fibrinogen Antigen Assay by Radial Immunodiffusion (RID)

FIBRINOGEN ANTIGEN ASSAY BY RADIAL IMMUNODIFFUSION (RID) 61
METHOD
1 Allow the RID plate to warm up to room temperature, then remove the cover and leave open for 5 minutes to evaporate excess moisture.
2 Standard plasma is tested neat and at 75%, 50%, and 25% dilutions in saline.
3 Add exactly 5µl dilutions of standard, quality control, and pa tient plasma (preferably in duplicate) to the wells. An accurate pipette is essential for the small volumes required.
4 As soon as the samples have diffused into the gel (no more than fi ve minutes after application), replace the cover and place the plate fl at in a wet box at room temperature for approximately 48 hours.
5 Results can be estimated after 18 hours, as long as no diameter exceeds 5.5 mm. Final results must be reported after two days, unless a diameter is greater than 8 mm, in which case the plate is left for a further day to allow diffusion to complete. A diameter of >9.3 mm indicates that the fi brinogen level is greater than the level of sensitivity of the assay, in which case the sample must be diluted in saline and re-tested.
6 Measure precipitation diameters using the Behring plate reading device (available with the plates). Measure to nearest 0.5 mm and read twice (diameters at 90° to each other).
7 Plot the standard curve: diameter² against concentration on linear graph paper.
8 Read off quality control and patient levels from this curve.
9 Report results in g/l if quality control is within target range.

DIAGNOSIS OF HEMOPHILIA AND OTHER BLEEDING DISORDERS62
PRINCIPLE
Thrombin and calcium are required to activate FXIII such that it will cross-link fi brin into a stable form. In this method, despite using citrated plasma, suffi cient calcium ions are still available for FXIII activation.
A normal ethylenediaminetetraacetic acid (EDTA) anticoagulated plasma is used for a control. In this plasma, EDTA results in a complete chelation of calcium ions, which means that the FXIII is not able to crosslink fi brin. Addition of 2% acetic acid or 5M urea results in the lysis of non-cross-linked clots, whereas citrated plasma with greater than 10 U/dl of FXIII activity has an insoluble clot. The test is generally more sensitive if acetic acid (rather than urea) is employed, since the clot will dissolve at higher levels of FXIII in the presence of acetic acid (Jennings et al. 2003).
MATERIALS/REAGENTS
75 × 10 mm glass tubes
0.9% saline
30 U/ml thrombin
Normal EDTA plasma
2% acetic acid
METHOD
1 Add 0.2 ml test citrated plasma to 0.2 ml 0.9% saline in a glass tube. For a positive control, repeat with 0.2 ml EDTA plasma. For a negative control, repeat with 0.2 ml normal citrated plasma.
2 Add 0.1 ml of 30 U/ml thrombin. Mix.
3 Leave for 30 minutes at 37°C.
4 Flick tubes to loosen clot from sides.
5 Add 5 ml 2% acetic acid and stopper the tube. Leave at room temperature for 12 hours.
21 Factor XIII Screen

FACTOR XIII SCREEN 63
RESULTS
EDTA plasma should have no visible clot.
Normal citrated plasma should have an intact, visible clot.
If clot is not visible, the subject has FXIII defi ciency.
NORMAL RANGE
Normal subjects have a visible clot after 12 hours in 2% acetic acid.
NOTES
5M urea can be used in place of 2% acetic acid. The incubation time for clot dissolution is then 18 hours. This method is less sensitive than employing acetic acid (described above).
Clotting with calcium and lysis with urea produces abnormal results only when levels of FXIII are below 5 U/dl. By comparison, clotting with 30 U/ml thrombin followed by lysis with 2% acetic acid produces abnormal results at levels below 10 U/dl (Jennings et al. 2003).
Occasionally, patients with FXIII levels above 5 U/dl may bleed (see Bolton-Maggs et al. 2004 for review).
REFERENCES
Bolton-Maggs PH, Perry DJ, Chalmers EA, Parapia LA, Wilde JT, Williams MD, Collins PW, Kitchen S, Dolan G, Mumford AD. The rare coagulation disorders — review with guidelines for the management from the UK Haemophilia Centre Doctors’ Organization. Haemophilia 2004; 10(5): 593-628
Jennings I, Kitchen S, Woods TAL, Preston FE. Problems relating to the diagnosis of FXIII defi ciency. Thromb Haemost 2003; 1: 2603-8.
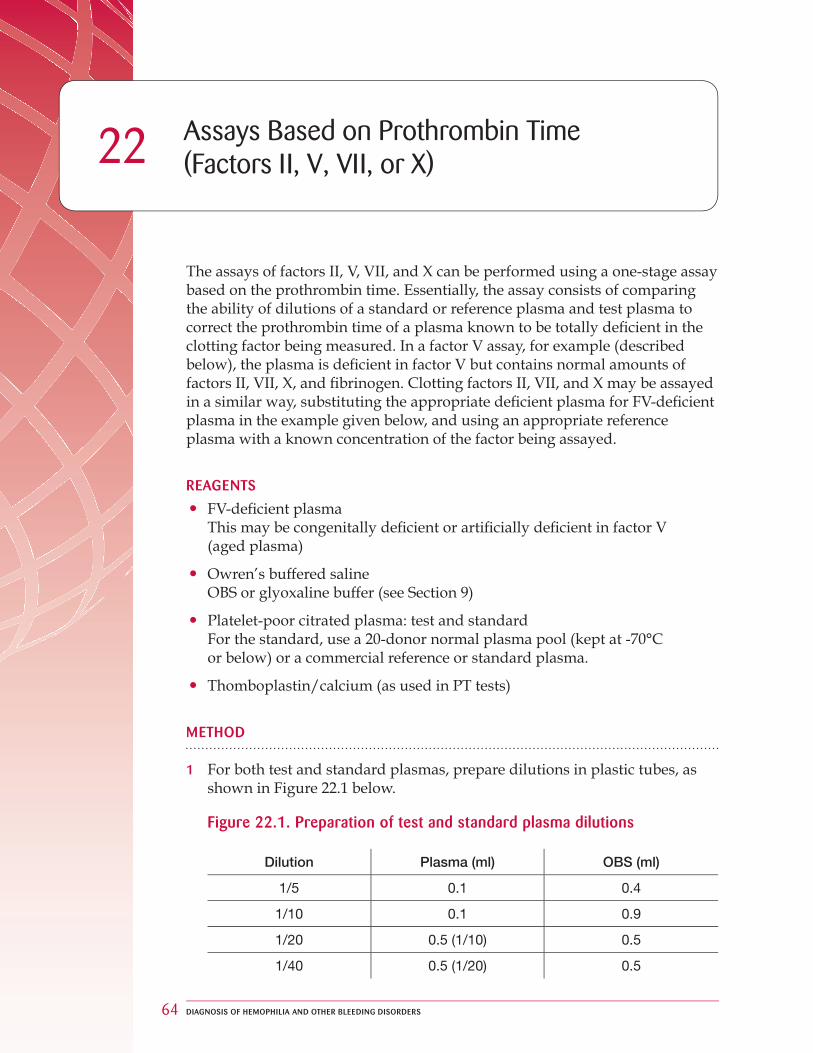
DIAGNOSIS OF HEMOPHILIA AND OTHER BLEEDING DISORDERS64
22 Assays Based on Prothrombin Time (Factors II, V, VII, or X)
The assays of factors II, V, VII, and X can be performed using a one-stage assay based on the prothrombin time. Essentially, the assay consists of comparing the ability of dilutions of a standard or reference plasma and test plasma to correct the prothrombin time of a plasma known to be totally defi cient in the clotting factor being measured. In a factor V assay, for example (described below), the plasma is defi cient in factor V but contains normal amounts of factors II, VII, X, and fi brinogen. Clotting factors II, VII, and X may be assayed in a similar way, substituting the appropriate defi cient plasma for FV-defi cient plasma in the example given below, and using an appropriate reference plasma with a known concentration of the factor being assayed.
REAGENTS
FV-defi cient plasma This may be congenitally defi cient or artifi cially defi cient in factor V (aged plasma)
Owren’s buffered saline OBS or glyoxaline buffer (see Section 9)
Platelet-poor citrated plasma: test and standard For the standard, use a 20-donor normal plasma pool (kept at -70°C or below) or a commercial reference or standard plasma.
Thomboplastin/calcium (as used in PT tests)
METHOD
1 For both test and standard plasmas, prepare dilutions in plastic tubes, as shown in Figure 22.1 below.
Figure 22.1. Preparation of test and standard plasma dilutions
Dilution Plasma (ml) OBS (ml)
1/5 0.1 0.4
1/10 0.1 0.9
1/20 0.5 (1/10) 0.5
1/40 0.5 (1/20) 0.5

ASSAYS BASED ON PROTHROMBIN TIME (FACTORS II, V, VII, OR X) 65
Note: Mix the 1/10 dilution well before using it to prepare the 1/20 dilution. Mix the 1/20 dilution well before using it to prepare the 1/40 dilution. Plasma dilutions should be tested immediately after preparation. If room temperature exceeds 25°C, it may be necessary to keep dilutions on wet ice prior to analysis.
2 Test each dilution of reference or standard plasma as follows:
i. Pipette 0.1 ml of each dilution into a 75 × 10 mm glass tube.
ii. Add 0.1 ml factor V defi cient plasma.
iii. Warm to 37°C for 2 minutes.
iv. Add 0.2 ml pre-warmed thromboplastin/calcium reagent.
v. Start stopwatch and mix.
Note: If the thromboplastin reagent does not contain calcium, 0.1 ml of thromboplastin is added to the mixture of dilution and defi cient plasma. After a 1–2 minute delay for warming to 37°C, the mixture is clotted with 0.1 ml pre-warmed (to 37°C) calcium.
3 Record clotting time.
4 Repeat for dilutions of test plasma.
For test plasmas expected to be normal, test 1/10, 1/20, and 1/40 dilutions. For test plasmas expected to have reduced levels, test 1/5, 1/10, and 1/20 dilutions.
A “blank” should also be tested as follows:
0.1 ml OBS
0.1 ml factor V-defi cient plasma
0.2 ml thromboplastin/calcium reagent
The clotting time of the “blank” refl ects the quality of the defi cient plasma and should be equivalent to less than 1%.
RESULTS
Plot clotting times of control and test plasmas against concentration of FV on 3 cycle × 2 cycle logarithmic paper. An example of such a graph (for a FVIII assay) is shown in Section 23. The 1/10 dilution is arbitrarily assigned a value of 100%, thus the 1/5 dilution is equivalent to 200%, etc. Alternatively, plot concentration on a logarithmic scale and clotting time on a linear scale.
The relative amount of FV in the patient’s plasma compared with normal plasma or standard reference material is extrapolated from the graphs. An example of this is shown in the section on APTT-based assays (Figure 23.1).

DIAGNOSIS OF HEMOPHILIA AND OTHER BLEEDING DISORDERS66
The clotting time equivalent to 100% test (the place where the test line passes through the 100% activity) is read from the standard line (therefore, the concentration of standard that could give that particular clotting time). This gives the concentration of the test in percentage of standard. This percentage is multiplied by the concentration of clotting factor in the standard (in IU/dl) to give the concentration in the test (in IU/dl).
NOTES
The normal range for each of these clotting factors should be determined locally but often has a lower limit of 50–70 IU/dl for FV, FVII, and FX. The lower limit of normality for FII is higher. In one study, normal subjects from families with a history of FII defi ciency, as well as other unrelated normal subjects, had FII levels in the range of 84–130 IU/dl (Girolami et al. 1998). A different centre has reported a reference range of 84–132 IU/dl (Bolton Maggs et al. 2004).
Individuals with a reduced level of FV should also have a FVIII assay performed to exclude combined FV and FVIII defi ciency.
In some cases of FVII defi ciency, there may be a discrepancy between the levels of FVII:C obtained, depending on the source of thromboplastin. The use of human thromboplastin is therefore advisable on the basis that the results are more likely to refl ect the in vivo activity. See Bolton-Maggs et al. (2004) for a review. In some rare cases, the result may be very low if rabbit thromboplastin is used, but normal if the assay utilizes human thromboplastin. This may be a reason why some cases of apparent severe FVII defi ciency do not have bleeding symptoms.
REFERENCES
Bolton-Maggs PH, Perry DJ, Chalmers EA, Parapia LA, Wilde JT, Williams MD, Collins PW, Kitchen S, Dolan G, Mumford AD. The rare coagulation disorders — review with guidelines for the management from the UK Haemophilia Centre Doctors’ Organization. Haemophilia 2004; 10(5): 593-628.
Girolami A, Scarano L, Saggiorato G, Girolami B, Bertomoro A, Marchiori A. Congenital defi ciencies and abnormalitoies of prothrombin. Blood Coagul Fibrinol1998: 9: 557-569.

FACTOR ASSAYS BASED ON APTT (ONE-STAGE ASSAY OF FVIII:C, FIX, FXI, OR FXII) 67
PRINCIPLE
The one-stage assay for FVIII is described in this section. The assay is based on a comparison of the ability of dilutions of standard and test plasmas to correct the APTT of a plasma known to be totally defi cient in FVIII but containing all other factors required for normal clotting. For factors IX, XI, and XII, the assay is essentially the same and is performed by substituting the relevant defi cient plasma for FVIII-defi cient plasma, and after selection of the appropriate reference plasma.
REAGENTS
Platelet-poor citrated test and standard plasma The standard plasma used should be either a locally prepared plasma pool kept at -70°C or lower, or a commercial standard plasma. In either case, this reference plasma must be calibrated against an international standard for FVIII. It is not acceptable to assume that a pooled normal plasma has 100 U/dl FVIII:C.
FVIII-defi cient plasma This is available commercially or may be collected from a donor whose FVIII level is less than 1 U/dl, who has no anti-FVIII antibodies, who has received no treatment for two weeks, and who has normal liver function tests. Abnormal liver function could lead to reduction in other clotting factors, which affect the specifi city of the assay. This plasma can be stored in aliquots at -37°C. It is preferable to use FVIII-defi cient plasma produced by immunodepletion of FVIII from normal plasma using a monoclonal antibody. This type of material is available commercially and has the advantage of viral safety compared with plasmas from hemophiliacs who have been treated with plasma products. However, not all immunodepleted plasmas are found to be <1 U/dl, and care should be taken to check this. Some experts hold the view that the presence of normal concentrations of VWF in FVIII-defi cient plasma may be an advantage, and there is evidence to support this in relation to FVIII assays performed as part of FVIII inhibitor determinations.
APTT reagent
Owren’s buffered saline (OBS or glyoxaline buffer; see Section 9)
25mM CaCl2
23Factor Assays Based on APTT (One-Stage Assay of FVIII:C, FIX, FXI, or FXII)
DIAGNOSIS OF HEMOPHILIA AND OTHER BLEEDING DISORDERS68
METHOD
1 Make 1/10 dilutions of standard and test plasma in buffered saline in plastic tubes. (If the test plasma is expected to have a very low level of factor VIII, start at a 1/5 dilution).
2 Using 0.2 ml volumes, make doubling dilutions in OBS of standard and test plasma from 1/10 to 1/40 in plastic tubes. (Mix each dilution well before transferring to next tube.) Plasma dilutions should be tested immediately after preparation. If room temperature exceeds 25°C, it may be necessary to keep dilutions on wet ice prior to testing.
3 Pipette 0.1 ml of each standard dilution into a 75 × 10 mm glass tube.
4 Add 0.1 ml of FVIII-defi cient plasma and transfer to 37°C water bath.
5 Add 0.1 ml of APTT reagent and incubate for 5 minutes.
6 At 5 minutes add 0.1 ml CaCl2 and record the clotting time.
A “blank” should also be set up as follows: 0.1 ml OBS 0.1 ml FVIII-defi cient plasmas 0.1 ml APTT reagent Incubate 5 minutes 0.1ml CaCl2
The clotting time of the blank should be longer than the time of 1% FVIII activity of standard from the calibration graph. If the time is shorter, this indicates that the substrate plasma is not totally defi cient in FVIII and thus is not a suitable substrate plasma.
RESULTS
Plotting of results is described in Section 22, requiring double logarithmic or logarithmic/linear scale graph paper.
The 1/10 dilution is arbitrarily assigned a value of 100%, the 1/20 dilution a value of 50%, and the 1/40 dilution a value of 25%.
Straight lines, parallel to each other, should be obtained.
Read off concentration of test sample as shown in Figure 22.1 (Section 22). In this example, the FVIII concentration in the test sample is 7% of that in the standard. If the standard has a concentration of 85 IU/dl, the test sample has a concentration of 85 IU/dl × 7% = 6 IU/dl.
If the lines are not parallel, the assay should be repeated.

FACTOR ASSAYS BASED ON APTT (ONE-STAGE ASSAY OF FVIII:C, FIX, FXI, OR FXII) 69
Non-parallel lines may occur due to technical error. If technical error has been eliminated, it may be due to the presence of an inhibitor, which may act specifi cally against FVIII or may be of the “lupus type”, showing a converging pattern. Diverging lines are typical of an activated sample.
NOTES
If the test plasma FVIII (or FIX, FXI, or FXII) concentration is close to zero (i.e., the clotting times of all dilutions are similar to the blank), non-parallel lines may occur.
The normal range should be established locally but often has a lower limit of 50–65 IU/dl in the case of FIX or FXI.
In relation to FXI, the International Unit has only recently been established. At the time of writing, there are few data on the normal levels of FXI in IU. Publications that predate the establishment of the IU have indicated that the lower limit of normality for FXI is in the range 63–80 U/dl (see Bolton-Maggs et al. 2004 for a review).
Figure 23.1. Graph of FVIII assay
REFERENCE
Bolton-Maggs PH, Perry DJ, Chalmers EA, Parapia LA, Wilde JT, Williams MD, Collins PW, Kitchen S, Dolan G, Mumford AD. The rare coagulation disorders — review with guidelines for the management from the UK Haemophilia Centre Doctors’ Organization. Haemophilia 2004; 10(5): 593-628.
Clotting Time (sec)
Standard
Test
1/40
200
100
60
40
20
5 10 20 30 50 100
% Factor VIII Activity
1/20 1/10

DIAGNOSIS OF HEMOPHILIA AND OTHER BLEEDING DISORDERS70
24 Factor VIII:C Assays in Cryoprecipitate
The assay conditions described in Section 23 are appropriate when test samples contain normal or near normal levels of FVIII:C. If the level is elevated above 150 IU/dl, the conditions normally need to be modifi ed for the assay design to be valid.
The levels of FVIII:C in cryoprecipitate vary between individual donations, but are typically in the range of 200–1000 IU/dl. At these levels, the test material must be pre-diluted to reduce the concentration prior to assay. For most units of cryoprecipitate, a pre-dilution of 1 in 5 or 1 in 10 will reduce the concentration to a level such that the diluted material can then be used in the assay design described in Section 23 (i.e. the pre-diluted material is then further di luted 1/5, 1/10, 1/20 in assay buffer, as described).
If the cryoprecipitate is not pre-diluted to a suitable concentration, the requirements for a straight line through dilutions of test sample and for that line to be parallel to the calibration curve are unlikely to be met. Such an assay would then be invalidated, and the results would not be accurate.
The pre-dilution of cryoprecipitate should be completed immediately prior to the FVIII:C assay. Some centres use the buffer employed in the FVIII:C assay (e.g. Owren’s buffer or imidazole/glyoxide), whereas others use FVIII:C-defi cient plasma for this purpose. In general, such pre-dilutions are likely to be more stable if prepared using FVIII:C-defi cient plasma. Therefore, this is the preferred diluent.
The precision of FVIII assays on cryoprecipitate between centres is similar to the precision when plasma samples are tested (Jennings et al. 2009).
REFERENCE
Jennings I, Kitchen DP, Woods TA, Kitchen S, Walker ID, Preston FE. Laboratory performance in the World Federation of Hemophilia EQA programme 2003–2008. Haemophilia 2009; 15: 571–7.

TWO-STAGE CLOTTING ASSAY FOR FACTOR VIII:C 71
25Two-Stage Clotting Assay for Factor VIII:C
PRINCIPLE
This assay was fi rst described in 1955 as a modifi cation of the thromboplastin dilution test. The two-stage FVIII:C assay is based on the principle that the amount of FVIII present in the system is rate-limiting during clotting of a test mixture containing FX, activated FIX, phospholipid, calcium, and FV in excess. Adsorption of plasma by aluminium hydroxide removes activated factors and vitamin K–dependant factors. This is necessary to remove prothrombin so that none is present in the initial incubation mixture. Without this step, the mixture would contain all the components required for fi brin to form, and the mixture would clot.
The dilutions of adsorbed standard and test plasma are incubated with the combined reagent in the 1st stage. This generates FXa. A source of prothrombin and fi brinogen from pooled normal plasma is added in the 2nd stage, which allows a clot to form and for which the resulting clotting time is dependent on the initial amount of factor VIII:C.
REAGENTS
Combined reagent (see “Production of Combined Reagent”on page 73)
Owren’s Veronal buffer
Pooled normal plasma (substrate plasma): store deep frozen
Standard or reference plasma
Internal quality control (IQC)
0.0125M Cacl2 (for example, 1 in 2 dilution of 0.025M CaCl2 as used in APTT testing)
Alumina hydroxide suspension (e.g. SIGMA catalogue code A8222): store at room temperature
SAMPLE REQUIREMENTS
Citrated plasma, which can be stored frozen prior to testing, if required.

DIAGNOSIS OF HEMOPHILIA AND OTHER BLEEDING DISORDERS72
METHOD
1 Reconstitute standard plasma with distilled water 10 minutes before use, and combined reagent at least 15 minutes before use with 3 ml of 0.0125M CaCl2.
2 Prepare IQC plasma and substrate plasma. If any are frozen, thaw at 37°C for 5 minutes before use.
3 Label suffi cient disposable plastic tubes for each of the samples, IQC, and standard.
4 Place 0.45 ml of standard, IQC, and patient plasma into each plastic tube.
5 Add 50 μl of well-shaken alumina to each tube and mix well.
6 For small volumes of plasma, use 0.225 ml plasma and 25 μl alumina.
7 Incubate at 37°C for 3 minutes, then spin at 5000 g for 2 minutes in a suitable centrifuge.
8 Immediately transfer the supernatant plasma to plastic cups or tubes compatible with the analyser being used. Take care not to disturb the sedimented alumina.
Note: The following steps are based on use of a Sysmex CA series analyser. The test can be run on instrumentation from a number of other manufacturers. One co-author of this manual has successfully run assays on analysers from Instrumentation Laboratory, and most likely the method would be compatible with other types of analyser. Therefore, this specifi c method is included as an illustrative example.
9 Load combined reagent, assay buffer, and pooled normal plasma/substrate onto autoanalyser.
10 Adsorbed plasmas are presented for analysis in the following order: standard, IQC, patient plasmas, and lastly, a second standard. Samples with normal concentrations of FVIII are normally assayed using three different dilutions in the range of 1/50–1/400.
For low levels of FVIII (< 0.05 IU/dl) dilutions of 1/10, 1/20, and 1/50 might be needed. For raised levels (>1.5 IU/dl), dilutions of 1/800–1/3200 might be needed. Otherwise, patient dose response lines may not be parallel to the standard line.
RESULTS
Plotting of results and calculations of FVIII activity are as described in the one-stage assay (Section 23).

TWO-STAGE CLOTTING ASSAY FOR FACTOR VIII:C 73
25.1 Production of Combined Reagent for Two-Stage Factor FVIII:C Assay
Obtain suffi cient FV and phospholipid to produce a 5:1:1 ratio with diluted aged serum (i.e. 5 parts serum to 1 part FV and 1 part phospholipid). For example, 240 ml diluted serum, 48 ml FV, and 48 ml phospholipid (or 180 ml:36 ml:36 ml).
REAGENTS
Aged serum
1. 10 ml blood taken from at least 6 normal donors in plain glass tubes; no additives.
2. Incubate for 4 hours at 37°C, then overnight at 4°C.
3. Spin at 3000 rpm for 10 minutes.
4. Separate and mix supernatant in non-siliconized glass (can be stored frozen).
Bovine FV (Diagnostic Reagents Ltd., Thame, Oxfordshire, England)Reconstitute each with 1 ml glyoxaline buffer.
Phospholipid (Bell and Alton, Diagnostic Reagents Ltd., Oxford England)Reconstitute each with 1 ml glyoxaline buffer (i.e. 5x concentration).
Glyoxaline buffer
HEPES Acid (Sigma H3375)
METHOD
1 Dilute aged serum 1/10 with glyoxaline buffer.
2 Activate diluted serum for one hour by adding one small glass ball (ballotini ball) per ml, and place on rotary mixer for one hour with lab fi lm over the top. (Note: 100 ballotini balls weigh 3.7 g).
Note: for steps 3 to 8, work as quickly as possible.
3 Reconstitute FV plasma in 1 ml glyoxaline buffer.
4 Reconstitute phospholipid in 1 ml glyoxaline buffer.
5 Mix diluted activated serum, FV, and phospholipid in a 5:1:1 ratio.
DIAGNOSIS OF HEMOPHILIA AND OTHER BLEEDING DISORDERS74
6 Mix well and add HEPES powder, giving a concentration of 1% to stabilize the pH at 7.0 (e.g. if 300 ml fl uid, add 3 g HEPES).
7 Dispense into 0.5 ml amounts.
8 These can be lyophilized (see Section 40 on lyophilization).
9 Test new reagent for optimum conditions, as described below.
ASSESSMENT OF FXA GENERATION PLATEAU
The optimum sample dilution, incubation time, total volume in the assay, volume of 0.0125M CaCl2 for reconstitution, length of reconstitution, and stability of the reconstituted combined reagent need to be systematically assessed to obtain a FXa generation plateau.
The order and extent that the following occur is not defi nitive. They are subject to alteration, depending on the batch. A good starting point is to use the same conditions that the current batch uses, then change one parameter at a time.
Reconstitution volume with 0.0125M CaCl2: 0.5 ml, 1 ml, 1.5 ml, 2 ml, 2.5 ml, 3 ml, 3.5 ml.
Length of reconstitution prior to use/stability after reconstitution: Immediately before use, 5 minutes, 10 minutes, 30 minutes, 60 minutes, 120 minutes.
Incubation time: 5 minutes, 6 minutes, 7 minutes, 8 minutes, 9 minutes, 10 minutes.
Sample dilution: 1/20, 1/50, 1/80, 1/100.
Volume of combined reagent in assay: 20 μl, 30 μl, 40 μl, 50 μl, etc.
For each assay run, plot all results on log-log graph paper, as per the example in Figure 25.1. Select dilutions and conditions that have the most points on the linear part of the curve. Ideal conditions have clotting times around 20 to 30 seconds for the fi rst dilution.
NOTES
Pooled normal plasma/substrate is pooled from residual normal plasma from normal clotting screens or from healthy normal subjects.
Constituent plasmas should have normal PT and normal APTT.
Pooled normal plasma can be stored in pools of 3 ml or 5 ml in plastic vials at -80°C for at least six months.

TWO-STAGE CLOTTING ASSAY FOR FACTOR VIII:C 75
Figure 25.1. Example of FXa generation plateau

DIAGNOSIS OF HEMOPHILIA AND OTHER BLEEDING DISORDERS76
26 Chromogenic FVIII:C Assay
INTRODUCTION
The most commonly performed assay for FVIII:C worldwide for many years has been the one-stage assay, described in Section 23.
There are limitations to the one-stage assay, including interference if lupus anticoagulant is present. More importantly, mild hemophilia A is not excluded by the fi nding of a normal FVIII:C level by one-stage assay. Several groups have reported that a subgroup of mild hemophilia A patients have discrepancy between the activity of FVIII as determined using different types of assay (Parquet-Gernez et al. 1988, Duncan et al. 1994, Keeling et al. 1999). More than 20% of mild hemophilia A patients are associated with this discrepancy, which is defi ned as a two-fold difference between results obtained with different assay systems (Parquet- Gernez et al. 1988).
In some cases, the one-stage assay result may be fi ve times higher than the two-stage clotting or chromogenic assay (Parquet- Gernez et al. 1988). Most commonly, the result of the one-stage assay is more than two-fold higher than the two-stage clotting or chromogenic assay. In more than three quarters of such patients, all assay results are reduced below the lower limit of the reference range so that a diagnosis can be reliably made, irrespective of which method is employed for analysis.
However, in a small proportion of patients, the results of the one-stage assay are well within the normal range, with reduced levels with the two-stage clotting or chromogenic assay (Keeling et al. 1999, Mazurier et al. 1997). These patients have bleeding histories compatible with the lower levels obtained in the two-stage clotting or chromogenic assay.
In many cases, the genetic defect has been identifi ed, so there is no doubt that these subjects do indeed have hemophilia (Rudzi et al. 1996, Mazurier et al. 1997). Based on the literature, about 5%−10% of genetically confi rmed mild hemophilia A patients have a normal one-stage assay result. Since FVIII activity is normal in the one-stage APTT-based assay, it is not surprising that the APTT is also normal in such patients. This means that patients with a clinical history compatible with hemophilia A should have a two-stage clotting (see Section 25) or chromogenic assay, even if the APTT and one-stage assay are normal.

CHROMOGENIC FVIII:C ASSAY 77
A number of manufacturers have commercial kits for chromogenic assay of FVIII. Many of these are suitable for diagnosis of hemophilia A in the presence of normal one-stage FVIII activity. Examples of results in such patients are shown in Figure 26.1 below. The chromogenic assay used was a commercial kit from Siemens/Dade Behring, but its inclusion does not indicate superiority over other similar assays, which could be successfully used in this context.
Figure 26.1. Examples of patients with genetically confi rmed mild hemophilia A and assay discrepancies
CaseOne-stage
assay (IU/dl)Two-stage clotting
assay (IU/dl)Chromogenic assay (IU/dl)
A 101 34 13
B 88 15 28
C 63 30 40
D 55 24 40
E 58 21 33
F 72 21 36
G 84 19 45
There are cases of mild hemophilia A that have reduced activity by one-stage assay, but normal results by the two-stage or chromogenic assay (Mumford et al. 2002, Lyall H et al. 2008). In many (but not all) such cases, the clinical phenotype correlates with the chromogenic or two-stage clotting assay result in that there is no personal or family history of bleeding, with no requirement for FVIII replacement therapy (Lyall H et al. 2008).
Based on these results, it is advantageous for all hemophilia centres to have available a chromogenic or two-stage clotting assay. These tests should be performed on subjects with normal APTT and one-stage FVIII activity in the presence of a personal or family history consistent with mild hemophilia.
A modifi ed chromogenic assay (modifi ed version of the Coamatic assay, Instrumentation Laboratory Ltd.) has been described. It is suitable for assay of very low levels of FVIII (Yatuv et al. 2006). This method has been reported to allow accurate and precise measurements of FVIII in the range of 0.1−2 IU/dl (0.1−2% FVIII, or 0.001−0.02 IU/ ml).
DIAGNOSIS OF HEMOPHILIA AND OTHER BLEEDING DISORDERS78
PRINCIPLE OF ANALYSIS
In some (but not all) chromogenic assays, all the FVIII in the sample is activated by thrombin. Activated FVIII then accelerates the conversion of FX to FXa in the presence of activated FIX, phospholipids, and calcium ions. The FXa activity is assessed by hydrolysis of a p-nitroanaline substrate specifi c to FXa. The initial rate of release of p-nitroanaline (yellow colour) measured at 405 nm is proportional to the FXa activity and thus to the FVIII activity in the sample. For a review, see Lundblad et al. (2000).
REFERENCES
Duncan EM, Duncan BM, Tunbridge LJ, Lloyd JV. Familial discrepancy between the one-stage and two-stage factor VIII assay methods in a subgroup of patients with haemophilia A. Br J Haematol 1994; 87: 846–848.
Keeling DM, Sukhu K, Kemball-Cook G, Waseem N, Bagnall R, and Lloyd JV. Diagnostic importance of the two stage FVIII:C assay demonstrated by a case of mild hemophilia associated with His1954 → Leu substitution in the FVIII A3 domain. Br J Haematol 1999; 105: 1123–6.
Lundblad RL, Kingdon HS, Mann KG, White GC. Issues with the assay of FVIII activity in plasma and FVIII concentrates. Thromb Haemost 2000; 84:942–8.
Lyall H, Hill M, Westby J, Grimley C, Dolan G. Tyr346 → Cys mutation results in factor VII:C assay discrepancy and a normal bleeding phenotype: Is this mild haemophilia A? Haemophilia 2008; 14:78–80.
Mazurier C, Gaucher C, Jorieux S, Parquet-Gernez A. Mutations in the FVIII gene in seven families with mild haemophilia A. Br J Haematol 1997; 96:426–7.
Mumford AD, Laffan M, O’Donnell J, McVey JH, Johnson DJD, Manning RA, Kemball-Cook G. A Tyr346Cys substitution in the interdomain acidic region a1 of FVIII in an individual with FVIII:C assay discrepancy. Br J Haematol 2002; 118:589-594.
Parquet-Gernez A, Mazurier C, Goudemand M. Functional and immunological assays of FVIII in 133 haemophiliacs: Characterisation of a subgroup of patients with mild haemophilia A and discrepancy in 1- and 2-stage assays. Thromb Haemost 1998; 59:202–206.
Rudzi Z, Duncan EM, Casey GJ, Neuman M, Favaloro RJ, Lloyd JV. Mutations in a subgroup of patients with mild haemophilia A and familial discrepancy between one-stage and two-stage factor VIII:C methods. Br J Haematol 1996; 94:400–406.
Yatuv R, Dayan I, Baru M. A modifi ed chromogenic assay for the measurement of very low levels of FVIII activity (FVIII:C). Haemophilia 2006; 12:253–257.
ONE-STAGE INTRINSIC ASSAY OF PREKALLIKREIN (PKK) AND HIGH MOLECULAR WEIGHT KININOGEN (HMWK) 79
PRINCIPLE
HMWK (Fitzgerald factor) and PKK (Fletcher factor) are coagulation factors found in the contact pathway. A reduction in either causes a greatly prolonged APTT with most APTT reagents, depending on the activator used. In the complete absence of HMWK or PKK (<1 U/dl), the APTT is normally >200 seconds and is longer than the APTT with the same test system in the presence of complete defi ciency of factors VIII or IX. APTT reagents that utilize ellagic acid as activator (for example, Actin FS) will give completely normal results with either defi ciency. Therefore, such reagents cannot be used in the one-stage assay of these factors.
The dose-response curve in the one-stage assay of these factors is steeper for some reagents than others. The method below describes use of one particular reagent for which the dose-response curve is particularly steep, leading to more accurate and precise assay results.
REAGENTS
Dapttin APTT reagent (Technoclone, Vienna, Austria)Store at 2°C–8°C, as per manufacturer’s instructions
25mM CaCl2Store at 2°C–8°C
Owren’s Veronal bufferStore at 2°C–8°C
Prekallikrein (Fletcher factor)-defi cient plasmaExample: Freeze-dried (Technoclone, Vienna, Austria)Store at 2°C–8°C
HMWK (Fitzgerald factor)-defi cient plasmaExample: Freeze-dried (Technoclone, Vienna, Austria)Store at 2°C–8°C
Reference plasma (for example, pooled normal plasma, see Section 7)
Internal quality control sample
27One-Stage Intrinsic Assay of Prekallikrein (PKK) and High Molecular Weight Kininogen (HMWK)

DIAGNOSIS OF HEMOPHILIA AND OTHER BLEEDING DISORDERS80
METHOD
1 Assay design is as for one-stage assays of FVIII described in Section 23 (i.e. 3 dilutions of standard, 3 dilutions of test plasma).
2 Dilutions are made using Owren’s buffer.
3 The most suitable assay dilutions are typically higher than those used in one-stage FVIII or FIX assays previously described.
4 Analysis and construction of calibration curve, as well as calculation of test results, are as described under the one-stage FVIII assays (Section 23).
Normal ranges from the literature are as follows:HMWK: 0.70–1.20 U/ml (70–120 U/dl)PKK: 0.70–1.20 U/ml
At the time of writing, there are no International Standards for HMWK or PKK.

CLOTTING FACTOR INHIBITOR SCREEN BASED ON APTT 81
28Clotting Factor Inhibitor Screen Based on APTT
PRINCIPLE
Coagulation inhibitors affecting the APTT may be immediate-acting or time-dependent. Test plasma containing an immediate-acting inhibitor will, when mixed with normal plasma, show little or no correction of the clotting time. Time-dependent inhibitors, on the other hand, require a period of incubation with normal plasma before they can be detected.
Normal plasma and test plasma are incubated at 37°C for 1–2 hours, both separately and as a 50:50 mixture. The APTT is then determined on the normal plasma, test plasma, and incubated mixture, as well as on a mixture prepared from equal volumes of test and normal plasma after separate incubation (immediate mix). The degree of correction of the APTT of each mixture is compared.
Poor correction in the mixture prepared after separate incubation is suggestive of an immediate-acting inhibitor. Poor correction in the incubated mixture is suggestive of a time-dependent inhibitor.
REAGENTS
Normal plasma: pool of 20 donors
Test plasma
Reagents for APTT
METHOD
1 Prepare three plastic tubes: A, B, and C.
2 Into A, place 0.5 ml normal plasma, into B, 0.5 ml test plasma, and into C, 0.2 ml each of normal and test plasma.
3 Incubate for 1–2 hours at 37°C.
4 Make a 50:50 mix from tubes A and B. This is tube D, which serves as an immediate mix.
5 Perform an APTT in duplicate on A, C, D, and B (in that order).

DIAGNOSIS OF HEMOPHILIA AND OTHER BLEEDING DISORDERS82
RESULTS AND INTERPRETATION
Figure 28.1. Example of a clotting factor inhibitor screen based on APTT
Sample 1 2 3
A: Normal plasma 40 40 40
B: Test plasma 90 90 90
C: Test + normal (incubated after mixing together) 45 70 70
D: Test + normal (incubated separately before mixing) 45 48 70
Sample 1: a plasma with an intrinsic defect but no inhibitorSample 2: a plasma containing a time-dependent inhibitorSample 3: a plasma containing an immediate-acting inhibitor

RISTOCETIN COFACTOR ACTIVITY/VON WILLEBRAND FACTOR ACTIVITY (VWF:RCO OR VWF:ACT) 83
INTRODUCTION
Ristocetin cofactor measurement is essential for the diagnosis of von Willebrand disease (VWD). While ristocetin-induced platelet aggregation (in platelet-rich plasma) can be carried out when platelet aggregation studies are being done, the test is not suffi ciently sensitive, and impaired aggregation may be encountered in disorders other than VWD. The VWF:RCo assay is particularly useful in detection of type 2A, 2B, and 2M VWD, where the VWF:Ag may be normal or near normal whereas the VWF:RCo is markedly reduced.
RISTOCETIN COFACTOR ASSAY
The method described here combines a macroscopic assay method and the platelet fi xation technique of Evans and Austen.
REAGENTS
Reference plasma
Fixed washed platelets Formaldehyde-fi xed normal human platelets are prepared from platelet concentrates such as those used for treatment of patients with platelet disorders, by the method of Evans and Austen (1977). See “Fixed platelet preparation”, on page 85.
Ristocetin (Ristocetin A SO4 Macrofarm Ltd., Third Floor, 27 Cockspur Street, Trafalgar Square, London SW1Y 5BN) 100 mg powder is diluted in 3.3 ml saline and dispensed into 0.1 ml amounts in capped plastic tubes and stored at -70°C. This stock solution therefore has a concentration of 30 mg/ml. The fi nal concentration required in the assay tube is 1.0 mg/ml. Since there is a 1 in 4 dilution in the assay, this requires a solution of 4.0 mg/ml. For 4.0 mg/ml, add 0.65 ml saline to 0.1 ml of the 30 mg/ml stock solution. (This should give a blank time, i.e. 0.2 platelets + 0.1 ml ristocetin + 0.1 buffer of > 60 seconds).
6 g% albumin citrate-saline buffer Use citrate/saline (one part 0.11M trisodium citrate:5 parts normal saline) with 1.2 g of bovine serum albumen added.
29Ristocetin Cofactor Activity/von Willebrand Factor Activity (VWF:RCo or VWF:Act)

DIAGNOSIS OF HEMOPHILIA AND OTHER BLEEDING DISORDERS84
METHOD
1 Using albumin citrate-saline buffer, dilute the normal and test plasmas as follows:
Standard plasma: 1/2, 1/4, 1/8 Test plasma: 1/2, 1/4, 1/8
2 Test each dilution at room temperature as follows:
i. In a glass clotting tube, place:
0.2 ml fi xed washed platelets (at a count of 800 × 109/1 in platelet suspending solution)
0.1 ml diluted plasma
ii. Mix well, avoiding formation of bubbles as much as possible. Add 0.1 ml ristocetin (4.0 mg/ml, giving a fi nal concentration of 1.0 mg/ml).
iii. Start stopwatch. Tilt the tube to and fro briskly over a dark background with a lamp shining on the tube.
iv. Record the time taken for large visible aggregate to form.
Test each dilution in duplicate, and in triplicate if the difference between the duplicates is >10%.
CALCULATION
Plot the time taken for agglutination of the normal plasma dilutions against dilution/concentration on 2-cycle log-log paper. Plot the times obtained with the dilutions of test plasma. The graphs should be parallel straight lines.
The concentration of ristocetin cofactor in the test plasma is read from the standard and corrected for dilution and value of the standard in a similar way to that described in the section describing one-stage FVIII assays (Section 23).
The normal range should be established locally, but it is typically close to 50–150 IU/dl.

RISTOCETIN COFACTOR ACTIVITY/VON WILLEBRAND FACTOR ACTIVITY (VWF:RCO OR VWF:ACT) 85
29.1 Fixed Platelet Preparation
Figure 29.1. Reagents for fi xed platelet preparation
0.2% EDTA solution 2 g disodium-EDTA, 8.5 g NaCl, distilled water to 1 litre, pH6.4
Fixing solution
20 ml × 40% formaldehyde solution (or 22.2 ml 36% formaldehyde). 0.2 g disodium-EDTA, 8.5 g NaCl, 0.4 disodium hydrogen phosphate, 1.1 g sodium dihydrogen phosphate dihydrate, distilled water to 1 litre, pH 6.4.
Washing solution 1 part trisodium citrate solution (3.8%)5 parts saline solution, pH 6.4
Suspending solution As washing solution, but pH 7.4
Storage solution 0.2 g disodium-EDTA, 8.5 g NaCI, 0.10g sodium azide, distilled water to 1 litre, pH 6.4.
METHOD
1 Obtain platelets as fresh as possible in citrate phosphate dextrose (as used for blood product collection) or take blood into 0.109M citrate and prepare platelet-rich plasma (PRP).
2 Leave PRP in a capped plastic container at room temperature for one hour, then at 37°C for one hour. Mix nine parts of PRP with one part of EDTA solution. Let stand for two minutes at room temperature.
3 Add an equal volume of fi xing solution at 4°C and leave at 4°C overnight.
4 Centrifuge at 280 g for 20 minutes. Discard supernatant and drain platelet pellet.
5 Add 2% of the starting PRP volume of washing solution and resuspend the platelets.
6 Further dilute to 25% of the starting PRP volume and leave at 4°C for one hour.
7 Centrifuge at 280 g for 20 minutes, drain, and resuspend in suspending solution for immediate use or in storage solution for storage at 4ºC and usage later.
8 Resuspend to a concentration of approximately 800 × 109/l.

DIAGNOSIS OF HEMOPHILIA AND OTHER BLEEDING DISORDERS86
The platelets will settle on storage to form a loose sediment. Before commencing an assay, remove the storage solution from above the platelets and replace with an equal volume of suspending solution. Platelets are then stable for at least two months.
REFERENCE
Evans RJ, Austen DE. Assay of ristocetin cofactor using fi xed platelets and a platelet counting technique. Brit J Haemato 1997; 37: 289-94.

VON WILLEBRAND FACTOR ANTIGEN BY ELISA (VWF:AG) 87
PRINCIPLE
A polyclonal antibody to human von Willebrand factor (VWF) is bound to the plastic surface of wells in a microtitre plate. Dilutions of test and standard plasma are added and incubated, during which time VWF is bound by antibody. A second enzyme-labelled antibody is added, which in turn binds to VWF. The amount of antibody bound, and thereafter VWF present, is quantifi ed by addition of enzyme substrate followed by colour development.
BUFFERS
Carbonate buffer 0.05M pH 9.6 For 1 litre: 1.59 g sodium carbonate 2.93 g sodium hydrogen carbonate 0.20 g sodium azide
Phosphate buffered saline 0.01M pH 7.2For 1 litre: 0.345 g sodium dihydrogen phosphate 2.680 g disodium hydrogen phosphate 12H20. 8.474 g sodium chloride PBS Tween 20 1 ml/l PBS Tween 20 0.5 ml/l
Citrate phosphate buffer 0.1M pH 5.0 For 1 litre: 7.30 g citric acid 23.87 g disodium hydrogen phosphate 12H20
SUBSTRATE SOLUTION
80 mg 1,2 orthophenylenediamine dichloride dissolved in 15 ml citrate phosphate buffer and 10 µl of 20 vols. hydrogen peroxide added.
Note: This must be made up fresh each time.
OTHER MATERIALS
Anti–VWF antibodyExample: rabbit anti-human VWF from DAKO a/s (Production Svej, DK-2600, Glastrup, Denmark).
30Von Willebrand Factor Antigen by Elisa (VWF:Ag)

DIAGNOSIS OF HEMOPHILIA AND OTHER BLEEDING DISORDERS88
Anti–VWF antibody conjugated with peroxidase enzyme (also from DAKO).
Note: Other sources of antibody can be used with equal success. The dilution of antibody suggested below may vary according to the source and batch number of antibody used.
Disposable microtitre plates and plate reader
10% sulphuric acid solution
METHOD
1 Add 100 μl antibody diluted 1/1000 in carbonate buffer to each well to be used. Incubate the plate for one hour in a wet-box at room temperature.
2 Wash the wells by fi lling them with 0.5 ml/l PBS Tween, followed by inversion and gentle tapping on to absorbent paper. Repeat four times.
3 Make dilutions of standard plasma (1/20, 1/30, 1/40, 1/50, 1/80, 1/160, 1/320) and test plasma (1/20, 1/40, 1/80, 1/160 for normal; 1/5 for expected low results) in 1 ml/l PBS Tween.
4 Add 100 μl of each dilution to wells, incubate for one hour as before, and wash as before.
5 Add 100 μl of DAKO peroxidase conjugated anti-VWF antibody diluted 1/1000 in 1 ml/l PBS Tween to each well and incubate as before.
6 Make up substrate now; keep dark with aluminium foil around universal and keep it mixing until the crystals or tablet have dissolved. (Add hydrogen peroxide immediately before use.)
7 Switch on plate-reader.
8 Wash twice in 0.5 ml/l PBS Tween and once in 0.1M citrate phosphate buffer.
9 Add 100 μl fresh substrate solution to each well and incubate the plate at room temperature in a wet-box for approximately six minutes (until colour is visible in lowest standard dilution).
10 Stop the reaction by adding 100 μl of 10% sulphuric acid solution to each well at the same rate that the substrate was added. If a multi-channel pipette is used, it is convenient to add substrate to each row of wells in turn at 10-second intervals, and then to add sulphuric acid in the same sequence at 10-second intervals.
11 Read optical density (OD) at 492 nm.
VON WILLEBRAND FACTOR ANTIGEN BY ELISA (VWF:AG) 89
Results are obtained by plotting the OD against dilution on log/log graph paper. The method of plotting and calculation is described in the one-stage FVIII assay description in Section 23.

DIAGNOSIS OF HEMOPHILIA AND OTHER BLEEDING DISORDERS90
PRINCIPLEVon Willebrand factor (VWF) has several functions. In addition to being the carrier protein for FVIII in plasma, forming a complex that protects FVIII from proteolysis, it also acts as a mediator for platelet aggregation by attaching itself to platelet membrane receptors (GpIb and GpIIb/IIa) following platelet activation. It is also important in primary hemostasis, acting as a mediator between platelets and the sub-endothelium.
VWF:RCo (Section 29) is a measure of the adhesive properties of VWF but it may not always reflect its physiological function. Measuring the capacity of VWF to bind collagen may sometimes better reflect its physiological function. In most (but not all) cases of VWD, there is concordance between the results of VWF:RCo and VWF:CB. In rare cases of VWD, one of these activities is reduced and the other is within the normal range. Full characterization may require both assays, although many centres use only one of the two. Some authors select VWF:CB in the absence of a suitably precise VWF:RCo.
A number of commercially available kits are on the market at the time of writing. An example is given below, but others are also successfully used. Inclusion of this particular method is not an endorsement of a particular company’s product. If using a different commercial source, it is important to follow the manufacturer’s instructions.
REAGENTTECHNOZYM VWF:CBA ELISA Kit (Technoclone, Vienna, Austria)
Store at 2°C–8°C, per manufacturer’s instructions.
SAMPLESCitrated test plasma and calibrators may be stored deep-frozen at temperatures lower than -35°C prior to analysis.
METHOD
1 Ensure kit is brought to room temperature for 30 minutes before starting. The kit can be split into three or four, according to the number of samples to be tested.
31 Von Willebrand Factor Collagen Binding Assay (VWF:CB)

VON WILLEBRAND FACTOR COLLAGEN BINDING ASSAY (VWF:CB) 91
2 Reconstitute standards and control samples with 0.5 ml distilled water and leave for 15 minutes, or thaw if previously frozen. Vortex mix well for 10 seconds.
3 Dilute all test, control, and standard plasmas 1+ 25 (i.e. 20 μl plasma and 500 μl incubation buffer), then vortex mix.
4 Aliquot and freeze calibrators and control plasma and store at -80°C.
5 Add 100 μl of each sample dilution into the appropriate well, cover with fi lm, and incubate for 45 minutes at room temperature (20–25°C). Perform all tests in duplicate.
6 Prepare washing buffer. Dilute 1 part washing buffer concentrate with 9 parts distilled water and mix well. Prior to dilution, any crystalline precipitates present can be dissolved by incubating at 37°C for 10 minutes.
7 After 45 minutes, wash three times with 200 μl diluted wash buffer per well, followed by inversion and gentle tapping onto absorbent paper.
8 Prepare the conjugate working solution by diluting 1 part conjugate with 50 parts incubation buffer. Make up just before use, as it is stable for only60 minutes. For 8 wells, mix 20 μl conjugate with 1000 μl buffer.
9 Add 100 μl conjugate working solution to each well, cover, and incubate at room temperature for 45 minutes.
10 Wash three times with 200 μl wash buffer as before, followed by inversion and gentle tapping onto absorbent paper.
11 Add 100 μl substrate solution to each well, cover with fi lm, and incubate for 15 minutes at room temperature.
12 Add 100 μl stop solution to each well.
13 Shake for 10 seconds. Using a suitable microtitre plate reader, measure the optical densities (OD) within 10 minutes at 450 nm.
14 Plot (manually or with statistics package) concentration VWF:CB (x axis) against OD (y axis) using linear-linear point to point.
Normal range: 0.49−1.32 IU/ml

DIAGNOSIS OF HEMOPHILIA AND OTHER BLEEDING DISORDERS92
FURTHER READING
Favaloro EJ. An update on the VWF collagen binding assay: 21 years of age and beyond adolescence but not yet a mature adult. Semin Thromb Hemost 2007; 33:727–44.
Laffan M, Brown SA, Collins PW, Cumming AM, Hill FG, Keeling D, Peake IR, Pasi KJ. The diagnosis of VWD: A guideline from the United Kingdom Haemophilia Centre Doctors’ Organisation. Haemophilia 2004; 10:199–217.

FACTOR VIII BINDING ASSAY FOR DIAGNOSIS OF VON WILLEBRAND DISEASE NORMANDY 93
PRINCIPLE
Type 2 VWD is a qualitative form of VWD affecting VWF protein function. Type 2 Normandy (2N) is characterized by abnormally low FVIII:C levels caused by a reduced affi nity of VWF for FVIII. As a consequence, less FVIII is bound and therefore less is protected from degradation/removal, leading to a lower concentration in plasma. Mutations responsible for type 2N VWD are found in the FVIII binding domain of VWF. Phenotypically, patients with type 2N VWD resemble patients with mild hemophilia — reduced FVIII:C, often with normal levels of VWF:RCo and VWF:Ag — but have an autosomal recessive pattern of inheritance.
The FVIII binding assay is an ELISA-based method to determine whether VWF binds FVIII normally. A monoclonal antibody is used to capture VWF, calcium chloride is used to remove endogenous FVIII from VWF, and a known amount of recombinant FVIII is added to the bound VWF and left to bind. The bound FVIII is then measured by a chromogenic FVIII assay. A method for FVIII binding based on a published technique (Nesbitt et al. 1996) is described below.
Data obtained using a recently developed commercial assay (Asserachrom VWF:FVIIIB, Diagnostica Stago) have been published in abstract form (Caron et al. 2009). This assay is similar to the one described below in the initial analytical steps. It utilizes microtitre wells coated with rabbit anti-VWF antibody, which bind VWF/FVIII from diluted patient plasma. After removal of endogenous (patient) FVIII, recombinant FVIII is added, which binds to the patient VWF depending on the nature of the patient VWF molecule. This assay differs from the one described below in relation to the method of detection of bound FVIII: in this commercial assay, a peroxidase conjugated mouse anti-human FVIII antibody is used. The assay was reported to have 100% sensitivity and specifi city based on analysis of 37 previously diagnosed cases of type 2N VWD and 13 heterozygous mutation carriers (Caron et al. 2009), with an inter-assay coeffi cient of variation of <10% for measurements of % binding of FVIII.
REAGENTS
MAS 533p monoclonal antibody to the GPIb binding site of VWF (Oxford Biotechnology OBT0085, Oxford U.K.)
32Factor VIII Binding Assay for Diagnosis of von Willebrand Disease Normandy

DIAGNOSIS OF HEMOPHILIA AND OTHER BLEEDING DISORDERS94
Store at 4°C, per manufacturer’s instructions. Note that other antibodies from different sources can be successfully used.
y FVIII concentrate 2.5 U/ml (e.g. Advate, Baxter Pharmaceutical) Store at -80°C.
Concentrate is diluted in HEPES buffer made from: y 2.763 g/l HEPES acid y 2.188 g/l HEPES salt y 8.19 g/l NaCl y Add 1% BSA y Made up in 100 ml, pH to 7.35
y Coatest FVIII chromogenic kit (Instrumentation Laboratory, Lexington, MA, U.S.A.) One kit is sufficient for two plates. Make up kit and freeze remaining reagents at -80°C.
y 20% acetic acid
y Quality control samples Include a normal control and, if available, a known VWD Normandy control.
BUFFERSThese buffers can be colour-coded with food dye, which makes them easier to see in the microtitre plate. Make up fresh buffers for each assay.
y Citrate phosphate buffer 0.1M pH 5.0 For 0.5 litre:
y 3.65 g citric acid (BDH 10081) y 4.74 g anhydrous disodium hydrogen phosphate (BDH 102494C)
y 10xTris buffered saline (TBS): 50mM Tris, 100mM NaCl, pH 8.0 For 0.5 litre:
y 30.27 g Tris (Sigma) y 29.22 g NaCl (Sigma)
Needs about 60 ml 1M HCL to pH.
y Wash buffer: TBS/0.1% BSA For 1 litre:
y 100 ml 10 × TBS y 900 ml H2O y 1 g bovine albumin (Sigma)
y Plasma diluent: TBS/3% BSA For 100 ml:
y 10 ml 10 × TBS y 90 ml H2O y 3 g bovine albumin (Sigma)

FACTOR VIII BINDING ASSAY FOR DIAGNOSIS OF VON WILLEBRAND DISEASE NORMANDY 95
Calcium chloride solution 0.35MFor 50 ml:
17.5 ml 1M calcium chloride solution 32.5 ml H2O
FVIII diluentFor 100 ml:
100 ml wash buffer 0.147 g calcium chloride 0.002 ml Tween 20 (Sigma P5927): dip yellow tip into Tween and let
1 drop fall into the buffer.
METHOD
This assay takes three consecutive days. Ensure VWF:Ag results are available for each test patient prior to starting this assay.
Day 1 (p.m.)
1 Dilute MAS 533p monoclonal antibody (Oxford Biotechnology) in 0.1M citrate buffer pH 5.0 to a concentration of 2.5 µg/ml (exactly 50 µl antibody in 10 ml buffer).
2 Coat NUNC microtitre plate using 100 µl of the antibody/buffer mix and leave overnight at 4˚C covered in parafi lm. There is only enough to coat 11 rows, so leave row 12 uncoated.
Day 2 (p.m.)
3 Wash four times with TBS (50mM Tris, 100mM NaCl, pH 8.0) containing 0.1% BSA, and blot excess liquid.
4 Add 100 µl of serial dilutions of plasma (~1 U/dl VWF:Ag- 0.125 U/dl VWF:Ag) in TBS/ 3% BSA and incubate at 4˚C overnight in a wet box. See “Dilution Protocol” below, and Figure 32.1 for plate layout.
Dilution protocol
Four dilutions of each test plasma are produced by double dilution. Start with at least 0.6 ml of the fi rst dilution.
Each sample must be diluted to produce 1 U/dl (0.01 U/ml), so VWF:Ag must be known prior to starting this assay. For example, if VWF:Ag is 0.90 IU/ml, make a 1/90 starting dilution; if VWF:Ag is 0.06 IU/ml, make a 1/6 starting dilution, etc.
For patient and control samples, dilute according to level of VWF:Ag to nearest 0.05 U/ml (i.e. VWF:Ag = 0.13 dilute 1/15, etc.).

DIAGNOSIS OF HEMOPHILIA AND OTHER BLEEDING DISORDERS96
Day 3 (start at about 9:30 a.m.)
5 Wash as before.
6 To remove endogenous FVIII, incubate twice with 100 µl 0.35M CaCl2 for one hour each time at room temperature. Discard fi rst CaCl2 before adding second volume. Do not wash in between.
7 Wash as before.
8 Dilute 200 μl FVIII to 10 ml FVIII diluent to produce 0.05 U/ml FVIII. Add 100 μl to each well and incubate for two hours at 37˚C.
9 Wash as before.
10 Use the Coatest SP4FVIII chromogenic kit as follows:
i. Remove from cold room 30 minutes before use to warm up.
ii. Make up reagents according to kit insert: FIXa + FX in 3 ml distilled water, make up 2 vials of each S-2765 in 12 ml distilled water
iii. In a suitable disposable plastic vial, mix: 5 parts FIXa + FX (4.12 ml) (fresh) 1 part phospholipid (0.83 ml) 3 parts 1/10 dilution of kit buffer (250 μl kit buffer and 2.25 ml water)
iv. Add 75 μl of this mixture to each well, then incubate for fi ve minutes at 37˚C.
11 Without discarding the mixture, add 25 µl 0.025M CaCl2 from kit to each well. Incubate for fi ve minutes at 37°C.
12 Add 50 µl S-2765 chromogenic substrate to each well.
13 Leave at 37˚C until colour develops (usually about 20 minutes) and control 1.0 U/dl has an optical density (OD) of 0.8–1.0. Read using the plate reader at 405 nm (fi lter 1).
14 Stop with 50 µl of 20% acetic acid (made from 2 ml glacial acetic acid and 8 ml water).
15 Re-read the absorbance of each sample using the plate reader at 405 nm (fi lter 1).
16 Plot the concentration of VWF antigen against absorbance at 405 nm of bound FVIII. Results should be reported in graph and report format (see “Data Interpretation”, on following page).

FACTOR VIII BINDING ASSAY FOR DIAGNOSIS OF VON WILLEBRAND DISEASE NORMANDY 97
Figure 32.1. Layout of a 96-well microtitre plate
1 2 3 4 5 6 7 8 9 10 11 12
A B1CTL1.0
PT21.0
PT41.0
PT61.0
PT81.0
CTL1.0
PT21.0
PT41.0
PT61.0
PT81.0
B B2CTL0.5
PT20.5
PT40.5
PT60.5
PT80.5
CTL0.5
PT20.5
PT40.5
PT60.5
PT80.5
C B3CTL0.25
PT20.25
PT40.25
PT60.25
PT80.25
CTL0.25
PT20.25
PT40.25
PT60.25
PT80.25
D B4CTL
0.125PT2
0.125PT4
0.125PT6
0.125PT8
0.125CTL
0.125PT2
0.125PT4
0.125PT6
0.125PT8
0.125
E B5PT11.0
PT31.0
PT51.0
PT71.0
N1.0
PT11.0
PT31.0
PT51.0
PT71.0
N1.0
F B6PT10.5
PT30.5
PT50.5
PT70.5
N0.5
PT10.5
PT30.5
PT50.5
PT70.5
N0.5
G B7PT10.25
PT30.25
PT50.25
PT70.25
N0.25
PT10.25
PT30.25
PT50.25
PT70.25
N0.25
H B8PT1
0.125PT3
0.125PT5
0.125PT7
0.125N
0.125PT1
0.125PT3
0.125PT5
0.125PT7
0.125N
0.125
B = blankCTL = control plasmaPT = test samplesN = known VWD Normandy control (if available)
Test eight patients on a single plate.
DATA INTERPRETATION
1 Calculate mean OD of each patient, control, and negative control.
2 In Excel, start a new worksheet and enter the following data:
Column A — in A1: VWF:Ag U/dl; in A2: 1.0; in A3: 0.5; in A4: 0.25; in A5: 0.125
Column B — in B1: Patient name; B2-5: mean ODs for the four patient dilutions
Column C — in C1: Normal control; C2-5: mean ODs for the four control dilutions
Column D — in D1: Normandy control; D2-5: mean ODs for the four RD dilutions

DIAGNOSIS OF HEMOPHILIA AND OTHER BLEEDING DISORDERS98
3 Choose ‘Chart wizard XY scatter’ with smoothed lines. Select all four columns and ODs, and ensure the series is in columns.
4 On the resulting graph, the x axis should be labelled VWF:Ag U/dl. Label the y axis FVIII binding 405 nm. Embed the graph as an object in sheet 1.
5 Add a linear trend line to the normal control and patient lines, then choose “display equation” on the chart. This will show a formula for each line similar to y = 0…..x + 0…..y. Use the 0…x part to calculate the ratio of patient gradient/control gradient.
REFERENCES
Caron C, Ternisien C, Wolf M, Fressinaud E, Goudemand J, Veyradier A. An accurate and routinely adapted ELISA for Type 2N von Willebrand disease diagnosis. Abstracts of Congress of International Society for Haemostasis and Thrombosis, Boston, 2009.
Nesbitt IM, Goodeve AC, Guilliatt AM, Makris M, Preston FE, Peake IR. Characterisation of type 2N von Willebrand disease using phenotypic and molecular techniques. Thromb Haemost 1996; 75:959–64.

VWF MULTIMER ANALYSIS 99
33VWF Multimer Analysis
PRINCIPLE
The principle of the multimer analysis is the electrophoretic separation of VWF multimers on SDS agarose gels based on their molecular weight, followed by non-radioactive visualization using an alkaline phosphatase conjugated antibody system. In the Enayat method, three concentrations of separating gels are produced in the range of 1% to 1.8% agarose (typically 1.2%, 1.4%, and 1.8%) in order to identify the full range of VWF multimers (at 1%), as well as the individual triplet structure of each multimer (at 1.8%).
This method is derived from Enayat (1983) and Ruggeri (1981).
Figure 33.1. VWF multimer analysis work schedule
DAY/ TIME
Monday/ Tuesday
Tuesday/ Wednesday
Wednesday/ Thursday
Thursday/Friday
8 a.m. Prepare buffers, except running gel buffer, the day before testing.
Observe the marker dye. Stop when reaches the wick. May need to increase current.
9 a.m. Rinse gels in H2O.
Rinse gel in H2O. Rinse gel in TBS/Tween face up 8 times by end of day.
Rinse gel in H2O. Rinse gel in TBS/Tween face up 8 times by 3 p.m.
10 a.m. Prepare running gel buffer; add agarose.
Dry gels using cool hairdryer.*
11 a.m.
11:30 a.m.
Construct the plates; microwave the running gel buffer.
Allow to cool to 65°C–60°C before pouring.
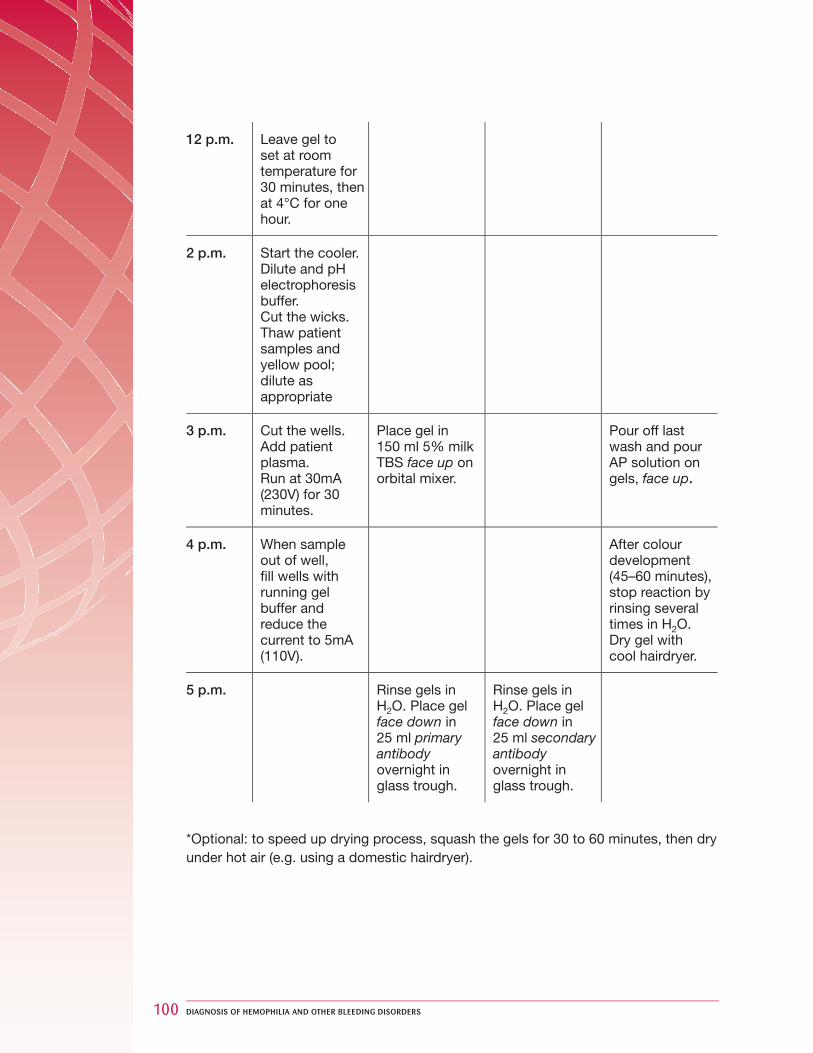
DIAGNOSIS OF HEMOPHILIA AND OTHER BLEEDING DISORDERS100
12 p.m. Leave gel to set at room temperature for 30 minutes, then at 4°C for one hour.
2 p.m. Start the cooler.Dilute and pH electrophoresis buffer.Cut the wicks.Thaw patient samples and yellow pool; dilute as appropriate
3 p.m. Cut the wells.Add patient plasma.Run at 30mA (230V) for 30 minutes.
Place gel in 150 ml 5% milk TBS face up on orbital mixer.
Pour off last wash and pour AP solution on gels, face up.
4 p.m. When sample out of well, � ll wells with running gel buffer and reduce the current to 5mA (110V).
After colour development (45–60 minutes), stop reaction by rinsing several times in H2O. Dry gel with cool hairdryer.
5 p.m. Rinse gels in H2O. Place gel face down in 25 ml primary antibody overnight in glass trough.
Rinse gels in H2O. Place gel face down in 25 ml secondary antibody overnight in glass trough.
*Optional: to speed up drying process, squash the gels for 30 to 60 minutes, then dry under hot air (e.g. using a domestic hairdryer).

VWF MULTIMER ANALYSIS 101
REAGENTS
Make up all buffers freshly for each assay. All reagents are made up with distilled water and are pH-adjusted.
Running gel buffer: 0.4M TRIS, 0.1% SDS, pH 8.8 4.54 g Tris base (SIGMA T1503) 0.1 g SDS (sodium dodecyl sulphate) (BDH 436696N) 100 ml distilled H2O
In a 100 ml conical fl ask, swirl together: 100 ml running gel buffer 1.6 g Seakem HGT (P) agarose (Seakem 50050) for normal gels OR 1.8 g agarose for triplet distinction OR 1.0 g agarose for high molecular weight (HMW) multimers
Use 1.6% for HMW multimers, and 1.8% for triplet distinction.
Note: A low 1.2% agarose shows HMW multimers only; a high 1.8% agarose shows both low molecular weight (LMW) and HMW multimers.
This volume is suffi cient for 2 gels.
Electrode buffer: pH to 8.35
10x concentrated 15.15 g Tris Base 72.1 g glycine 5 g SDS 500 ml distilled H2O
WorkingAdd 200 ml 10x concentrated buffer to 1800 ml distilled H2O; pH to 8.35
Sample buffer: 10mM Tris, 1mM EDTA, pH 8.0
10x concentrated stock solution 1.21 g Tris/trizma base (SIGMA T1503) 0.07 g EDTA disodium salt (BDH 10093)
Make up to 100 ml with distilled H2O.
WorkingDilute 10x concentrated sample buffer 1:10 in 100 ml distilled H2O to give a working solution, then add:
4.8 g urea (BDH 102904W) 0.2 g SDS (Sodium dodecyl sulphate) (BDH 436696N) pH to 8.0.
Stock Tris buffered saline (TBS): 50mM Tris, 150mM NaCl, pH 7.4 12.1 g Tris base 18 g NaCl 2 l distilled H2O
DIAGNOSIS OF HEMOPHILIA AND OTHER BLEEDING DISORDERS102
Blocking buffer 20 g of 5% unfatted milk powder 133 ml TBS Stock
Washing buffer 500 µl Tween 20 1 l TBS stock
Primary antibodyRabbit anti-human VWF polyclonal antibody (VWF:Ag coat ab; for example Dako A0082)
Secondary antibodySwine anti-rabbit alkaline phosphatase conjugated antibody (for example, Dako D0306)
Alkaline phosphatase conjugate kit (Biorad 170-6432)
Gel bond gel support (Biowhittaker Molecular Applications 53750)
METHOD
Day 1: Preparation of the gel and electrophoresis
1 Microwave the agarose and running gel buffer until clear, then allow to set. Re-melt when ready to pour, allowing to cool to 65°C before pouring (with foil on top to avoid evaporation).
2 Pour the gel into a “sandwich” built using two glass plates (200 × 120 mm) and a U-shaped spacer (15 mm wide) positioned at the top of the plate as described below.
3 Cut a piece of gel-bond fi lm to size using the gel spacer as a guide. Wet one glass plate and lay the gel bond on top with the side next to the paper (hydrophilic side) on top. Use the roller to remove any air bubbles. Place the spacer on top, then place the second glass plate on top and hold with bulldog clips around the side and bottom. Ensure that the apparatus is level before pouring gel.
4 While the agarose gel solution is cooling to 60°C–65°C, warm the gel-pouring equipment by running it under hot water or with a hair dryer.
5 Pour the agarose into a warmed syringe and squirt it into the pouring equipment using a short piece of tubing from a butterfl y needle.
6 Reserve a small amount of agarose gel in a test tube to fi ll in wells later.
VWF MULTIMER ANALYSIS 103
7 Allow the gel to set at room temperature for at least 30 minutes, then at 4°C in a wet box for an hour. Store in a wet box if not for immediate use, but seal open edges with parafi lm to prevent drying out (the gel can be stored overnight if necessary).
8 Set the electrophoresis tank to cool to 14°C and prepare 2 l of diluted 10% electrophoresis buffer (pH after dilution). Place 1 l buffer into each side of the tank.
9 When the gel has set, use the template to cut 11 wells in the top. Moisten the electrophoresis plate with distilled water and position the gel in the centre of the white/blue cooling plate in the tank, with the samples wells to the far side (cathode).
10 Measure a 10–15 cm long piece of fi lter paper (WHATMAN 3030690), fold, and repeat twice more. Bend in a sharp crease and tear off (this usually gives a neater line than cutting) so that you have three to fi ve layers in total for each side. Measure width against the gel sizer and cut to exact width. Wet the fi lter paper with electrophoresis buffer, then place each fi lter paper wick over each end of the gel, overlapping by about 5 mm.
11 Dilute the patient samples and yellow pool as a control. Make 1/10 dilution in working sample buffer for a plasma with VWF:Ag of about 1.0 IU/ml, but use 1/2 if a very low result is expected. Undiluted plasma is not recommended. (Platelet VWF is usually diluted to 1/2.)
12 Wash gel pouring equipment thoroughly in hot water after use.
13 Add 20 μl of diluted sample, then 1 μl of 1% bromophenol blue to each well. Yellow pool (normal control) is run in lanes 1, 6, and 11.
14 Set the lid of the electrophoresis tank in place and switch on the power pack, checking that the red wire is attached to the red connection and black to black. Allow the samples to leave the wells by running at maximum current for 30 to 60 minutes. Note the electrophoresis conditions on the assay sheet.
15 Switch off current and fi ll the wells with spare agarose gel.
16 Electrophorese at a constant current of 5 mA for about 20 hours (approx. 80 V). If the voltage is too high, the resistance of the wicks needs to be adjusted (Ohm’s Law), so add a wick to the cathode end until voltage is acceptable.

DIAGNOSIS OF HEMOPHILIA AND OTHER BLEEDING DISORDERS104
Day 2: Preparation of the gel for visualization
17 By the next morning, the bromophenol blue marker will have migrated towards the aniodic side of the gel.
18 When the blue marker is approximately 1 cm from the end of the gel, record the electrophoresis parameters, and stop the electrophoresis. Remove the gel from the electrophoresis equipment.
19 Discard any previous buffer, wash tank out well with water, and carefully wipe orange dividers along the metal wire.
20 Place the gel face-up into a plastic trough fi lled with distilled water and gently wash for one to two hours on an orbital mixer or seesaw rocker. Change the water several times over the washing period.
21 Carefully remove the gels and drain any excess water onto tissue.
22 Either dry fl at using the hairdryer on a medium heat with the gel anchored at each end, or squash for one to two hours between fi lter paper and paper towels on the glass levelling table with several heavy books on top, followed by drying with the hairdryer on a medium heat, as before. Drying may take over an hour per gel.
23 When the gels are completely dry (they will appear shiny and fl at dried onto the gel bond), remove the excess gel bond, but leave at least 5 mm around the edge of the gel.
24 Place the gel face-up into a plastic trough containing TBS + 5% unfatted milk (Marvel) and incubate for at least 90 minutes (the longer the better) on a slow speed on the Stuart rocker.
25 Rinse the gel several times with distilled water.
26 Prepare a 1 in 2000 dilution of primary anti-VWF (coat) antibody in TBS. Use 12.5 µl antibody in 25 ml TBS. Place the diluted antibody into the primary antibody pyrex dish.
27 Blot excess water from the gel and place gel-side down into the diluted antibody. Ensure there are no air bubbles between the gel and the diluted antibody.
28 Place the lid onto the box and incubate overnight on the bench at room temperature.

VWF MULTIMER ANALYSIS 105
Day 3
29 Remove the gel from the primary antibody solution and rinse briefl y in several changes of distilled water.
30 Place the gel face up in a plastic trough. Wash with at least eight changes of TBS-0.05% Tween (100 ml–150 ml/wash) throughout the day while shaking on the orbital mixer.
31 Prepare a 1 in 2000 dilution of secondary conjugated swine anti-VWF antibody in TBS. Use 12.5 µl antibody in 25 ml TBS. Place the diluted antibody into the secondary antibody pyrex dish.
32 Rinse the gel with distilled water, blot excess water from the gel, and place it gel-side down in the secondary antibody solution. Ensure there are no air bubbles between the gel and diluted antibody.
33 Place the lid onto the box and incubate overnight on the bench at room temperature.
Day 4: Visualization of the multimers
34 Remove the gel from the secondary antibody solution and rinse briefl y in several changes of distilled water.
35 Place the gel face up in a plastic trough. Wash with at least eight changes of TBS-0.05% Tween (100 ml–150 ml/wash) throughout the day while shaking on the orbital mixer.
36 During the last wash (at around 3 p.m.), prepare 20 ml of working substrate plasma from the 25 x Alkaline Phosphatase colour development buffer kit H102). For each gel, dilute 800 µl 25 x AP buffer in 20 ml water. Then add 200 µl solution A and 200 µl solution B to the buffer and mix thoroughly.
37 Remove the gel from the last wash and drain any excess liquid.
38 Place the gel face up into the developing pyrex dish and pour the prepared substrate mix over the gel.
39 Rock gently on the rocker until the reaction is complete and the multimer bands are revealed. This can take up to 45 minutes.
40 When the reaction is complete, discard the substrate and wash the gel in at least two changes of distilled water with shaking for 30 to 60 minutes to stop the reaction proceeding further.
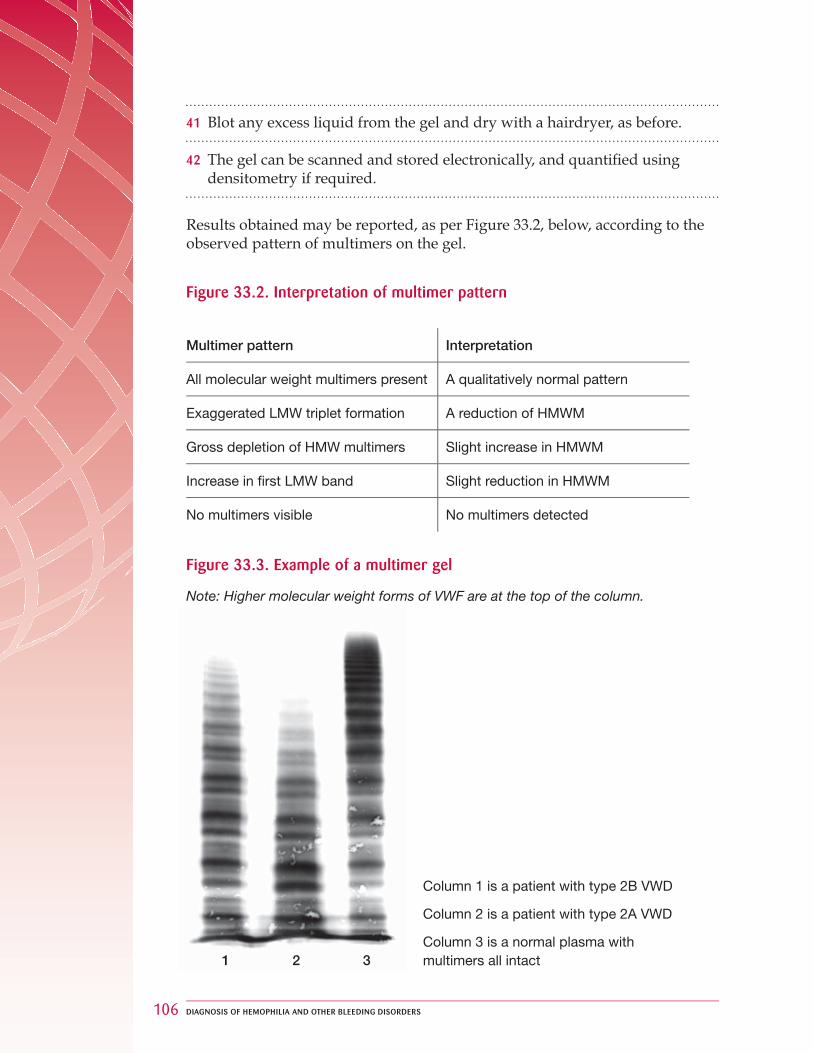
DIAGNOSIS OF HEMOPHILIA AND OTHER BLEEDING DISORDERS106
41 Blot any excess liquid from the gel and dry with a hairdryer, as before.
42 The gel can be scanned and stored electronically, and quantifi ed using densitometry if required.
Results obtained may be reported, as per Figure 33.2, below, according to the observed pattern of multimers on the gel.
Figure 33.2. Interpretation of multimer pattern
Multimer pattern Interpretation
All molecular weight multimers present A qualitatively normal pattern
Exaggerated LMW triplet formation A reduction of HMWM
Gross depletion of HMW multimers Slight increase in HMWM
Increase in � rst LMW band Slight reduction in HMWM
No multimers visible No multimers detected
Figure 33.3. Example of a multimer gel
1 2 3
Note: Higher molecular weight forms of VWF are at the top of the column.
Column 1 is a patient with type 2B VWD
Column 2 is a patient with type 2A VWD
Column 3 is a normal plasma with multimers all intact

VWF MULTIMER ANALYSIS 107
REFERENCES
Enayat MS, Hill FG. Analysis of the complexity of the multimeric structure of FVIII related antigen/von Willebrand protein using a modifi ed electrophoretic technique. J Clin Pathol 1983; 36:915–9.
Ruggeri ZM, Zimmerman TS. Classifi cation of variant VWD subtypes by analysis of functional characteristics and multimeric composition of FVIII/von Willebrand factor. Ann N Y Acad Sci 1981; 370:205–9.
DIAGNOSIS OF HEMOPHILIA AND OTHER BLEEDING DISORDERS108
34 Quantitative Measurement of FVIII Inhibitors
PRINCIPLE
FVIII inhibitors resulting from treatment of people with hemophilia with FVIII therapy are time-dependent.
If FVIII is added to plasma containing an inhibitor and the mixture incubated, the FVIII will be progressively neutralized. If the amount of FVIII and the incubation period are standardized, the strength of the inhibitor may be defi ned in units according to how much of the added FVIII is neutralized.
The assay can be performed using human or porcine FVIII.
The presence of an inhibitor might be suspected from a reduced half-life and recovery of FVIII.
BETHESDA ASSAY
The source of FVIII is a pooled normal plasma for anti-human titres; porcine concentrate diluted in FVIII-defi cient plasma for anti-porcine titres.
A Bethesda unit is defi ned as the amount of inhibitor that will neutralize 50% of one unit of added FVIII in two hours at 37°C.
Patients not expected to have an inhibitor:
1. Add equal parts (0.2 ml) patient plasma to pooled normal plasma.
2. For a control, add 0.2 ml 0% FVIII:C to 0.2 ml pooled normal plasma.
3. Incubate at 37°C for two hours. Then perform FVIII:C assay.
Patients expected to have an inhibitor:
1. Prepare dilutions using FVIII assay buffer of the patient’s plasma. It is preferable to put up too many dilutions than too few. They can always be kept on ice after the two-hour incubation for a second run of assays. If previous information in relation to the expected inhibitor titre is available, dilutions for testing should span either side of this.
2. A standardized amount of FVIII in the form of a normal plasma pool is added to each dilution of test plasma — this will normally contain around 100 U/dl. Thus, each incubation mix has a starting concentration of approximately 50 U/dl. The precise concentration is not important, because the same source is added to all incubation mixtures.

QUANTITATIVE MEASUREMENT OF FVIII INHIBITORS 109
3. In the assay of FVIII carried out after the two-hour incubation, the control mix of normal plasma and FVIII-defi cient plasma is used as the standard reference, and the FVIII concentration of other mixtures is calculated against this. This material is used as the 100% reference in the assay.
It is important to buffer the normal plasma, either by the addition of 0.1M imidazole pH 7.4 in the recently described Nijmegen modifi cation, or by use of the buffered pooled normal plasma described in Section 7. This improves the sensitivity and specifi city of the assay. For anti-porcine titres, porcine plasma is not readily available. Therefore, it is acceptable to use porcine concentrate diluted to 1 U/ml in FVIII-defi cient plasma.
4. At the end of the incubation period, the residual FVIII level is measured and the inhibitor calculated from a graph of residual FVIII vs. inhibitor units. (See Figure 34.1, on page 112.)
REAGENTS/EQUIPMENT
Glyoxaline buffer (see Section 9)
Owren’s buffered saline (see Section 9)
Normal plasma pool (see Section 7)Note: This must be buffered to improve the stability of FVIII during the two-hour incubation during the assay.
Porcine concentrate
FVIII-defi cient plasma
APTT reagent
Ice bath
Plastic tubes (75 × 12 mm)
METHOD
Human anti-FVIII
1 Prepare doubling dilutions of test plasma in plastic tubes in 0.2 ml volumes, using glyoxaline buffer as diluent. The dilutions required for each patient will vary. A suggested starting point would be from undiluted, 1/2, 1/4, etc.
Note: If the patient has had an inhibitor assay performed previously, the level may provide a rough guide as to which dilutions should be used. It is also useful to note if they have received any treatment with FVIII recently, as this may have either increased or reduced the inhibitor level.
DIAGNOSIS OF HEMOPHILIA AND OTHER BLEEDING DISORDERS110
2 Pipette 0.2 ml FVIII-defi cient plasma into another plastic tube. This will serve as the standard.
3 Add 0.2 ml normal plasma pool to both the standard tube and the test plasma dilutions. The FVIII level of all tubes will be approximately 50 U/ml. This is considered to be 100% in the FVIII assay at the end of the incubation.
4 Cap, mix, and incubate all tubes at 37°C for two hours.
5 At two hours, transfer all tubes to an ice bath unless the FVIII assay is performed immediately.
6 Perform a FVIII assay on all incubation mixtures by the usual FVIII assay method, but using the tube set up as standard as 100%. Suitable dilutions to use for the FVIII assays would be 1/5, 1/10, 1/20.
7 Read off the residual FVIII of each test mixture, using the control as 100%.
RESULTS/INTERPRETATION
The dilution of test plasma that gives a residual FVIII nearest to 50% but within the range 30%–60% is chosen for calculation of the inhibitor. Alternatively, calculate the result from each dilution and take the average. Any residual FVIII of <25% or >75% should not be used for calculations of inhibitor level.
A plot may be made of % residual FVIII versus inhibitor units on log-log paper from the defi nition of the inhibitor unit (see Figure 34.1).
Read off inhibitor level corresponding to residual FVIII for each test mixture and correct for dilution. For example:
1/4 dilution + normal pool Residual FVIII = 50%Inhibitor unit (from graph) = 1 BUMultiply by dilution factor (1/4) = 4 BU
NOTES
Quantitative inhibitor assays are most frequently performed on test plasmas from patients with severe hemophilia, therefore containing little or no measurable factor VIII:C. If the test plasma contains more than 5 U/dl FVIII, this must be taken into account during the calculation of inhibitor titre.

QUANTITATIVE MEASUREMENT OF FVIII INHIBITORS 111
This can be done in three ways:
The fi rst is to add more factor to the control mixture than to the test mixture to compensate for the FVIII in test mixture. For example, if the test plasma contains 20 U/dl FVIII, the control mixture is made from 120 µl normal plasma and 80 µl 0% FVIII. (Both test and control mixtures then contain approximately 60 U/dl FVIII at the start of the incubation phase.) This approach can only be used if patient plasma is tested undiluted, and not after the dilution, which would alter the initial FVIII concentrations.
Alternatively, the initial FVIII level in the test plasma can be taken into account during the calculation. In this case, the assay mixtures are constructed in the normal way.
Another option is to heat the test plasma at 58°C for 90 minutes prior to analysis, which will destroy all the clotting factors, including FVIII. Since immunoglobulins are heat resistant, the inhibitor titre will be unaffected by this treatment.
The FVIII-defi cient plasma used in the construction of the control mixture is important. This should contain normal levels of VWF, since it has been shown that inhibitor titres are 30%–50% lower if the FVIII-defi cient plasma does not contain VWF (Verbruggen et al. 2001).
Example 1: Patient with 20 U/dl FVIII
Control pooled normal plasma + 0% FVIII
a. Pooled normal plasma + test plasma undiluted – initial FVIII = 120%b. Pooled normal plasma + test plasma diluted 1 in 2 – initial FVIII = 110%
After two-hour incubation, factor assays are performed.
a. Pooled normal plasma + test plasma undiluted – FVIII = 120% of controlResidual FVIII: 120/120 = 100%; inhibitor result: negative
b. Pooled normal plasma + test plasma diluted 1 in 2 – FVIII = 110% of controlResidual FVIII: 110/110 = 100%; inhibitor result: negative
Example 2: Patient with 20 U/dl FVIII (and inhibitor present)
Patient plasma tested undiluted
Pooled normal plasma + test plasma undiluted – initial FVIII = 120% of control
After two-hour incubation, FVIII assays are performed.
Pooled normal plasma + test plasma undiluted – FVIII = 90% of controlResidual FVIII = 90/120 = 75%

DIAGNOSIS OF HEMOPHILIA AND OTHER BLEEDING DISORDERS112
Porcine Anti-FVIIII
The method for porcine FVIII inhibitors is essentially the same as for human inhibitors, except in the source of FVIII. This should be of porcine origin, but to date a reliable source of plasma porcine FVIII is not widely available. Therefore, porcine concentrate diluted in hemophilic plasma (human) to a concentration of 1 U/ml is used.
Note: If the residual FVIII is between 80% and 100% for a sample that was incubated undiluted with the porcine concentrate, it is interpreted as no inhibitor being present. Although plasma-derived porcine FVIII is not currently in use, a recombinant porcine FVIII concentrate is under development at the time of writing.
Figure 34.1. Relationship between residual FVIII and inhibitor titre
REFERENCES
Kasper C, Aledort L, Counts R, Edron J, Fratantoni J, Green D, Hampton J, Hilgartner M, Laserson J, Levine P, MacMillan C, Pool J, Shapiro S, Shulman N, Eys J. A more uniform measurement of factor VIII inhibitors. Thromb Diath Haemorrh 1975; 34:869–872.
Verbruggen B, Giles A, Samis J, Verbeek K, Meninsk E, Novakova I. The type of FVIII defi cient plasma used infl uences the performance of the Nijmegen modifi cation of the Bethesda assays for factor VIII inhibitors. Thromb Hameost 2001; 86:1435–1439.
Verbruggen B, Novakova I, Wessels H, Boezeman J, van den Berg M, Mauser-Bunschoten E. The Nijmegen modifi cation of the Bethesda Assay for factor VIII:C inhibitors: Improved specifi city and reliability. Thromb Haemost 1995; 73:247–251. (for the Nijmegen modifi cation)
100% Residual = No inhibitor
50% Residual FVIII = 1.0 BU/ml
50%
RE
SID
UA
L FV
III A
CTI
VIT
Y (%
)
100
40
50
60708090
30
20
10
50 1.0 1.5 2.0 2.5
BETHESDA UNITS /ml

FACTOR IX INHIBITOR ASSAY 113
PRINCIPLE
Inhibitors to FIX show different kinetics to FVIII:C inhibitors, in that the antigen/antibody reaction reaches completion quicker. The assay is based on incubation of patient plasma with equal parts of a source of FIX for 10 minutes at 37°C, followed by a FIX assay.
One unit of inhibitor is defi ned as that which destroys 50% of the FIX activity over 10 minutes at 37ºC.
REAGENTS
As for FIX assay (see Section 23).
Pooled normal plasma as source of FIX (same pooled plasma as for FVIII inhibitor assay).
METHOD
If the presence of an inhibitor is suspected, use suitable dilutions of patient plasma. Otherwise, undiluted plasma should be used for an inhibitor screen.
1 Using 75 × 12 mm plastic tubes:
Test: Add 0.2 ml patient plasma (or dilution) to 0.2 ml pooled normal plasma.
Control: Add 0.2 ml 0% FIX to 0.2 ml pooled normal plasma.
2 Control: After 10 minutes, perform FIX assay using control mixture as reference (as in FVIII inhibitor assay).
CALCULATION
Work out result as a percentage residual of control. The inhibitor units are worked out in the same manner as the FVIII:C inhibitor in the Bethesda technique described in Section 34.
35Factor IX Inhibitor Assay

DIAGNOSIS OF HEMOPHILIA AND OTHER BLEEDING DISORDERS114
36 Factor XIII Activity Assay
PRINCIPLE
Fibrinogen is coated on the surface of a microtitre plate. Non-specifi c binding is prevented by a special blocking agent. FXIII in the sample is activated by thrombin and calcium ions. In the incorporation step, FXIIIa in the test plasma incorporates the substrate (5-biotinamidopentylamin) BAPA into FXIII substrate fi brinogen coated on the plate in the presence of calcium. The amount of incorporated BAPA is proportional to the FXIII activity of the test sample. In the next step, a conjugate Strept-AP (streptavidine-alkaline phosphatase) is bound to the incorporated BAPA. Alkaline phosphatase converts the synthetic substrate pNPP (p-nitro phenyl phosphate) into phosphate and p-nitrophenol, which can be measured at 405 nm.
The reagents for the method described below are commercially available in kit form (Pefakit FXIII incorporation assay, Pentapharm Switzerland). Note that other activity assays are available from other manufacturers, including the Berichrom kit (Dade Behring, Marburg, Germany), which employ different principles of analysis.
REAGENTS
All the required reagents are contained in the commercial kit.
METHOD
Day 1
1 Allow kit components to come up to room temperature for 30 minutes.
2 Reconstitute coating reagent (R2) in distilled water, according to the volume recommended by the manufacturer.
3 Add 100 μl coating reagent per well to empty wells of the microtitre plate strips.
4 Freeze any excess coating reagent for subsequent use. It remains stable for six months at -20°C.
5 Seal strips with provided plastic seal and incubate overnight (14 to 16 hours) at temperatures of 20°C–25°C.

FACTOR XIII ACTIVITY ASSAY 115
Day 2
6 Dilute 20 × concentrated TBS R1 (Tris buffered saline) 50 ml in 950 ml distilled water or lesser volume, if required.
7 Dilute 3 ml of blocking reagent R3 with 27 ml diluted TBS R1. Freeze excess R3.
8 Discard coating reagent from microtitre plate, invert the strip, and tap on tissue to remove residue.
9 Add 300 μl diluted blocking reagent to each well.
10 Incubate for 1 to 1.5 hours at 37°C in an incubator.
11 Reconstitute calibrator R10 in 0.5 ml distilled water and the three controls, R11, R12, and R13, in 0.2 ml distilled water.
12 Thaw any frozen test plasmas at 37°C for fi ve minutes prior to analysis.
13 Prepare a container with a few hundred ml of ice/water mixture as an ice bath.
14 Make dilutions of all test and control plasmas, 10 μl plasma, and 1 ml diluted TBS R1 buffer (1:101 dilution). Vortex mix.
15 Make calibrator dilutions as follows: Cal 1: 30 μl R10 + 970 μl TBS R1 Cal 2: 20 μl R10 + 980 μl TBS R1 Cal 3: 75 μl R10 + 25 μl TBS R1 Cal 4: 25 μl R10 + 75 μl TBS R1 Cal 5: 10 μl R10 + 90 μl TBS R1
Note: Dilutions 1 and 2 are ready to use. Further dilute 10 μl of calibrator dilutions 3-5 in 1 ml TBS R1.
16 Wash plate three times with 300 μl/well TBS R1. Invert and tap on tissue to remove excess liquid.
17 Reconstitute activator reagent part A (R4) and part B (R5) in 5 ml distilled water each. Keep on melting ice/water ice bath for no more than 30 minutes.
18 Add 25 μl each of calibrator, control, or test plasma into appropriate wells. Include a blank of TBS R1.
19 Mix activator reagents part A and B (R4 and R5) to form the fi nal incorporation reagent.
DIAGNOSIS OF HEMOPHILIA AND OTHER BLEEDING DISORDERS116
20 Add 75 μl fi nal incorporation reagent to each well, including blank well.
21 Incubate for 30 minutes at 37°C in incubator.
22 Add 200 μl/well incorporation stopping solution R6. Mix gently for 10 minutes on the plate shaker.
23 Reconstitute detection reagent R7 by adding 12 ml distilled water. Freeze unused diluted R7.
24 Wash plate four times with 300 μl/well TBS. Tap to remove excess liquid.
25 Add 100 μl/well detection reagent R7. Incubate for 15 minutes at 37°C in the incubator.
26 Wash plate four times with 300 μl/well TBS. Tap to remove excess liquid.
27 Make up substrate solution immediately before use: For 96 wells (full plate), add 9 tablets R8b to 22.5 ml diethanolamine
buffer R8a For 64 wells (8 strips), add 6 tablets to 15 ml diethanolamine For 32 wells (4 strips), add 3 tablets to 7.5 ml diethanolamine For 24 wells (3 strips), add 2 tablets to 5 ml diethanolamine
28 Add 180 μl/well of substrate solution. Incubate for 11 minutes at 37°C in the incubator.
29 Add 50 μl/well stopping solution (4M NaOH) R9.
30 Read optical densities within 15 minutes at 405 nm in a microtitre plate reader.
Note: Several kit reagents can be stored deep-frozen for later use, as described above. However, the substrate, activator reagent parts A and B, calibrators, and controls should not be frozen. Partial reagent kits containing these latter materials can be purchased for use with any partially used reagents that have been frozen. This reduces the cost per test if test samples are analysed in small batches.
RESULTS CALCULATION
Calibrator dilutions and control values are supplied with each kit.
Using a suitable data handling software or graph paper, construct a calibration curve by plotting the concentration against the optical density of the calibrator dilutions after subtracting the OD of the blank. Use a linear-linear scale. Subtract the blank OD from the ODs of the test sample/control dilutions, and convert the ODs to FXIII activity, using the calibration curve.
LUPUS ANTICOAGULANT AND ANTI-PHOSPHOLIPID ANTIBODIES 117
INTRODUCTION
It is important for laboratories investigating patients for possible bleeding disorders to be able to identify the presence of antibodies that prolong laboratory tests such as APTT.
One group of antibodies that can cause dramatic prolongation of APTT is the heterogenous group collectively termed anti-phospholipid antibodies (APA), sometimes referred to in the literature as lupus anticoagulants (LAC). It is now clear that so called anti-phospholipid antibodies are a heterogenous family of antibodies that react with epitopes on proteins that are themselves complexed with negatively charged phospholipids. Many such antibodies require beta-2-glycoprotein 1, a protein that binds to phospholipids. Others may be directed against prothrombin.
It is important to note that these antibodies may interfere with coagulation reactions in the laboratory, prolonging phospholipid-dependant tests such as APTT and occasionally PT, but they are not associated with bleeding except in a few rare cases where there is signifi cant acquired prothrombin defi ciency. Paradoxically, these antibodies are clearly associated with venous and arterial thrombosis by mechanisms not well understood.
In centres attempting to diagnose bleeding disorders, it is necessary to be able to detect such antibodies using specifi c tests in the investigation of patients with prolonged APTTs. Several guideline documents and reviews of results using different techniques have been published that review the laboratory detection of lupus anticoagulants (LAC), including those listed in the references at the end of this section.
It is important to recognize that different APTT techniques frequently do not have the sensitivity to detect the presence of such antibodies, and the heterogenous nature of the group has led to recommendations that more than one test can be required to confi rm the presence of lupus-type anticoagulants.
The criteria for presence of lupus anticoagulants are as follows:
1. Prolongation of a phospholipid-dependant coagulation test.2. Evidence of an inhibitor demonstrated by mixing studies.3. Confi rmation of the phospholipid-dependant nature of the inhibitor.4. Lack of specifi c inhibition of one coagulation factor (such as FVIII:C,
FIX:C, or FXI).
37Lupus Anticoagulant and Anti-Phospholipid Antibodies

DIAGNOSIS OF HEMOPHILIA AND OTHER BLEEDING DISORDERS118
SAMPLE PREPARATION
It is important to ensure that the number of residual platelets in the test plasma is kept to a minimum, particularly if plasma is frozen and thawed prior to analysis. One way to remove the maximum number of platelets is to fi lter the centrifuged plasma (prepared as for other clotting tests) through a 0.22-µ fi lter. Alternatively, the plasma can be centrifuged twice, as described in Section 4. The aim is to reduce the platelet count to <10 × 109/l in the plasma under analysis. Since fi ltration may affect other coagulation assays and may be expensive, the preferred option is to remove the platelet-poor plasma from the cells after the fi rst centrifugation (minimum of 1700 g for minimum of 10 minutes) and then centrifuge the secondary container with plasma for a second time under the same conditions. After the second centrifugation, the plasma is carefully removed, leaving the bottom layer undisturbed, since this will contain the majority of the few additional platelets not removed during the fi rst centrifugation. Plasma prepared by double centrifugation in this way will normally have residual platelet counts well below 10 × 109/l and are suitable for deep-freezing prior to analysis for lupus anticoagulant testing. These comments apply to the preparation of control plasmas as well as test plasma.
MIXING STUDIES
Details of mixing studies used to indicate the possible presence of an inhibitor are given in Section 14.
SPECIFIC TESTS TO DETECT LAC AND APA
There are an increasing number of specifi c tests for the presence of lupus anticoagulants including the dilute Russell’s viper venom time (DRVVT) and kaolin clotting time (KCT), which is also termed the Exner test. Other snake venom–based specifi c tests, such as the Textarin time or taipan snake venom time, have been used, as well as the dilute thromboplastin time. Details of these tests are included in the references listed below.
Even when relatively specifi c tests such as DRVVT and others are employed, it is important to confi rm the phospholipid-dependant nature of the inhibitor using confi rmatory tests.
A method is given below for the DRVVT, for which abnormal results are more specifi c than APTT for the presence of anti-phospholipid antibodies.
The recently published ISTH guidelines update (Pengo et al. 2009) recommends that the two phospholipid-dependent tests that should be used are the DRVVT and the APTT, and that where abnormality occurs, the test should be repeated in the presence of excess phospholipid. They point out that use of washed platelets as a source of excess phospholipid in this way can be problematic in view of the lack of standardization and the possibility

LUPUS ANTICOAGULANT AND ANTI-PHOSPHOLIPID ANTIBODIES 119
of batch-to-batch variation between preparations. We include a method for preparation of washed platelets here for centres that may continue to use this approach. The ISTH document does not recommend use of the KCT or the dilute thromboplastin time, or a number of less-well-characterized snake venom based assays.
REFERENCES
Brandt JT, Triplett DA, Alung B, Scharrer I. Criteria for the diagnosis of lupus anticoagulants: update. On behalf of the Subcommittee on Lupus Anticoagulant/Anti-phospholipid Antibody of the Scientifi c and Standardisation Committee of the ISTH. Thromb Haemost 1995; 74:1184–1190.
Lupus Anticoagulant Working Party. Guidelines on testing for the lupus anticoagulant. J Clin Pathol 1991; 44:885–889.
Pengo V, Tripodi A, Reber G, Rand JH, Ortel TL, Galli M, De Groot PG. Update of the guidelines for lupus anticoagulant detection. Thromb Haemost 2009; 7:1737–40.

DIAGNOSIS OF HEMOPHILIA AND OTHER BLEEDING DISORDERS120
PRINCIPLE
Russell’s viper venom (RVV) contains an enzyme that directly activates FX, which then activates prothrombin in the presence of phospholipid, calcium ions, and FV. Dilution of the venom and the phospholipid make the test particularly sensitive to the presence of LAC/APA. A prolonged DRVVT may thus be caused by inhibitors to phospholipids, but may also be caused by defi ciency or abnormality of factors II, V, X, or fi brinogen. If prolonged, compared with a locally determined normal range, the DRVVT is repeated with washed freeze/thaw fractured platelets replacing phospholipids. Correction of the abnormal result, when platelets replace phospholipid, indicates the presence of anti-phospholipid antibodies.
REAGENTS
Imidazole (glyoxaline buffer) - 0.05M pH 7.3 3.4 g imidazole 5.85 g sodium chloride
1. Dissolve in 800 ml distilled water.2. Adjust pH to 7.3 using 1M HCL.3. Make up to 1 litre with distilled water.
Russell’s viper venom (Diagnostic Reagents, Chinnor Road, Thame, U.K.)
1. Add 2 ml distilled water to 0.2 mg venom to give 0.1 mg/ml.2. Freeze at -35°C or lower in 20 µl amounts.3. For use, thaw and dilute approximately 1 in 500 in imidazole buffer
(10 µl in 5 ml) to give dilute RVV (DRVV).
Phospholipid (PL; Diagen Bell and Alton Platelet substitute, Diagnostic Reagents, Chinnor Road, Thame, U.K.)Reconstitute with distilled water according to manufacturer’s instructions.
25mM calcium chloride solution
Washed freeze/thaw lysed plateletsNormal human platelets are washed and lysed by freeze/thaw to expose procoagulant phospholipid. A full method is given at the end of this section (see “Preparation of Washed Platelets for DRVVT” on page 123).
38 Dilute Russell’s Viper Venom Time (DRVVT)

DILUTE RUSSELL’S VIPER VENOM TIME (DRVVT) 121
Pooled normal plasmaThis should be carefully prepared to ensure the minimum number of residual platelets is present, as described under sample preparation, above. It may be convenient to use the pooled normal plasma described in Section 7, provided that the pooled plasma is centrifuged twice prior to deep freezing.
METHOD
1 To a glass test tube at 37°C, add 0.1 ml phospholipid and 0.1 ml of pooled normal plasma.
2 Warm to 37°C for 1–2 minutes.
3 Add 0.1 ml diluted RVV (RVV at room temperature). Mix and leave for exactly 30 seconds at 37°C.
4 Add 0.1 ml pre-warmed 25mM calcium chloride. Mix and start stopwatch.
5 Time clot formation. Perform all tests in duplicate.
The pooled normal plasma should give a clotting time of 30–35 seconds. If <30 seconds, further dilute the RVV solution by adding more imidazole buffer. If >35 seconds, add more stock RVV solution. Repeat test on pooled normal plasma until a time of 30–35 seconds is obtained.
6 Prepare a dilution of 1/8 of PL in saline; for example, by adding 0.1 ml PL to 0.7 ml saline.
7 Repeat steps 1 to 5 with platelet substitute 1/8 replacing neat PL.
If the clotting time (previously 30–35 seconds) is now prolonged to 35–40 seconds, this indicates that the PL concentration is suffi ciently dilute to make the test sensitive to antibodies to that phospholipid.
If the clotting time exceeds 40 seconds, repeat steps 1-5 using PL diluted 1 in 4. If the clotting time remains 30–35 seconds, repeat steps 1-5 using PL diluted 1 in 16. If the time is 35–40 seconds, proceed to the next step.
8 Using this RVV solution (giving 30–35 seconds with neat PL and pooled normal plasma) and the dilution of phospholipid associated with a time of 35–40 seconds, repeat 1-5, substituting patient plasma for pooled normal.
9 Calculate the ratio of DRVV time (DRVVT) for patient plasma over DRVVT for pooled normal plasma to give the DRVVT ratio.
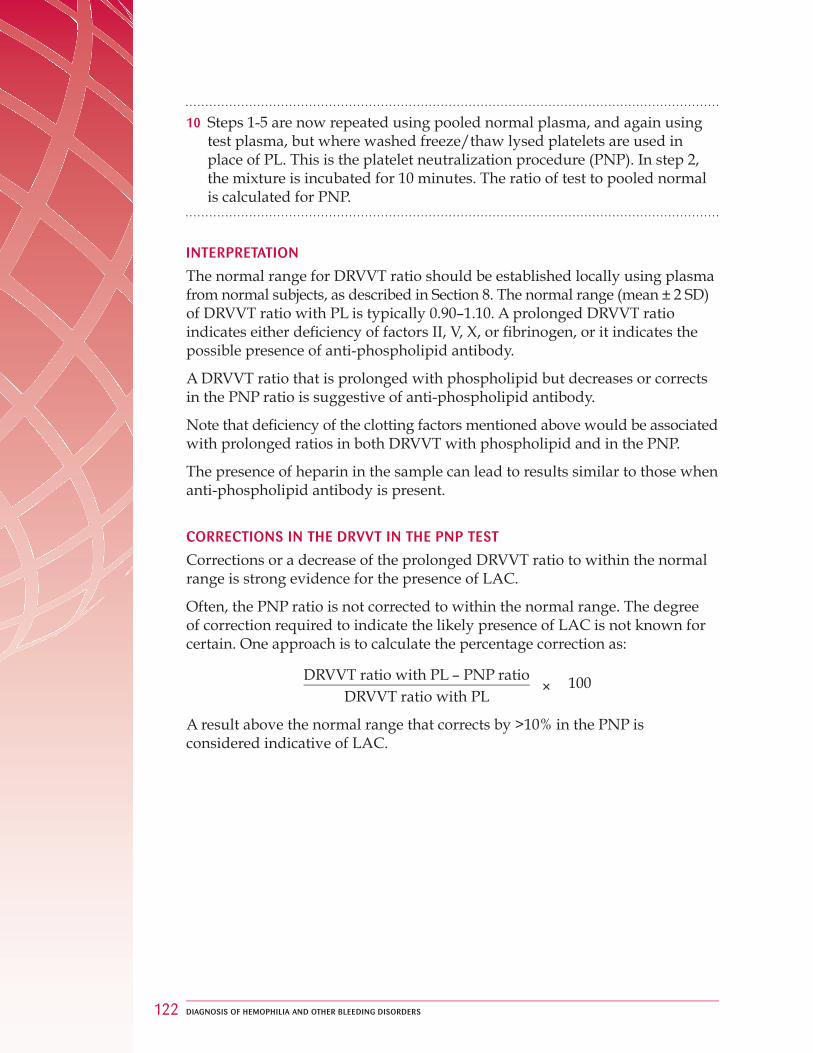
DIAGNOSIS OF HEMOPHILIA AND OTHER BLEEDING DISORDERS122
10 Steps 1-5 are now repeated using pooled normal plasma, and again using test plasma, but where washed freeze/thaw lysed platelets are used in place of PL. This is the platelet neutralization procedure (PNP). In step 2, the mixture is incubated for 10 minutes. The ratio of test to pooled normal is calculated for PNP.
INTERPRETATION
The normal range for DRVVT ratio should be established locally using plasma from normal subjects, as described in Section 8. The normal range (mean ± 2 SD) of DRVVT ratio with PL is typically 0.90–1.10. A prolonged DRVVT ratio indicates either defi ciency of factors II, V, X, or fi brinogen, or it indicates the possible presence of anti-phospholipid antibody.
A DRVVT ratio that is prolonged with phospholipid but decreases or corrects in the PNP ratio is suggestive of anti-phospholipid antibody.
Note that defi ciency of the clotting factors mentioned above would be associated with prolonged ratios in both DRVVT with phospholipid and in the PNP.
The presence of heparin in the sample can lead to results similar to those when anti-phospholipid antibody is present.
CORRECTIONS IN THE DRVVT IN THE PNP TEST
Corrections or a decrease of the prolonged DRVVT ratio to within the normal range is strong evidence for the presence of LAC.
Often, the PNP ratio is not corrected to within the normal range. The degree of correction required to indicate the likely presence of LAC is not known for certain. One approach is to calculate the percentage correction as:
DRVVT ratio with PL – PNP ratio× 100
DRVVT ratio with PL
A result above the normal range that corrects by >10% in the PNP is considered indicative of LAC.
DILUTE RUSSELL’S VIPER VENOM TIME (DRVVT) 123
38.1 Preparation of Washed Platelets for DRVVT
REAGENT
Tyrode’s buffer pH 6.5 8.0 g NaCl 0.2 g KCl 0.065 g NaH2PO42H2O 0.415 g MgCl2 6H2O 1.0 g NaHCO3
Dissolve in 900 ml distilled water and adjust pH to 6.5. Make up to 1 litre with distilled water.
METHOD
1 Prepare platelet-rich plasma (PRP) from fresh citrated blood by centrifugation at 170 g (1200 rpm) for 10 minutes at room temperature.
OR
Use platelet concentrates as for treatment of patients.
2 Dilute PRP 1 in 2 with Tyrode’s buffer.
3 Place the dilute platelets in plastic conical-bottomed centrifuge tubes and centrifuge for 10 minutes at 850 g at room temperature.
4 Discard the supernatant using a plastic Pasteur pipette and resuspend the pellet of platelets in Tyrode’s buffer. (Add the same amount of buffer as the original volume of PRP.) Centrifuge at 850 g, as before. This process is repeated twice.
5 Discard the supernatant and resuspend in Tyrode’s buffer, using the same amount of buffer as 25% of the original volume of PRP.
6 Aliquot the fi nal washed platelets into 1.0 ml amounts in plastic tubes and freeze and thaw twice at -20ºC prior to use.

DIAGNOSIS OF HEMOPHILIA AND OTHER BLEEDING DISORDERS124
39 Platelet Function Testing
Platelets contribute to hemostasis in two main ways:
They adhere to subendothelial microfi brils and collagen fi bres in the blood vessel wall, after which they change shape, undergo a specifi c release reaction, and then aggregate to form a primary hemostatic plug.
As a result of these events, particularly during release and aggregation, procoagulant activities are generated, chiefl y involving the platelet membrane phospholipids so that blood coagulation is initiated at the areas where platelet aggregation has occurred.
Quantitative or qualitative platelet defects may result in a signifi cant bleeding tendency, mainly due to failure of platelet plug formation, but also to a lesser extent to the sub-optimal activation of blood coagulation.
Defective platelet function, or thrombocytopenia, may present clinically with a variety of symptoms strongly suggestive of primary hemostatic failure (e.g. bruises or ecchymoses, epistaxis, gastrointestinal bleeding, or menorrhagia). Platelet defects usually give rise to fairly mild bleeding disorders. Patients may present only with excessive bleeding after surgery or dental extraction.
Platelet defects include storage pool disease, Glanzmann’s thrombasthenia, and Bernard-Soulier syndrome.
In the investigation of patients suspected of having a bleeding disorder, it is important to collect a detailed clinical history. Examination of a blood fi lm, determination of the blood platelet count, and determination of the skin bleeding time (described in Section 11) are important initial tests. If these tests are within normal limits, a clinically important platelet defect as the cause of the bleeding under investigation is unlikely.
A drug history is important. A number of drugs can infl uence results of platelet function tests including bleeding time. For example, recent Aspirin ingestion can exert an effect for up to 10 days.
For a list of drugs that can interfere with platelet function, see the British Society for Haematology’s guidelines on platelet function testing referenced below.
Another simple test that can give an indication that an abnormality may be present is the clot retraction method, described below.
PLATELET FUNCTION TESTING 125
39.1 Clot Retraction
The retraction of the clot in clotted whole blood can give an indication of platelet number and function. When the clot retracts, serum is expressed, and the degree of clot retraction can be measured.
METHOD
1 Collect 1ml of blood into a glass test tube (75 mm × 10 mm) and place at 37°C.
2 Examine the tube visually until a fi rm clot is present. Leave undisturbed at 37°C for another hour.
3 Measure the distance from the base of the tube to the meniscus. Carefully remove the clot with a thin wooden stick (e.g. a cocktail stick), leaving the serum that has been expressed from the clot in the tube.
4 Measure the distance from the base of the tube to the meniscus of the serum.
5 Divide the serum distance by the total distance and multiply by 100 to give a percentage.
INTERPRETATION
Normally, more than 40% serum is expressed. A decreased expression is present in some platelet defects, notably Glanzmann’s thrombasthenia.
NOTES
The tubes and wooden stick must be absolutely clean to keep the clot from adhering to the tube.
The clot must be removed carefully and gently to avoid squeezing and therefore more serum being expressed.
REFERENCES
Chanarin I (ed.). Laboratory Haematology: An Account of Laboratory Techniques. Edinburgh: Churchill Livingstone, 1989.
Guidelines on platelet function testing. The British Society for Haematology BCSH Haemostasis and Thrombosis Task Force. J Clin Pathol 1988; 41: 1322–1330.

DIAGNOSIS OF HEMOPHILIA AND OTHER BLEEDING DISORDERS126
39.2 Measurement of Platelet Aggregation
PRINCIPLE
The optical density of platelet-rich plasma falls as platelets form aggregates. The amount, and to some extent the rate, of fall is largely dependent on platelet reactivity, provided that all other variables (e.g. platelet count, mixing speed, and temperature) are controlled.
The optical density changes are monitored, wherein the optical density of platelet-rich plasma refl ects the degree of platelet aggregation induced by one of a variety of agonists.
The optical density is monitored using an aggregometer connected to a chart recorder so results may be recorded graphically.
A number of reviews of current practice in different centres (Jennings et al. 2008, Cattaneo et al. 2009) and guidelines (Bolton-Maggs et al. 2006) have been published.
PRECAUTIONS PRIOR TO STUDYING PLATELET AGGREGATION
Unless their effect on platelet aggregation is being specifi cally investigated, Aspirin-containing compounds should be excluded for at least 10 days prior to testing, as Aspirin interferes with the release reaction.
Ingestion of other drugs known to infl uence platelet function should also be avoided for at least the time required for their elimination from the circulation. These include certain antihistamines, antibiotics, and anti-depressants. A check should be made of any drugs being prescribed before performing platelet function testing.
Because chylomicrons can interfere with the measurement of platelet aggregation, studies should not be carried out shortly after a fatty meal.
Many other “normal” dietary constituents, including alcohol, onions, garlic, peppers, and ginger, may also inhibit platelet aggregation. Bear this in mind when evaluating results.
PREPARATION OF PLATELET-RICH AND PLATELET-POOR PLASMA
Venous blood is collected with minimal venous occlusion into a 1/10th volume of tri-sodium citrate (0.109M) in a polypropylene or siliconized glass tube. Approximately 20 ml of blood is needed for a full aggregation study.
Chilling activates platelets, and so the blood is processed at 20°C–25°C. Platelet-rich plasma (PRP) is prepared by centrifugation for 10 to 15 minutes at 200 g.

PLATELET FUNCTION TESTING 127
The PRP is carefully removed, avoiding contamination with red cells or the buffy coat (aggregation will be diminished if either are present), into a polypropylene tube and held at 20°C–25°C until tested. The precise temperature of storage is not critical, but it can infl uence the results, and so the same temperature should be adhered to for all PRP samples.
The remaining blood is centrifuged at 2000 g for 20 minutes, and the platelet-poor plasma (PPP) is removed and stored at 4°C.
A platelet count is performed on the PRP: the number of platelets will infl uence the aggregation responses obtained, but within the range in which most PRP counts fall (200–600 × 109/1), such effects are minimal. Indeed, there is evidence that diluting the PRP with PPP from the same patient can inhibit the responses obtained, probably because the PPP may contain substances released from platelets as a result of the additional trauma caused by the higher speed centrifugation (Cattaneo et al. 2007, Linnemann et al. 2008). For these reasons, PRP with a platelet count in the above range should not normally be adjusted.
For exceedingly high PRP counts (>1000 × 109/1), the aggregation response may be affected. Thus it may be advantageous to adjust the platelet count to a more suitable level. This may be done by diluting the PRP in the patient’s PPP. Similarly, low platelet counts (<200 × 109/l) may show diminished aggregation response. Concentrating platelets virtually always induces a functional change and is not recommended. However, a normal control diluted (in PPP) to the same PRP count may be run for comparison.
Platelet aggregation is pH-dependent, and so the PRP should be maintained within the range 7.7–8.0. Satisfactory control can be achieved by storing the PRP in full, tightly stoppered tubes and by completing the tests within two hours of blood collection.
AGGREGATING AGENTS
Reagents such as ADP and collagen bind to specifi c receptors in the platelet membrane, activating the platelet and triggering a series of reactions. This leads to the platelet undergoing shape change, contraction, mobilization, and release of granular constituents, and fi nally to aggregation of platelets.
Several different but interlinked pathways of platelet activation occur, depending on the type and concentration of agonist employed, leading to platelet aggregation. In the reaction tube, the change from a uniform platelet suspension to aggregates leads to a reduction in light absorbance and an increase in light transmitted through the platelet suspensions. This is detected by a recorder in combination with a platelet aggregometer.
The fi ve aggregating agents listed below should be suffi cient to allow the various functional platelet disorders to be identifi ed.

DIAGNOSIS OF HEMOPHILIA AND OTHER BLEEDING DISORDERS128
Adenosine-5- diphosphate (ADP)
A stock solution of 1mM/l of the disodium salt is prepared in Owren’s buffered saline (OBS) and stored in small amounts at -40°C. This is stable for at least three months. Once thawed, the solution should be used within three hours or discarded.
For use, further dilutions are prepared in OBS. The pattern of response to ADP depends on its fi nal concentration.
At 2 µmol/l, clearly defi ned primary and secondary waves can be seen: the fi rst represents the direct agonist-induced effect and the latter is due to release of endogenous ADP and generation of thromboxone A2 (TXA2), which itself aggregates platelets.
Below 2 µmol/l, progressively fewer normal subjects show a secondary response, and the primary wave usually reverses as the ADP is enzymatically degraded.
Above 3 µmol/l, the primary phase is usually so intense that the distinction between it and the secondary phase is masked.
ADP induces a change in shape of the platelets from a disc to a spiky sphere. This initially causes a slight increase in the optical density of the platelet suspension, which can be seen only if primary aggregation is impaired.
Adrenaline (epinephrine)
A stock solution of 1mM/l of the bitartrate salt is prepared in OBS. It should be stored and used as for ADP. With adrenaline, the concentrations used and the patterns of response are similar to those of ADP. However, in the absence of a secondary wave, the primary wave does not reverse, nor is it ever so intense that the secondary wave is masked.
Collagen
A very stable suspension of equine tendon collagen fi brils (1 mg/ml), available from Hormon-Chemie, Munich, Germany, is widely used. A number of other materials are equally suitable. It is stored at 4°C and must be well mixed immediately prior to dilution in the buffer packaged with it. It should be used at fi nal concentration of 0.5–2.0 µg/ml in PRP, and diluted suspensions are stable for one week at 4°C.
With collagen, no primary wave occurs. The response is usually defi ned by the duration of the lag phase prior to the onset of aggregation and by the intensity of the latter. A slight increase in the optical density caused by the shape change precedes aggregation.
Collagen from a number of different sources is in use. Both the type of collagen and the species from which the preparation is prepared (e.g. equine or bovine) can have an important effect on the results obtained. Indeed, more than a
Platelet Function testing 129
hundred-fold range of concentrations are required, depending on the source material. It is therefore important to select a suitable source and to establish a local reference range for this material, which should be re-evaluated if the source is changed. For a review, see Jennings et al. (2008).
RistocetinAt a final ristocetin concentration of 1 mg/ml in PRP, distinct primary and secondary waves are usually discernable, but above this the direct effect is so intense that the two phases merge.
The primary wave is a measure of the amount of von Willebrand factor present in the plasma, whereas the second wave is due to release of endogenous substances.
Arachidonic acidSodium arachidonate (99% purity) is dissolved in OBS to a concentration of 10mM/l. Small aliquots are placed in darkened glass vials that are flushed with nitrogen to prevent oxidation, then tightly capped and stored frozen below -20°C.
Aggregation is generally monophasic and preceded by a short lag phase.
ReagentsNote: These concentrations are appropriate if one part is added to nine parts of PRP.
y ADP Make a 1 in 10 dilution = 100 µM (i.e. 0.1 ml 1000 µM solution + 0.9 ml OBS)
From this, make two working strengths: y 20 µM (i.e. 0.2 ml 100 µM + 0.8 ml OBS) y 30 µM (i.e. 0.3 ml 100 µM + 0.7 ml OBS)
In cases where hyperaggregability is being tested, lower concentration may be needed (e.g. 10 µM, 5 µM).
y Adrenaline (epinephrine) Dilute as for ADP
y Collagen Mix well and dilute in OBS:
y 1 in 500 (i.e. 0.1 ml stock + 4.9 ml OBS) = 20 µg/ml y 1 in 100 (i.e. 0.5 ml 1.50 dilution + 0.5 ml OBS) = 10 µg/ml
y Ristocetin This is used at up to four concentrations depending on the results obtained: 15 mg/ml, 12.5 mg/ml, 7.5 mg/ml, and 5 mg/ml
y Arachidonic acid 10mM/l
DIAGNOSIS OF HEMOPHILIA AND OTHER BLEEDING DISORDERS130
METHOD
Because of platelet refractoriness to aggregation caused by centrifugation, aggregation studies must not be started within 30 minutes of preparing the PRP. In particular, the response to ADP is reduced during the fi rst 20 to 30 minutes after preparation of PRP. However, testing should be completed within two hours.
1 Switch on aggregometer to warm to 37°C, and set stirring speed to 900 rpm.Some aggregometers have two channels, so it is convenient to use half of the width of the chart paper for each channel.With a 10 mV defl ection, the PRP settings used are 0.5 and 5.5 mV for channels 1 and 2 respectively (represents 0% aggregation), and the corresponding blank values (which are set using PPP) would be 4.5 and 9.5 mV (represents 100% aggregation).
2 Place 0.45 ml PRP in a glass cuvette (dispose of after use) containing a siliconized “fi le” for mixing.
3 Place in holder for channel 1 and set transmission to 0% (0.5 mV). Replace with a cuvette containing 0.5 ml PPP, and set transmission to 100% (4.5 mV). Repeat this procedure until no further adjustment is required.
4 Repeat for channel 2, using the 5.5 and 9.5 mV settings.
5 Allow PRP to warm to 37°C for two minutes. Add 0.05 ml of agonist to bottom of cuvette and monitor optical density change for three minutes.
Repeat this procedure for each agonist.
NOTES
For ADP and adrenaline, start with the 20 µM concentration. This will be a fi nal concentration in PRP of 2 µM.
For collagen, use the 10 g/ml concentration. This will be a fi nal concentration of 1 µg/ml.
For ristocetin, use the 12.5 mg/ml concentration. When screening for type 2B VWD, also test the 7.5 mg/ml and 5 mg/ml concentrations. These will give a fi nal concentration in PRP of 1.25 mg/ml, 0.75 mg/ml, and 0.5 mg/ml respectively. Use 15 mg/ml if there is no response to 12.5 mg/ml.
If the platelets hyperaggregate with 0.5 mg/ml ristocetin (indicating possible 2B VWD or platelet type VWD):
Check for spontaneous aggregation by monitoring PRP under the same stirring conditions on the aggregometer without adding any agonist to stimulate aggregation.

PLATELET FUNCTION TESTING 131
Wash a measured volume of PRP (e.g. 1 ml of both patient’s and normal plasma × 3) in EDTA citrate saline washing buffer. Carefully resuspend patient’s platelets in normal plasma and the normal platelets in patient’s plasma. Retest with 0.5 mg/ml ristocetin.
Reactions should fi t into one of the patterns below.
Figure 39.1. Reaction patterns
Patient PRPPatient PPP
Patient PlateletsNormal PPP
Normal plateletsPatient PPP
Aggregation No response Aggregation = Type 2B VWD
Aggregation Spontaneous aggregation No response = Platelet-type VWD*
*For a review of platelet-type VWD, see Franchini et al. (2008).
INTERPRETATION OF AGGREGATION PATTERNS
If the platelets being tested do not give a normal response — i.e. two phases of aggregations covering over 50% of the scale, with the above concentrations covering over 50% of the scale with the above concentrations of reagents — then the concentration of the agonist is increased (within reason) until a satisfactory response is obtained.
In cases where there is an obvious release defect, monitor the response to arachidonic acid.
If no response is obtained with arachidonic acid, test with thromboxane A2 and/or calcium ionophore.
When studying platelet aggregation as part of a hyperaggregability assessment, ADP and adrenaline are used at lower concentrations to obtain a dose response curve. Concentrations used are: 2 µM, 1 µM, 0.5 µM, 0.1 µM fi nal concentration in PRP. A spontaneous aggregation is also performed before the rest of the agonists are tested:
1. Place 0.5 ml PRP in cuvette and place in aggregometer.2. Monitor any change in optical density for 15 minutes.
If PRP volume is insuffi cient, the minimum volume that may be used in the standard cuvettes is 0.36 ml PRP + 40 µl agonist.
PRP prepared in the same way from a healthy normal donor should be processed as a check on the reagents. This is especially important if abnormal patient results are obtained, as some agonists are labile, particularly once diluted to working concentrations. Results from healthy normal subjects tested in this way can be used to derive reference ranges to aid interpretation of patient results.

DIAGNOSIS OF HEMOPHILIA AND OTHER BLEEDING DISORDERS132
CALCULATION OF RESULTS
Results are usually expressed in three ways:
1. Percentage fall in optical density measured three minutes after addition of agonist. This is the most convenient way, although it does not provide information on the shape of the aggregation curves.
2. Initial slope of the aggregation tracing. This indicates the rate of aggregation, but does not indicate whether secondary aggregation has occurred.
3. Determination of threshold agonist concentration, i.e. the amount of aggregating reagents required to just induce a second phase response. (This tends to be wasteful of PRP.)
INTERPRETATION OF RESULTS
Great caution is required when interpreting platelet aggregation patterns. A number of technical factors may infl uence the results. Bear in mind that there are a number of important differences between aggregation determined by nephelometry and that occurring in the body.
Nevertheless, useful diagnostic information can be obtained, and some examples of aggregation patterns are shown in Figure 39.2.
Figure 39.2. Platelet aggregation results in various disorders
Disorder ADP CollagenRistocetin
1.25 mg/ ml Ristocetin 0.5 mg/ ml
Arachadonic Acid Adrenaline
VWD type 1 and 2A N N A/R** A N N
VWD type 2B N N N H N N
Bernard-Soulier syndrome N N A A N N
Glanzmann’s thrombasthenia A A N A A A
Storage pool disease P/N R/N P/N A R/N P/N
Cyclo-oxygenase defect* R/N R N A R R/N
N = Normal; A = Absent; R = Reduced; H = Heightened response; P = Primary wave only*Or Aspirin effect **Can be normal in mild VWD type 1
FURTHER INVESTIGATION OF PLATELET FUNCTION
If an abnormal aggregation pattern is observed in an individual, it is advisable to repeat the assessment on at least one further occasion to check for consistency of the abnormality.

PLATELET FUNCTION TESTING 133
In the presence of abnormal aggregation, further investigation may be useful. These include the measurement of platelet nucleotide content and their release during platelet aggregation.
Quantitation of membrane glycoproteins can be performed for the unequivocal diagnosis of Bernard-Soulier syndrome and Glanzmann’s thrombasthenia.
The platelet release mechanism can be assessed by the measurement of total platelet content of ADP and adenosine triphosphate (ATP) and the release of ATP or 5-hydroxytryptamine (or both) from dense granules.
Figure 39.3. Technical factors that infl uence platelet function
Anticoagulant 1/10th volume of trisodium citrate.
Time Start tests 30 minutes after preparation of PRP.Complete studies within two hours of blood collection.
Centrifugation Should be suf� cient to remove red cells and white cells, but not large platelets. Should be done at room temperature, not at 4°C.
Platelet count Low counts < 100 × 109/l cause slow, weak responses.High counts > 1000 × 109/l may show reduced response.
pH < pH 7.7 inhibits aggregation.> pH 8.0 enhances aggregation.
Mixing speed < 800 rpm shows reduced aggregation.>1200 rpm breaks up platelet clumps.
Hematocrit > 55% shows progressively less aggregation, especially second-phase inhibition due to increased citrate concentration.
Temperature < 35°C shows decreased aggregation with regular doses of all agonists, but increased response to low doses of ADP.
Lipemia Increased chylomicrons cause reduced aggregation.
Dirty cuvette May cause apparent spontaneous aggregation.
No stir bar No response on addition of aggregating agent.
Air bubbles Rapid, large oscillations of pen prior to aggregation. Also caused by low platelet count.

DIAGNOSIS OF HEMOPHILIA AND OTHER BLEEDING DISORDERS134
DIFFERENCES BETWEEN IN VIVO AND IN VITRO CONDITIONS FOR PLATELET AGGREGATION
With in vitro blood tests:
Blood is anticoagulated
RBC and WBC are removed
Vascular components are not involved
Coagulation is not involved
Platelet population is selected
Products of platelet activation and release are retained
Reagents used are unphysiological in composition and dose
Platelets are unstable out of the body
Drugs may show more or less marked effects than in vivo
REFERENCES
Bolton-Maggs PH, Chalmers EA, Collins PW, Harrison P, Kitchen S, Liesner RJ, Minford A, Mumford AD, Parapia LA, Perry DJ, Watson SP, Wilde JT, Williams MD; UKHCDO. A review of inherited platelet disorders with guidelines for their management on behalf of the UK HCDO. Br J Haematol 2006; 135:603–33.
Cattaneo M, Hayward CP, Moffat KA, Pugliano MT, Liu Y, Michelson AD.Results of a worldwide survey on the assessment of platelet function by light transmission aggregometry: A report from the Platelet Physiology Subcommittee of the Scientifi c and Standardisation Committee of the ISTH. Thromb Haemost 2009; 7:1029.
Cattaneo M, Lecchi A, Zighetti ML, Lussana F. Platelet aggregation studies: Autologous platelet-poor plasma inhibits platelet aggregation when added to platelet-rich plasma to normalize platelet count. Haematologica 2007; 92:694–7.
Franchini M, Montagnana M, Lippi G. Clinical, laboratory and therapeutic aspects of platelet-type von Willebrand disease. Int J Lab Hematol 2008; 30:91–4.
Jennings I, Woods TA, Kitchen S, Walker ID. Platelet function testing: practice among UK National External Quality Assessment Scheme for Blood Coagulation participants, 2006. J Clin Pathol 2008; 61:950–4.
Linnemann B, Schwonberg J, Mani H, Prochnow S, Lindhoff-Last E. Standardization of light transmittance aggregometry for monitoring antiplatelet therapy: An adjustment for platelet count is not necessary. Thromb Haemost 2008; 6:677–83.

LYOPHILIZATION OF PLASMA 135
Lyophilization of Plasma 40
INTRODUCTION
Lyophilization, or freeze drying, can be used to prepare plasma that will remain stable over prolonged periods of time. This is useful, for example, for preparation of lyophilized FVIII-defi cient plasma, which is normally stable for at least two and up to fi ve years when stored at -20°C or lower, and which is stable enough to survive short periods (up to seven days) at temperatures of 20°C–25°C.
SUITABLE PLASMA
Venous blood mixed with 0.105–0.109M sodium citrate in the proportion 9 parts blood, 1 part anticoagulant. Centrifuge at 1700 g for 10 minutes, pool as appropriate, and store at -55°C pending viral test results. Confi rm negative results for anti-HIV 1 and 2, anti-HCV, and Hep B SAg.
MATERIALS
2 ml clear neutral glass vials with internally siliconized 13 mm neck
13 mm freeze-dry stopper, grey
13 mm fully tear-off seals
(All available from Diagnostic Reagents, Thame, Oxfordshire, U.K.)
Freeze-dryer unit (Supermodulyo and stoppering shelf unit available from Life Sciences International, Unit 5, Ringway Centre, Edison Road, Basingstoke, Hampshire, RG21 6YH, U.K.)
N-2-Hydroxyethylpiperazine-N’-2-ethanesulphonic acid (HEPES; BDH Laboratory Suppliers, Poole, BD15 1TD, U.K.)
METHOD
1 Thaw plasma rapidly at 37°C.
2 Mix well.
3 Add 0.8 g HEPES per 100 ml plasma.
DIAGNOSIS OF HEMOPHILIA AND OTHER BLEEDING DISORDERS136
4 Mix and allow HEPES to dissolve (about 15 to 20 minutes).
5 Fill stainless steel lyophilization trays with empty vials.
6 Dispense exact 0.5 ml aliquots in each vial.
7 Place rubber bung in each vial to depth of narrow ridge on bung. Ensure air access out of vial.
8 Freeze at -70°C for a minimum of three hours.
9 Turn on freeze-dryer unit. Activate fridge unit.
10 Place trays in shelving unit (up to eight).
11 Place shelving unit in clear plastic chamber over air exit port on top of freeze-dryer.
12 Activate pump. Ensure that the above two steps and this step are completed within three to four minutes to prevent plasma thaw commencing. If partial thaw occurs, material will froth and freeze dry poorly, and it must be discarded.
13 Confi rm that vacuum is developing by movement in pressure gauge (visible movement within a few minutes) and by immobility of plasma chamber under light lateral manual pressure.
14 Leave under vacuum for fi ve days.
15 Seal vials under vacuum by screwing down handles on shelving unit.
16 Allow air access through entry port.
17 Defrost and dry freeze-dryer.
18 Store lyophilized plasmas at -20°C, and cap as soon as possible.
19 To confi rm even lyophilization of plasma, test four to six vials selected from different locations within the steel trays. Determine PT and APTT, which should not vary by more than 6%– 8%.
EVALUATION AND USE OF COAGULOMETERS 137
41Evaluation and Use of Coagulometers
INTRODUCTION
Automation in coagulation laboratories is now in widespread use in most parts of the world. It has contributed to improvements in standardization and facilitating tests that demand specifi c training and special working conditions, so that laboratories may improve their effi ciency and repertoire.
Automation in hemostasis is relatively recent. Manual methods based on visual detection of the fibrin clot and using incubators at 37°C were once the only techniques for coagulation studies. Then, in the 1970s, new semi-automatic equipment appeared based on photometric or mechanical principles to detect fibrin. More recently, fully automated instruments have become common in modern laboratories. Today, new equipment connected to specific data processing systems can undertake clotting, chromogenic, and immunological tests.
Two methodologies are available today:
1. Mechanical
2. Optical
2.1 Photo-optical2.2 Nephelometric2.3 Chromogenic2.4 Immunological
MECHANICAL PRINCIPLE
The electromagnetic methods are based on the detection of an increase in plasma viscosity when fi brin is formed. Two variations to this principle are applied to lab equipment today.
The fi rst uses an electromagnetic fi eld applied to test cuvettes that detects movement within a stainless steel sphere placed in the plasma sample. The steel sphere follows a pendulum movement, swinging from one side to the other in a plasma reagent solution with a constant movement. As the fi brin begins to form, viscosity increases and the sphere’s movement is delayed. When the sphere’s oscillation movement reaches a predetermined level, the chronometer stops, indicating the time of plasma coagulation.
A second mechanical detection method also uses a stainless steel sphere, located this time in a single point slot. A magnetic sensor detects the sphere’s

DIAGNOSIS OF HEMOPHILIA AND OTHER BLEEDING DISORDERS138
position, and as it rotates, the sphere maintains its inclination while the liquid sample remains fl uid. When fi brin is formed, the clot captures the sphere, moving it from its original position. As it moves outside the sensor’s range, the circuit is interrupted and the chronometer stops (Thomas et al. 1999).
OPTICAL OR SPECTROPHOTOMETRIC PRINCIPLES
Photo-optical principle
Optical systems are based on the notion that clot formation induces change in the plasma’s optical density. As the clot is formed, there are changes in the optical characteristics from the initial reading of the plasma/reagents. These changes are monitored and used to derive the time taken for a particular degree of change to occur.
Nephelometric principle
The nephelometric principle is employed by some systems. In coagulation assays, a monochromatic laser light source is transmitted — for example, by fi bre optics. The light dispersion readings are made possible by a sensor that may be installed at 90 or 180 degrees from the light path, depending on the particular system, which then measures scattered light at an angle or records the change in light transmission. When the light reaches insoluble complexes such as fi brin fi bres, it disperses in forward scattered angles (180 degrees) and lateral scattered angles (90 degrees). The chronometer stops when the amount of scattered light or transmitted light reaches a specifi c predetermined level. The difference between light scattered or transmitted before and after the clot formation is normally proportional to the amount of fi brin formed.
Chromogenic principle
This is based on the use of a colour-specifi c generating substance known as chromophore, of which para-nitroaniline (pNA) is the most common. It has a maximum absorbance at 405 nm. The principle of chromogenic testing resides in adherence of pNA to synthetic substrates (Rodak, 1995). pNA is attached to a series of amino acids that mimics the target sequence of the activated coagulation factor we want to determine. The coagulation protein cleaves the chromogenic substrate at a specifi c site between a defi ned amino acid sequence and releases the pNA.
The intensity of the yellow colour is proportional to the amount of pNA released. This is measured by photo detection at 405 nm wavelength. As more pNA is cleaved and freed, the absorbance capacity of the sample increases, which leads to greater change in the solution’s optical density (Rodak, 1995).
The fi rst coagulation equipment could only provide a single defi nition parameter, such as a mechanical or photo-optical one. The photo-optical tools were initially designed for readings at a single wavelength (for example, 500 nm or 600 nm) that could only be used for the detection of clot formation.
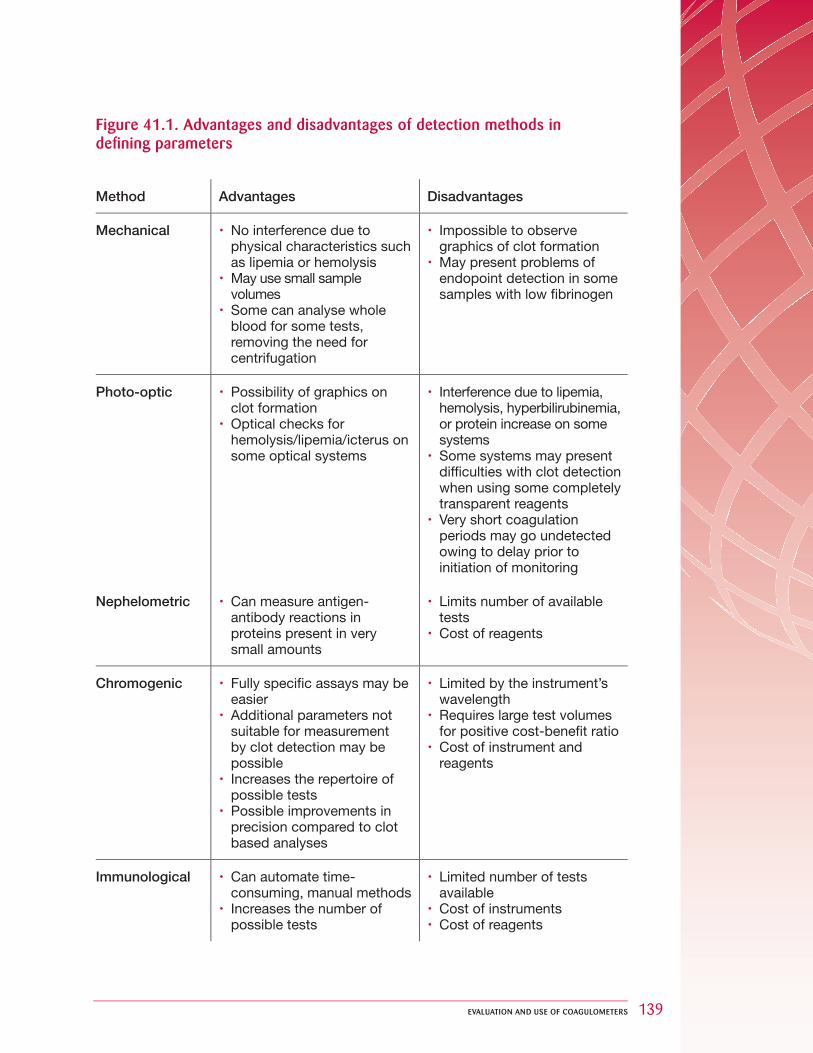
EVALUATION AND USE OF COAGULOMETERS 139
Figure 41.1. Advantages and disadvantages of detection methods in defi ning parameters
Method Advantages Disadvantages
Mechanical No interference due to physical characteristics such as lipemia or hemolysis
May use small sample volumes
Some can analyse whole blood for some tests, removing the need for centrifugation
Impossible to observe graphics of clot formation
May present problems of endopoint detection in some samples with low � brinogen
Photo-optic Possibility of graphics on clot formation
Optical checks for hemolysis/lipemia/icterus on some optical systems
Interference due to lipemia, hemolysis, hyperbilirubinemia, or protein increase on some systems
Some systems may present dif� culties with clot detection when using some completely transparent reagents
Very short coagulation periods may go undetected owing to delay prior to initiation of monitoring
Nephelometric Can measure antigen-antibody reactions in proteins present in very small amounts
Limits number of available tests
Cost of reagents
Chromogenic Fully speci� c assays may be easier
Additional parameters not suitable for measurement by clot detection may be possible
Increases the repertoire of possible tests
Possible improvements in precision compared to clot based analyses
Limited by the instrument’s wavelength
Requires large test volumes for positive cost-bene� t ratio
Cost of instrument and reagents
Immunological Can automate time-consuming, manual methods
Increases the number of possible tests
Limited number of tests available
Cost of instruments Cost of reagents

DIAGNOSIS OF HEMOPHILIA AND OTHER BLEEDING DISORDERS140
More recently, some coagulometers can read at two or more wavelengths often including 405 nm, increasing the capacity for newer reactions (chromogenic substrate methods). In the 1990s, a number of manufacturers successfully included multiple detection methods, which now give a single laboratory the possibility of applying different methodologies using the same equipment.
Immunological principleLatex microparticles coated with a specific antibody are generally used against the analyte (antigen) being measured. A beam of monochromatic light goes through a latex microparticle suspension. When the wavelength is greater than the suspension particle diameter, the particles absorb a small amount of light. Yet, when the specific antibody-coated latex microparticles come in contact with the antigen present in the solution, they adhere to the antibody, forming links between the particles, which produces agglutination. When the particles’ diameter approaches the wavelength of the monochromatic light beam, a greater amount of light is absorbed. This increase in light absorbance is proportional to the agglutination, which, in turn, is proportional to the amount of the antigen present in the sample. This type of technology is available in more sophisticated coagulation analysers introduced in the market in the 1990s. Usually time-consuming standard immunological assays can be performed in minutes when using any of these automated tools.
ADVANTAGES OF AUTOMATION IN A COAGULATION LABORATORY 1. Improves the capacity and flexibility of professional time spent (Rodak, 1995).
2. Improves test reproduction. In the past, manual coagulation tests were inaccurate, with variation coefficients greater than 20%; the semi-automatic equipment provided greater accuracy in coagulation testing. However, with manual dispatch of samples and reagents, testing has to be done in duplicate. With totally automated equipment accuracy improved, attaining variation coefficients of less than 5%, and even 1% for some tests. This has led authors to introduce the notion of single tests and the possibility of reducing reagent costs and cuvettes by half.
3. Reduces cost in samples and reagents.
4. Facilitates data storage and recovery systems by means of computer programs.
5. Allows automatic replay of results when mistakes are made in the first run.
6. Offers the possibility of running different tests using a single sample.
7. Permits sampling from a closed tube, which improves safety and efficiency in coagulation tests. This reduces, to a great extent, the possibility of exposing the operator to sprays or patient sample spills, or mistakes in labelling. One manufacturer offers a patented screening system that

EVALUATION AND USE OF COAGULOMETERS 141
automatically separates plasma from erythrocytes before tests without previous centrifugation.
8. Provides capacity to dilute samples, calibrators, and controls. The equipment can be programmed for additional dilutions if the initial results escape the method’s linearity. It can also automatically carry out other tests without the operator’s intervention if clinically indicated or because of initial run results.
9. Most analysers include alarm systems that warn the operator of excess in pre-established readings, which may identify equipment problem (e.g. small amount of reagent, temperature failure, too small a sample, and quality control errors).
The different methodological types available have advantages and disadvantages that should be known and understood in order to guarantee precision and validity of test results. It is important to consider that laboratories are responsible for trustworthy results. A laboratory’s main concern is to select the coagulation equipment that will generate appropriate results in spite of budget restraints. Such instruments demand regular technical maintenance, permanent knowledge, and system control, since a mistake or failure may decisively infl uence a number of results. Control systems that guarantee analytical confi dence are therefore compulsory.
Many laboratories may be fortunate enough to be able to evaluate equipment before purchasing. If this is not possible, it is very important to obtain adequate information and advice from a reference laboratory.
When evaluating new equipment before purchase, fi rst compare analysers according to criteria such as:
equipment cost
inactivity period and reliability
repair response time
ease of use
availability of adequate maintenance within an appropriate timeframe
validation process and throughput
cost of disposable elements
fl exibility in using reagents from other manufacturers
possibility of adding new tests protocols
training courses and continuous training support (Rodak, 1995)
The sensitivity of different types of equipment to multiple parameters will differ depending on how the machines are calibrated and how end points

DIAGNOSIS OF HEMOPHILIA AND OTHER BLEEDING DISORDERS142
are detected. Laboratories have different needs, and it is advisable to rank priorities. For an example, see Figure 41.2.
Technology is on the rise and growing daily demands generate the need for instruments of this nature in the laboratory. They will constitute a great step forward in the lab fi eld, given the possibility of undertaking tests in a reliable, accurate, and precise manner, and delivering results in a shorter time period and under better control.
The advantages of automation are numerous. Technology is continuously advancing to meet new developments in the fi eld and to reduce turnaround times, allowing tests to be reliable, accurate, and precise, while maintaining quality.
Figure 41.2. Characteristics of specialized equipment
Source: Rodak, 1995
Characteristics Description
Random access With patient’s sample, various different tests are possible in any order and at the same time.
Sample primary tube Plasma sample is directly taken by aspiration in an opened collection tube placed in the analyser.
Penetrating plug and closed sampling tube
The analyser vacuums the plasma sample within the collection tube with the rubber plug in place.
Barcode Allows identi� cation of reagent, patient samples, or both by means of a barcode. This reduces manual data entry.
Bidirectional inter-phase
The analyser queries a centralized computer to determine the requested number of tests. The operator does not need to manually program the information in the equipment.
Sample indicator Warns the operator of problems with sample integrity.
Liquid level sensor Warns the operator of insuf� cient sample or reagent volume for adequate testing, or if the equipment did not vacuum enough from sample to perform the requested test.
Integrated quality control programs
Instrument’s computer program stores and organizes quality control data. It may include the complete application of Westgaard rules to indicate off-limit results.

EVALUATION AND USE OF COAGULOMETERS 143
Characteristics Description
STAT capacities Allows the operator to cancel the test veri� cation sequence in order to place a new STAT sample in the veri� cation isle.
Refrigeration capacity of integrated samples
Preserves the integrity of samples, reagent, or both during the veri� cation process.
Storage capacity of integrated samples
Indicates the amount of patient sample that can be loaded in the analyser at any given time.
Re¦ ex testing capacity Makes it possible to program the equipment to repeat or add tests under speci� c parameters set by the operator.
Patient data storage Analyser capacity to store test results that can be recalled at any given moment. May store clot formation curves.
Reagent volume monitoring
Warns the operator of insuf� cient reagent for programmed tests.
Processing Number of tests that can be processed within a give period (generally classi� ed as number of tests per hour).
Clot formation curve Allows the operator to visualize the clot formation within the cuvette. Helps detect certain unruly conditions or morbid states, or the location and solution of deviant test result failures.
REFERENCES
Rodak BF (ed): Diagnostic Hematology. Philadelphia: WB Saunders, 1995: 626–631.
Thomas LC, Sochynsky CL. Multiple measuring modes of coagulation instruments. Clin Hemost Rev 1999; 13:8.
OTHER RELEVANT PUBLICATIONS
Graves S, Holman B, Rossetti M, Estey C, Felder R. Robotic automation analysis. Clinica Chimica Acta 1998; 278:269–279.
Sasaki M, Kageoka T, Ogura K et al. Total laboratory automation in Japan: Past, present and the future. Clinica Chimica Acta 1998; 278:217–227.

DIAGNOSIS OF HEMOPHILIA AND OTHER BLEEDING DISORDERS144
42 Molecular G enetic Analysis
Laboratory methods related to all aspects of molecular genetic testing in relation to hemophilia and allied disorders are covered by a separate WFH Laboratory Sciences Committee publication currently being written by Prof. Ampaiwan Chaunsumrit and Dr. Anne Goodeve. This laboratory manual, dealing with phenotypic analysis, will be available for free download via the WFH website, www.wfh.org.
WORLD FEDERATION OF HEMOPHILIA1425 René Lévesque Boulevard West, Suite 1010
Montréal, Québec H3G 1T7CANADA
Tel.: (514) 875-7944Fax: (514) 875-8916E-mail: [email protected]
Internet: www.wfh.org
Supported by a charitable donation from Talecris Biotherapeutics, Center for Science and Education