lab manual fshn 312: applied microbiology …...basic microbiology review fshn 312 lab manual page 6...
TRANSCRIPT
FSHN 312 Lab Manual
Page 1 of 83
FSHN 312: Applied Microbiology
Laboratory Lab Manual
Spring 2018
Dr. Matthew Stasiewicz
Monday and Wednesdays, 10:00 am – 11:50 am
17 Agricultural Bioprocess Laboratory
FSHN 312 Lab Manual
Page 2 of 83
Table of Contents Lab 1 - Basic Microbiology Review .......................................................................................................... 3
Lab 2 - Intrinsic and Extrinsic Properties and their Impact on Microbes .................................................. 8
Lab 3 - Principles of Quantification and Food Contact Surface Testing ................................................. 13
Lab 4 - Coliform Follow-Up ................................................................................................................... 22
Lab 5 - D and Z Values ........................................................................................................................... 33
Lab 6 - Pathogen Detection in Foods ...................................................................................................... 37
Lab 7 - Outbreak Investigation ................................................................................................................ 44
Lab 8 - QMRA: Quantitative Microbial Risk Assessment ...................................................................... 51
Lab 9 - Bacterial Fermentation: Sauerkraut ............................................................................................ 55
Lab 10 - Bacteriophage ............................................................................................................................. 59
Lab 11 - Bacterial Fermentation: Lactic Acid Bacteria and Yoghurt ........................................................ 63
Lab 12 - Spoilage Microbes ...................................................................................................................... 67
Lab 13 - Yeast Fermentations: Winemaking ............................................................................................. 72
Lab 14 - Extra Credit: Fermentation @Home ........................................................................................... 82
Basic Microbiology Review FSHN 312 Lab Manual
Page 3 of 83
Lab 1 - Basic Microbiology Review
Learning Objectives • Demonstrate proper aseptic technique for transfer of cultures to broth and to a plate • Practice streak plating of a diluted bacterial culture • Perform serial dilutions of a bacterial culture • Apply these methods to quantify the number of bacteria in a culture
Background Aseptic technique is crucial to prevent contamination of samples, to maintain safety of laboratory personnel, and to ensure correct results of laboratory analysis. Extreme care should be taken when working with microbial cultures, laboratory equipment, and supplies.
Microbes can be grown on a solid medium in petri plates for a number of purposes. For food microbiology, we will be growing microbes on plates for one of two purposes: isolation of individual microbes from a complex sample that may contain different types of microbes, or enumeration of microbes from a sample. Streak plating, or streaking for isolation, is used to isolate single colonies of microbes in a complex sample. Spread plating is used to enable quantification of the number of microbes in sample.
Bacteria in many environments are often present in very large numbers. Stationary phase, pure cultures, of many laboratory grown bacterial often reach densities greater than 1 billion individual cells per mL or g of sample. In fact, at these densities, the bacteria are so numerous they will cause a liquid broth to become cloudy (which microbiologists call turbid).
If one wants to determine the numbers of bacteria present in that very dense sample, a standard microbiology method to spread the bacteria out on a solid agar surface such that individual bacteria grow to form colonies (spread plating). To achieve this, one first needs to dilute the liquid sample such that a small volume only contains a small number of total bacterial. Often, this is done by a process called serial dilution where a sample in first diluted by a given factor, say 1 to 10. Then, that 1 to 10 dilution is again dilution another factor of 1 to 10. This can repeat as far as necessary.
Guidelines for proper aseptic technique 1. Sanitize your laboratory bench before and after each use.
a. Spray with 70% ethanol and wipe up 2. Use only sterile or single-use inoculating needles, loops, or tips.
a. Use the Bunsen burners to sterilize toothpicks by flaming (to just before burning). b. Remove items from bulk packaging by only touching one at a time.
3. When working with capped bottles or tubes, remove the cap by manipulating between the small finger and the palm of your hand
a. Always hold the cap in your hand, rather than laying it on the bench top, to avoid contamination.
4. When uncapping microcentrifuge tubes, use your thumb to pop open the lid. Take care not to touch the inner lip of the tube.
5. When using the pipettor, keep the pipettor upright and change tips when necessary. a. Turning the pipette sideways can cause fluid to enter the pipettor. This will cause
contamination of all the samples prepared with that pipettor.

Basic Microbiology Review FSHN 312 Lab Manual
Page 4 of 83
b. Get a new, sterile, tip when pipetting a new solution. 6. Work under a flame for experiments sensitivity to contamination.
a. Upward convection will prevent fungal spores from landing on materials. Guidelines for labeling plates and tubes All cultures and solutions must be labeled to ensure safety and tracking of experiment. Think two questions: Can an outside be able to identify the organism and/or solution? Can I figure out what this item was for if? To achieve this, specifically:
1. All items should be labeled: a. For safety – Organism and media, e.g. E. coli on PCA b. For tracking – Initials or group and date, e.g. g1 1/1/17 c. For the experiment – The treatment, e.g. + control d. A full label might be: + control E. coli on PCA g1 1/1/17
2. Guidelines for plates and tubes a. Plates – Label the bottom (agar plate) along the rim b. Tubes – Label tape places near the top of the tube
3. Sets of plates or tubes should also be labeled with group information a. Plates – Label the tape securing the stack with safety and tracking information. b. Tubes – Label the rack holding the tubes with safety and tracking information. c. Redundant information can be left off individual labels if the first item is fully labeled.
Materials Sterile, clear microcentrifuge tube (1 per person) Sterile, clear microcentrifuge with 1 mL TSB (1 per person) Escherichia coli on Plate Count Agar (1 plate per group) 1mL Tryptic Soy Broth (2 per person) Disposable sterile inoculating loops or long toothpicks Plate Count Agar plates (2 per person) Escherichia coli in 5mL TSB (1 tube per group) Disposable sterile inoculating loops or short toothpicks Plate Count Agar (PCA) plates (4 plates per group) Dilution tubes filled with 900µL of dilution buffer (7 tubes per group) E. coli culture at stationary phase density (1 per group) Sterile spreaders (4 per group) Pipettes, tips. Sharpies, tape, tube racks, votexer, (opt.) plate spinner
Procedures Day 1
Aseptic Broth Transfer 1. Collect one clear, empty microcentrifuge tube and one 1 mL sterile broth tube from the supply
counter
Basic Microbiology Review FSHN 312 Lab Manual
Page 5 of 83
2. Label both tubes with your initials, Group #, and what it’s for (T=transfer, S=source) e.g. MJS G1 T
3. Using aseptic technique, transfer 500µL of sterile broth into the sterile empty tube 4. Place both tubes, each with 500µL, in on section of your group’s rack. Label the rack, using
table, with the group, date, and condition, e.g. TSB g1 1/1/2017 5. Incubate at Room Temperature (RT) on bench.
Aseptic Colony Transfer 1. Collect the agar streak plate with bacterial colonies, and two 1.5mL Eppendorf tubes 2. Label the broth tubes with your initials and the following conditions
a. ‘+’ for Inoculated b. ‘-‘ for Negative control
3. Pick a single colony from the plate with an inoculating loop and place it into the tube of sterile broth labeled ‘inoculated’
a. Use a second sterile loop to touch a blank section of agar and place it into the tube of sterile broth labeled ‘-’
4. Incubate at RT on bench
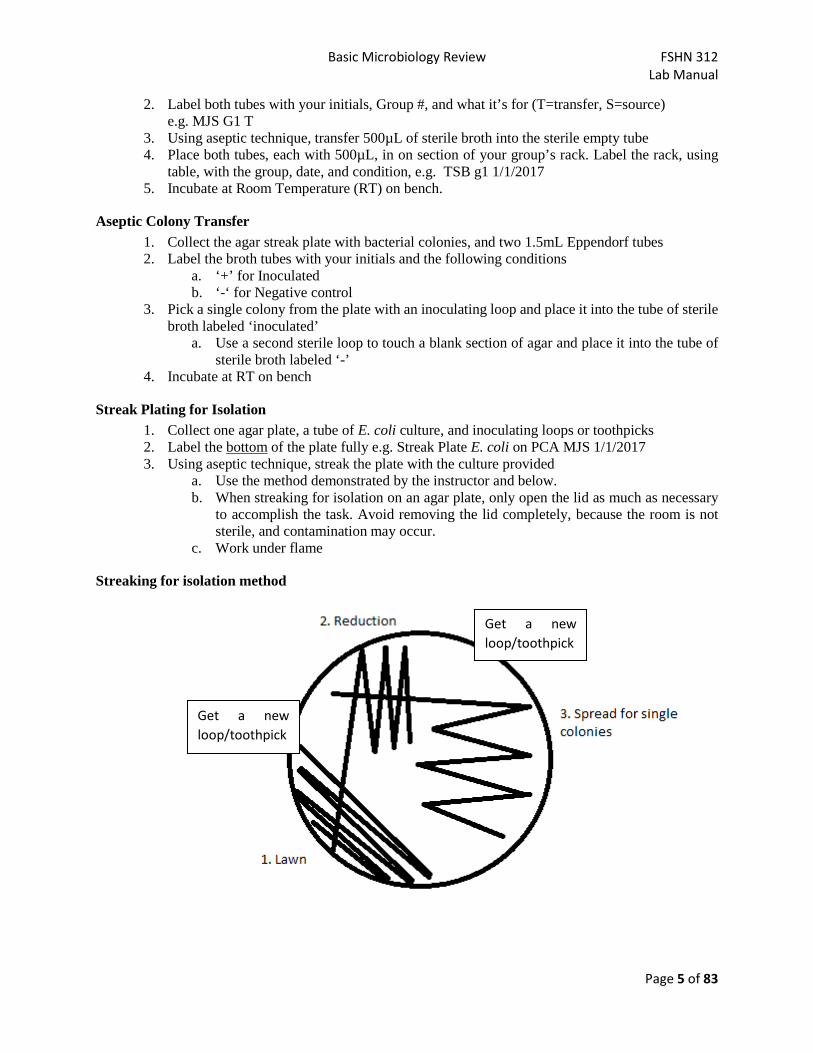
Streak Plating for Isolation 1. Collect one agar plate, a tube of E. coli culture, and inoculating loops or toothpicks 2. Label the bottom of the plate fully e.g. Streak Plate E. coli on PCA MJS 1/1/2017 3. Using aseptic technique, streak the plate with the culture provided
a. Use the method demonstrated by the instructor and below. b. When streaking for isolation on an agar plate, only open the lid as much as necessary
to accomplish the task. Avoid removing the lid completely, because the room is not sterile, and contamination may occur.
c. Work under flame
Streaking for isolation method
Get a new loop/toothpick
Get a new loop/toothpick
Basic Microbiology Review FSHN 312 Lab Manual
Page 6 of 83
4. Let the plate dry for 5-10 minutes 5. Incubate plates upside down at bench.
Serial dilutions NOTE: change pipettes between transfers.
1. Label the bottom of 3 PCA plates with your initials and date, culture and media, and dilution (one each of 10-7, 10-6 and 10-5). These are used in ‘spread plating’ section.
a. E.g. 10-7 E. coli on PCA MJS 1/1/2017 2. Transfer 100µL of stock culture to 900µL dilution blank. 3. Vortex the tube to ensure homogeneous mixing of culture. 4. Repeat 7 times.
a. Transfer 100µL of this to a 900µL dilution blank. b. Vortex the tube to ensure homogeneous mixing of culture.
Spread plating 1. Transfer 100µL of the 10-7 diluted culture to your appropriately labeled plate. 2. Spread the sample on the surface of the plate using a sterile spreader.
a. Repeat for the 10-6 and 10-5 diluted culture 3. Incubate the plates upside down at bench.
Day 2 1. Record results from broth tubes and plates in your lab notebook. 2. Count colonies on each of the dilution plates
a. Remember that a countable range on standard petri dishes is 25 to 250 colonies (read review material to know how to interpret counts – you may need to do estimated counts).
3. Calculate the number of colony forming units of bacteria present in your solution at the time of plating
a. Use the averages (means) of all plates for your lab group for a specific dilution factor. Also make sure that you are multiplying the counts by the correct dilution factor. Counts should be in scientific notation with only 2 significant figures.
4. Discard plates and tubes in the biological wastebaskets or appropriate racks.
Discussion Questions 1. Why do broth culture tubes become turbid after inoculation with a small amount of bacteria
and incubation for a long time? 2. Did you observe any growth in either of your “Transfer broth” tubes after incubation (after
performing the aseptic broth transfer)? What would it mean if microbial growth was present in the tubes?
3. How does streak plating work to generate isolated colonies? If one does not obtain isolated colonies, what could one try next time to obtain them?
4. Describe the difference between streak plating and spread plating, and provide two examples when a food microbiologist would perform streak plating and two examples when she would perform spread plating.

Basic Microbiology Review FSHN 312 Lab Manual
Page 7 of 83
5. Describe why serial dilution of a sample is important for reducing media use in a laboratory. For example, what volume of media would be needed to dilute 100µL of a culture to the 10-8 dilution used in this lab in a single step.
6. What does it mean if some plates have too many colonies on them to count? How would you fix this? What does it mean if a spread plate has none, or too few colonies to count? How would you fix this?

Intrinsic and Extrinsic Properties and their Impact on Microbes FSHN 312 Lab Manual
Page 8 of 83
Lab 2 - Intrinsic and Extrinsic Properties and their Impact on Microbes
Learning Objectives • Give examples of intrinsic and extrinsic factors in a given food • Explain how tolerance or sensitivity to a given intrinsic or extrinsic factor can impact a microbe’s
ability to grow on a food
Background Intrinsic factors are properties that are inherent to the food, and play an important role in the ecology of food microbes. These factors include pH, water activity, osmotic pressure, oxidation-reduction potential, nutrient content, antimicrobial constituents, and biological structures.
Extrinsic factors are properties that are not part of the food, but properties related to the storage and/or packaging of the food. Extrinsic factors also play a role in the ecology of food microbes, and include properties such as temperature, relative humidity, and atmospheric gasses.
The purpose of this lab is to demonstrate how different intrinsic and extrinsic factors impact microbial growth. You will examine the effects of pH, osmotic pressure, and temperature on microbial growth, and the types of microbes that are able to grow under each condition.
Osmotic pressure is the force with which a solvent moves from a solution of low solute concentration to a solution of high solute concentration when the solutions are separated by a semipermeable membrane. In this case, the semipermeable membrane is the cell membrane. A hypotonic solution is when there is a low concentration of solutes outside the cell. Most bacteria can survive this condition, however in very hypotonic solutions some bacteria will die as the cell begins to uncontrollably swell, leading to osmotic lysis of the cell. A hypertonic solution is when there is a higher concentration of solutes outside the cell than within. This can lead to loss of water from the cell causing the cell to shrink and collapse. Many microbes can be affected in this way.
Foods vary by the amount of soluble solutes they contain. Solute used commonly in foods are salts, typically NaCl. Varying concentrations of salt can have dramatic effects on the microbes in a food. When higher concentrations of salt are used in a food, they cause the system to become hypertonic, which can lead to inhibition of growth and decreased survival of many types of microbes. A halophile is a microbe that would survive and grow readily in a hypertonic solution, but would not survive in a hypotonic solution.
pH is a measure of the acidity or alkalinity of a solution. Each type of microbe can grow within a specific pH range, which may be broad or limited, with the most rapid growth occurring within a narrow optimum range. Only a few species of microbes can grow at pH values of less than 2 or greater than 10. Organisms that live at low pH are called acidophiles, organisms that live at high pH are called alkaliphilic.
The pH of foods can vary, and can depend on the type of processing the food undergoes. Foods that are fermented typically have a lower pH than fresh foods. Fruits typically have a lower pH, and the pH of fresh meats is typically around 6. pH also has a dramatic effect on the ability of certain microbes to grow in a food.
Intrinsic and Extrinsic Properties and their Impact on Microbes FSHN 312 Lab Manual
Page 9 of 83
Temperature also has significant effects on microbial growth. The temperature that foods are stored at contributes to the ability of microbes to grow on that food. Microbes can grow at various temperatures, and can be classified based on the temperatures at which they can grow. Psychrophiles can grow at less than -20°C, with optimum growth rates at -20 to 0°C, and maximum temperature tolerance of 15-20°C. Psychrophiles are not common in foods, they are usually found in specialized environments such as artic ice. Psychrotrophs can grow at temperatures as low as 4°C, but their optimal growth occurs at 20-30°C. These microbes can grow at refrigeration temperature, but at a slower rate compared to their optimum growth temperature. Mesophiles can grow over a range of temperature from 20-45°C, with optimal growth from 30 to 40°C. Some mesophiles can survive at low temperature, such as in the refrigerator, but will not reproduce during cold storage. Thermophiles can grow at temperatures over 45°C, with an optimum range of 55 to 65°C. Thermophiles are typically only a problem in foods if the foods are held at temperatures just warm enough for their growth. Thermoduric microbes are a subgroup of mesophilic bacteria whose spores are able to survive high temperature for certain periods of time. The spores will not germinate until temperatures reach the mesophilic growth range, so these microbes are not considered thermophiles. The vegetative forms of these bacteria are not resistant to heat, only their spores.
Materials
Cultures 1 per group Aspergillus niger Bacillus stearothermophilus Escherichia coli Pseudomonas fluorescens Saccharomyces cerevisiae Listeria innocua
Media Plate count agar (7 plates per group) Purple broth base with 1% dextrose and Durham tubes (6 tubes per group) *may change Plate count agar with 10% NaCl (1 plate per group) Plate count agar with 15% NaCl (1 plate per group) Plate count agar with 20% NaCl (1 plate per group) Sabouraud dextrose agar 0% NaCl (1 plate per group) Sabouraud dextrose agar 10% NaCl (1 plate per group) Sabouraud dextrose agar 15% NaCl (1 plate per group) Sabouraud dextrose agar 20% NaCl (1 plate per group) 5mL Trypic soy broth pH 3.0 (5 tubes per group) 5mL Trypic soy broth pH 5.0 (5 tubes per group) 5mL Trypic soy broth pH 6.0 (5 tubes per group) 5mL Trypic soy broth pH 7.0 (5 tubes per group) 5mL Trypic soy broth pH 10.0 (5 tubes per group)

Intrinsic and Extrinsic Properties and their Impact on Microbes FSHN 312 Lab Manual
Page 10 of 83
Foods Brown sugar (5g per group) Ocean fish with skin (11g per group) Plain yogurt (11g per group)
Miscellaneous 99 mL dilution blanks (1 bottle/group) Stomacher bag for fish (1 bag/group) Beaker for putting stomacher bag in after mixing (1 /group) Pipettes and tips 50 mL graduate cylinders (1/group) Balances Water bath at 90oC 4oC incubator space for one basket and one rack 55oC Incubator space for 1 rack Rack, labeled “55oC” Basket, labeled “Refrigerated” Cutting board/sharp knife
Procedures Resistance to osmotic pressures
First day of lab: 1. Each group, pick up one plate of plate count agar with 0, 10%, 15%, and 20% NaCl. 2. Draw a dividing line on the bottom of each plate, to divide the plate in half. 3. Inoculate a single line of E. coli to one-half of each plate and a single of line of L. innocua to the
other half of each plate. 4. Each group, pick up one plate of Sabouraud dextrose agar containing 0, 10%, 15%, and 20% NaCl. 5. Draw a dividing line on the bottom of each plate and inoculate as previously, only this time use S.
cerevisiae (a yeast) and A. niger (a mold) as inoculum. Be careful with the A. niger. Avoid contaminating your plate with loose spores; knock them loose from the inoculating loop on the interior of the tube prior to transfer.
6. Incubate all of the plates, inverted, at RT.
Second day of lab: 1. Compare and record growth of each organism on the different plates.
Impact of pH on growth
First day of lab: 1. Each group, pick up 5 tubes of TSB at each pH (3, 5, 6, 7, and 10; total 25 tubes per group). 2. Each group will need 11g of yogurt. 3. Add to 99 mL of the dilution water, shake for 30 s. 4. Pipet 0.1 mL of the diluted yogurt mixture into one TSB tube at each pH.
a. Inoculate E. coli into one TSB tube at each pH. b. Inoculate B. stearothermophilus into one TSB tube at each pH. c. Inoculate L. innocua into one TSB tube at each pH. d. Inoculate S. cerevisiae into one TSB tube at each pH.
5. Incubate all tubes at room temperature in your locker.

Intrinsic and Extrinsic Properties and their Impact on Microbes FSHN 312 Lab Manual
Page 11 of 83
6. Discard dilution bottle in baskets indicated.
Second day of lab: 1. Observe and record the pHs at which each organism grew. 2. The tubes may be discarded in the basket indicated.
Psychrotrophs and Mesophiles
First day of lab: 1. Each team will need 11 g of the fish sample. 2. Add the fish sample and 99 mL of dilution water to a stomacher bag. Manually mix for 2 min. 3. Each group will need 6 plates of plate count agar for this experiment. 4. Using your inoculating loop, streak the homogenate of fish on two of the plates. Be sure to have
your inoculating loop pass through the foam and into the water phase of the fish sample. 5. Mark the plates for identification with one labeled RT for room temperature, and the other 4oC. 6. On two more plates streak from the E. coli culture – incubate one at RT and one at 4oC. 7. On the final two plates streak from the Pseudomonas fluorescens culture – incubate one at RT and
one at 4oC. 8. Incubate the RT plates in your locker. Place the 4oC plates in a labeled basket for incubation. 9. Discard dilution bottles and stomacher bags in baskets indicated.
Second day of lab: 1. Compare growth on the plates for amount, appearance and general growth rate (slow vs. fast). Make
a note of any differences, such as colony size, texture, color, or obvious odor (do not directly sniff the plates) between treatments.
Thermophiles and Thermoduric Mesophiles
First day of lab: 1. Each group weigh out a 5 g sample of brown sugar. 2. Dissolve the brown sugar in ~20 mL of tap water in a 50 mL falcon tube. 3. Heat in a 90C water batch for 2 min. Allow solution to cool before pipetting. 4. Obtain 6 tubes of purple broth base with 1% dextrose. 5. Pipette 1 mL of the sugar sample into 2 tubes of purple broth base with 1% dextrose (1ml/tube).
Pipettes should be discarded in the waste bag in the bucket on the bench. 6. Incubate 1 tube at 55oC (place in labeled rack), incubate the other in your locker (RT). 7. Inoculate 2 of the other tubes with the E. coli culture – incubate 1 tube at RT and the other at 55oC. 8. Inoculate the last 2 tubes with the Bacillus stearothermophilus culture – incubate 1 tube at RT and
the other at 55oC. 9. The instructor will move the tubes from the 55oC incubator to the cold room on Thursday to prevent
color changes due to prolonged heating.

Intrinsic and Extrinsic Properties and their Impact on Microbes FSHN 312 Lab Manual
Page 12 of 83
Second day of lab: 1. Look for production of acid (yellow) and/or gas in the Durham tube as an indication of growth.
Compare growth (turbidity) in the tubes. 2. The tubes may be discarded in the basket indicated.
Discussion Questions 1. Which microbes are more tolerant to the high salt conditions? What are the implications of the
microbe’s salt tolerance to its ability to survive on foods? 2. What differences did you note between treatments for thermophiles and thermoduric mesophiles?
Which, if any, tubes indicate the growth of thermophiles and which indicate growth of thermoduric mesophiles? What implications does this have for heat processed foods?
3. What intrinsic and/or extrinsic factors are the microbes from the food samples able to grow on? How does this relate to the properties of each food?
Principles of Quantification and Food Contact Surface Testing FSHN 312 Lab Manual
Page 13 of 83
Lab 3 - Principles of Quantification and Food Contact Surface Testing
Learning Objectives • Describe appropriate procedures for collecting food samples for microbiological testing • Describe the purpose of the aerobic plate count and two ways to conduct this test • Calculate the microbial load of a food sample • Explain why food contact surfaces should be tested for the presence of microbes
Background General You will also need to read chapter 3 (Standard Plate Count) and appendix 2 (MPN) from the Food and Drug Administration Bacteriological Analytical Manual (often referred to as the BAM). I recommend reading them online or printing multiple pages per sheet to save on printing. Anyone doing food microbiology in their careers would need these resources. We will use these methods throughout the rest of this semester. For a thorough background and description of quantitative methods in Food Microbiology, you could also read chapters 3, 6, and 7 from the “Compendium of Methods for the Microbiological Examination of Foods" (non-circulating at ACES library).
You will also need to download the 3M reminders for use and interpretation guide for the Petrifilm Aerobic Plate Count films. These can be found on the Compass site (1 document).
The three classical methods available for estimating microbial numbers in foods are:
1. The aerobic plate count (APC), which is sometimes also referred to as the total plate count (TPC), the standard plate count (SPC), the total viable count, the average plate count, or the aerobic mesophilic count. In this class we will call it APC.
2. The most probable number (MPN) technique. 3. The direct microscopic count (DMC).
Keep in mind that there are other methods that can be used in the quantification of microorganisms in foods. For this laboratory exercise we will quantify microorganisms in various food samples and surfaces using variations of APCs and the MPN method.
Aerobic Plate Count The Aerobic Plate Count (APC) is used as an indicator of the bacterial numbers in a food sample. It may also be called the total plate count, standard plate count (usually for dairy products), or mesophilic count. Since not all microorganisms can grow in a single agar medium using a single set of incubation conditions, this method is considered, at best, an estimation of the microbial load of a food. Despite the drawbacks of the method, the plate count remains the standard to which all alternative methods are compared. It is an especially useful method to detect low numbers of microorganisms. Different foods can contain a wide range of concentration of bacteria such that dilutions are made of the food in liquid medium and aliquots are plated onto a solid medium. Each bacterium will multiply to form a visible colony. These numbers are counted and multiplied by the dilution factor to give colony forming units (CFU) per gram or milliliter. Since microorganisms can grow as single cells or as chains, clusters or filaments, the total count should be reported as colony forming units (CFU) per mL or g instead of cells or bacteria per mL or g.

Principles of Quantification and Food Contact Surface Testing FSHN 312 Lab Manual
Page 14 of 83
Total microbial numbers in a food sample can also be estimated by the pour or spread plate methods, spiral plating, or pectin gel plate counts (Petrifilm™ or Redigel™). In today’s lab, we will enumerate microorganisms from foods, by using pour plates, spread plates, and Petrifilm.
In the pour plate method, 1.0 or 0.1 mL of the sample is pipetted into a sterile Petri dish to which tempered agar (45°C) is added. The spread plate method is similar to pour plate method, except that Petri dishes are repoured with agar which is allowed to solidify prior to plating samples. Usually, a 0.1-mL sample is deposited onto the surface of the agar and spread with a sterile disposable plastic spreader. Incubation is performed under the same conditions as for the pour plate method.
In the pectin gel methods (ex: Petrifilm), two plastic films are attached together on one side and coated with culture medium ingredients and a cold-water-soluble jelling agent. To use, 1 mL of diluents is placed between the two films and spread over the nutrient area by pressing with a special spreader.
Following incubation, microcolonies appear red on the film because of the presence of a tetrazolium dye in the nutrient phase. Like the spread plate method, pectin gel methods are particularly useful to estimate the number of bacteria that might be sensitive to the temperatures of molten agar. Since no media preparation is required, pectin gels are easy to use and offer consistent results. However, they are more expensive than traditional methods such as pour plates or spread plates. Several types of pectin gels exist and are used in the food industry, but the most popular are the Petrifilm gels, produced by the 3M Company.
Once a total microbial count has been obtained, it provides an estimate of the viable microorganisms that can grow under the conditions provided (medium, temperature, oxygen concentration, time of (incubation). Colony counts may be affected by numerous factors, including nutrients available in the medium, incubation temperature and time, oxidation-reduction potential, cell injury, and presence of inhibitory substances in the food or medium. The accuracy of the count can be hindered by contamination (often from poor aseptic technique), improper food sampling and dilution preparation, etc. Therefore, it is essential to practice good microbiological techniques to minimize error.
The Most Probable Number (MPN) technique is a serial dilution test used by microbiologists to estimate concentrations of viable microbes when plate-counting methods are not feasible, or when an approximation of total microbes, rather than a total plate count, is sufficient. The MPN method is also useful in cases where microorganisms are present in very low numbers within a food product (less than 250 microorganisms per gram or milliliter of sample), or when food particulate matter may obscure colony counts on agar.
Most Probable Number The MPN technique is commonly used to estimate coliforms in a food product, but is also useful for estimating a general aerobic microbial count. In the MPN method, a food homogenate is decimally diluted to extinction, which means that it is diluted until no microbial growth is evident.
Generally, samples are diluted to 10-4 or 10-5 in a common diluent, unless the food is expected to contain a higher number of microorganisms. Dilutions are used to inoculate MPN tubes containing an appropriate broth medium, and tubes are then incubated at an appropriate temperature and time. After incubation, MPN tubes are examined for signs of microbial growth, and presence or absence of growth is recorded for each tube. Depending on the type of broth medium used and microorganisms present, tubes with positive microbial growth can be identified based on turbidity of the broth, color change if a color indicator was added to the medium, production of gas, production of metabolites or reduction of chemicals.
Principles of Quantification and Food Contact Surface Testing FSHN 312 Lab Manual
Page 15 of 83
After determining the pattern of positive tubes, the MPN/g (or mL) numbers are determined with a MPN table (attached to the end). As with anything involving statistics, as you increase the number of replicates of each dilution the accuracy of the method will improve. We will use three replicates of each dilution (aka: a 3-tube MPN), but in real life, food microbiologists may use more replicates (5-tube or 10-tube MPN) to increase accuracy.
Helpful hints for determining dilution factors: • (Weight or volume of sample + volume of diluent) = Dilution Factor weight or volume of sample
• Examples: 11 g of sample + 99 mL of diluent divided by 11 = a dilution factor of 10
25 g of sample + 225 mL of diluent divided by 25 = a dilution factor of 10 2 mL of sample + 8 mL of diluent divided by 2 = a dilution factor of 5 1 g of sample +99 mL of diluent divided by 1 = a dilution factor of 100 1 mL of sample + 9 mL of diluent divided by 1 = a dilution factor of 10
• Individual dilution factors are multiplicative • Example: 1:10 dilution = 10-1 = 0.1g/ml, if this is further diluted by 1:10 the resulting dilution
is 1:100 = 10-2 = 0.01g/ml o So, the original dilution factor is further multiplied by a factor of 10 from the second dilution.
Helpful hints for interpreting MPN tubes:
• You will have five dilutions with three tubes per dilution. • Select the highest dilution that shows growth and gas production in all three tubes. Then, select
the next two higher dilutions and determine the number of tubes in these dilutions that show growth and gas production. This will give you your three point series. See examples in the BAM’s appendix 2.
• From the series you can use the MPN Table in the appendix or in the BAM’s appendix 2 to determine the MPN/g or mL of a liquid.
• Multiply this value by the appropriate dilution factor if your three dilutions selected for the series are different than 10-1, 10-2, and 10-3.
• Remember that the medium used for this MPN method is selective for coliforms, and that turbidity and gas are both needed to indicate a positive tube. Your results will only quantify coliforms, not overall aerobic counts.
Precision of the MPN Test If the concentration of coliform bacteria in each water sample is 10 per 100ml, then on average you would expect to see 1 coliform per 10 mL sample. However the bacteria are dispersed randomly within the water sample and it is very unlikely that all of the samples tested will have exactly the average number of cells. If the average number of bacteria per sample is one, some samples will have two or three bacteria while others will have zero. In fact, if the average number of bacteria per sample is one, then it is most probable that 37% of the samples will have zero bacteria. Since the MPN test is based on broth cultures, a sample with two or three coliform bacteria will look the same as a culture that is inoculated with only one coliform.
Materials Foods (at least 40 grams or milliliters of each food)
Milk, pasteurized Ground beef
Principles of Quantification and Food Contact Surface Testing FSHN 312 Lab Manual
Page 16 of 83
Paprika Lettuce
Media Plate count agar, tempered to 45C (enough for 6 plates/group) Petri dishes (6/group) Pre-poured plate count agar plates (6-8 plates/group) APC Petrifilm (6/group) Lauryl tryptose broth tubes with Durham tubes (15 tubes/group) + racks (165 x 5ml = 815 + mL)
Miscellaneous
99 mL dilution blanks (1/group) 15 mL Falcon tubes OR Screw cap tubes (4/group) w / 9 mL dilution buffer.
Students will fill, so 250 + mL buffer bottle, 10 mL pipettes, and pipetters Stomacher Stomacher bags (1/group) 600 mL beaker for stomacher bag (1 per group) *we may use paper plates Pipettes and tips Pipettor (1) and 10-25 mL disposable pipettes (3) + waste bin Balances (3), weighing boats (12), spatulas (3) Sterile disposable plastic spreaders (1 package/group) Petrifilm spreaders (1/group) Tape (1/group) Waterbath at 45C
For students to take with them
3M Petrifilm – Aerobic Count Plates (4/person) Swab kits with 4 swabs per person (4/person); Tubes + cotton swab + 10 mL buffer + dropper Petrifilm spreaders (1/person) Ziplock bags to carry materials in
Procedures First Lab Period Read all review material before proceeding. Each group should discuss procedures prior to conducting the experiment. Make sure you are doing proper dilutions and label everything clearly before proceeding.
1. Each group will be assigned one of the food samples to analyze. 2. Weigh out, as aseptically as possible, 11 grams of the sample (the milk sample may be pipetted
instead of weighed; 11g = 11ml). 3. Place the sample into a stomacher bag and pour in a 99 mL dilution blank. For the milk samples,
the 11 mL can be added directly to the 99 mL dilution blank instead of a stomacher bag. Then place the pipette back in the plastic wrap and dispose in the tall biological waste bin.
4. Stomach the sample for 1 minute. The milk samples can be shaken instead. This will be your 10-
1 dilution; same as 0.1g/ml or 1:10. The BAM defines shaking as '25 times in 30 cm (1 ft) arc within 7 s'.
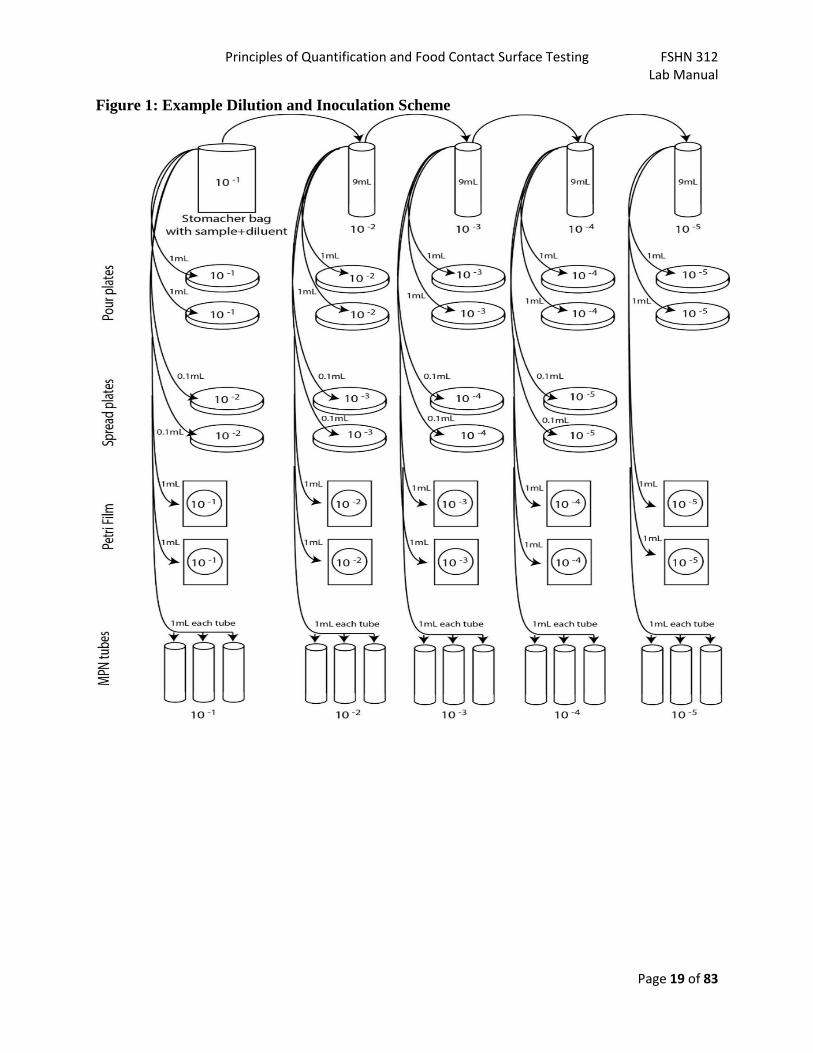
5. Prepare decimal dilutions 10-2, 10-3, 10-4, and 10-5 by transferring 1 mL portions to 9 mL dilution tubes. You need to fill tubes with buffer using the stock and a disposable pipette. When doing dilutions, use a new pipette for each transfer. See the example in Figure 1. These same dilution
Principles of Quantification and Food Contact Surface Testing FSHN 312 Lab Manual
Page 17 of 83
tubes will be used for all methods. Shake the tubes according to BAM. Discard pipettes in the waste buckets on each bench.
6. Set up your plates and tubes and plan your pipetting accordingly. We will be comparing pour plates to spread plates, Petrifilm and the 3-tube MPN method. The pour, spread and Petrifilm plating will be done in duplicate (2 for each dilution) to ensure more accuracy in the results. Use Figure 1 as a guide. Be aware that you are only using three dilutions for the plating, and these dilutions vary depending on the particular food sample you are sampling. If you are not sure what you are doing, ask for clarification.
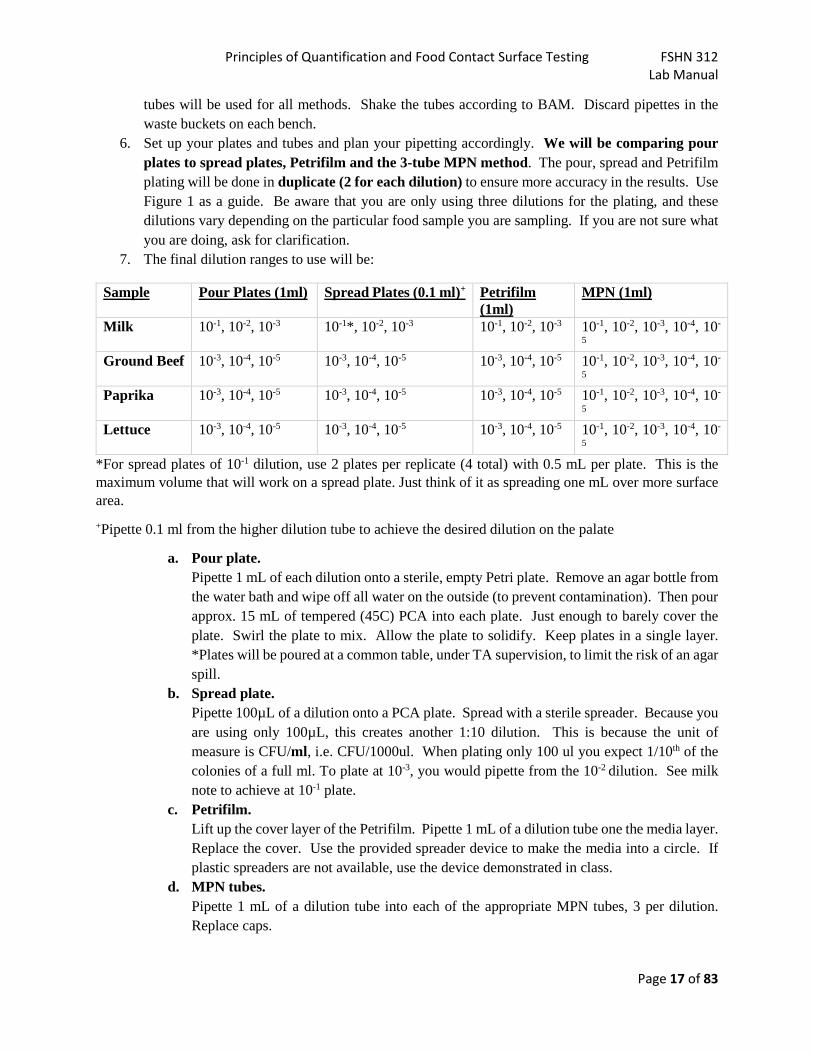
7. The final dilution ranges to use will be:
Sample Pour Plates (1ml) Spread Plates (0.1 ml)+ Petrifilm (1ml)
MPN (1ml)
Milk 10-1, 10-2, 10-3 10-1*, 10-2, 10-3 10-1, 10-2, 10-3 10-1, 10-2, 10-3, 10-4, 10-
5 Ground Beef 10-3, 10-4, 10-5 10-3, 10-4, 10-5 10-3, 10-4, 10-5 10-1, 10-2, 10-3, 10-4, 10-
5 Paprika 10-3, 10-4, 10-5 10-3, 10-4, 10-5 10-3, 10-4, 10-5 10-1, 10-2, 10-3, 10-4, 10-
5 Lettuce 10-3, 10-4, 10-5 10-3, 10-4, 10-5 10-3, 10-4, 10-5 10-1, 10-2, 10-3, 10-4, 10-
5 *For spread plates of 10-1 dilution, use 2 plates per replicate (4 total) with 0.5 mL per plate. This is the maximum volume that will work on a spread plate. Just think of it as spreading one mL over more surface area. +Pipette 0.1 ml from the higher dilution tube to achieve the desired dilution on the palate
a. Pour plate. Pipette 1 mL of each dilution onto a sterile, empty Petri plate. Remove an agar bottle from the water bath and wipe off all water on the outside (to prevent contamination). Then pour approx. 15 mL of tempered (45C) PCA into each plate. Just enough to barely cover the plate. Swirl the plate to mix. Allow the plate to solidify. Keep plates in a single layer. *Plates will be poured at a common table, under TA supervision, to limit the risk of an agar spill.
b. Spread plate. Pipette 100µL of a dilution onto a PCA plate. Spread with a sterile spreader. Because you are using only 100µL, this creates another 1:10 dilution. This is because the unit of measure is CFU/ml, i.e. CFU/1000ul. When plating only 100 ul you expect 1/10th of the colonies of a full ml. To plate at 10-3, you would pipette from the 10-2 dilution. See milk note to achieve at 10-1 plate.
c. Petrifilm. Lift up the cover layer of the Petrifilm. Pipette 1 mL of a dilution tube one the media layer. Replace the cover. Use the provided spreader device to make the media into a circle. If plastic spreaders are not available, use the device demonstrated in class.
d. MPN tubes. Pipette 1 mL of a dilution tube into each of the appropriate MPN tubes, 3 per dilution. Replace caps.
Principles of Quantification and Food Contact Surface Testing FSHN 312 Lab Manual
Page 18 of 83
8. When pipetting from the dilutions to the plates and MPN tubes, you can do it all with one pipette. Start with the most dilute sample (10-5) and work back up to the most concentrated. Think: why this is OK? If the pipette should become contaminated at any point, be sure to replace it with a sterile one.
9. After all plates and tubes are inoculated and the pour plates are thoroughly solidified, the inoculated items should be gathered where labeled at the supply stations. These will be incubated at 30oC for 48 h, then placed at refrigeration until the next lab period. Be sure the petri plates are inverted to prevent colony spreading from condensation droplets on the lids. Make sure to tape each stack of plates and label the tape with your group.
10. Stomacher bags, disposable plastic spreaders, and other plastics may be discarded. Petrifilm spreaders and glassware should be returned for reuse.
11. Each person will do analysis of a food-contact surface on their own time, on their own food-contact surface. Pick up 4 Petri Film, 1 Petri film spreader and Swabs per team member. Collect in a Ziploc bag. You will take these with you.
12. Select two different food contact surfaces to test in your home or other food preparation area. Test both surfaces before and after cleaning.
13. Swab sampling method a. Using the wet-swab method, swab a 4 in2 area of the contact surface (2'x2' square). Use
one swab prior to cleaning and the other on the same surface, but a different 4 in2 area after cleaning.
b. After swabbing, place the swab back into the tube with the buffer and shake vigorously for 10 seconds to remove microbes from the swab.
c. Use a dropper to transfer 1 mL of liquid onto a PetriFilm plate, cover, and spread. d. Dispose of the sampling materials in the regular trash. At this point you have not enriched
any microbes, so they are not at any increased safety risk. e. Incubate the Petrifilm for at least 48h at room temperature at home. Bring to class in Ziploc
bag.
Principles of Quantification and Food Contact Surface Testing FSHN 312 Lab Manual
Page 19 of 83
Figure 1: Example Dilution and Inoculation Scheme
Principles of Quantification and Food Contact Surface Testing FSHN 312 Lab Manual
Page 20 of 83
Second Lab Period 1. Count all plates and interpret MPN tubes. After interpretation, plates and Petrifilms should be
discarded in the large biological waste bags. MPN tubes should be retained for follow up confirmation testing in the second part of this lab.
2. Enter results (final counts and MPNs) on board and record class results - you will need to show and discuss the class results in your lab report.
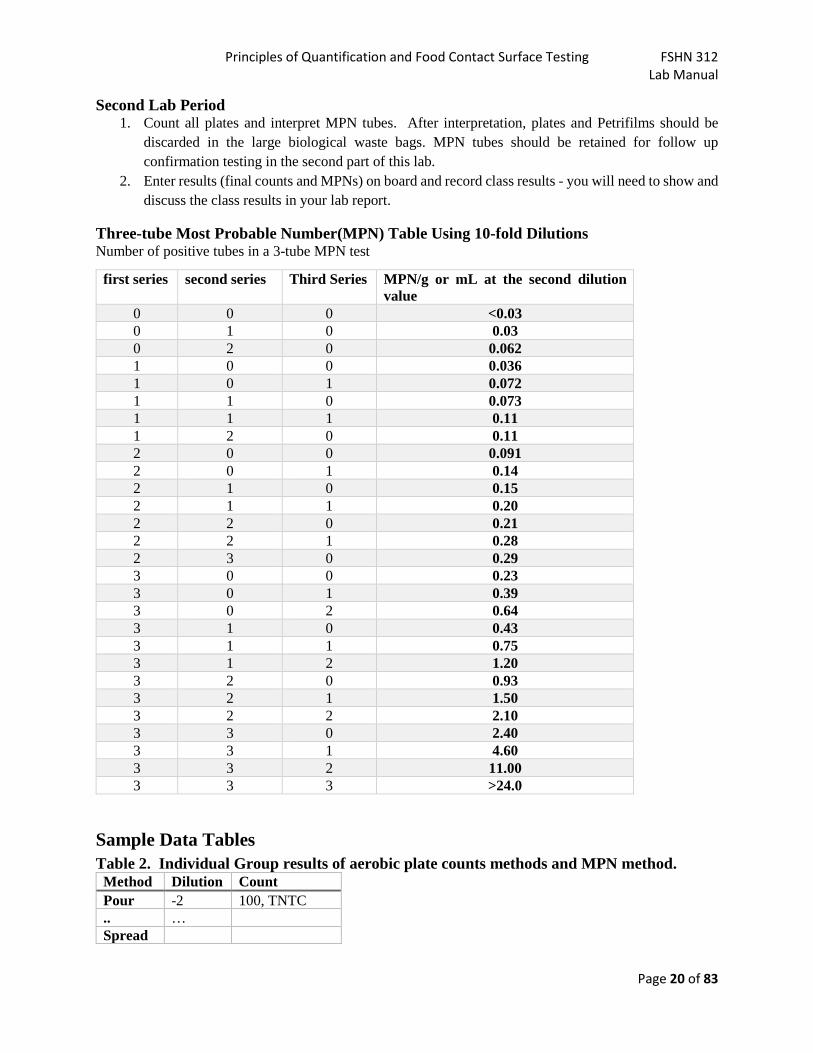
Three-tube Most Probable Number(MPN) Table Using 10-fold Dilutions Number of positive tubes in a 3-tube MPN test
first series second series Third Series MPN/g or mL at the second dilution value
0 0 0 <0.03 0 1 0 0.03 0 2 0 0.062 1 0 0 0.036 1 0 1 0.072 1 1 0 0.073 1 1 1 0.11 1 2 0 0.11 2 0 0 0.091 2 0 1 0.14 2 1 0 0.15 2 1 1 0.20 2 2 0 0.21 2 2 1 0.28 2 3 0 0.29 3 0 0 0.23 3 0 1 0.39 3 0 2 0.64 3 1 0 0.43 3 1 1 0.75 3 1 2 1.20 3 2 0 0.93 3 2 1 1.50 3 2 2 2.10 3 3 0 2.40 3 3 1 4.60 3 3 2 11.00 3 3 3 >24.0
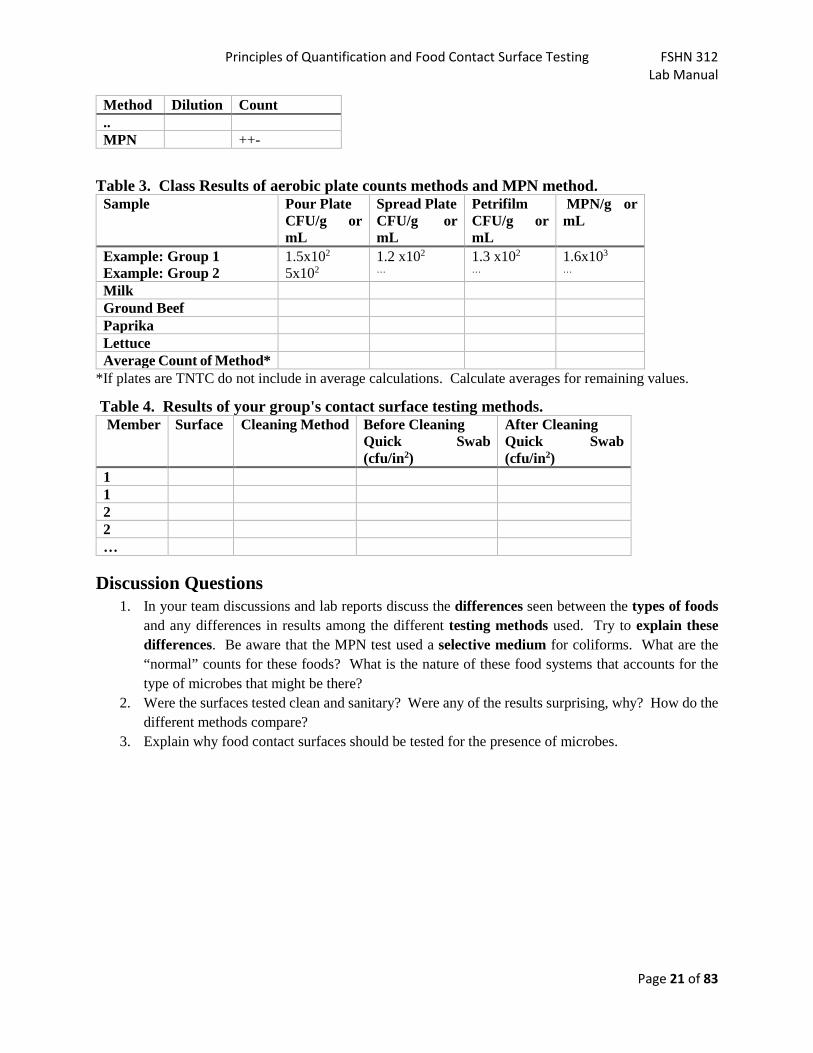
Sample Data Tables Table 2. Individual Group results of aerobic plate counts methods and MPN method.
Method Dilution Count Pour -2 100, TNTC .. … Spread
Principles of Quantification and Food Contact Surface Testing FSHN 312 Lab Manual
Page 21 of 83
Method Dilution Count .. MPN ++-
Table 3. Class Results of aerobic plate counts methods and MPN method. Sample Pour Plate
CFU/g or mL
Spread Plate CFU/g or mL
Petrifilm CFU/g or mL
MPN/g or mL
Example: Group 1 Example: Group 2
1.5x10² 5x10²
1.2 x10² …
1.3 x10² …
1.6x10³ …
Milk Ground Beef Paprika Lettuce Average Count of Method*
*If plates are TNTC do not include in average calculations. Calculate averages for remaining values.
Table 4. Results of your group's contact surface testing methods. Member Surface Cleaning Method Before Cleaning
Quick Swab (cfu/in2)
After Cleaning Quick Swab (cfu/in2)
1 1 2 2 …
Discussion Questions 1. In your team discussions and lab reports discuss the differences seen between the types of foods
and any differences in results among the different testing methods used. Try to explain these differences. Be aware that the MPN test used a selective medium for coliforms. What are the “normal” counts for these foods? What is the nature of these food systems that accounts for the type of microbes that might be there?
2. Were the surfaces tested clean and sanitary? Were any of the results surprising, why? How do the different methods compare?
3. Explain why food contact surfaces should be tested for the presence of microbes.
Coliform Follow-Up FSHN 312 Lab Manual
Page 22 of 83
Lab 4 - Coliform Follow-Up
Learning Objectives In this lab, you will follow up on the quantification and surface testing lab MPN work. Here you will extend the presumptive coliform count to learn more about coliforms, fecal coliforms, and E. coli.
• Describe differences between coliforms, fecal coliforms, and specific coliform species like E. coli. • Perform methods to detect and enumerate fecal coliforms in water and food samples. • Evaluate how and why various coliform counts might be used in microbial specifications
Background The Indicator Concept In the broadest sense, the term indicator organisms can refer to any group of organisms whose presence or absence tells you something about the sample where they were found. In food microbiology, we are interested in indicator organisms whose presence in foods indicates exposure to conditions that might introduce pathogens or allow proliferation of pathogens in the food sample. Pathogens themselves are not routinely enumerated in foods because they are often present in small numbers or in an injured state and because the methods for their detection are relatively complex and expensive. Also, we want to identify food samples which have been mishandled in a way that creates a risk of pathogen contamination or growth. Only a few of these samples actually contain pathogens; if pathogens were enumerated directly, many instances of improper handling would not be detected. Therefore, nonpathogenic sanitary indicator organisms are used in the assessment of food safety.
Indicator organisms have been used most extensively in water analysis. It is known that major pathogens which can be transmitted by water such as Vibrio cholerae and Salmonella typhi find their way into water through contamination with human or animal feces. Therefore, an indicator organism whose presence indicates fecal contamination would be highly desirable. Such an indicator should have the following properties:
• It should be present only in feces or fecally-contaminated materials; the intestines should be its only normal habitat.
• It should be present in feces in large enough numbers for easy detection, even in very dilute samples. • It should survive in water at least as long as enteric pathogens do. • It should be detectable by rapid, inexpensive, reliable methods.
Coliforms, Fecal Coliforms, and E. coli The coliform group of bacteria is defined as those aerobic and facultative anaerobic, gram-negative, non-sporeforming rods which ferment lactose with acid and gas production at 32-37oC. The coliform group has been used extensively as a sanitary indicator in water analysis. However, it has been shown that not all coliforms are of exclusively fecal origin. The coliform group includes both Escherichia coli, a species which is found only in the intestines of warm-blooded animals, and others such as Enterobacter aerogenes, a species which is widely distributed in enteric and non-enteric habitats and is a common contaminant of plants. A more specific indicator of fecal pollution is the "fecal coliform" group. Fecal coliforms are defined as those coliforms which can produce acid and gas from lactose at higher temperatures such as 45.5 C (the exact temperature varies for different methods). An even more specific indicator of fecal pollution is the single species, E. coli. However, since it takes several days longer to confirm the

Coliform Follow-Up FSHN 312 Lab Manual
Page 23 of 83
identity of E. coli than it does to count total or fecal coliforms, these less specific indicators must often be used in practical situations.
Fecal Coliform Bacteria Fecal coliforms are defined as any Gram-negative, facultative anaerobic bacteria that can ferment lactose and produce acid and gas within 48 hours when incubated at 43-45°C.
The definition of fecal coliform bacteria goes beyond Escherichia coli to include several other species that are also common facultative inhabitants of mammalian intestines, such as Enterobacter aerogenes and Klebsiella pneumoniae that ferment lactose. According to Bergey's manual of Determinative Bacteriology (9th ed.), of 115 species of bacteria in the family Enterobacteriaceae, 25 are scored as+ for fermenting lactose, 55 are-, 4 are[+], 10 are[-], 18 are scored as "d", and no data is available for 3.
Fecal coliforms are bacteria that live in the digestive tract of warm-blooded animals (humans, pets, farm animals, and wildlife) and are excreted in the feces. In themselves, fecal coliforms generally do not pose a danger to people or animals but they indicate the possibility of presence of other disease-causing bacteria and viruses, such as those that cause typhoid, dysentery, hepatitis A, gastroenteritis, and cholera.
Unlike fecal coliforms, disease-causing bacteria generally do not survive long enough in the water, outside the body of animals, to be detected. This makes their direct monitoring difficult. So scientists and public health officials consider the presence of fecal coliforms an indicator of disease bacteria in the water.
The Use of Coliforms as Indicator Organisms in Food Analysis. The methods originally developed for the detection of coliforms in water have been adapted for use in food analysis. However, some caution must be exercised in transferring these procedures from water to foods since these two environments differ in several important properties which may limit the significance of coliform counts or affect their interpretation. Five of these properties are described below.
1. Some important foodborne pathogens including Salmonella and Shigella are introduced into foods by fecal contamination. The risk of their presence could be estimated by counts of E. coli or fecal coliforms. However, other important pathogens including Staphylococcus aureus and Vibrio parahaemolyticus are introduced into foods by other routes and tests for fecal contamination would not be expected to measure the risk of their presence.
2. Water generally does not support the growth of coliform organisms but these organisms can grow in many foods. Therefore, the presence of substantial numbers of coliforms in foods that support bacterial growth may indicate either that substantial contamination has occurred or that a small amount of contamination has occurred, followed by growth of the coliforms.
3. Coliforms are not heat-resistant organisms. Many foods are subjected to processing treatments such as the pasteurization of milk which destroy coliforms.
4. Many food processing treatments can injure coliform bacteria. Since coliform detection procedures involve the use of highly selective media, injured coliforms may not be detected by these procedures.
5. Although coliforms generally survive longer than enteric pathogens in water (this is one of the properties that makes them good indicators), this is not necessarily true in foods. There is evidence that pathogens may persist after E. coli is destroyed in frozen foods, in refrigerated foods, and in the presence of certain sanitizing agents.
The fact that some foodborne pathogens are not of fecal origin is an important limitation of coliform analyses. Coliform counts are useful as an indicator of certain types of poor sanitation only; they are not a
Coliform Follow-Up FSHN 312 Lab Manual
Page 24 of 83
universal indicator of food safety. While high coliform counts usually indicate that some kind of problem is present, low coliform counts do not guarantee food safety since some types of potentially dangerous conditions such as contamination with staphylococci or exposure to conditions which allow pathogenic anaerobes to grow are not reflected by coliform counts.
The ability of coliforms to grow in foods is an important consideration in the interpretation of coliform counts of foods. High coliform counts in foods may result from either contamination or growth. Both contamination and growth are indicators of undesirable situations. Contamination of a food with coliforms particularly fecal coliforms indicates that the food has been exposed to unsanitary conditions. Growth of coliforms indicates that the food has been held at unsafe temperatures. Foodborne pathogens also grow well at these temperatures. Therefore, coliform growth in perishable foods indicates that the food has been unsafely held in conditions which could allow pathogen proliferation. When high coliform counts are found in foods which can support bacterial growth, further investigations must be made to find out whether contamination or growth was responsible and to locate the specific problem responsible for the high counts.
The destruction of coliforms by food processing treatments affects the way that coliform counts are used in the analysis of processed foods. In the analysis of raw foods, the presence of fecal coliforms indicates contamination and/or improper storage of the raw food. In the analysis of foods such as pasteurized milk which have been subjected to a processing treatment which should have destroyed all coliforms, coliform counts cannot be used to detect fecal contamination. Instead, coliform counts are used to detect the following undesirable situations:
1. Post-processing recontamination of the food. 2. Insufficient heat treatment. 3. Extreme contamination of the raw food with such large numbers of bacteria that detectable numbers
of cells would survive the heat treatment.
Coliform counts on processed foods are carried out to detect these conditions not to measure fecal contamination. For instance, coliform counts of pasteurized milk are done primarily to detect post- pasteurization recontamination. (There are easier ways to detect insufficient pasteurization and gross contamination of raw milk.) Because the fecal or non fecal nature of the organisms detected is not important under these circumstances, total coliform counts are used and the more time-consuming methods for the detection of fecal coliforms or E. coli are not necessary. In fact, in some parts of the world, methods even less specific than the total coliform counts such as counts of the whole family Enterobacteriaceae are used in the examination of heat-processed foods.
The problem of metabolic injury is important in coliform enumeration just as it is in many other procedures. New methods have been developed which incorporate repair periods into coliforms enumeration procedures. Such repair methods should be used when coliform enumerations are performed on highly processed foods.
The observation that coliforms may be less resistant to certain types of food processing treatments than pathogens seriously limits the usefulness of coliform counts in the sanitary evaluation of some types of foods particularly frozen foods. One requirement of a good indicator organism is that it must survive in the environment to be examined at least as long as the related pathogens do. In frozen foods, coliforms do not meet this requirement and other indicator organisms are preferable. These other indicators are discussed below.

Coliform Follow-Up FSHN 312 Lab Manual
Page 25 of 83
Sanitary Indicator Organisms Other Than Coliforms Many organisms other than coliforms have been suggested as indicators of food safety. For instance, the presence of mesophilic bacilli in canned foods has been suggested as an indicator of insufficient heat processing. Staphylococci have been suggested as indicators of contamination of food by food handlers. Anaerobic mesophilic counts have been suggested as an indicator of the risk that a food has supported the growth of Clostridium perfringens. However, the two most important indicators other than coliforms are aerobic plate counts (APC) and enterococci.
The "total" aerobic plate counts of food products reflect the handling history, age, and sanitary quality of the foods. In several studies, it has been shown that the APC is the most useful indicator of the sanitary quality of many types of foods particularly in those cases where the effects of processing treatments on more specific indicators such as coliforms are not known.
The enterococci are also useful as sanitary indicators in foods. Enterococci, which are found in substantial numbers in the feces of warm-blooded animals, have been suggested frequently as possible indicators of fecal contamination of water and foods. However, like the total coliform group, enterococci are also found in non-enteric habitats and are, therefore, less useful as fecal indicators in water analysis than fecal coliforms or E. coli. However, in the analysis of some foods, they are better indicators than coliforms because they are more resistant to processing treatments, particularly freezing. Enterococci, unlike coliforms, survive longer than enteric pathogens in frozen foods. For this reason, they are the most reliable indicators of the sanitary quality of frozen foods by many workers despite their limited specificity. Enterococci are also relatively resistant to chilling and desiccation; therefore, they may also be good sanitary indicators in dried, condensed, and refrigerated foods.
Methods Used in Coliform Enumeration
Liquid Enrichment Procedure The standard liquid enrichment procedure for the detection of coliforms, fecal coliforms, and E. coli consists of a series of Most Probable Number determinations in selective liquid media. The media used contain lactose as their fermentable sugar; since coliforms produce gas from lactose, gas production represents a positive test. Growth without gas production or no growth at all represents a negative test. In addition to lactose, these media contain selective agents which coliforms can tolerate but many competing organisms cannot. These agents include detergents such as sodium lauryl sulfate, bile salt preparations such as oxgall, and dyes such as brilliant green.
The liquid enrichment procedure starts with the presumptive test for total coliforms. This test consists of an MPN enumeration of gas producers in lauryl sulfate tryptose (LST) broth. Following this test, there are two options. If you are interested in total coliforms, you can go on to the confirmed test for total coliforms which consists of another MPN enumeration in brilliant green lactose bile (BGLB) broth. Or, if you are interested in finding out if your coliforms are of fecal origin, you can proceed to the elevated temperature test for fecal coliforms which is an MPN enumeration in EC broth (EC stands for E. coli) at 45.5 C. If you need to detect the single species, E. coli, you must streak plates of a selective medium from the EC broth tubes and then perform biochemical tests on cultures that you have isolated from single colonies. (As you undoubtedly realize by now, biochemical tests cannot be performed on impure cultures. The MPN cultures from the fecal coliform test are far from pure.) If you trace the number of days needed to perform the completed tests for E. coli, you will see why time considerations often make this test impractical.

Coliform Follow-Up FSHN 312 Lab Manual
Page 26 of 83
Overview Flowchart
Figure. Summary of most probable number methods for total coliforms, fecal coliforms, and Escherichia coli. Sourced from Jay, J. M., M. J. Loessner, and D. A. Golden. 2008. Modern Food Microbiology. p477. Which reprinted from Jay, J.M. (2001). Indicator organisms in foods. In Foodborne Disease Handbook, Vol. 1, eds. Y.H. Hui, J.R. Gorham, K.D. Murrell, and D.O. Cliver, 537–546. Marcel Dekker, Inc., New York
Colilert The EPA approved Colilert system is designed to take the place of the Lauryl Sulfate tryptose broth in the MPN coliform (indicator organism) method. Each tube contains 0-nitrophenyl-B-d-galactopyranoside (ONPG), Mug (4-methylumbelliferyl-B-d-glucuronide), and nutrients to support the growth of the bacteria within the tube. It is routinely being used to determine the water quality of potable water. Five tubes are set up, and 10 mL of the water to be tested is added to each tube. The tubes are incubated at 35oC for 24 h when they are then observed for fluorescence (indicative of E. coli presence) and or yellow color production (indicative of a nonfecal lactose fermenter such as E. aerogenes). If neither is present, the tubes are re-incubated for an additional 24 h when they are observed again. At 48 h, if no fluorescence or yellow color is observed, the water sample is negative for coliform contamination.
The basis behind the fluorescence and yellow color production is as follows: The enzyme - glucuronidase, produced by E. coli reacts with the Mug reagent to cleave a fluorescent compound (4- methylumbelliferone) that can be detected by holding the reaction tube under a long wave length UV light. If the compound is present the tube contents will glow a blue-green color. The yellow color production is based on the reaction of lactase (-galactosidase) produced by the microbe with ONPG. The cleaved ONPG produces a yellow color compound (0-nitrophenol) which is visible to the naked eye. All coliforms by definition, even E. coli, are lactose fermenters; therefore, a water sample contaminated with E. coli would produce a yellow color
Completed test for E. coli. Biochemical testing, such as IMViC

Coliform Follow-Up FSHN 312 Lab Manual
Page 27 of 83
and fluorescence when tested by the Colilert method. A water sample contaminated with E. aerogenes, on the other hand, would only produce the yellow color when tested by this method.
After determining the number of tubes producing fluorescence or yellow color, you then take those numbers to a statistical table to determine the number of organisms/100 mL of water sampled.
Solid Medium Procedure for Coliform Enumeration If you want to detect coliforms but do not need to distinguish fecal from non-fecal coliforms, you can use plating methods as an alternative to the MPN enumeration method described above. Many selective plating media have been developed for coliforms. The medium that has found the most use in food analysis is Violet Red Bile Agar (VRBA). This medium contains a bile salts mixture and crystal violet as selective agents, lactose as the only fermentable sugar, and the pH indicator, neutral red. The medium is used in a pour-plate procedure with an agar overlay added to prevent colonies from spreading. On this medium, coliform colonies are purplish-red because coliforms produce acid from lactose and turn the pH indicator red. A reddish zone of precipitated bile characteristically surrounds the colonies. Some other types of organisms may produce colonies on this medium, but these do not have the characteristic appearance of coliform colonies.
Biochemical Identification To confirm that a positive MPN tube really contains fecal coliforms, such as Escherichia coli, one must perform some additional tests that allow you to distinguish between genuine intestinal coliforms and non-fecal coliforms that are capable of growing on rotting plant matter. Bacteria that thrive in mammalian intestines are able to survive and grow at temperatures up to 45°C while soil dwelling coliforms are usually not so tolerant of temperatures above 43°C. There are also specific biochemical tests that can be used to distinguish between Escherichia coli vs. Enterobacter aerogenes and similar non-fecal coliforms.
The FDA BAM manual indicates performing a classic panel of biochemical tests to complete the MPN test for E. coli. These tests are:
• Indole Production • Methyl red reaction • Voges-Proskauer (VP) test for acetoin production • Citrate utilization
Collectively, these are referred to as the IMViC test, for the four reactions, respective. Patterns of ++-- or -+-- are both considered positive, for E. coli biotypes 1 and 2, respectively. A completed test for E. coli should also confirm gas production within 48 h at 35°C (which was done in the presumptive MPN test), and should show Gram-negative, non-sporeforming rods under microscopic examination.
Since we do not have access to microscopes for this lab, we cannot do the Gram stain or verify the rod shape. If you have not done a Gram stain recently, please review this virtual lab: http://virtuallabs.nmsu.edu/stain.php. This will go through the methods and provide typical images.
Fermentation of Specific Sugars – Such as lactose All of the bacteria in the Enterobacteriaceae family can ferment glucose. To ferment a sugar other than glucose or fructose usually requires some extra enzymes beyond those that are needed for glycolysis. For instance, the fermentation of lactose requires β-galactosidase, an enzyme that cleaves lactose to make glucose and galactose. The glucose can then be broken down by glycolysis. Some Enterobacteriaceae have
Coliform Follow-Up FSHN 312 Lab Manual
Page 28 of 83
β-galactosidase, but others do not. One way to determine if a bacterium produces β-galactosidase is to use lactose fermentation broth.
Lactose fermentation broth contains amino acids and vitamins and lactose, but no other sugars. If a bacterium can break down lactose to produce energy they will do so and in the process, they will produce acidic waste products. If the bacterium cannot break down lactose, they will have to break down amino acids to produce energy.
When bacteria break down amino acids they produce basic waste products. The broth also contains some pH indicator dye such as brom-thymol blue or phenol red. Phenol red turns yellow in the presence of acid but stays red if the medium becomes more basic. So, a bacterium that ferments lactose turns the medium yellow while a bacterium that does not ferment lactose can grow, but will not tum the medium yellow. One can use bromothymol blue (BTB) for a pH indicator. BTB is blue when the pH is alkaline and yellow when the solution is acidic.
Other carbohydrate fermentation broths are similar, differing only in the specific sugar that is used.
An uninoculated tube of a carbohydrate fermentation broth is green and translucent, not cloudy. The medium is inoculated with the bacterium and incubated for 24 – 48 hours at an appropriate temperature (usually 37 C). Growth of the bacterium will turn the medium cloudy. If the bacterium can ferment the carbohydrate, the medium turns yellow due to acid production. If the bacterium cannot ferment the carbohydrate the medium will remain green, sometimes turning a deeper shade of blue. If the bacterium does not grow on the medium, it is an invalid test. Some carbohydrates commonly used include: sucrose, lactose, mannitol, xylose and arabinose, but many different carbohydrates can be used.
Our initial MPN tubes relay on lactose fermentation to count as positive. Strict FDA BAM protocol requires re-inoculation into lactose broth to confirm gas production.
Indole Production Inoculate tube of tryptone broth and incubate 24 ± 2 h at 35°C± 0.5°C . Test for indole by adding 0.2-0.3 mL of Kovacs' reagent. Appearance of distinct red color in upper layer is positive test.
Voges-Proskauer test Inoculate tube of MR-VP broth and incubate 48 ± 2 h at 35°C± 0.5°C. Transfer 1 mL to 13 × 100 mm tube. Add 0.6 mL α-naphthol solution and 0.2 mL 40% KOH, and shake. Add a few crystals of creatine. Shake and let stand 2 h. Test is positive if eosin pink color develops.
Methyl-red test After VP test, incubate MR-VP tube additional 48 ± 2 h at 35°C± 0.5°C. Add 5 drops of methyl red solution to each tube. Distinct red color is positive test. Yellow is negative reaction.

Coliform Follow-Up FSHN 312 Lab Manual
Page 29 of 83
Simmons Citrate test: Agar and Broth Traditional testing uses Simmon’s Citrate Agar. The only carbon source in Simmon's citrate agar is citric acid. Citric acid is a Kreb's cycle intermediate so bacteria in the Enterobacteriaceae family can break it down to yield energy or to make other organic compounds, but many species are not able to transport citrate into the cell. The medium contains a pH indicator dye that is yellow when acidic and blue when it is basic. The medium has been titrated to have a pH that is near the pKa of the indicator, so it starts out green. A small change in pH either up or down can cause a color change. In addition to citric acid, the medium contains dibasic sodium phosphate. If the bacterium can absorb and break down the citric acid, removal of the acid will cause the pH to go up because dibasic sodium phosphate is a base. This causes the medium to tum blue.
Caution. In most of these biochemical tests the medium supports the growth of both positive and negative species. If a bacterium does not grow on the medium, because of a lack of a vitamin or an improper inoculation technique, it is not proper to assume that the bacterium lacks the enzyme that you are testing for. If they don't grow, you can't say they are either negative or positive. In most tests you have visible growth of the bacteria even in the negative tests to let you know that you did inoculate the medium properly. However, bacteria that cannot absorb citrate won't grow on Simmon's citrate agar because there is no other source of carbon. A negative test looks like an uninoculated tube. Improper inoculation technique can give a false negative result in the citrate test.
We will use a broth test. Rather than look for a pH indicator change, we instead will simply score each tube for growth (via. turbidity). As with the previous concerns about inoculation, poor inoculation technique can create a false negative. Will we overcome this challenge by inoculating a positive and negative control.
Materials Second lab period
BGLB broth in bottles, for filling tubes EC medium broth in bottles, for filling tubes Sterile screw cap tubes with Durham tubes, 2 per gassing LST tube Inoculation loops Pipettors and 5-25 mL pipettes Racks for 35C and 44.5C incubation Between second and third lab (instructor) L-EMB agar, 2 plates per groups Loops + and – control cultures

Coliform Follow-Up FSHN 312 Lab Manual
Page 30 of 83
Third lab period Tryptone Broth – for indole test, in small bottles MR/VP broth – for MR and VP test, in small bottles Koser’s citrate both, in small bottles, or agar, in tubes 15 mL tubes, 9 per group Inoculation loops 35°C incubators Pipettors and 5-25 mL pipettes
Fourth lab period
Kovack’s reagent – for indole test, in small bottles Alpha-naphthol and 40% KOH – for VP test, in small bottles Later: methyl red solution, in small bottles. P1000 pipettors and tips
Procedures Second lab period: Confirmed MPN Tests
1. Your group will prepare the culture tubes for the confirmed and fecal coliform MPN tests. Count the number of presumptive positive LST broth tubes (gassing); if you have no positives, pick another group to duplicate. For each positive tube, gather two sterile empty tubes. Fill one with 5 mL BGLB broth and one with 5 mL EC broth, using a pipettor and disposable pipette.
2. From all gassing LST tubes, transfer a loopful of suspension to a tube of BGLB broth, avoiding pellicle (biofilm layer at top of tube) if present. Return tubes to supply table rack labeled for incubation at 35°C. BAM follow-up: ‘Incubate BGLB tubes at 35°C± 0.5°C and examine for gas production at 48 ± 3 h. Calculate most probable number (MPN) of coliforms based on proportion of confirmed gassing LST tubes for 3 consecutive dilutions.’
a. Check your understanding, what does this enumerate? [Coliforms, fecal coliform, E. coli] 3. From all gassing LST tubes, transfer a loopful of suspension to a tube of EC medium, avoiding
pellicle if present. Return tubes to supply table rack labeled for incubation at 44.5°C. BAM follow-up: ‘Incubate EC tubes 24 ± 2 h at 45.5 °C and examine for gas production. If negative, re-incubate and examine again at 48 ± 2 h. Use results of this test to calculate _____ MPN.’
a. Check your understanding, what does this enumerate?
Between Labs BAM follow-up: ‘To perform the completed test for E. coli, gently agitate each gassing EC tube, remove a loopful of broth and streak for isolation on a L-EMB agar plate and incubate for 18-24 h at 35°C± 0.5°C’
On Tuesday, Dr. Stasiewicz or a TA will streak at least 1 gassing EC tube for each group onto L-EMB agar. We will also include a positive control (E. coli K12) and a negative control (an Enterobacter).
Third Lab Period: E coli Confirmation Tests 1. Examine BGLB and EC medium tubes for growth.
a. Use results to calculate confirmed and fecal coliform MPN. 2. Gather sufficient sterile tubes. Label for each media, and if they are the test strain or +/- control.
Coordinate with other groups to fill with 5 mL media.
Coliform Follow-Up FSHN 312 Lab Manual
Page 31 of 83
3. Examine your streak plates looking for well isolated coliform colonies. Use those well-isolated colonies to perform the required IMViC test
a. Indole production. Inoculate tube of tryptone broth and incubate 24 ± 2 h at 35°C ± 0.5°C. BAM follow-up: ‘Test for indole by adding 0.2-0.3 mL of Kovacs' reagent. Appearance of distinct red color in upper layer is positive test.’
i. You will need to fill 3 sterile tubes with 5 mL media. One for your test colony, and one each for the + and – controls.
b. Voges-Proskauer (VP)-reactive compounds. Inoculate tube of MR-VP broth and incubate 48 ± 2 h at 35°C± 0.5°C. BAM follow-up: ‘Transfer 1 mL to 13 × 100 mm tube. Add 0.6 mL α-naphthol solution and 0.2 mL 40% KOH, and shake. Add a few crystals of creatine. Shake and let stand 2 h. Test is positive if eosin pink color develops.’
i. You will need to fill 3 sterile tubes with 5 mL media. One for your test colony, and one each for the + and – controls.
c. Citrate. Lightly inoculate tube of Koser's citrate broth; avoid detectable turbidity. Incubate for 96 h at 35°C± 0.5°C. BAM follow-up ‘Development of distinct turbidity is positive reaction.’
i. You will need to fill 3 sterile tubes with 5 mL media. One for your test colony, and one each for the + and – controls.
d. Gas from lactose. Inoculate a tube of LST and incubate 48 ± 2 h at 35°C± 0.5°C. BAM follow-up: ‘Gas production (displacement of medium from inner vial) or effervescence after gentle agitation is positive reaction.‘
i. We will likely kip this step, since we have previously confirmed gas production with the day 1 results. The reason this is included is that the presumptive coliform work with LST tubes contain mixed cultures, so it is possible the organism that ferments the lactose in day 1 is not the same organism that was isolated and picked from the L-EMB plate.
Fourth Lab period 1. As appropriate, follow up on your biochemical tests (as per BAM).
a. Indole production. Test for indole by adding 0.2-0.3 mL of Kovacs' reagent. Appearance of distinct red color in upper layer is positive test.
b. Voges-Proskauer (VP)-reactive compounds. Transfer 1 mL to 15 mL plastic tubes. Add 0.6 mL α-naphthol solution and 0.2 mL 40% KOH, and shake. Add a few crystals of creatine (optional, likely will not be available). Shake and let stand 2 h (until end of class). Test is positive if eosin pink color develops.
c. Methyl red-reactive compounds. After VP test, incubate MR-VP tube additional 48 ± 2 h at 35°C± 0.5°C.
i. Next lab session. Add 5 drops of methyl red solution to each tube. Distinct red color is positive test. Yellow is negative reaction.
d. Citrate. Check for development of distinct turbidity, a positive reaction. Technically this requires 96 h, so if not turbid, check again the follow lab session.
2. Record all available results in your lab notebook a. Generate tables to record the data you are waiting on
3. Determine what results you would expect for an E. coli biotype 1 culture.
Coliform Follow-Up FSHN 312 Lab Manual
Page 32 of 83
a. These results should tell you if E. coli bacteria is included among the organisms that comprise your fecal coliform and confirmed coliform count.
Discussion Questions 1. In this lab you used three different sets of fermentation broth tubes to determine presumptive,
confirmed, and fecal coliforms. What are the critical intrinsic components of each media (such as ingredients), or extrinsic factors (such as incubation) that are used for each determination? To clarify, what is special about the EC broth test that allows the results to indicate that “fecal coliforms” are growing. You will likely need to refer to the BD-Difco description of each media, as well as the BAM protocol for help.
2. 3M makes a E. coli / Coliform count plate. Check the product description for these plates online. What advantages would there be to using these plates as part of the workflow to determine E. coli counts, compared to the traditional BAM method used in this lab?

D and Z Values FSHN 312 Lab Manual
Page 33 of 83
Lab 5 - D and Z Values
Learning Objectives • Carry out an isothermal inactivation study for bacteria in broth cultures • Calculate D and Z values for bacterial strains based on experimentally determined thermal
inactivation data. • Predict the time required at a given temperature to achieve a desired log reduction using D- and Z-
values
Background Thermal Inactivation of Microorganisms The inactivation of microorganisms by heat is a crucial step in the processing of many foods and an essential operation in the food microbiological laboratory. Different microorganisms vary greatly in their resistance to heat and many environmental factors affect microbial heat resistance. Food products contain a mixed microbial population including organisms with low and high heat resistances. Some heat-sensitive pathogens or psychrotrophs may be killed by brief exposure to 45°C while spores of thermophilic bacteria may be destroyed only by long exposures to temperatures well above 100°C. The effects of heat on the mixed microbial flora of a food are extremely complex. However, the heat treatments applied to foods are not so complex in design because they are aimed at the destruction of particular organisms. Usually the target is the most heat resistant pathogen or spoilage organism of concern. For instance, the pasteurization of milk is designed to destroy the most heat-resistant pathogen transmissible by milk, Coxiella burnetii, the causative agent of Q fever. Heat treatments applied to low acid canned foods are designed to destroy Clostridium botulinum. In many meat products and ready-to-eat foods, thermal processes target a 5-log reduction of Salmonella or Listeria monocytogenes.
The Survival Curve and the D Value When a pure culture of bacteria is exposed to a constant lethal temperature for a period of time, the number
of viable cells decreases exponentially as the time increases. Often, the same proportion of remaining viable cells dies in each successive time period. This creates a death curve with a logarithmic order.
We can build a survivor curve by plotting the number of surviving cells (on a log scale) vs time (min). From the survival curve, we can determine the D value: the time necessary to decrease a population of cells by 90% (or one log) at a particular temperature. You can also think of D as the time necessary for the survivor curve to traverse one logarithmic unit, for instance, from 103 CFU/mL to 102
CFU/mL. This is found by the slope of the
y = -1.0591x + 7.9329R² = 0.9977
3
4
5
6
7
8
9
0 1 2 3 4 5 6
Cell
Coun
t [lo
g10(
CFU
/ml)]
Time [min] at 55C
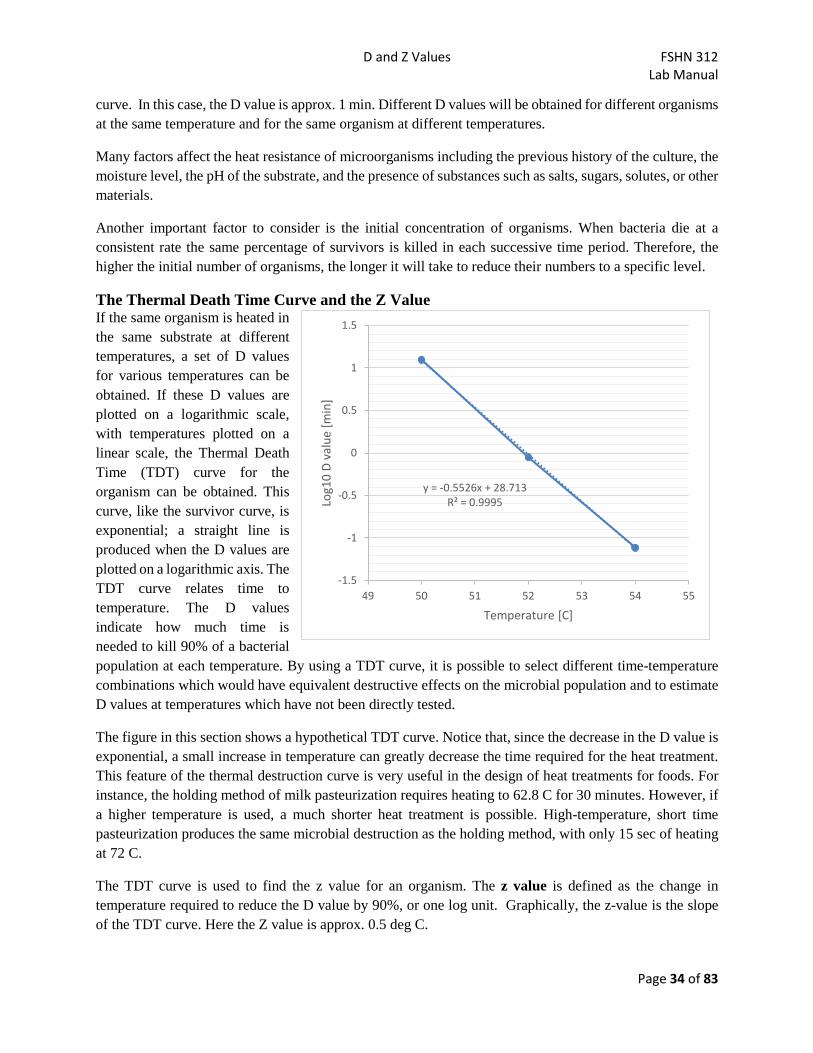
D and Z Values FSHN 312 Lab Manual
Page 34 of 83
curve. In this case, the D value is approx. 1 min. Different D values will be obtained for different organisms at the same temperature and for the same organism at different temperatures.
Many factors affect the heat resistance of microorganisms including the previous history of the culture, the moisture level, the pH of the substrate, and the presence of substances such as salts, sugars, solutes, or other materials.
Another important factor to consider is the initial concentration of organisms. When bacteria die at a consistent rate the same percentage of survivors is killed in each successive time period. Therefore, the higher the initial number of organisms, the longer it will take to reduce their numbers to a specific level.
The Thermal Death Time Curve and the Z Value If the same organism is heated in the same substrate at different temperatures, a set of D values for various temperatures can be obtained. If these D values are plotted on a logarithmic scale, with temperatures plotted on a linear scale, the Thermal Death Time (TDT) curve for the organism can be obtained. This curve, like the survivor curve, is exponential; a straight line is produced when the D values are plotted on a logarithmic axis. The TDT curve relates time to temperature. The D values indicate how much time is needed to kill 90% of a bacterial population at each temperature. By using a TDT curve, it is possible to select different time-temperature combinations which would have equivalent destructive effects on the microbial population and to estimate D values at temperatures which have not been directly tested.
The figure in this section shows a hypothetical TDT curve. Notice that, since the decrease in the D value is exponential, a small increase in temperature can greatly decrease the time required for the heat treatment. This feature of the thermal destruction curve is very useful in the design of heat treatments for foods. For instance, the holding method of milk pasteurization requires heating to 62.8 C for 30 minutes. However, if a higher temperature is used, a much shorter heat treatment is possible. High-temperature, short time pasteurization produces the same microbial destruction as the holding method, with only 15 sec of heating at 72 C.
The TDT curve is used to find the z value for an organism. The z value is defined as the change in temperature required to reduce the D value by 90%, or one log unit. Graphically, the z-value is the slope of the TDT curve. Here the Z value is approx. 0.5 deg C.
y = -0.5526x + 28.713R² = 0.9995
-1.5
-1
-0.5
0
0.5
1
1.5
49 50 51 52 53 54 55
Log1
0 D
valu
e [m
in]
Temperature [C]
D and Z Values FSHN 312 Lab Manual
Page 35 of 83
Deviations from the Logarithmic Order of Death The mathematical treatment of the heat inactivation of bacteria assumes that the survivor curve is a straight line. This assumption is often valid, and it is necessary if the data are to be handled mathematically in a relatively simple way. However, in real experiments, deviations from the logarithmic order of death are observed. For instance, if spores are being heated, the initial heating may cause germination and a lag before the decrease when the heat treatment has become sufficient to kill the activated spores. If the culture contains two or more strains of different heat resistance, the survivor curve will also deviate from a straight line. Heat can cause reversible microbial injury as well as irreversible microbial death. The ability of injured cells to repair themselves may also cause deviations in the survivor curve.
Materials Per Lab Cultures (3 each) of:
Pseudomonas fluorescens, Listeria innocua Listeria innocua in 6.5% NaCl media Bacillus subtilis
Water baths at 50, 55, 60°C Per Group Sterile 1.5 mL microcentrifuge tubes (bucket, at least 31); rack Dilution buffer (bottle) BHI agar plates (1.5 sleeves, should need 27) P1000 pipettor tips Disposable spreaders
Procedures In this lab, we will test the thermal resistance of 3 organisms
• Pseudomonas fluorescens • Listeria innocua, both at 0.5% and 6.5% NaCl • Bacillus subtilis
At 3 different temperatures: 50, 55, and 60°C. For a total of 12 experimental conditions. Each group will be assigned one condition. We will then determine Z value for the organisms, and the impact of high-salt pre-growth on thermal resistance.
Each test will involve enumerating surviving cells every 5 min for 25 min [times 0, 5, 10, 15, 20, and 25]. Your group will take samples of the surviving culture, perform 10-fold serial dilutions, and then spread plates the dilutions to enumerate survivors.
All dilutions will be 10-fold dilution of 100µL sample into 900 µL buffer. The time 0 sample will be plated from a -5 and -6 dilution tube. All other samples will be plated from the -1 to -5 dilution tubes. Single plates per dilution.
Day 1: Challenge Study 1. Gather your bacterial culture, dilution supplies (microcentrifuge tubes, buffer), and plating supplies
(plates, spreaders). a. Start preparing dilution tubes: Label and fill with 900 µL buffer.

D and Z Values FSHN 312 Lab Manual
Page 36 of 83
b. Start labeling spread plates 2. When you are ready to begin the time-course, first take a 100 µL sample of your bacterial culture
into the first series of dilution tubes. This is the t = 0 sampling point in the time course. a. Have a lab group member being serial dilutions. Spread plate 100 ul of the -5 and -6
dilutions (for -6 and -7 total dilutions). b. Have another lab member place your culture tube in the water bath at the assigned
temperature. Start a timer or watch the clock. 3. Every 5 min for a total of 25 min, take a 100 µL sample for plating. Plate the -1 to -5 dilutions at
each time point. 4. Incubate plates at 30°C for 48 h.
Day 2: Enumeration and Quantitative Microbiology 1. Count all the plates used in the challenge study.
a. Post countable plate results on the google sheet. Include b. Temperature of waterbath used in time course c. bacterial culture d. colony counts e. dilution value of plate f. counts (CFU/ml) at each time point.
2. Construct survival curves based on individual data from your group, and the class data a. Calculate the D-value for each organism and temperature
3. Plot all the data for each organism on the same graph. Time by surviving cells. a. Construct Thermal Death Time ‐curves based on class data for each organism.
4. Calculate the Z-value for each organism
Discussion Questions 1. What experimental conditions influence the generation of an accurate thermal death curve? 2. Which organism is the most resistant to heat inactivation? The least? 3. How does pre-growth in high-salt affect thermal resistance? 4. What process time would be required to achieve a 5-log reduction of each organism at 55°C?
a. What about 58°C? b. Show some work.
Pathogen Detection in Foods FSHN 312 Lab Manual
Page 37 of 83
Lab 6 - Pathogen Detection in Foods
Learning Objectives • Describe a basic workflow for testing a food or environmental sample for a foodborne pathogen.
This includes sample collection, processing, and result interpretation. • Compare and contrast the use of standard methods vs. rapid methods for detection of microbes in
foods • Assess the results of a pathogen sampling data set to identify a possible source of contamination.
Background Listeria The ability of Listeria species to grow at refrigeration temperatures makes it a particular problem for the food industry. Since Listeria species are found throughout the environment, it is easy for food plant environments (coolers, drains, vents, and equipment) to become contaminated with Listeria and for the microbe to slowly proliferate and contaminate products, even after thermal processing. There are currently 11 known species of Listeria, with Listeria monocytogenes being the main species that is pathogenic to humans.
For this reason, L. monocytogenes is a particular concern in ready-to-eat foods. These foods may become contaminated in the plant (post-processing) and since they are normally stored at refrigeration temperatures for extended periods of time and consumed with minimal or no re-heating, consumption of L. monocytogenes is a great risk. For this reason, in 1989 the FSIS (USDA) adopted a zero-tolerance policy for L. monocytogenes in cooked, ready-to-eat foods (no cells can be detected in 25g sample). The food industry must work diligently to achieve this standard, and therefore uses HACCP, GMP and related programs to prevent L. monocytogenes contamination of food products and processing plant environments. When testing foods and food contact surfaces, in many cases the samples are tested for the presence of any Listeria species first, and if a positive is found, then those colonies undergo further testing to determine if it is L. monocytogenes. Even if the sample is found to contain a non-pathogenic Listeria species, it is still used as an indicator that sanitation practices need to be reviewed or modified to remove any Listeria from the processing area.
Scenario You are a food microbiologist in the quality control lab of a large meat processing company that produces ready to eat (RTE) meat products. Each day you receive samples of product to test for pathogens. You also receive swabs from food contact surfaces from the RTE processing lines. Multiple samples of product are taken throughout the day, and swabs are taken before processing starts (when equipment should be clean), during processing, and when processing is complete for the day. Your job is to test RTE meat and RTE processing area surface swabs for Listeria monocytogenes.
When L. monocytogenes is detected in RTE foods that can support its growth, the product is considered adulterated and cannot be sold. At many food companies, the product samples must be tested and pathogens not be found before the product is allowed to be shipped to retail. For this lab, we will use both culture-based detection and isolation methods, as well as rapid detection methods for this pathogen.
**Note: While this scenario describes testing for the foodborne pathogen L. monocytogenes, for purposes of safety, this lab will be conducted using the closely related, non-pathogenic, bacterium Listeria innocua.
Pathogen Detection in Foods FSHN 312 Lab Manual
Page 38 of 83
Materials First lab period Biological Samples
Roast beef samples in whirl pak bags (25g, two per group) Sponge samples in whirl pak bags (two per group)
Media 500-700 mL UVM broth (1 bottle per group) 500 mL of sterile water (3 bottles shared among the lab) 1 or 2 packets of LESS media powder
Other supplies: 250mL graduated cylinder (1 per group) Waste bucket to hold stomacher bags, ethanol this first (1 per group) Neogen Reveal 2.0 test kit for Listeria (1 per lab, demonstrate components) Basket to return enrichment samples for 30C incubation
Second lab period Media
PALCAM agar plates (4 per group) Other supplies
1.7 mL Eppendorf tubes (1-2 per group) Heat block at 80C Reveal sample kit (each group needs 1-2 strips, 1-2 sample cups) P1000 pipettors and tips Sterile transfer loops (10 per group)
Between labs Media
Blood agar plates (4 per group) Sterile transfer loops
Third lab period Cultures
Listeria innocua and Listeria monocytogenes on PALCAM and Blood Agar plates (negative and positive controls, 1-2 sets per lab. For TAs to demonstrate, in sanitized secondary packaging)
Other supplies: Glass slides (4 per group) 3% H2O2 solution (100 mL per lab) Plastic droppers Loops *We may use a peroxide tube test method instead of slides
Procedures Day 1 – Listeria enrichment The class will process a set of food samples and food contact surface swabs for the presence of Listeria spp. Your group will process a sub-set of these samples per standard, culture-based, methods, and using a
Pathogen Detection in Foods FSHN 312 Lab Manual
Page 39 of 83
rapid testing procedure. Results will be combined to summarize the results for two hypothetical days of meat processing.
1. Gather sample processing materials. a. Check Table 1 for the samples your group with process. Each sample is labeled with a
code, e.g. A-E-1 MS 2/16. This corresponds to a sample from Line A, Early time, Rep 1, taken by the instructor on the given date. You will see if it is a sponge or roast beef.
b. Sample enrichment buffers i. Food samples enriched in Neogen buffer packets
1. Groups 1-10, take 2 packets 2. Sterile water bottles will be shared
ii. All sponge samples will be enriched in UVM media 1. Take any available UVM buffer
c. A flask for measuring 225 mL of media. 2. Add enrichment buffer to samples
a. For Neogen buffer packets, add one packet to each food sample. Then measure and add 225 mL sterile water.
b. For UVM broth, add 225 mL to the sample. 3. Fold over top of bag. Massage for 1 min. 4. Place bag in bin labeled for incubation.
a. Samples will be incubated at 30°C for 48h
Day 2 – Rapid testing for Listeria & isolation from enrichment First, we will use a commercial rapid-testing kit to get same-day results for if Listeria spp. are present in the enrichment culture. We will use the Neogen Reveal Kit which uses a lateral flow strip to detect DNA of the organism. http://foodsafety.neogen.com/en/reveal-2-listeria.
Review the Revel 2.0 Product Insert during the 20 min incubation, after you have streaked your enrichments.
1. Transfer 1 mL of a chosen enrichment culture to a 1.7 mL Eppendorf tube. 2. Place tube in the heat bock at 80C for 20 min. This is kill and lyse bacterial cells. 3. Transfer 200µL of the heat killed samples to the Revel sample cup. 4. Place the reveal device into the sample cup. Incubate at RT for 20 min. 5. Examine the strip for a positive (2 lines) or negative (1 line) result.
Second, we will attempt to isolate Listeria from the 48 h enrichment. FDA BAM and FSIS mLG protocols suggest isolation at both 24 h and 48 h to provide potentially faster positive results.
1. Streak a loop of the enrichment from roast beef and sponge samples onto a PALCAM agar plate. a. This is an esculin based selective media where Listeria spp. will change the color of the
plate. b. If insufficient PALCAM plates are available, first divide the plate in half and process two
samples on one plate 2. Use a loop(s) to streak for isolation. 3. Plate will be incubated at 35C for 48 h.
Between Labs On Friday, the instruction team will select up to two colonies from PALCAM (from each sample) and streak for isolation onto blood agar. These plates will be incubated for 48 h at 30°C.

Pathogen Detection in Foods FSHN 312 Lab Manual
Page 40 of 83
Day 3 – Enrichment Results 1. Examine PALCAM and Blood Agar plates for typical Listeria colonies. For comparison, the TAs
will show Listeria innocua and Listeria monocytogenes plates on each media. 2. Hemolysis test.
a. Examine plates to observe a clear zone of hemolysis around cultures.
Table: Listeria hemolytic activity
LISTERIA SPP. HEMOLYTIC ACTIVITY L. MONOCYTOGENES lyse red blood cells (hemolysis) Clear zones produced L. INNOCUA does not have hemolytic activity No clear zones will present
3. Catalase test a. Take a loopful of culture and place it on a clean glass slide. b. add 1-3 drops of 3% H2O2 c. Observe and record the evolution of H2 gas
Note: A positive will indicate the presence of L. monocytogenes in the culture. What do you expect?
Group results Each group will record their culture based results on the google sheet.
Use this information to determine when/where contamination may have occurred.
Discussion Questions 1. Based on these results, where might contamination have occurred in the meat processing plant? Do
we have any indication if this contamination was persistent or sporadic contamination? How might additional testing help us better identify the nature of the contamination?
2. Compare and contrast the procedures from the culture based detection and the rapid detection methods. Based on the absolute amount of time needed to complete each set of assays, which would be more useful for a food testing lab? Why?
3. Compare your results from the selective and differential media vs. results from the rapid tests. In many cases, the rapid test results are only considered presumptive positives. Why is this, and what information would you typically need to confirm the rapid test kit result?
4. Discuss how the microbiological results obtained in this lab would have differed if the laboratory organism was not the non-pathogen L. innocua, but instead the pathogen L. monocytogenes.

Pathogen Detection in Foods FSHN 312 Lab Manual
Page 41 of 83
Table 1. RTE Beef Processing Facility Samples. SAMPLE NUMBER
DATE LINE RELATIVE TIME
TIME IN PROCESS
TYPE OF SAMPLE
REP. GROUP
1 2/16/2017 Line A
1-Early Before Processing Sponge Rep 1 1
2 2/16/2017 Line A
2-Middle During Processing Sponge Rep 1 1
3 2/16/2017 Line A
3-Late After Processing Sponge Rep 1 2
4 2/16/2017 Line B
1-Early Before Processing Sponge Rep 1 2
5 2/16/2017 Line B
2-Middle During Processing Sponge Rep 1 3
6 2/16/2017 Line B
3-Late After Processing Sponge Rep 1 3
7 2/16/2017 Line C
1-Early Before Processing Sponge Rep 1 5
8 2/16/2017 Line C
2-Middle During Processing Sponge Rep 1 5
9 2/16/2017 Line C
3-Late After Processing Sponge Rep 1 6
10 2/17/2017 Line A
1-Early Before Processing Sponge Rep 1 6
11 2/17/2017 Line A
2-Middle During Processing Sponge Rep 1 7
12 2/17/2017 Line A
3-Late After Processing Sponge Rep 1 8
13 2/17/2017 Line B
1-Early Before Processing Sponge Rep 1 8
14 2/17/2017 Line B
2-Middle During Processing Sponge Rep 1 8
15 2/17/2017 Line B
3-Late After Processing Sponge Rep 1 9
16 2/17/2017 Line C
1-Early Before Processing Sponge Rep 1 9
17 2/17/2017 Line C
2-Middle During Processing Sponge Rep 1 10
18 2/17/2017 Line C
3-Late After Processing Sponge Rep 1 10
19 2/16/2017 Line A
1-Early Morning run Roast Beef Rep 1 1
20 2/16/2017 Line A
2-Middle Mid-day run Roast Beef Rep 1 1
21 2/16/2017 Line A
3-Late Evening run Roast Beef Rep 1 2
22 2/16/2017 Line B
1-Early Morning run Roast Beef Rep 1 2
23 2/16/2017 Line B
2-Middle Mid-day run Roast Beef Rep 1 3
24 2/16/2017 Line B
3-Late Evening run Roast Beef Rep 1 3
25 2/16/2017 Line C
1-Early Morning run Roast Beef Rep 1 5
26 2/16/2017 Line C
2-Middle Mid-day run Roast Beef Rep 1 5
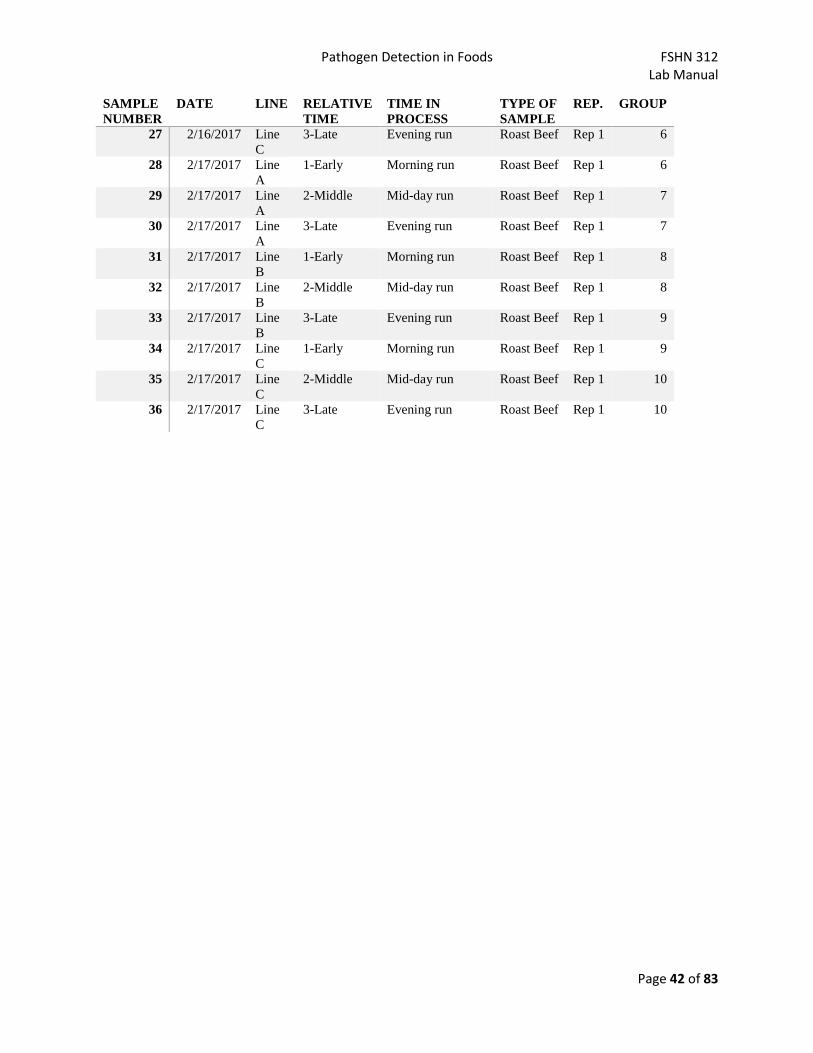
Pathogen Detection in Foods FSHN 312 Lab Manual
Page 42 of 83
SAMPLE NUMBER
DATE LINE RELATIVE TIME
TIME IN PROCESS
TYPE OF SAMPLE
REP. GROUP
27 2/16/2017 Line C
3-Late Evening run Roast Beef Rep 1 6
28 2/17/2017 Line A
1-Early Morning run Roast Beef Rep 1 6
29 2/17/2017 Line A
2-Middle Mid-day run Roast Beef Rep 1 7
30 2/17/2017 Line A
3-Late Evening run Roast Beef Rep 1 7
31 2/17/2017 Line B
1-Early Morning run Roast Beef Rep 1 8
32 2/17/2017 Line B
2-Middle Mid-day run Roast Beef Rep 1 8
33 2/17/2017 Line B
3-Late Evening run Roast Beef Rep 1 9
34 2/17/2017 Line C
1-Early Morning run Roast Beef Rep 1 9
35 2/17/2017 Line C
2-Middle Mid-day run Roast Beef Rep 1 10
36 2/17/2017 Line C
3-Late Evening run Roast Beef Rep 1 10
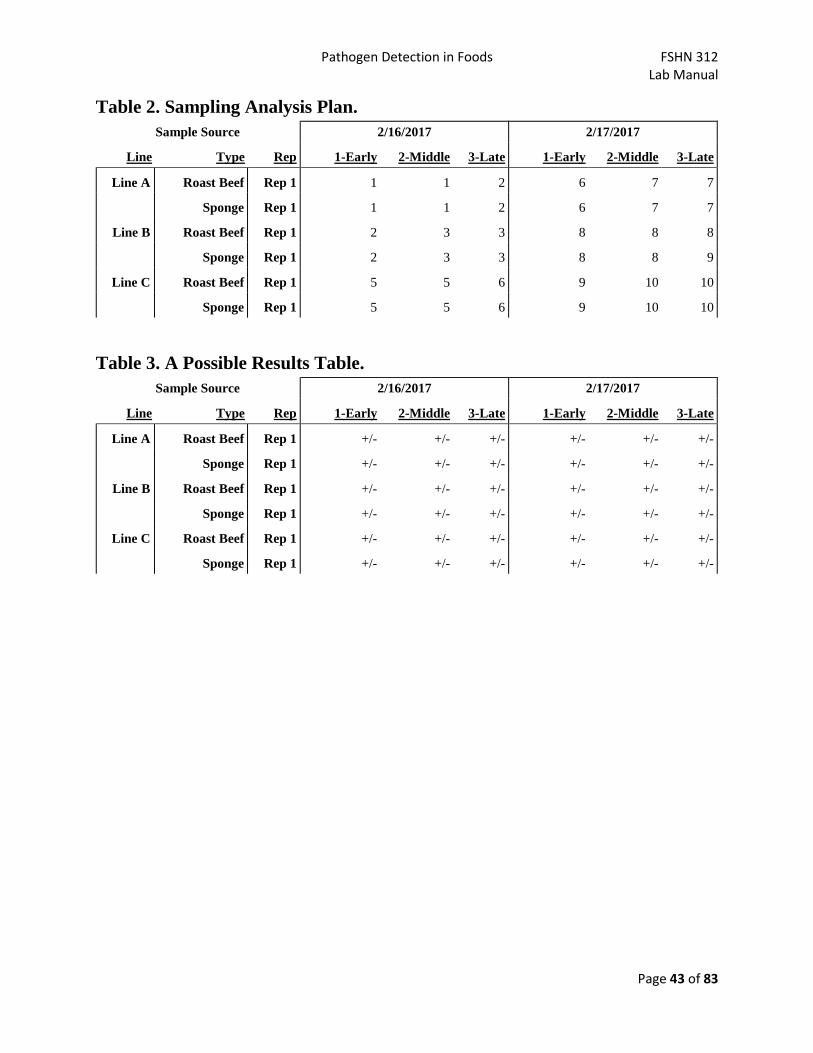
Pathogen Detection in Foods FSHN 312 Lab Manual
Page 43 of 83
Table 2. Sampling Analysis Plan. Sample Source 2/16/2017 2/17/2017
Line Type Rep 1-Early 2-Middle 3-Late 1-Early 2-Middle 3-Late
Line A Roast Beef Rep 1 1 1 2 6 7 7
Sponge Rep 1 1 1 2 6 7 7
Line B Roast Beef Rep 1 2 3 3 8 8 8
Sponge Rep 1 2 3 3 8 8 9
Line C Roast Beef Rep 1 5 5 6 9 10 10
Sponge Rep 1 5 5 6 9 10 10
Table 3. A Possible Results Table. Sample Source 2/16/2017 2/17/2017
Line Type Rep 1-Early 2-Middle 3-Late 1-Early 2-Middle 3-Late
Line A Roast Beef Rep 1 +/- +/- +/- +/- +/- +/-
Sponge Rep 1 +/- +/- +/- +/- +/- +/-
Line B Roast Beef Rep 1 +/- +/- +/- +/- +/- +/-
Sponge Rep 1 +/- +/- +/- +/- +/- +/-
Line C Roast Beef Rep 1 +/- +/- +/- +/- +/- +/-
Sponge Rep 1 +/- +/- +/- +/- +/- +/-

Outbreak Investigation FSHN 312 Lab Manual
Page 44 of 83
Lab 7 - Outbreak Investigation
Learning Objectives • Describe the steps in an outbreak investigation • Evaluate epidemiology and food microbiology results that would be collected during an outbreak
investigation: Symptoms, food exposures, food samples, lab tests • Describe molecular methods, such as PCR and PFGE, and how they may be used in outbreak
investigation.
Background The Centers for Disease Control (CDC) currently estimates that in the US roughly 48 million people get sick from a foodborne illness, 128,000 are hospitalized, and 3,000 die. In many cases, the pathogen responsible for the illness and/or the contaminated food that led to the illness, are unknown. For the majority of cases where the pathogen is identified, the illnesses are part of a foodborne outbreak. A foodborne outbreak is defined as 2 or more people having the same illness from the same contaminated food or drink. Illnesses that are caused by foodborne pathogens but are not part of outbreaks are referred to as sporadic illnesses.
The CDC collects data from local, state, and other federal agencies to investigate possible foodborne outbreaks. The steps of an outbreak investigation include:
• Detecting a possible outbreak from surveillance and reporting data • Defining and finding cases • Generating hypotheses about possible sources • Testing hypotheses to determine if the correct source has been identified • Finding the point of contamination and the source of the food • Controlling the outbreak • Determining when the outbreak is over
This lab exercise is designed to demonstrate the different steps of an outbreak investigation. You will be given a hypothetical scenario and asked to determine if an outbreak has occurred, what the potential source of the outbreak is, and the pathogen causing the outbreak.
During this lab, we will not be able to carry out the actual lab experiment that would be used in an outbreak investigation for two reasons. First, the laboratory methods are necessarily designed to culture foodborne pathogens, which would require greater biosafety training than is possible in the teaching lab. Second, the molecular methods for outbreak investigation generally required more sophisticated materials and equipment than we have access to.
Therefore, in this lab session, we will carry out a ‘virtual lab’ where we talk through the design of critical experiments, and interpret results. Specifically, we will
• Analyze hypothetical data for an outbreak scenario • Use those data to generate testable hypotheses about the source of the outbreak • Discuss the lab tests required to isolate pathogens from possible food sources
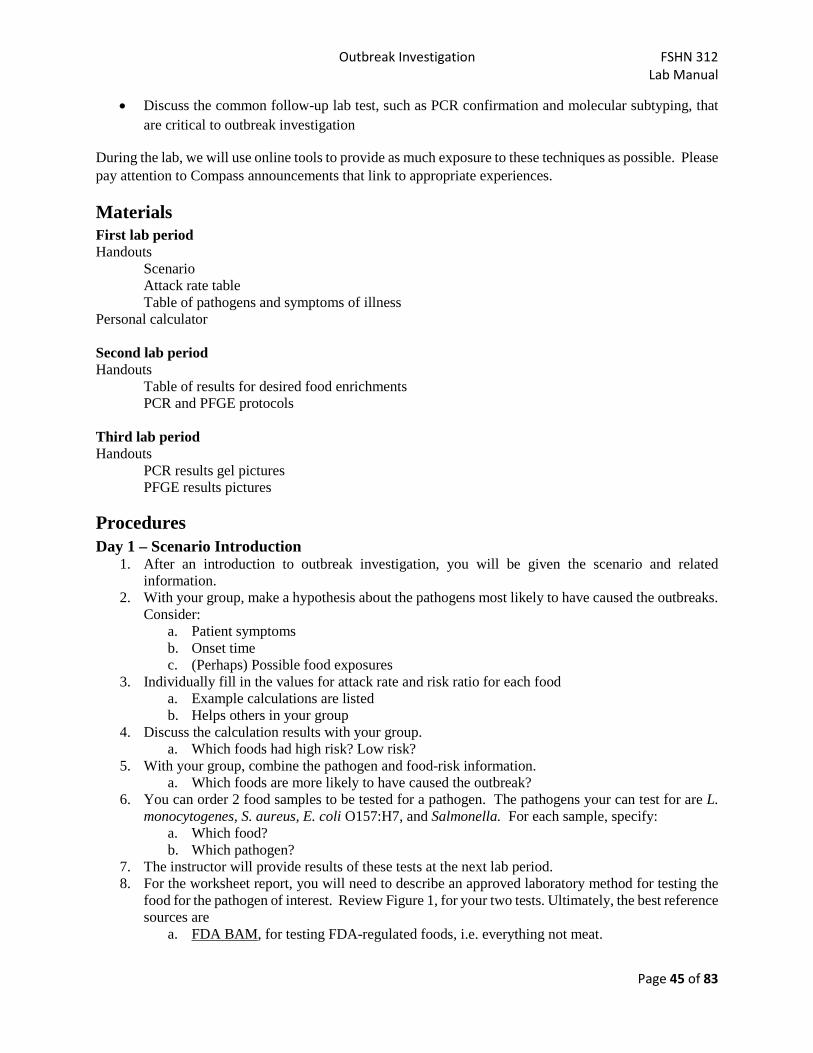
Outbreak Investigation FSHN 312 Lab Manual
Page 45 of 83
• Discuss the common follow-up lab test, such as PCR confirmation and molecular subtyping, that are critical to outbreak investigation
During the lab, we will use online tools to provide as much exposure to these techniques as possible. Please pay attention to Compass announcements that link to appropriate experiences.
Materials First lab period Handouts Scenario Attack rate table Table of pathogens and symptoms of illness Personal calculator Second lab period Handouts Table of results for desired food enrichments
PCR and PFGE protocols Third lab period Handouts PCR results gel pictures PFGE results pictures
Procedures Day 1 – Scenario Introduction
1. After an introduction to outbreak investigation, you will be given the scenario and related information.
2. With your group, make a hypothesis about the pathogens most likely to have caused the outbreaks. Consider:
a. Patient symptoms b. Onset time c. (Perhaps) Possible food exposures
3. Individually fill in the values for attack rate and risk ratio for each food a. Example calculations are listed b. Helps others in your group
4. Discuss the calculation results with your group. a. Which foods had high risk? Low risk?
5. With your group, combine the pathogen and food-risk information. a. Which foods are more likely to have caused the outbreak?
6. You can order 2 food samples to be tested for a pathogen. The pathogens your can test for are L. monocytogenes, S. aureus, E. coli O157:H7, and Salmonella. For each sample, specify:
a. Which food? b. Which pathogen?
7. The instructor will provide results of these tests at the next lab period. 8. For the worksheet report, you will need to describe an approved laboratory method for testing the
food for the pathogen of interest. Review Figure 1, for your two tests. Ultimately, the best reference sources are
a. FDA BAM, for testing FDA-regulated foods, i.e. everything not meat.

Outbreak Investigation FSHN 312 Lab Manual
Page 46 of 83
b. FSIS mLG, for testing FSIS-regulated foods, i.e. the hamburger and hot dog. Day 2 – Culture Results and Molecular Subtyping:
1. You will be provided with the culture-based testing results for the two samples you ordered. Interpret these results.
a. We will collect the results for the whole class. 2. We will discuss the use of PCR to confirm the identify of any presumptive positive pathogen
samples. This is an alternative to the classical phenotyping (IMViC, hemolysis, etc.) that works by binary trees.
a. Note the specific genes to be targeted by PCR for the pathogen identified. b. We will assign a virtual lab for this process.
3. Review the provided PCR protocol. a. Using a sterile disposable loop, select a small portion of a colony and then transfer the
colony to 500µL of sterile water in a 1.5mL tube. Label the tubes with sample number and group number.
b. Place the tubes in a heat block at 95°C for 10 minutes. This will cause the cells to lyse and release their DNA.
c. Allow the tubes to cool and then centrifuge for 5 minutes at 13,000 rpm to collect the cell debris. The DNA will be in solution, and denatured proteins and parts of the cell membrane will collect at the bottom of the tube.
d. Each group will be given a tube containing master mix for the PCR reaction. The master mix should be enough for 3 PCR reactions (water blank as a negative control, DNA sample from each of 2 unknowns).
e. Obtain 3 PCR tubes and add 49µL of master mix to each tube. f. Add 1µL of sample to each of the tubes containing master mix. Seal the tubes and label
the tubes as well as the rack for the tubes with your group information. g. The lab would run your PCR reactions for later examination.
Be prepared to describe the purpose the PCR test and the format of the results.
Day 3 – Molecular Subtyping Results 1. Obtain the PCR and gel electrophoresis results. The gel would be run with a protocol similar to
a. Obtain your PCR reaction tubes from last week. b. Get a piece of parafilm and an aliquot of EZ vision loading dye c. Do this near the gel electrophoresis unit
i. pipet 3µL of loading dye onto the parafilm (1 drop of dye per PCR reaction, so three total)
ii. For each PCR reaction, pipet 10 µL of the reaction onto the drop of loading dye. Pipet to mix, and then pipet into the appropriate well of the gel.
d. Keep track of the location of your group’s samples on the gel. Once all the samples are loaded, the gels will be run for 30 minutes at 100V.
e. Once gels have finished running, they are imaged. You will get a picture of the results. 2. What do these results suggest for the outbreak investigation? 3. After a discussion of molecular subtyping, we will pass out results of a Pulsed Field Gel
Electrophoresis analysis of the putative outbreak isolates. a. With your group, interpret these data:
i. Which food is most likely the cause of the outbreak? ii. Which patients are most likely a part of the outbreak?
iii. Can you exclude any patients from the outbreak?
Discussion Questions 1. What was the source of the outbreak? And how did the follow data help you learn this
Outbreak Investigation FSHN 312 Lab Manual
Page 47 of 83
a. The data on the dates of hospital admission (clue: ‘onset time) b. Food consumption table of ill and well attendees c. Food test results
i. Enrichments ii. PCR
iii. PFGE 2. How confident are you in your analysis? 3. What steps would you take to control the outbreak? 4. What steps would you suggest to prevent future similar outbreaks?

Outbreak Investigation FSHN 312 Lab Manual
Page 48 of 83
Scenario Info Scenario: You are public health officers at the Illinois Department of Public Health. A surge of gastrointestinal illnesses have been reported this week. Since April 28th, 39 people have been admitted to hospitals across the state with diarrhea, fever, and some vomiting. The common factor so far is that all victims were visiting the college of ACES at the U of I from April 27-29. You and your team are reasonably sure the victims were exposed to the infectious agent during this time.
Based on the events mentioned by the ill, you see that there were two common events on April 28, a barbeque cookout on the ag quad and a wine and cheese tasting event at the Krannert Center. You have the following information about the location, age, gender, and date of hospital admission for the patients.
Table 1. Patient information County Number
of cases Date(s) of hospital admission (# admitted on that date)
Patient Gender (F/M), age (Youth/Adult), (number)
Champaign 11 3/28 (3), 3/29 (2), 3/30 (6) F, Y (4); F, A (1); M, Y (6) Dupage 5 3/29 (4), 3/30 (1) F, A (2); M, A (1); M, Y (3) Kankakee 6 3/28 (2), 3/29 (4) F, Y (3); M, Y (3) Dewitt 2 3/29 (2) F, Y (1); M, Y, (1) Vermillion 4 3/29 (3), 3/30 (1) F, A (1); M, Y (3) Sangamon 3 3/29 (1), 3/30 (2) F, Y (1); M, A (2) Jackson 3 3/29 (1), 3/30 (2) M, Y (3) Cook 5 3/28 (2), 3/29 (1), 3/30 (2) F, A (3); M, A (1); M, Y (1)
Foods: Your team determines that the following major foods were served at each event:
Cookout – Hot dog, hamburger, and veggie sandwich (cheese, cucumbers, tomatoes, sprouts).
Wine and cheese tasting – red and white wines, brie, camembert, swiss, and cheddar cheeses.
Caterers were able to provide unopened packages from the same supplier and production lots of: refrigerated hot dogs, frozen hamburgers, wrapped cheese wheels, and deli cheese. For the vegetables on the veggie sandwich, a portion of the same delivery lot was available to take a sample.
Exposures: Your team contacts people who attended the same events and ask whether they have been sick, and which of the foods they ate at either event. The table on the following page details the data you collected. Use this data to determine which of the foods are likely to be involved in the outbreak.
Food testing: You do not yet have stool sample results back from the hospital labs, so do not know which pathogen may be making people sick.
Your team only has the resources to test two foods, and only for two pathogens. Decide which food you will test, and which organism you will test for. These results will be used to help figure out which food may be associated with the outbreak. The pathogens your laboratory commonly tests for are L. monocytogenes, S. aureus, E. coli O157:H7, and Salmonella. You only have media on hand to test for those organisms.

Outbreak Investigation FSHN 312 Lab Manual
Page 49 of 83
Table 2. Reported food consumption of event attendees
Food
Ate the Food Did Not Eat the Food Risk Ratio Total Well Ill Attack Rate Total Well Ill Attack Rate
Hot dog 58 45 13 22% 42 33 9 21% 1.05
Hamburger 72 67 5 28 18 10 36%
Veggie Sandwich 37 7 30 63 55 8 13%
Brie cheese 45 14 31 55 48 7 13%
Camembert cheese 77 56 21 23 18 5 22%
Swiss cheese 63 41 22 37 22 15 41%
Cheddar cheese 52 44 8 48 31 17 35%
Attack Rate = # of cases / # exposed
Example: Hot dog: Attack Rate = 13/58 = 22%
Risk Difference = Attack Rate Exposed – Attack Rate Unexposed
Example: Hot dog: Risk Difference = 22% - 21% = 1% (No column, but think about this)
Risk Ratio = incidence in exposed/incidence in unexposed
Example: Hot dog: Risk Ratio = 22/21 = 1.05
What do Risk Ratios >> 1 suggest?
As a group, choose to test 2 foods:
Hot dogs, Hamburgers, Brie, Camembert, Swiss, Cheddar, Deli cheese, Cucumbers, Tomatoes, Sprouts
And for each food, indicate which pathogen to test:
L. monocytogenes, S. aureus, E. coli O157:H7, and Salmonella.
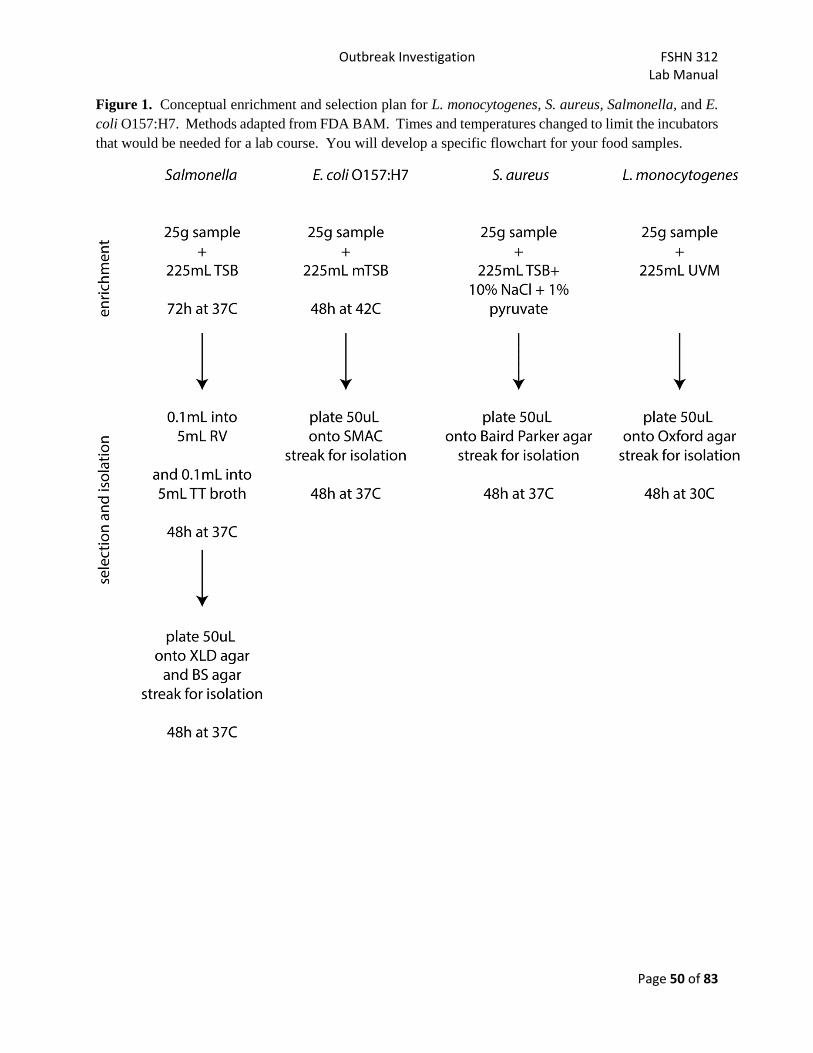
Outbreak Investigation FSHN 312 Lab Manual
Page 50 of 83
Figure 1. Conceptual enrichment and selection plan for L. monocytogenes, S. aureus, Salmonella, and E. coli O157:H7. Methods adapted from FDA BAM. Times and temperatures changed to limit the incubators that would be needed for a lab course. You will develop a specific flowchart for your food samples.
QMRA: Quantitative Microbial Risk Assessment FSHN 312 Lab Manual
Page 51 of 83
Lab 8 - QMRA: Quantitative Microbial Risk Assessment
Learning Objectives The goal of this computer exercise is to introduce you to the basic process of a quantitative microbial risk assessment. We will learn about QMRA, work through a QMRA for a real-world food safety scenario, and interpret the results together. Upon completion of this lab, you should be able to:
• Define the steps of a typical food safety QMRA • Apply the QMRA process to an example of a real-world food safety scenario. • Evaluate the results of a QMRA to recommend options to manage a specific food safety risk.
Background Many people view food safety as black and white, yes or no. Either food is safe, or it is not. And if it is safe, it should be sold and consumed. If it is not, then it should not be sold nor consumed. What they are interested in is individual risk. Will eating this food cause me (or my family) harm? The assumption is NO.
As you are learning through your degree, the reality is often more complicated. When bacterial pathogens contaminate a food product, often that contamination is not uniform. Consumption of any given serving of a contaminated food does not mean the consumer will be exposed to a pathogen. And even if they are exposed, not everyone who is exposed to a pathogen will become sick. Therefore, to a scientist, the only way to answer the question of ‘will eating this potentially contaminated food make me sick?’ is with ‘maybe’. But fortunately, there is a field of inquiry called microbial risk assessment that tries to elaborate on that ‘maybe’ answer. When the process involves probabilities and statistics, we call that quantitative microbial risk assessment (QMRA).
In this exercise, we will describe the use of QMRA in food safety, and then apply that process to a specific food safety scenario.
QMRA Since you have not likely been introduced to risk assessment in other coursework, we ask that you read the following textbook chapter as introduction:
Lammerding, A. M. (2013). Microbial Food Safety Risk Assessment. In J. G. Morris Jr & G. Potter (Eds.), Foodborne Infections and Intoxications (pp. 37-51).
It is posted to the course Compass site.
There will also be a short introductory lecture in class.
@RISK As you learned in the textbook chapter, the process of QMRA involves building some type of mathematical model of a food safety process. There are many tools to do so. In this class, we will use one popular tool called @RISK. This software allows one to build a process model in Excel. Then @RISK can assign distributions to individual cells of the Excel spreadsheet and take care of all the complicated simulation work.
This software will be introduced to the class by an instructor at the Illinois Market Information Lab. They will describe the use of the software for financial risk analysis, but the tools are universal.
QMRA: Quantitative Microbial Risk Assessment FSHN 312 Lab Manual
Page 52 of 83
Food Safety Scenario Let’s assume we are food safety consultants that just received a call from a small food company. They produce chocolate candies. Their main product is gift boxes of assorted chocolates. Most of their sales are for the Valentine’s Day holiday.
One item in this box is a piece of chocolate enrobed peanut-based fondant that had been made from peanut paste obtained from the Peanut Corporation of America (PCA). This is January 2009. Unfortunately, PCA is involved in a massive recall of their peanut paste that was contaminated with Salmonella Typhimurium; some illness have been linked to consumption of other products made with PCA peanut butter: https://www.cdc.gov/salmonella/2009/peanut-butter-2008-2009.html
The company calls in a panic. They want to do the right thing. But this is a hard problem. Here are some facts as to why:
• The peanut butter chocolate is only 1 of 20 chocolates in the box. • Boxes have already been shipped to retailers in advance of the Valentine’s Holiday. • This season represents over half of their gross sales each year. • They have tested 150 their peanut paste from PCA for Salmonella (25 g samples). All were
negative. • They heat the peanut paste to make it easier to fill the chocolates, but this is not well controlled nor
validated as a Salmonella kill step. Based on times and temperatures, we estimate this achieves a 0.5 – 1.5 log(CFU/g) reduction of Salmonella.
They don’t want to harm their consumers. Yet, if they issues a recall for these candies, they will loose the majority of their revenue for the year. At minimum this is costly. But if they cannot recover, there is a real risk this could lead to job loss and bankruptcy.
And so: Should they recall the product?
We cannot answer that question. But what we can do is assess the risk of that product to consumers. We will build a mathematical model that estimates the plausible range of illness that could be expected if all their candies were consumed. And then we can pass that information to the company.
We will also use this model to assess the likely impact of various interventions to kill Salmonella. These might provide insight on managing this risk in the future.
Materials Peanut Butter QMRA model posted to the Compass site @RISK software To access this specialized software, we will meet in the Illinois Market Information Lab.
1029 Business Instructional Facility 515 E. Gregory Drive https://business.illinois.edu/mil/
Procedure 1. The session before this lab the instructor will introduce the scenario and the Excel model. 2. The Market Information Lab will introduce the @RISK software
a. Sit in pairs in the computer lab.
QMRA: Quantitative Microbial Risk Assessment FSHN 312 Lab Manual
Page 53 of 83
b. Have one person log on. c. Follow along with the presentation
3. Work in pairs to modify the Peanut Butter QMRA model a. Download the PB QMRA model from compass b. Follow along with the instructor to simulate the production of few pieces of candy under
unrealistically bad food safety conditions. i. Looks for cases were a candy is contaminated, and people are sick.
ii. Baseline Parameters 1. Concentration of Salmonella in peanut paste: 150 CFU/g 2. Number of samples tested: 10 3. Number of samples positive: 0 4. Number of iterations: 30,000. This is for servings = 210,000
4. Run the @RISK simulation to predict the number of people ill in the demonstration conditions a. Record the simulated number ill
i. Run 3 replicates, and record each time. b. Spreadsheet will take the average
5. Vary individual parameters in the demonstration conditions to simulate different risk management conditions
a. What if things were worse, due to i. 1 positive test?
b. What if the peanut paste heating process was controlled to produce a guaranteed i. 1 log reduction? About what they have
ii. 2 log reduction? A modest improvement iii. 5 log reduction even with 150 CFU/g contamination? A thermal kill step
c. What would be the effect of a 0.33 log reduction in Salmonella per week, for i. 1 week of storage?
ii. 1 month of storage? d. Record the total ill in the data table, up to 3 replicates
6. Update the model to represent the realistic contamination scenario a. Concentration of Salmonella in peanut paste: 1.5 CFU/g b. Number of samples tested: 150 c. Number of samples positive: 0 d. Number of iterations: 214,286. This is for servings = 1.5 million pieces e. How many people are likely to get ill from this product?
7. Update the model to represent your preferred risk management scenario, based on demonstration condition simulations
a. How would this management scenario reduce risk?
Discussion Questions 1. What options does the company have for managing the risk associated with this situation? 2. Identify the key factors that will influence the decision that needs to be reached regarding the recall
of the boxes of chocolates that contain one piece of candy potentially containing contaminated peanut fondant.
a. What do you suggest they do? Recall or not, and why?

QMRA: Quantitative Microbial Risk Assessment FSHN 312 Lab Manual
Page 54 of 83
3. Based on our analysis of alternative scenarios, what might the company do to reduce the risk of Salmonella from peanut paste in the future?
a. For example, what could be included as a control point in a food safety plan?
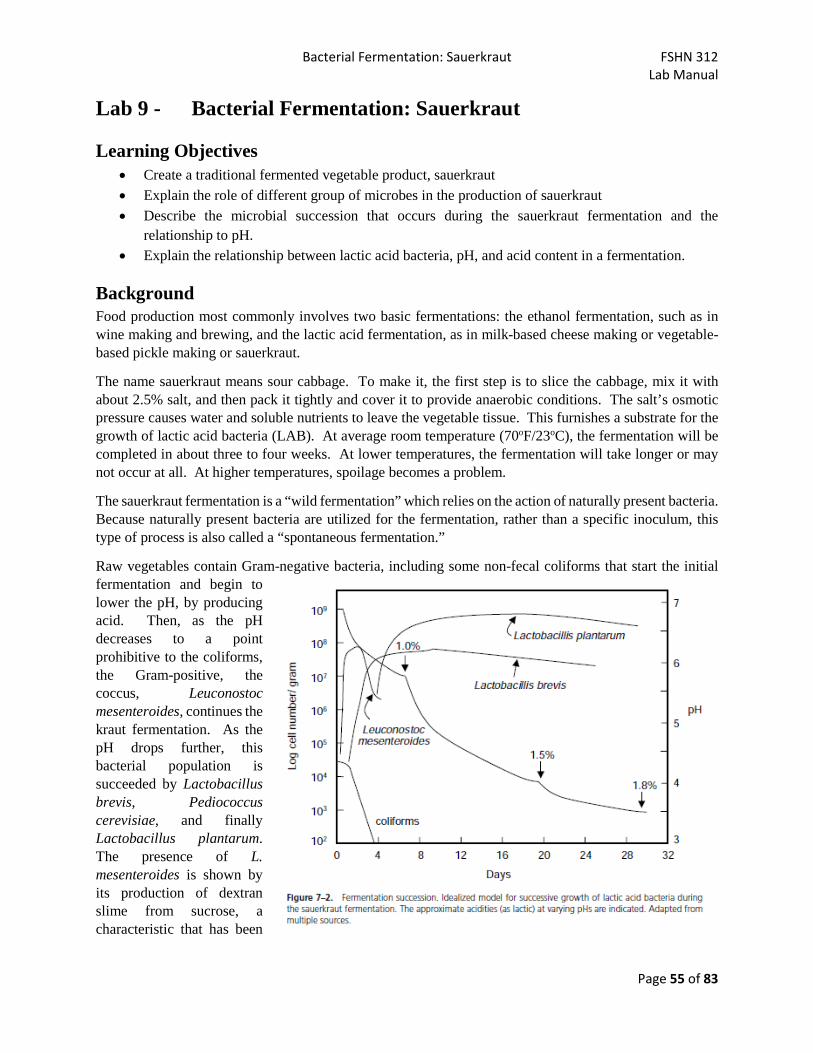
Bacterial Fermentation: Sauerkraut FSHN 312 Lab Manual
Page 55 of 83
Lab 9 - Bacterial Fermentation: Sauerkraut
Learning Objectives • Create a traditional fermented vegetable product, sauerkraut • Explain the role of different group of microbes in the production of sauerkraut • Describe the microbial succession that occurs during the sauerkraut fermentation and the
relationship to pH. • Explain the relationship between lactic acid bacteria, pH, and acid content in a fermentation.
Background Food production most commonly involves two basic fermentations: the ethanol fermentation, such as in wine making and brewing, and the lactic acid fermentation, as in milk-based cheese making or vegetable-based pickle making or sauerkraut.
The name sauerkraut means sour cabbage. To make it, the first step is to slice the cabbage, mix it with about 2.5% salt, and then pack it tightly and cover it to provide anaerobic conditions. The salt’s osmotic pressure causes water and soluble nutrients to leave the vegetable tissue. This furnishes a substrate for the growth of lactic acid bacteria (LAB). At average room temperature (70oF/23oC), the fermentation will be completed in about three to four weeks. At lower temperatures, the fermentation will take longer or may not occur at all. At higher temperatures, spoilage becomes a problem.
The sauerkraut fermentation is a “wild fermentation” which relies on the action of naturally present bacteria. Because naturally present bacteria are utilized for the fermentation, rather than a specific inoculum, this type of process is also called a “spontaneous fermentation.”
Raw vegetables contain Gram-negative bacteria, including some non-fecal coliforms that start the initial fermentation and begin to lower the pH, by producing acid. Then, as the pH decreases to a point prohibitive to the coliforms, the Gram-positive, the coccus, Leuconostoc mesenteroides, continues the kraut fermentation. As the pH drops further, this bacterial population is succeeded by Lactobacillus brevis, Pediococcus cerevisiae, and finally Lactobacillus plantarum. The presence of L. mesenteroides is shown by its production of dextran slime from sucrose, a characteristic that has been

Bacterial Fermentation: Sauerkraut FSHN 312 Lab Manual
Page 56 of 83
known to make it a troublesome contaminant in sugar processing.
An acidity of about 1.2% should be attained in a few weeks: eventually an acidity of 2.0% is possible.
The ideal dynamics of a sauerkraut fermentation are presented in Figure 7-2. Further details can be found in:
Hutkins, R. W. (2006). Fermented Vegetables. Microbiology and Technology of Fermented Foods. Oxford, UK: Blackwell Publishing Ltd. p 233-261.
This textbook chapter has been provided with pages 233-242 required reading. The rest is optional. Also consider chapter 2 of the same book, which has many more details on microbial fermentation metabolism.
Materials First lab period (day 0)
Pre-shredded cabbage in large plastic mixing bag, 1 kg (1/group) Uniodized salt (NaCl, iodine may affect fermentation) 2 L beaker as fermentation container (1/group) Large plastic bags (2/group) Balances (2-3/lab) Spatulas (1 per balance) Weigh boats (1/group, at balances)
Each lab period (days 0, 7, 14, 21, 28) Media
Plate count agar (PCA) plates (3/group/day) MacConkey agar (MAC) plates (3/group/early days) Sucrose-azide agar (SAA) plates (3/group/day)
Other
pH meter, calibrated 2, 50 mL burettes on stands NaOH, 0.1N (prepared fresh, ~ 500 mL) 125 mL flask (1/group) Phenolphthalein solution, 1% 1.5 mL microcentrifuge tubes (~7/group/day) 100 mL bottle of dilution buffer (1 bottle / group) 15 mL Falcon tubes (1/group/day) Disposable plastic spreaders (~10/group/day) 10 mL pipettes (1/group/day) Pipettemen P1000 pipettes, tips (1/group/day)
Procedures Day 0 1. Check for materials to start the fermentation
a. A 2L beaker used as the fermentation container, label it for your group b. A premeasured bag of shredded cabbage, 1000 g c. Two plastic bags d. Brine. If you’re missing a bottle, share with a close-by group
2. Add the appropriate amount of salt to the cabbage; mix thoroughly a. Groups will be assigned either 1%, 2%, or 3% (w/w) treatments
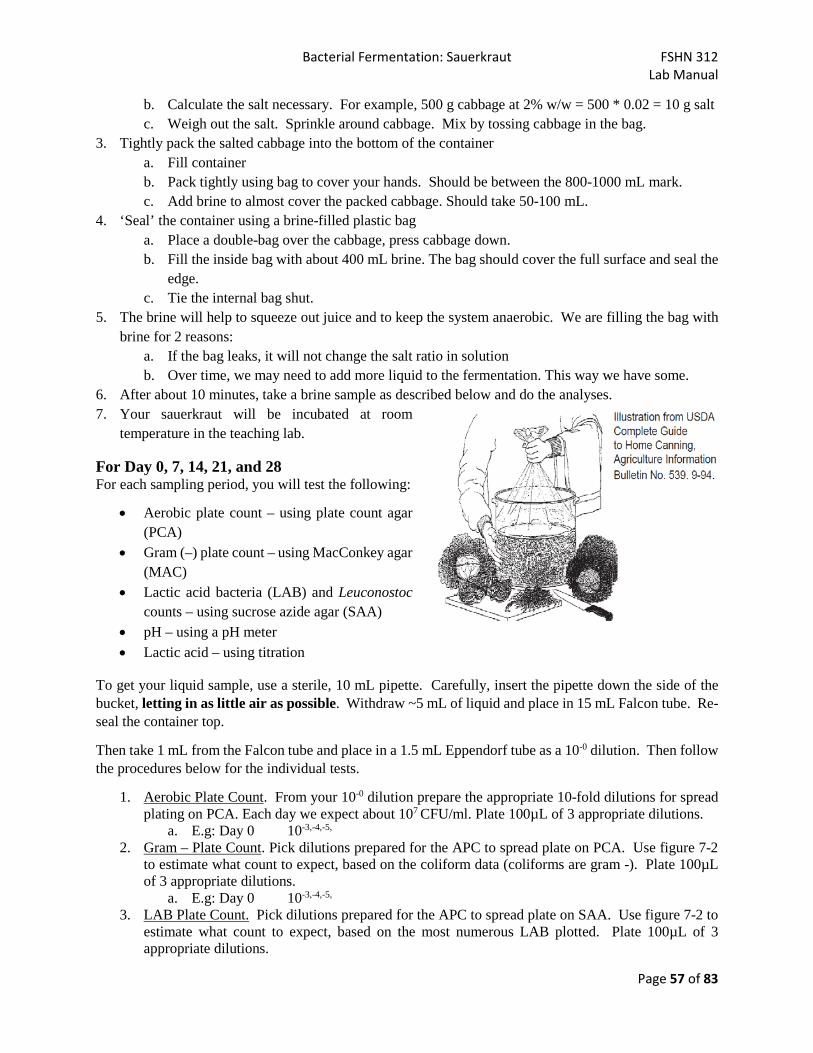
Bacterial Fermentation: Sauerkraut FSHN 312 Lab Manual
Page 57 of 83
b. Calculate the salt necessary. For example, 500 g cabbage at 2% w/w = 500 * 0.02 = 10 g salt c. Weigh out the salt. Sprinkle around cabbage. Mix by tossing cabbage in the bag.
3. Tightly pack the salted cabbage into the bottom of the container a. Fill container b. Pack tightly using bag to cover your hands. Should be between the 800-1000 mL mark. c. Add brine to almost cover the packed cabbage. Should take 50-100 mL.
4. ‘Seal’ the container using a brine-filled plastic bag a. Place a double-bag over the cabbage, press cabbage down. b. Fill the inside bag with about 400 mL brine. The bag should cover the full surface and seal the
edge. c. Tie the internal bag shut.
5. The brine will help to squeeze out juice and to keep the system anaerobic. We are filling the bag with brine for 2 reasons:
a. If the bag leaks, it will not change the salt ratio in solution b. Over time, we may need to add more liquid to the fermentation. This way we have some.
6. After about 10 minutes, take a brine sample as described below and do the analyses. 7. Your sauerkraut will be incubated at room
temperature in the teaching lab.
For Day 0, 7, 14, 21, and 28 For each sampling period, you will test the following:
• Aerobic plate count – using plate count agar (PCA)
• Gram (–) plate count – using MacConkey agar (MAC)
• Lactic acid bacteria (LAB) and Leuconostoc counts – using sucrose azide agar (SAA)
• pH – using a pH meter • Lactic acid – using titration
To get your liquid sample, use a sterile, 10 mL pipette. Carefully, insert the pipette down the side of the bucket, letting in as little air as possible. Withdraw ~5 mL of liquid and place in 15 mL Falcon tube. Re-seal the container top.
Then take 1 mL from the Falcon tube and place in a 1.5 mL Eppendorf tube as a 10-0 dilution. Then follow the procedures below for the individual tests.
1. Aerobic Plate Count. From your 10-0 dilution prepare the appropriate 10-fold dilutions for spread plating on PCA. Each day we expect about 107 CFU/ml. Plate 100µL of 3 appropriate dilutions.
a. E.g: Day 0 10-3,-4,-5, 2. Gram – Plate Count. Pick dilutions prepared for the APC to spread plate on PCA. Use figure 7-2
to estimate what count to expect, based on the coliform data (coliforms are gram -). Plate 100µL of 3 appropriate dilutions.
a. E.g: Day 0 10-3,-4,-5, 3. LAB Plate Count. Pick dilutions prepared for the APC to spread plate on SAA. Use figure 7-2 to
estimate what count to expect, based on the most numerous LAB plotted. Plate 100µL of 3 appropriate dilutions.

Bacterial Fermentation: Sauerkraut FSHN 312 Lab Manual
Page 58 of 83
a. E.g: Day 0 10-0 only, expected counts are low b. When counting plates, we should be able to differentiate two types of bacteria
i. Leuconostoc should be slimy and spread ii. All other LAB should not produce slime
4. pH. Using the pH meter, determine the pH of your 5 mL sample in the Falcon tube. a. Rinse electrode. Place in sample. Wait for reading to stabilize. b. Rinse electrode. Dry outside. Replace electrode in buffer.
5. Determination of Acidity. (skip on day 0) To the 5 mL of brine, add 5 drops of phenolphthalein indicator. Titrate with NaOH to a persistent pink color (end point pH for phenolphthalein is 8.3). Make sure you record the volume of NaOH it took to achieve the pink color. Also, make sure that every time you do this test the same shade of pink is obtained. Use the following formula to calculate the % lactic acid: % lactic acid = (ml NaOH) x (N NaOH) x (milliequivalent wt. of LA)(100)
wt. of sample or
% lactic acid = (? mL NaOH) x (0.1 N NaOH) x (0.09)(100)
6. Each day record your data in your lab notebook. Include a. Dilutions plated for each media. b. Plate counts for each dilution c. pH, NaOH used
7. Each day, use the raw data to calculate the values for the bacterial counts and % lactic acid. Add these to the results table. When you have completed the fermentation, plot a graph of pH, % lactic acid, and log CFU/ml for each bacterial group versus time in days. Include this in the results section of your lab report.
Day pH % Lactic Acid APC
[log(CFU/ml)] Gram - [log(CFU/ml)]
LAB [log(CFU/ml)]
Leuconostoc [log(CFU/ml)]
Example 6.2 0.25 7.2 4.5 7.0 <LOD 0 7 14 21 28
Discussion Questions 1. How did the sauerkraut appearance change over time? Did it end up spoiled? Why or why not? 2. How did the pH and lactic acid change over time?
a. What is the relationship between pH and lactic acid 3. How did the populations of microorganisms change over time? Which groups grew when? Which
groups died off? a. How did these changes relate to pH? b. What does this imply about the safety of the product?
Bacteriophage FSHN 312 Lab Manual
Page 59 of 83
Lab 10 - Bacteriophage
Learning Objectives Upon completion of this lab exercise, student should be able to:
• Describe the life cycle of a lytic bacteriophage • Compare the growth dynamics of an E. coli bacteriophage to the growth of the bacterial host • Describe how bacteriophage may impact food safety and food fermentation
Background Viruses are the most common biological entity in the world numbering approximately 1030‐1031 particles. The majority of viruses are those that infect bacteria, also called bacteriophages, or simply phages. Phages are ubiquitous throughout the environment and are found anywhere their bacterial hosts are present.
Bacteriophages can be either lytic or lysogenic. Lytic, also called “virulent, phages immediately begin replicating inside the bacterium and kill the host cell. In contrast, lysogenic, also called “temperate,” phage integrate their genetic material into the host genome where they passively replicate along with the host. Temperate phage can excise from the host chromosome and initiate the virulent lifecycle under the right conditions; typically these are conditions that stress or damage the host. The lytic cycle can be viewed as an escape mechanism for the temperate phage.
Although viruses are usually thought of as being harmful, phages have many potential beneficial applications. Phages are currently used as a form of biocontrol in food to prevent or ameliorate bacterial contamination. Here, a phage solution is applied to the food, packaging, or processing materials. Phage cocktails currently exist for the treatment of Listeria monocytogenes, Escherichia coli O157:H7 and Salmonella. Another phage application is for bacterial detection. Phage bind to specific surface structures of bacterial cells. This specificity allows phage to bind to certain bacteria. As a result the phage may be modified to release a fluorescent dye after binding to tell I there are bacteria in the culture susceptible to phage used. Finally, a third beneficial usage of phage is to treat bacterial infections. Although not commercially realized in the United States, Eastern European research has further developed phage treatment as an alternative to antibiotics.
Despite the potential for beneficial applications, phage can also be detrimental to the food industry and to public health. In the food industry, phage can disrupt any bacteria-based fermentation process, such as lactic acid fermentation in milk products. In fact, phages are the single most common cause of failed lactic acid fermentation, such as in yoghurt production. Contamination by phage in milk products often occurs when a small amount of phage present in a latent state in the starter culture infects bacteria once the bacteria starts to grow in the fermentation. Another source of contamination could be from a small number of phage present on processing equipment that can infect and kill the bacteria used in the fermentation. An example of clinical relevance comes from the transfer of virulence genes between bacteria by phage via transduction.
Bacteriophage T4 is a model lytic phage, which infects E. coli. In this lab, we will be modeling the effects of a phage infection on a culture of the susceptible host E. coli B. You will be infecting at a multiplicity of infection (MOI) of 0.1 and tracking the number of phage produced over time. MOI is a ratio between the number of infectious agents (phage) and target cells (bacteria). So, in this example there will be one bacteriophage for every ten bacteria. You will need to calculate the volume of phage suspension needed to infect your bacterial culture at an MOI of 0.1. At the end of this lab you should be able to calculate the doubling time of E. coli, describe how phage infection impacts the count of an E. coli culture.
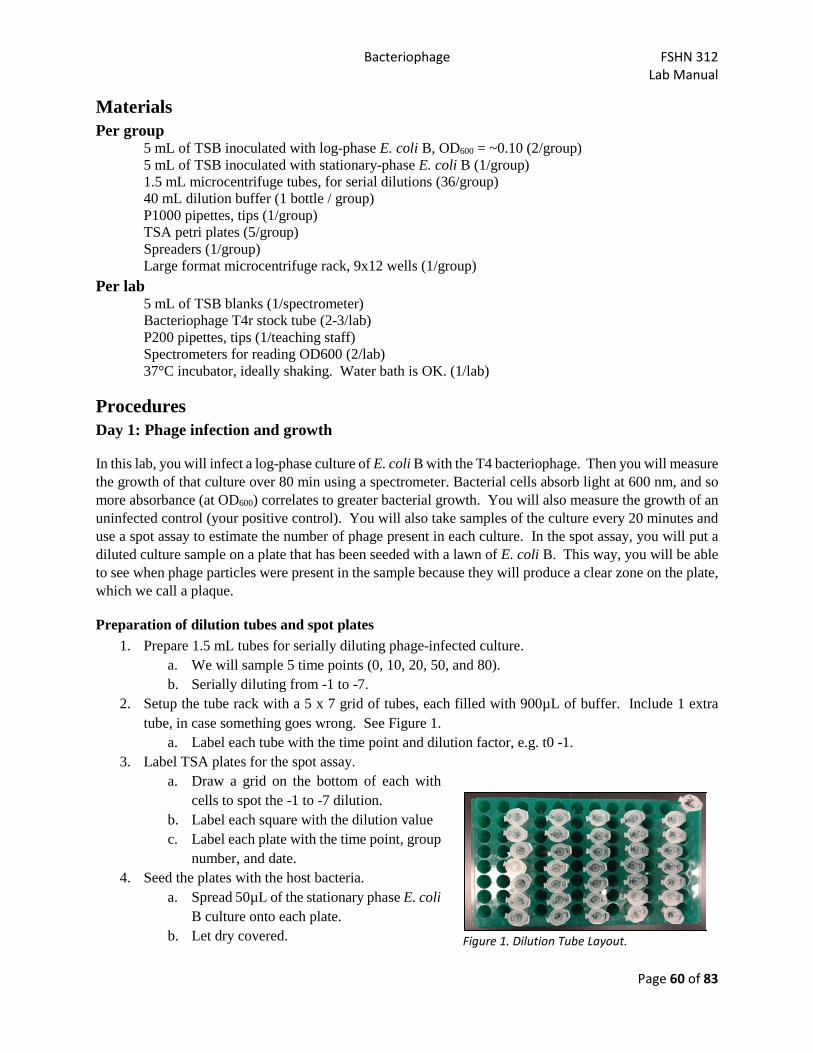
Bacteriophage FSHN 312 Lab Manual
Page 60 of 83
Materials Per group
5 mL of TSB inoculated with log-phase E. coli B, OD600 = ~0.10 (2/group) 5 mL of TSB inoculated with stationary-phase E. coli B (1/group) 1.5 mL microcentrifuge tubes, for serial dilutions (36/group) 40 mL dilution buffer (1 bottle / group) P1000 pipettes, tips (1/group) TSA petri plates (5/group) Spreaders (1/group) Large format microcentrifuge rack, 9x12 wells (1/group)
Per lab 5 mL of TSB blanks (1/spectrometer) Bacteriophage T4r stock tube (2-3/lab) P200 pipettes, tips (1/teaching staff) Spectrometers for reading OD600 (2/lab) 37°C incubator, ideally shaking. Water bath is OK. (1/lab)
Procedures Day 1: Phage infection and growth
In this lab, you will infect a log-phase culture of E. coli B with the T4 bacteriophage. Then you will measure the growth of that culture over 80 min using a spectrometer. Bacterial cells absorb light at 600 nm, and so more absorbance (at OD600) correlates to greater bacterial growth. You will also measure the growth of an uninfected control (your positive control). You will also take samples of the culture every 20 minutes and use a spot assay to estimate the number of phage present in each culture. In the spot assay, you will put a diluted culture sample on a plate that has been seeded with a lawn of E. coli B. This way, you will be able to see when phage particles were present in the sample because they will produce a clear zone on the plate, which we call a plaque.
Preparation of dilution tubes and spot plates 1. Prepare 1.5 mL tubes for serially diluting phage-infected culture.
a. We will sample 5 time points (0, 10, 20, 50, and 80). b. Serially diluting from -1 to -7.
2. Setup the tube rack with a 5 x 7 grid of tubes, each filled with 900µL of buffer. Include 1 extra tube, in case something goes wrong. See Figure 1.
a. Label each tube with the time point and dilution factor, e.g. t0 -1. 3. Label TSA plates for the spot assay.
a. Draw a grid on the bottom of each with cells to spot the -1 to -7 dilution.
b. Label each square with the dilution value c. Label each plate with the time point, group
number, and date. 4. Seed the plates with the host bacteria.
a. Spread 50µL of the stationary phase E. coli B culture onto each plate.
b. Let dry covered. Figure 1. Dilution Tube Layout.
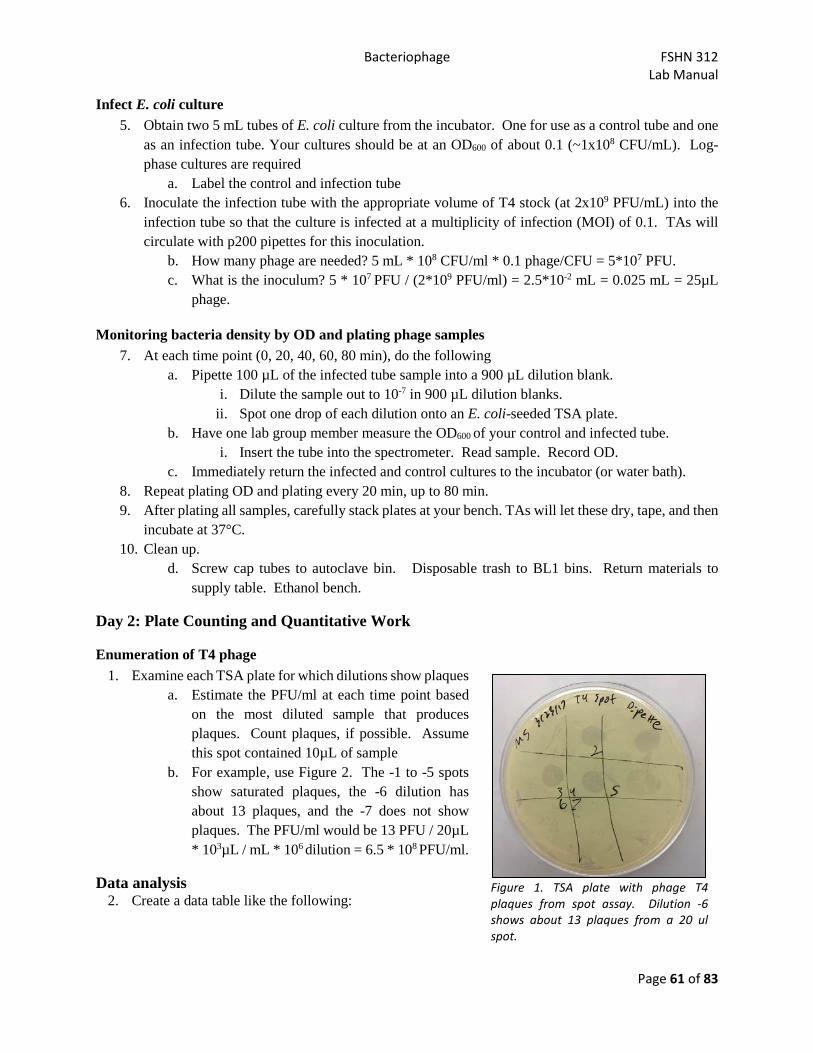
Bacteriophage FSHN 312 Lab Manual
Page 61 of 83
Infect E. coli culture 5. Obtain two 5 mL tubes of E. coli culture from the incubator. One for use as a control tube and one
as an infection tube. Your cultures should be at an OD600 of about 0.1 (~1x10⁸ CFU/mL). Log-phase cultures are required
a. Label the control and infection tube 6. Inoculate the infection tube with the appropriate volume of T4 stock (at 2x10⁹ PFU/mL) into the
infection tube so that the culture is infected at a multiplicity of infection (MOI) of 0.1. TAs will circulate with p200 pipettes for this inoculation.
b. How many phage are needed? 5 mL * 108 CFU/ml * 0.1 phage/CFU = 5*107 PFU. c. What is the inoculum? 5 * 107 PFU / (2*109 PFU/ml) = 2.5*10-2 mL = 0.025 mL = 25µL
phage.
Monitoring bacteria density by OD and plating phage samples 7. At each time point (0, 20, 40, 60, 80 min), do the following
a. Pipette 100 µL of the infected tube sample into a 900 µL dilution blank. i. Dilute the sample out to 10-7 in 900 µL dilution blanks.
ii. Spot one drop of each dilution onto an E. coli-seeded TSA plate. b. Have one lab group member measure the OD600 of your control and infected tube.
i. Insert the tube into the spectrometer. Read sample. Record OD. c. Immediately return the infected and control cultures to the incubator (or water bath).
8. Repeat plating OD and plating every 20 min, up to 80 min. 9. After plating all samples, carefully stack plates at your bench. TAs will let these dry, tape, and then
incubate at 37°C. 10. Clean up.
d. Screw cap tubes to autoclave bin. Disposable trash to BL1 bins. Return materials to supply table. Ethanol bench.
Day 2: Plate Counting and Quantitative Work
Enumeration of T4 phage 1. Examine each TSA plate for which dilutions show plaques
a. Estimate the PFU/ml at each time point based on the most diluted sample that produces plaques. Count plaques, if possible. Assume this spot contained 10µL of sample
b. For example, use Figure 2. The -1 to -5 spots show saturated plaques, the -6 dilution has about 13 plaques, and the -7 does not show plaques. The PFU/ml would be 13 PFU / 20µL * 103µL / mL * 106 dilution = 6.5 * 108 PFU/ml.
Data analysis 2. Create a data table like the following:
Figure 1. TSA plate with phage T4 plaques from spot assay. Dilution -6 shows about 13 plaques from a 20 ul spot.
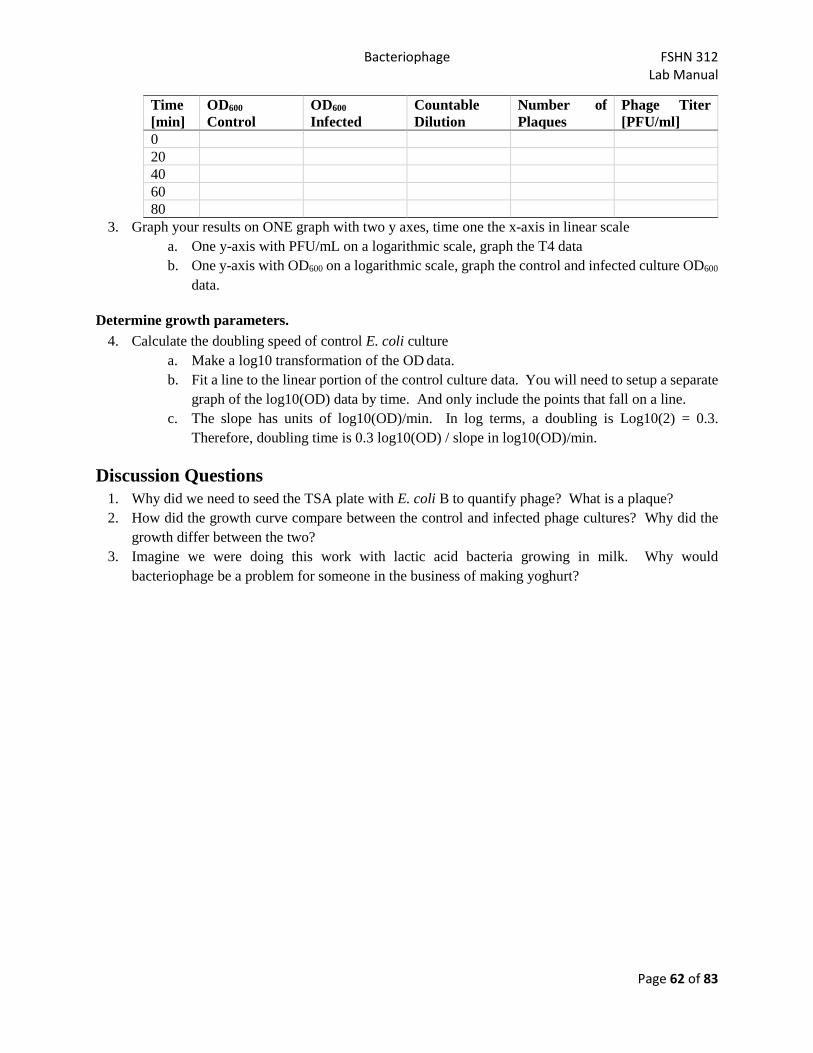
Bacteriophage FSHN 312 Lab Manual
Page 62 of 83
Time [min]
OD600 Control
OD600 Infected
Countable Dilution
Number of Plaques
Phage Titer [PFU/ml]
0 20 40 60 80
3. Graph your results on ONE graph with two y axes, time one the x-axis in linear scale a. One y-axis with PFU/mL on a logarithmic scale, graph the T4 data b. One y-axis with OD600 on a logarithmic scale, graph the control and infected culture OD600
data.
Determine growth parameters. 4. Calculate the doubling speed of control E. coli culture
a. Make a log10 transformation of the OD data. b. Fit a line to the linear portion of the control culture data. You will need to setup a separate
graph of the log10(OD) data by time. And only include the points that fall on a line. c. The slope has units of log10(OD)/min. In log terms, a doubling is Log10(2) = 0.3.
Therefore, doubling time is 0.3 log10(OD) / slope in log10(OD)/min.
Discussion Questions 1. Why did we need to seed the TSA plate with E. coli B to quantify phage? What is a plaque? 2. How did the growth curve compare between the control and infected phage cultures? Why did the
growth differ between the two? 3. Imagine we were doing this work with lactic acid bacteria growing in milk. Why would
bacteriophage be a problem for someone in the business of making yoghurt?
Bacterial Fermentation: Lactic Acid Bacteria and Yoghurt FSHN 312 Lab Manual
Page 63 of 83
Lab 11 - Bacterial Fermentation: Lactic Acid Bacteria and Yoghurt
Learning Objectives Upon completion of this lab, students should be able to
• Describe the major genera of lactic acid bacteria and their key phenotypic characteristics • Use selective media to isolate lactic acid bacteria from a commercial yoghurt • Evaluate a ‘live and active cultures’ label claim using microbiology data
Background The lactic acid bacteria (LAB) are gram-positive, facultative anaerobic, non-motile, non-sporulating rods or cocci which derive their energy through the fermentation of carbohydrates, producing lactic acid as a major fermentative product. LAB do not obtain energy by respiratory means. They ferment glucose to produce lactic acid (and sometimes other products) in the same way, regardless of whether oxygen is present. Many species of LAB grow best at low oxygen tensions, and although lactic acid bacteria can be grown aerobically on the surfaces of agar plates, some species such as Lactobacillus bulgaricus grow better if the plates are incubated anaerobically. Regardless of how the plates are incubated, the colonies that develop will be small and white. They are white because lactic acid bacteria do not produce pigments. They are small because the fermentation of carbohydrates does not yield much energy; LAB must break down a lot of sugar and produce many fermentation products to get enough energy to grow. In most media, LAB will run out of sugar and/or produce enough acid to inhibit their own growth before the colonies get very big (although LAB have a high tolerance for acid, they will eventually produce enough to inhibit themselves).
LAB have very limited synthetic capabilities; therefore, they have very extensive nutritional requirements and are often described as nutritionally fastidious. Defined media for LAB contain large numbers of ingredients and, even so, they do not work very well.
The lactic acid bacteria are subdivided into the following genera:
Genus Description
Streptococcus: Cocci which divide in one plane only to produce pairs and chains. Homofermentative Enterococcus:
Lactococcus:
Pediococcus: Cocci which divide in two planes forming tetrads. Homofermentative
Leuconostoc: Cocci which divide in one plane only. Heterofermentative
Lactobacillus: Rods. May be either homofermentative or heterofermentative
Morphology All lactic acid bacteria are gram positive and, like some other Gram-positive organisms such as Bacillus, they easily become gram negative with age.
Cell morphology and arrangement are important in the classification of lactic acid bacteria. Lactobacillus species are rods which divide in one plane only and are often found in pairs or chains. Some species such
Bacterial Fermentation: Lactic Acid Bacteria and Yoghurt FSHN 312 Lab Manual
Page 64 of 83
as L. bulgaricus are long rods; others, such as L. casei and L. plantarum, are short rods. The length of rods varies with culture age and in different media.
Streptococci, lactococci and enterococci are cocci in chains, pairs and, very frequently, chains of pairs. They form chains because they divide in one plane only. Different species vary in cell size and chain length. Leuconostoc looks very much like Streptococcus, Enterococcus and Lactococcus. Pediococcus is different because members of this genus divide in two planes producing tetrads as well as pairs.
Catalase test Among the many things which lactic acid bacteria cannot synthesize are heme proteins, including the catalase enzyme. Their lack of cytochromes, which are heme proteins, accounts for their lack of respiratory metabolism. Most bacteria that have an oxidative metabolism including Micrococcus, Staphylococcus, Bacillus, Pseudomonas, and the Enterobacteriaceae are catalase positive. Clostridium and the LAB are, in general, catalase negative.
Basics of Yoghurt Fermentation In the lab, we use yoghurt as a model of LAB-based food fermentation. Heat treated milk is inoculated with a LAB starter culture. Usually the starter contains Lactobacillus delbrueckii subsp. bulgaricus and Streptococcus thermophilus. These are both homofermentative organisms. Lactose is hydrolyzed to glucose and galactose. The glucose is fermented to lactic acid by the EMP pathway. Some galactose is utilized by L. bulgaricus, but the remainder adds sweetness to balance the lactic acid. Commonly, warm inoculated milk is aseptically packed into finished product containers and allowed to ferment in that pack. This is called but set yoghurt. Other products might have other post-fermentation process. Greek yoghurt is strained.
Suggested Reading It is highly suggested you read relevant portions of Chapter 2 of the Food Fermentations textbook, previously suggested for the sauerkraut fermentation:
• Taxonomic, phenotypic, and use of LAB, p.20-35 • Fermentative metabolism relevant to LAB, p. 43-57
Materials Day 1
M17 agar plates (3/group) Lactobacillus MRS agar plates (3/group) PCA agar plates (4/group) ~90 mL dilution blank (1/group) Microcentrifuge tubes (6/group) Sterile dilution buffer (1 bottle / group) P1000 pipettes, tips Scale, weight boats pH meter Yogurt samples (1/group)
Day 2 H2O2 for Catalase test E. coli culture (+ control for Catalase test) Toothpicks
Bacterial Fermentation: Lactic Acid Bacteria and Yoghurt FSHN 312 Lab Manual
Page 65 of 83
Procedures In this lab we will attempt to selective enumerate different groups of bacteria from a commercial yoghurt using a combination of intrinsic parameters (selective media) and extrinsic parameters (oxygenic status of incubation). Then we will examine the results to learn more about LAB microbiology, including possible characterization by a catalase test or 16S rRNA sequencing. Our specific media and incubation conditions and design are:
• Plate count agar (PCA). Aerobic. Non-selective for aerobes or facultative anaerobes • Plate count agar (PCA). Anaerobic. Non-selective for anaerobes. • M17 agar. Media nutritionally permissive and moderately selective for Streptococci • Lactobacillus MRS agar. Media nutritionally permissive and moderately selective for Lactobacilli
Day 1 1. Prepare a 1:10 (w/w) dilution of a commercial yoghurt sample
a. Check the label for the volume of water in the dilution bottle b. Weight out the appropriate amount of yoghurt sample. E.g. 10 g yoghurt for 90 mL (or g)
water. c. Add yoghurt to bottle, shake to homogenize.
2. Serially dilute yoghurt for spread plating. Dilute from -2 to -7 using micro-centrifuge tubes. 3. Spread plate the following:
a. Plate count agar (PCA): -5 and -7, label for ‘aerobic’ incubation b. Plate count agar (PCA): -5 and -7, label for ‘anaerobic’ incubation c. M17 agar (M17): -3, -5, and -7. aerobic incubation d. Lactobacillus MRS agar (MRS): -3, -5, and -7. aerobic incubation
4. Measure the pH of the yoghurt. Use -1 dilution bottle and pH meter.
Day 2 1. Examine spread plates for different morphologies
a. Compare observations to example pictures to get a sense of which bacteria may be present b. Count the number of different morphologies on each plate
2. Count plates according to standard counting rules a. Calculate the cell density in the yoghurt of bacteria enumerated on each agar
3. Optional work we may perform in the lab a. Catalase test of presumptive LAB colonies. Use toothpick to submerge colonies into a tube
of peroxide. Remember, LAB are usually catalase negative. b. You may save interesting plates for the spoilage lab. You could pick individual colonies
and use 16S rRNA sequencing to identify the species.
Additional Questions 1. What did you learn about finished yoghurt microbiology? Comment on the diversity of the ecosystem
and the major genera observed. 2. How did the bacteria counts and colony morphologies compare between the aerobically and
anaerobically incubated PCA plates? If there were differences, what might they mean?

Bacterial Fermentation: Lactic Acid Bacteria and Yoghurt FSHN 312 Lab Manual
Page 66 of 83
3. Many yoghurt and other fermented dairy products make a claim like ‘1 billion live and active cultures per serving’. How did the data you collected support or refute this claim? If you product lab made a claim, please evaluate the specific claim of your product.
Spoilage Microbes FSHN 312 Lab Manual
Page 67 of 83
Lab 12 - Spoilage Microbes
Learning Objectives • Describe how storage temperature influences food spoilage • Perform laboratory steps for 16s rRNA genes sequencing, including: DNA extraction, PCR, gel
electrophoresis, and sequence analysis • Identify spoilage microbes in a food using 16S rRNA gene sequences
Background Many foods possess a characteristic microbiota from the environment where the food was grown or produced, or from the post-harvest food processing environment. Produce grown in a field is likely to contain microbes present in soil or water. Raw milk can contain microorganisms present on the udder or hide of the dairy cow. Muscle tissue of healthy animals contains few, if any, bacteria; however, once the animals are slaughtered and muscle tissue is harvested, the exposed surface of the tissue can become contaminated in the processing plant environment. For this reason, spoilage of whole cuts of meat and poultry tends to be a surface problem. In contrast, in ground meat products microorganisms are generally distributed throughout the product.
Many naturally-occurring bacteria can cause spoilage of fresh foods, including meat, seafood, and plants. Most of these spoilage microbes are Gram-negative, psychrotrophic, and can therefore grow at 0-20°C, promoting spoilage of refrigerated foods. For example, Gram-negative aerobic spoilage organisms include Erwinia, Pseudomonas, Aveinetobacter, Alteromonas, Flavobacterium, Moraxella and Alcaligenes. Although refrigeration does extend the shelf life of perishable foods, psychrotrophs will eventually cause spoilage. If chicken contains about 104 microorganisms/cm2, then it will become spoiled in about 2 weeks at refrigeration temperature. Pseudomonas species will spoil refrigerated fish within one week, and psychrotrophs can spoil refrigerated raw milk within a week. Vegetables that are wet and have the biological barrier removed (ex: sliced or peeled cucumbers) can spoil within 1-2 weeks in the refrigerator. Spoilage is generally the result of bacterial metabolic activity. Also proteases, lipases and pectinases may enzymatically break down food proteins, lipids, and pectins, producing off-odors and flavors and sometimes a slimy texture. Noticeable spoilage of these foods at refrigeration temperature usually occurs when bacterial populations reach 107 to 108 CFU/g or mL, or greater.
Certain types of bacteria produce spores in response to environmental stressors. The spores serve as dormant forms of cells that are more resistant to heat, dehydration, freezing and irradiation than the vegetative form of the cells. Spores may withstand some food processing conditions, which causes some concern for food spoilage and food safety reasons.
Mesophilic sporeforming aerobes and facultative anaerobes. The genera Bacillus contains aerobic and facultative anaerobic sporeforming bacteria of importance in foods. Bacillus spores are widespread in nature, and can be found in soil, water, vegetation, and are therefore found in foods. Bacillus species are catalase positive, rod-shaped bacteria that can produce endospores under aerobic conditions. Bacillus species designated as mesophiles can grow at 35°C, but not at 55°C. These mesophilic sporeformers can cause spoilage in improperly processed low-acid and acidic foods, fruit juice, milk, and many other products.
Since bakery products do not receive sporicidal heat treatments, mesophilic, aerobic spores may cause spoilage under certain conditions. Bacillus subtilis can cause a defect known as ropey bread, where spores

Spoilage Microbes FSHN 312 Lab Manual
Page 68 of 83
survive high temperatures during baking, then germinate and grow inside the loaf. These vegetative cells degrade the internal loaf (aW of 0.95), producing a sticky slime with strings of mucus and a ripe melon odor. Unclean equipment can also contribute to spores in the bread. Such problems are rare now because of improved sanitation, ingredient quality and use of calcium propionate and potassium sorbate as preservatives. However, recent trends of reducing or eliminating preservative use in baked goods may increase risk for B. subtilis contamination.
Mesophilic sporeforming anaerobes. The mesophilic sporeforming anaerobes of greatest interest in foods are (i) Clostridium sporogenes and other putrefactive anaerobes; (ii) proteolytic and nonproteolytic Clostridium botulinum strains, and (iii) Clostridium perfringens, and butyric anaerobes (C. butyricum and C. pasteurianum), which are not resistant to heat. These spores are found in soil, water and the intestinal tract of humans and animals. Putrefactive anaerobes digest proteins, peptides, and amino acids anaerobically to produce foul-smelling sulfur-containing compounds such as hydrogen sulfide, as well as ammonia, indole, and carbon dioxide. Clostridium spores cause problems only in under processed low-acid foods, because they do not grow at pH < 4.6. Low acid thermal processing conditions are designed to destroy non-proteolytic strains such as C. botulinum, due to its severe harm potential. Butyric anaerobes can grow at pH as low as 4.35, so they can spoil fruits that receive insufficient heat treatment.
Flat sour sporeformers. “Flat sour” bacteria are thermophilic, facultative sporeforming aerobes. They are capable of spoiling certain low acid foods by fermenting carbohydrates to acid which “sour” the product, but without production of gas to change the “flat” ends of the can. Most flat sour bacteria are obligate thermophiles, and the upper limit of growth is around 75°C. Bacillus stearothermophilus and some Clostridium species typically causes flat sour spoilage of canned low acid foods, depending on other conditions such as temperature and pH.
Acidophilic sporeformers. Alicyclobacillus acidoterrestris is an acidophilic sporeformer which is a concern in fruit products, because it can grow at pH 2 to 5. Some strains are aerobic, while others are facultatively anaerobic. This microorganism is associated with fruits such as apples, berries, cranberries, grapes, grapefruit, oranges, pears, and tomatoes. It is a soil-borne spore that contaminates the fruit in the field, and survives the heat process performed on many fruit products. The minimum temperature of growth ranges from 20 to 35°C, depending on pH, type of fruit and spore level. Spoilage of juice is due to off flavors from phenol compounds and can occur at low spore levels (100 cells/mL); therefore, contaminated juice may visually appear normal.
Materials First lab period Foods Students are encouraged to bring a spoiled food product from home. Otherwise: Milk (control) Milk (stored at room temperature for 1 day) Deli meat (control) Deli meat (stored at room temperature for 1 day) Apple juice (control) Apple juice (stored at room temperature for 1 day) Media Plate count agar (1 / person) Other materials ~400 mL dilution buffer (1 / group, shared bottles) Stomacher bags (1 / person)
Spoilage Microbes FSHN 312 Lab Manual
Page 69 of 83
100 mL graduated cylinders (1 / group) Balances, weighing paper, spatulas Disposable plastic loops (3 / person) Second lab period Cultures E. coli on PCA, streaked to isolation (1 / group) Equipment Heat block at 95°C P20 and P1000 pipettes and tips (TAs will distribute) Materials
Sterile toothpicks (~12 / group) Sterile 1.5mL tubes Sterile water (~6 mL / group) Sterile 1.5 mL microcentrifuge tubes (12 / group) PCR tubes (12 / group)
PCR master-mix (~575µL / group) Forward primer (1 tube / group), may be in master mix Reverse primer (1 tube / group), may be in master mix Third lab period Equipment Pipettes and tips Materials
1.5% agarose gels (6, groups will share) Gel electrophoresis units (a few) 40µL aliquots of loading dye (1 / group)
Parafilm (1 / group) Aliquots of ExoSap (1 / group) PCR tubes (10 / group)
Procedures The purpose of this laboratory is to analyze spoiled foods using 16S rRNA sequencing to identify the microbes isolated from each food. Each person will sequence a few microbes isolated from food products, either spoiled foods from home, the lab, or from in-class fermentations. Identification of the microbes present in a spoiled food can provide useful information to food processors about how their process could be improved to increase the shelf-life of a product.
First lab period 1. Make a 1:10 dilution of your food sample. Either home spoiled food, something provided in class,
or sampled saved from a previous lab. a. Suggest 5 g or mL into 45 mL dilution buffer to save on reagents. You can use 11 g or mL
into 99 mL (as is indicated in standard methods for milk. b. Combine in Whirlpack bag c. Mix by hand, or use stomacher if available.
2. Streak to isolation on plate count agar. Use 3 or 4 zone technique a. Streak zone one with a sterile loop b. Streak additional zones with new loops

Spoilage Microbes FSHN 312 Lab Manual
Page 70 of 83
c. Let dry 3. Place plates in bins for incubation at a temperature appropriate to the spoilage conditions
a. 4C for foods spoiled under refrigeration b. Room temp for foods spoiled at RT c. 30C for juice samples, to enrich for acidophilic sporeformers
4. Write down a few predictions on which microbes may show up on your plates
Second lab period 1. Observe the different types of colonies on your plates. Pick two for sequencing. 2. Prepare two lysis tubes (per person) + 2 control tubes. 500µL of sterile water in a 1.5mL tube. 3. Use a sterile toothpick to select a small portion of a colony. Transfer to lysis tube.
a. Prepare controls for each group i. Positive control: add a colony from the E. coli plate
ii. Negative control: add nothing 4. Perform heat lysis. Cells will release DNA
a. Place the tubes in a heat block at 95°C for 10 minutes. 5. Allow the tubes to cool. Then centrifuge for 5 minutes at 13,000 rpm to collect the cell debris.
a. The DNA will be in solution. b. Denatured proteins and parts of the cell membrane will form a pellet.
6. Prepare the PCR tubes. These are the small 0.2 mL tubes. a. Add 12 µL of the PCR master-mix to each of your PCR tubes b. Add 2 µL of forward primer. Pipette into the master-mix, not onto the wall of the tube. c. Add 2 µL of reverse primer.
7. Add DNA templates a. For sample tubes, add 2 µL of DNA template (supernatant) to single tubes b. For control tubes, add 2µL of E. coli lysate (+ control) or sterile water tube (- control)
8. Clearly label all tubes and place in rack at the supply table. a. Teaching team will run the PCR reaction.
i. Initial melting: 5 min at 95C ii. 35 cycles
1. Melting, 30 s at 95C 2. Annealing, 60 s at 54C 3. Extension, 2 min at 72C
iii. Final extension, 72C for 7 min iv. Hold at 4C until use
Third lab period 1. Obtain your PCR reaction tubes from last week. 2. Get a piece of parafilm and an aliquot of EZ vision loading dye 3. Load gel. Ideally near electrophoresis unit, but we may do a ‘dry’ load at your bench
a. Pipet 1 drop per PCR reaction of loading dye (~3µL) onto the parafilm b. Pipet 10 µL of the reaction onto the drop of loading dye. Pipet to mix c. Pipet into the appropriate well of the gel d. Record the location of each sample on the gel.

Spoilage Microbes FSHN 312 Lab Manual
Page 71 of 83
4. Keep track of the location of your group’s samples on the gel. Once all the samples are loaded, the gels will be run for ~30 minutes at 100V.
5. Monitor progress by watching the loading dye migrate 6. Once gels have finished running, they will be imaged and you will get a picture of the results. 7. Every unknown sample that showed amplification of the 16S rRNA gene will be sent for
sequencing. To prepare for sequencing, we need to remove primers b. Transfer 20µL to a new PCR tube. c. Add 8µL of the ExoSap mixture to each tube and mix well by pipetting. The ExoSap
contains an exonuclease that degrades single stranded DNA (such as the primers used for the PCR).
d. Clearly label each tube, and give to the instructor. The tubes will be held at 37°C for optimum activity of the ExoSap, and then sent for sequencing.
For a refresher of the analysis process, you can do the virtual lab demo: http://www.hhmi.org/biointeractive/bacterial-identification-virtual-lab
Fourth lab period 1. The instructor will send your group all the of sequences from your isolates 2. Meet in the computer lab for a demonstration of how to identify your bacteria by the 16S sequencing
using the Ribosomal Database Project website (http://rdp.cme.msu.edu/index.jsp) 3. Determine which bacteria were present in your sample. Compare with your group.
Discussion Questions 1. Which microbes did you predict would be present in your sample? Was your prediction correct? 2. What are at least two potential sources of the microbes you identified in your sample? What are
intrinsic and extrinsic factors that would facilitate their growth in your food sample? 3. What are the spoilage defects that can be caused by the microbes you identified in your sample? Be
specific to the identified organism and your sample. 4. Discuss spoilage by psychrotrophic, mesophilic, and thermophilic microorganisms. Which type of
organism was most likely present in your sample? Why?
Yeast Fermentations: Winemaking FSHN 312 Lab Manual
Page 72 of 83
Lab 13 - Yeast Fermentations: Winemaking
Learning Objectives The goals of this experiment are to:
• Use traditional brewing tools to measure sugar or alcohol in ferments. • Estimate the amount of alcohol made by yeast as they ferment sugar. • Make ethanol in a small-scale fermentation and from grape juice.
Background Overview There are three parts to this experiment.
• In part A we will use traditional tools: balances and graduated cylinders to measure the density or specific gravity of aqueous solutions, a hydrometer to measure specific gravity, a vinometer to measure concentration of alcohol, and a refractometer to measure alcohol and sugar concentrations.
• In the part B, we will set up an ethanol fermentation culture and estimate the ethanol production using a hydrometer, a vinometer, and a refractometer.
• In part C, we will make some wine. The purpose of this part of the experiment is to familiarize students with the basic steps of wine production.
Alcohol Fermentation Produces Carbon Dioxide In this experiment we look at the ability of the yeast Saccharomyces cerevisiae to produce ethanol by the anaerobic fermentation of sucrose.
Fermentation is a form of anaerobic metabolism in which the terminal electron acceptor (the final oxidizing reagent) is an organic compound and most of the ATP is generated by substrate level phosphorylation reactions. This contrasts with respiration where the terminal electron acceptor is an oxidized mineral such as oxygen in aerobic respiration or nitrate or sulfate etc. for anaerobic respiration, with most of the ATP generation involving the proton motive force.
Fermentation is an inefficient form of metabolism, as the food source is only partially oxidized. Often the waste products of fermentation can be broken down by aerobic organisms to yield energy. For example, lactic acid can be converted to pyruvate by a one-step oxidation, and ethanol can be oxidized to acetate by a two-step oxidation.
Acetate can be attached to coenzyme-A and then fed into the Krebs cycle to yield energy, or it can be used to make fatty acids. But fermentation does allow a microorganism to make some ATP in the absence of both oxygen and oxidized minerals.
Sugars are common food sources for fermentative microorganisms. There are many different types of sugar and the metabolism of each type requires specific enzymes.
Since no species of microorganism can make all possible enzymes, there are sugars that can be fermented by some species of yeast but not others.

Yeast Fermentations: Winemaking FSHN 312 Lab Manual
Page 73 of 83
The most common sugar in fruit juice is the disaccharide sucrose. The first step in the metabolism of sucrose is to break it down into a molecule of glucose and a molecule of fructose. The enzyme that catalyzes the hydrolysis of sucrose to these two hexoses is called "invertase". Glucose and fructose can then be partially oxidized to pyruvate by the reactions of the Embden-Meyerhoff pathway, also known as glycolysis.
Ethanol Fermentation of Glucose
The reactions of glycolysis produce a gain of two molecules of ATP for each molecule of hexose that is converted to pyruvate. But for each molecule of hexose that is partially oxidized to pyruvate, two molecules of the electron carrier NAD must be reduced to NADH. In aerobic respiration, the pyruvate can be completely oxidized to carbon dioxide via the reactions of the Krebs cycle, but these reactions result in the reduction of a lot of NAD to NADH. If oxygen is available, the NADH can be oxidized back to NAD and much more energy is released. But in the absence of oxygen, the only way to recycle the NADH is to reduce the pyruvate to either lactic acid or ethanol.
The assay for fermentation that we will use in this experiment is based on the density of the culture medium. As sucrose in the grape juice is converted to ethanol the mass of the culture will decrease due to the production and evaporation of carbon dioxide. And since ethanol is less dense than sugar, the density of the culture medium will decrease.
The overall equation for the fermentation of sucrose to ethanol is:
𝐶𝐶12𝐻𝐻22𝑂𝑂11 + 𝐻𝐻2𝑂𝑂 → 4(𝐶𝐶𝐻𝐻3𝐶𝐶𝐻𝐻2𝑂𝑂𝐻𝐻) + 4𝐶𝐶𝑂𝑂2
Or, one mole of sucrose yields four moles of ethanol and four moles of CO2.
Sucrose has a formula weight (F.W.) of 342 g/mole, water has a F.W. of 18 g/mole, ethanol has a F. W. of 46 g/mole, and CO2 has a F.W. of 44 g/mole. If 1.0 mole of sucrose (342 g) is converted to ethanol and carbon dioxide, the culture should lose about 176 g of mass as CO2 bubbles out, and 184 g of ethanol is produced.
Measuring Alcohol Production In this lab we will use 3 tools to estimate alcohol production in a fermentation reaction.
• Hydrometer. Measures the density of a solution, which can be correlated to the sugar concentration before and after fermentation. We will use this information to estimate the amount of ethanol made. The basis for this method is that changing sugar to ethanol and carbon dioxide reduces the density of the solution.
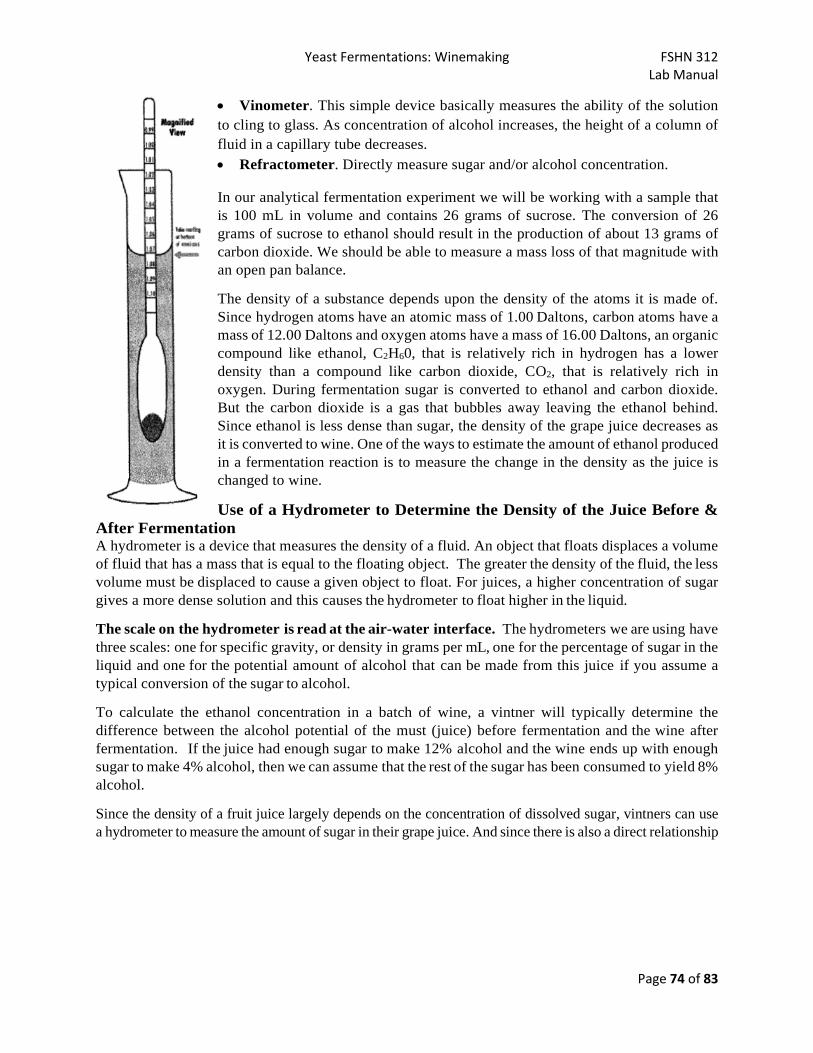
Yeast Fermentations: Winemaking FSHN 312 Lab Manual
Page 74 of 83
• Vinometer. This simple device basically measures the ability of the solution to cling to glass. As concentration of alcohol increases, the height of a column of fluid in a capillary tube decreases. • Refractometer. Directly measure sugar and/or alcohol concentration.
In our analytical fermentation experiment we will be working with a sample that is 100 mL in volume and contains 26 grams of sucrose. The conversion of 26 grams of sucrose to ethanol should result in the production of about 13 grams of carbon dioxide. We should be able to measure a mass loss of that magnitude with an open pan balance.
The density of a substance depends upon the density of the atoms it is made of. Since hydrogen atoms have an atomic mass of 1.00 Daltons, carbon atoms have a mass of 12.00 Daltons and oxygen atoms have a mass of 16.00 Daltons, an organic compound like ethanol, C2H60, that is relatively rich in hydrogen has a lower density than a compound like carbon dioxide, CO2, that is relatively rich in oxygen. During fermentation sugar is converted to ethanol and carbon dioxide. But the carbon dioxide is a gas that bubbles away leaving the ethanol behind. Since ethanol is less dense than sugar, the density of the grape juice decreases as it is converted to wine. One of the ways to estimate the amount of ethanol produced in a fermentation reaction is to measure the change in the density as the juice is changed to wine.
Use of a Hydrometer to Determine the Density of the Juice Before & After Fermentation A hydrometer is a device that measures the density of a fluid. An object that floats displaces a volume of fluid that has a mass that is equal to the floating object. The greater the density of the fluid, the less volume must be displaced to cause a given object to float. For juices, a higher concentration of sugar gives a more dense solution and this causes the hydrometer to float higher in the liquid.
The scale on the hydrometer is read at the air-water interface. The hydrometers we are using have three scales: one for specific gravity, or density in grams per mL, one for the percentage of sugar in the liquid and one for the potential amount of alcohol that can be made from this juice if you assume a typical conversion of the sugar to alcohol.
To calculate the ethanol concentration in a batch of wine, a vintner will typically determine the difference between the alcohol potential of the must (juice) before fermentation and the wine after fermentation. If the juice had enough sugar to make 12% alcohol and the wine ends up with enough sugar to make 4% alcohol, then we can assume that the rest of the sugar has been consumed to yield 8% alcohol.
Since the density of a fruit juice largely depends on the concentration of dissolved sugar, vintners can use a hydrometer to measure the amount of sugar in their grape juice. And since there is also a direct relationship
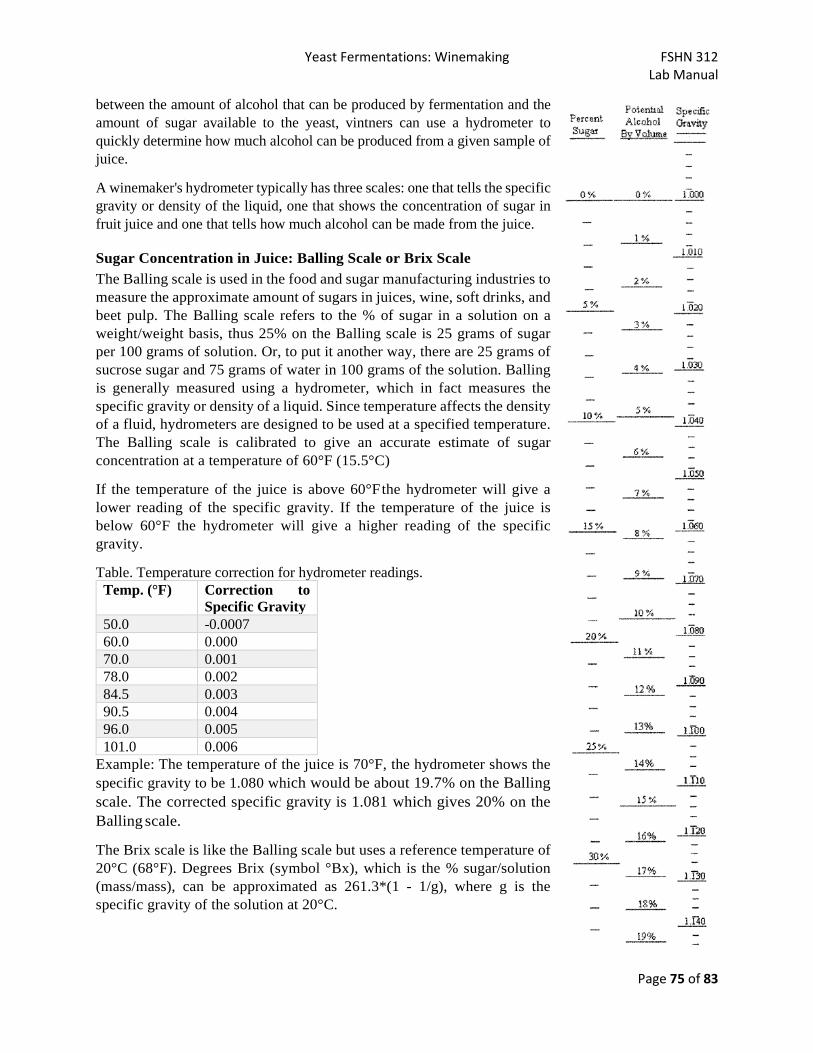
Yeast Fermentations: Winemaking FSHN 312 Lab Manual
Page 75 of 83
between the amount of alcohol that can be produced by fermentation and the amount of sugar available to the yeast, vintners can use a hydrometer to quickly determine how much alcohol can be produced from a given sample of juice.
A winemaker's hydrometer typically has three scales: one that tells the specific gravity or density of the liquid, one that shows the concentration of sugar in fruit juice and one that tells how much alcohol can be made from the juice.
Sugar Concentration in Juice: Balling Scale or Brix Scale The Balling scale is used in the food and sugar manufacturing industries to measure the approximate amount of sugars in juices, wine, soft drinks, and beet pulp. The Balling scale refers to the % of sugar in a solution on a weight/weight basis, thus 25% on the Balling scale is 25 grams of sugar per 100 grams of solution. Or, to put it another way, there are 25 grams of sucrose sugar and 75 grams of water in 100 grams of the solution. Balling is generally measured using a hydrometer, which in fact measures the specific gravity or density of a liquid. Since temperature affects the density of a fluid, hydrometers are designed to be used at a specified temperature. The Balling scale is calibrated to give an accurate estimate of sugar concentration at a temperature of 60°F (15.5°C)
If the temperature of the juice is above 60°F the hydrometer will give a lower reading of the specific gravity. If the temperature of the juice is below 60°F the hydrometer will give a higher reading of the specific gravity.
Table. Temperature correction for hydrometer readings. Temp. (°F) Correction to
Specific Gravity 50.0 -0.0007 60.0 0.000 70.0 0.001 78.0 0.002 84.5 0.003 90.5 0.004 96.0 0.005 101.0 0.006
Example: The temperature of the juice is 70°F, the hydrometer shows the specific gravity to be 1.080 which would be about 19.7% on the Balling scale. The corrected specific gravity is 1.081 which gives 20% on the Balling scale.
The Brix scale is like the Balling scale but uses a reference temperature of 20°C (68°F). Degrees Brix (symbol °Bx), which is the % sugar/solution (mass/mass), can be approximated as 261.3*(1 - 1/g), where g is the specific gravity of the solution at 20°C.
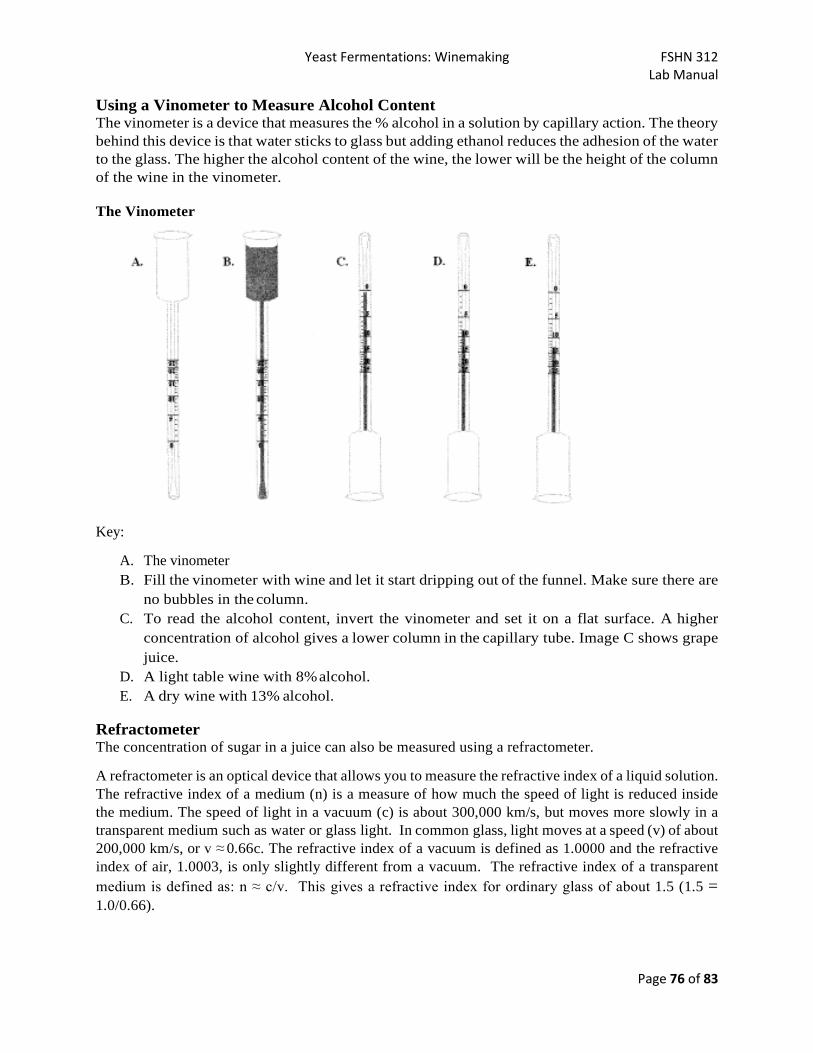
Yeast Fermentations: Winemaking FSHN 312 Lab Manual
Page 76 of 83
Using a Vinometer to Measure Alcohol Content The vinometer is a device that measures the % alcohol in a solution by capillary action. The theory behind this device is that water sticks to glass but adding ethanol reduces the adhesion of the water to the glass. The higher the alcohol content of the wine, the lower will be the height of the column of the wine in the vinometer.
The Vinometer
Key:
A. The vinometer B. Fill the vinometer with wine and let it start dripping out of the funnel. Make sure there are
no bubbles in the column. C. To read the alcohol content, invert the vinometer and set it on a flat surface. A higher
concentration of alcohol gives a lower column in the capillary tube. Image C shows grape juice.
D. A light table wine with 8% alcohol. E. A dry wine with 13% alcohol.
Refractometer The concentration of sugar in a juice can also be measured using a refractometer.
A refractometer is an optical device that allows you to measure the refractive index of a liquid solution. The refractive index of a medium (n) is a measure of how much the speed of light is reduced inside the medium. The speed of light in a vacuum (c) is about 300,000 km/s, but moves more slowly in a transparent medium such as water or glass light. In common glass, light moves at a speed (v) of about 200,000 km/s, or v ≈ 0.66c. The refractive index of a vacuum is defined as 1.0000 and the refractive index of air, 1.0003, is only slightly different from a vacuum. The refractive index of a transparent medium is defined as: n ≈ c/v. This gives a refractive index for ordinary glass of about 1.5 (1.5 = 1.0/0.66).
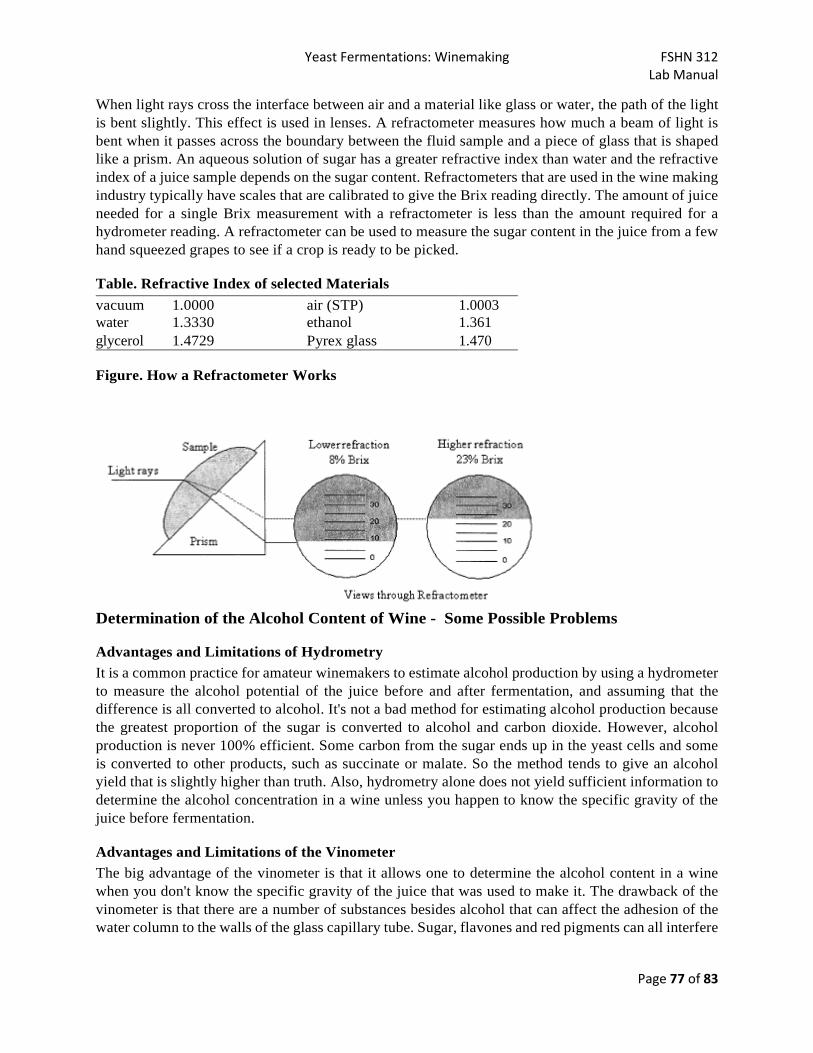
Yeast Fermentations: Winemaking FSHN 312 Lab Manual
Page 77 of 83
When light rays cross the interface between air and a material like glass or water, the path of the light is bent slightly. This effect is used in lenses. A refractometer measures how much a beam of light is bent when it passes across the boundary between the fluid sample and a piece of glass that is shaped like a prism. An aqueous solution of sugar has a greater refractive index than water and the refractive index of a juice sample depends on the sugar content. Refractometers that are used in the wine making industry typically have scales that are calibrated to give the Brix reading directly. The amount of juice needed for a single Brix measurement with a refractometer is less than the amount required for a hydrometer reading. A refractometer can be used to measure the sugar content in the juice from a few hand squeezed grapes to see if a crop is ready to be picked.
Table. Refractive Index of selected Materials vacuum 1.0000 air (STP) 1.0003 water 1.3330 ethanol 1.361 glycerol 1.4729 Pyrex glass 1.470
Figure. How a Refractometer Works
Determination of the Alcohol Content of Wine - Some Possible Problems
Advantages and Limitations of Hydrometry It is a common practice for amateur winemakers to estimate alcohol production by using a hydrometer to measure the alcohol potential of the juice before and after fermentation, and assuming that the difference is all converted to alcohol. It's not a bad method for estimating alcohol production because the greatest proportion of the sugar is converted to alcohol and carbon dioxide. However, alcohol production is never 100% efficient. Some carbon from the sugar ends up in the yeast cells and some is converted to other products, such as succinate or malate. So the method tends to give an alcohol yield that is slightly higher than truth. Also, hydrometry alone does not yield sufficient information to determine the alcohol concentration in a wine unless you happen to know the specific gravity of the juice before fermentation.
Advantages and Limitations of the Vinometer The big advantage of the vinometer is that it allows one to determine the alcohol content in a wine when you don't know the specific gravity of the juice that was used to make it. The drawback of the vinometer is that there are a number of substances besides alcohol that can affect the adhesion of the water column to the walls of the glass capillary tube. Sugar, flavones and red pigments can all interfere

Yeast Fermentations: Winemaking FSHN 312 Lab Manual
Page 78 of 83
with the accuracy of vinometry. In fact, the vinometer is really good only with a dry white wine. Sweet wines and red wines tend to give exaggerated readings for alcohol concentration.
Alcohol Determination by Refractometry The refractometers we use in FSHN 312 are designed to measure the sugar content in juice. But the addition of alcohol to water also increases the refractive index. Alcohol refractometers cost more than sugar refractometers, but the use the same principle to measure concentration. Since both sugar and alcohol contribute to an increased refractive index, the measurement of alcohol content by refractometry works best when the wine is dry (so no sugar interferes with the reading).
Wine Production
Overview There are many different types of wine. Different types of juice make different types of wine and there are many species of fruit that can be used to make juice for wine production. There are more than 600 kinds of grapes with more than 50 varieties that are used to make wine. The taste of the juice from a given variety of grapes can be affected by growing conditions, time of harvest and handling of the fruit. The quality of the wine that can be made from a given batch of juice is also notably affected by the actions of the vintner. Some variables that can affect wine quality and taste include: the type of vessel used for fermentation and aging (wood vs. stainless steel vs. glass for instance), temperature, aging time, the strain of yeast used, and of course the type of juice, sugar content and acid content. This semester, the class start a wine fermentation using reconstituted white grape juice:
• Dilute juice concentrate (teaching staff preps) • Primary fermentation, when most of the alcohol is produced
*full wine production would also do the following:
• Racking and Aging, when the product becomes clearer and more mellow tasting • Residual sugar adjustment before bottling
Juice Description We are using a white grape juice concentrate from a homebrew supply store. Package direction say to reconstitute to single strength juice at 20-22 Brix (SG 1.082-1.092) by adding 2.8 – 3.2 L of water. This corresponds to about 20-22% sugar, or 10.5-12.0 % final alcohol concentration, if fermented to dryness.
Additional supplements We could add a yeast nutrient to speed fermentation. Usually this is a blend of yeast extract and diammonium phosphate. could adjust the acid profile of the wine by adding a blend of tartaric acid, malic acid, and citric acid to grape juice to produce a wine with tart flavor. Experience with concentrate would determine if it is necessary.
Yeast The yeast we will use is a mixture of two strains from Red Star. ‘Cote de Blance’ is a strain of Saccharomyces cerevisiae from Germany recommended for white wine. It is a relatively slow fermenting strain with an optimal temperature range of 17-20C (69-86F). ‘Premier Cuvee’ is a strain of Saccharomyces bayanus which is traditionally used as a Champaign yeast. I is a very fast fermenter
Yeast Fermentations: Winemaking FSHN 312 Lab Manual
Page 79 of 83
with a high alcohol tolerance (up to 18%) and fermentation temperature range of 7-35C. In Champaign fermentations this yeast is important for producing the characteristic bubbles. Additional sugar, or better yet reserved grape juice, is added after the primary fermentation just before bottling. Then bottles are allowed to slowly ferment at cold temperatures for a slow production CO2 bubbles. We are using two strains for insurance that our fermentation will succeed.
Procedure Part 1. Measurement of Density, Ethanol, and Sugar Concentration Balance and Graduated Cylinder: Density When water is mixed with ethanol or sugar, as in wine or juice, the density of the liquid differs from that of pure water. If the solution consists primarily of one solvent, such as water, and one solute, such as alcohol or sucrose, one can use the density of the solution to estimate the concentration of the predominant solute. Density is defined as mass/volume. In the first part of this exercise you will measure the mass of a defined volume of liquid and calculate the specific gravity of the fluid.
1. Record the mass of a 100 mL graduated cylinder. Then tare. 2. Choose one of the following liquids to test:
a. Deionized water b. 30% sucrose c. 95% ethanol
i. Pour about 90 mL of the liquid you are testing into the graduated cylinder. ii. Record the amount of liquid in the cylinder to the nearest 0.1 mL.
iii. Record the mass of the fluid, to the closest 1/10th of a gram. iv. Pour the fluid back into the container.
d. Test the other solutions. 3. Calculate the density (specific gravity) of the samples by dividing the mass of the sample by
the volume.
Hydrometer: Density Your instructors will prepare a station where several solutions can be found in graduated cylinders.
1. Use a hydrometer to measure the sugar concentration in each solution. 2. Record the density and temperature of each "unknown" solution (assume it matches the nearby
temperature probe) 3. If needed, adjust your density readings using the temperature correction chart. The hydrometer
is calibrated to 60F. 4. Determine the sugar concentration and alcohol potential of each "unknown" solution.
Vinometer: Alcohol Concentration Your instructors will prepare a station where several solutions can be found in beakers.
1. Use the vinometer to determine the alcohol concentration in each of the solutions. a. Fill the vinometer with solution and let it start dripping out of the funnel, into a
container. Make sure there are no bubbles in the column. b. To read the alcohol content, invert the vinometer and set it on a flat surface. A
higher concentration of alcohol gives a lower column in the capillary tube. c. Rinse immediately after use, if no one is waiting to use.
Yeast Fermentations: Winemaking FSHN 312 Lab Manual
Page 80 of 83
Refractometer: Brix and/or Alcohol Concentration Your instructors will prepare a station where several solutions can be found in beakers.
Your instructor will give you additional directions about using a refractometer to measure sugar or alcohol concentration.
Procedure Part 2. Ethanol Production Day 1: Setting up the analytical fermentation culture
1. Add the following things to a clean 125 mL bottle: 25 mL of 2X YT broth (nutrients: 16 g / L tryptone, 10 g/L yeast extract, 5 g/L NaCl) 65 mL of 30% sucrose (energy) 10 mL of yeast culture (starter)
Place the cap on the bottle and mix the contents by inverting the bottle a few times. 2. Pour about 85 mL of the culture into a clean graduated cylinder and use the hydrometer to
check the initial specific gravity, Balling and alcohol potential. Record. 3. Use a refractometer to measure the Brix of the medium. Record. 4. Put the medium back into the 125 mL bottle, seal with an airlock and weigh the bottle, medium
and airlock. Record. 5. Place bottle in container for incubation at 30°C for about 12 days.
Day 2 and 3: (after ~1 and 2 wks) Assess Alcohol Production 6. Smell the brew. Do you smell alcohol? Are there bubbles? Record your observations. 7. Weigh the bottle, medium and airlock. Record. Did the culture lose mass, if so how much? 8. Pour about 85 mL of the culture into a graduated cylinder and use the hydrometer to check
specific gravity, Balling and alcohol potential. Record. Calculate alcohol concentration. 9. Use a vinometer to measure the concentration of alcohol in the medium. Record your
observations. (Note: if the hydrometer reading shows a specific gravity of more than 1.010, do not put the sample into a vinometer, the sugar will cause misleading results and it's very difficult to clean the sugar out of the narrow capillary tube.)
10. Use a refractometer to measure the residual sugar in the medium. Record. 11. Last day, calculate the yield of alcohol.
Procedure Part 3. Wine Production Day 1: Set up the Primary Fermentation
1. Obtain a fermentation bottle filled with grape juice. Add a. A 1:100 dilution of mixed yeast culture. b. Swirl to mix.
2. Measure the alcohol potential (should have this from part 1) 3. Close the bottle with an airlock and incubate at RT in your locker.
Days 2 – 3: Tracking the Primary Fermentation Pipette out enough wine into a graduated cylinder to use the hydrometer to measure the density, residual sugar content and alcohol potential again. Calculate the alcohol content each day.
Alcohol Content = initial Alcohol potential - current alcohol potential

Yeast Fermentations: Winemaking FSHN 312 Lab Manual
Page 81 of 83
One the final day, smell the new wine and describe your impressions on the lab report. Some positive aromas that you may encounter include: a yeasty smell like bread or a vitamin pill, ethyl alcohol like beer, and a fruity smell that may be a bit pungent like grapes or milder like pears.
Additional Work for Finished Wine
Racking and Aging (3 - 4 weeks after starting) Obtain a clean 500 mL bottle and put 400 mg of potassium metabisulfite into the bottle. Gently pour about 500 mL of the new wine into the bottle. Try to avoid turbulence because we do not want to introduce air into the new wine. Oxygen allows bacteria to convert wine into vinegar but the S02 will help prevent this. Try to avoid pouring the lees (yeast sediment) that is at the bottom of the primary fermentation vessel into the second vessel. Avoid agitating the sediment in the primary fermentation bottle while pouring. Too much yeast in the aging vessel will adversely affect the taste of the wine.
Close the aging vessel with an air-lock. Swirl the new bottle gently to dissolve the potassium metabisulfite. Incubate at 20°C to allow the wine to age. During this time, some fermentation will continue but at a slower rate. Some of the 4-carbon acids that are produced during fermentation such as succinate and malate will be converted to lactic acid, which has a smoother taste and the wine will clear as dead yeast cells sink to the bottom of the vessel.
In commercial wine production, the aging time is generally at least six months to one year for a white wine and two or more years for a red wine. But most wines are not improved by increasing the aging time from two years to five years.
Bottling (commercially after 6+ months) Here is how we might simulate bottle processes in the microbiology lab:
Obtain a clean 500 mL bottle and put 200 mg of potassium metabisulfite into it. Gently pour about 450 mL of the wine into the clean bottle with the sulfite. Avoid swirling or agitating the sediment that is in the aging vessel and try to avoid pouring lees into the clean bottle. Swirl the wine to dissolve the potassium metabisulfite.
If the wine is too dry or acidic for your taste, you can sweeten it by adding some juice or sugar. We started the experiment using grape juice that has been adjusted to a sugar content of 25%. This sugar concentration should be able to yield a wine with about 13% alcohol if the fermentation goes to completion. This is a dry wine. (The more alcohol in a solution, the less water is present. Hence the term "dry" is usually applied to strong wines.) The addition of some sugar before bottling can help to sweeten the wine and take the edge off an overly acidic dry wine. In the "Reserve" method to sweeten wine, some of the grape juice is stored in the freezer and added back to the wine before bottling. If a dry wine with 13% alcohol is diluted with grape juice that has a sugar concentration of 20%, by adding 9 parts of wine to 1 part of grape juice, you can make a wine with about 2% residual sugar and about 12% ethanol. If you wish to store or further age the wine, add sulfites to prevent fermentation in sealed bottles.
Extra Credit: Fermentation @Home FSHN 312 Lab Manual
Page 82 of 83
Lab 14 - Extra Credit: Fermentation @Home
Learning Objectives The goal of this extra credit assignment is for you to try a food-related fermentation at home. This way you can eat, or otherwise enjoy, the results of your work. And in doing so, you can see that these processes need not be overly challenging. Hopefully it will help you related the lab-related microbiology to the real world of food we eat. Upon completion of this lab, you should be able to:
• Create a fermented food at home. • Describe the microbial processes involved in a food fermentation • Apply food microbiology lab techniques to a home fermentation.
Background We want you to try a fermentation. And then write up this home fermentation in the format of our standard report. Bridge the gap between class theory and food practice.
Some good resources include:
• Traditional cookbooks: Joy of cooking, etc. • ‘Popular’ food science books: On Food and Cooking, McGee. Art of Fermentation, Katz.
Materials That is up to you.
Procedure For this assignment, feel free to work in small groups. This CAN be your lab group, friends in the class, or other people you know. Still, you must turn in an individual lab report.
8. Make a fermented food product in a food-grade setting. Ideally, a home kitchen. a. This can be anything. If you are new to home fermentation, I suggest a yeast dough or
yoghurt. b. You’re welcome to use any resources including: website, cookbook, or family recipes.
9. Document the process so that you can write a material and methods section of the report. At minimum, include:
a. Ingredients b. Starter cultures or other source of inoculum c. Time and temperatures d. Take a picture of the product pre- and post-fermentation. So for a bread dough, this
would be the kneaded dough ready for first proofing, and after it has finished rising. For yoghurt, this is the warm, inoculated milk, and the set yoghurt.
10. Optional, for extra points. Bring a sample of the fermented food into the lab for plating on appropriate media.
a. I will try to stock media: plate count agar (general bacteria), Sabouraud Dextrose Agar (yeasts, fungi), and sucrose azide agar (lactics)

Extra Credit: Fermentation @Home FSHN 312 Lab Manual
Page 83 of 83
b. Plate this out after class to count the predominant fermentation organism. Include this count in your lab report. Also include a picture of the plate(s).
11. Enjoy the food with your group.
Discussion Questions 1. How did the food turn out? 2. How did you use the home environment to create a good fermentation environment?
a. Did you need to reduce endogenous microflora? Was there an inoculum? What temperatures did you use? How did you know the fermentation was finished?
3. What did you learn from the lab plates?
Notes on Grading: You can receive up to 10 points for a home fermentation, and an additional 10 points for plating the food in the lab. These points will be added as ‘extra credit’ to the lab report total.
The rubric will describe the distribution of points to be earned. A perfect score on this assignment has the potential to raise your percentage grade by ~7%.