la recherche en comptabilité financière : l'analyse ... · la recherche en comptabilitÉ...
TRANSCRIPT

UNIVERSITÉ DU QUÉBEC À MONTRÉAL
LA RECHERCHE EN COMPTABILITÉ FINANCIÈRE, L'ANALYSE
FONDAMENTALE ET LES MARCHÉS DES CAPITAUX
MÉMOIRE
DÉPARTEMENT DES SCIENCES COMPTABLES
MAÎTRISE EN SCIENCES COMPTABLES
PAR
MARJO ZACCARDELLI
AVRlL 2009

UNIVERSITÉ DU QUÉBEC À MONTRÉAL
ACCOUNTING RESEARCH, FUNDAMENTAL ANALYSIS
AND THE CAPITAL MARKETS
THESIS
ACCOUNTING DEPARTMENT
MASTER'S IN ACCOUNTING
By
MARIO ZACCARDELLI
APRIL 2009

UNIVERSITÉ DU QUÉBEC À MONTRÉAL Service des bibliothèques
Avertissement
La diffusion de ce mémoire se fait dans le respect des droits de son auteur, qui a signé le formulaire Autorisation de reproduire et de diffuser un travail de recherche de cycles supérieurs (SDU-522 - Rév.01-2006). Cette autorisation stipule que «conformément à l'article 11 du Règlement no 8 des études de cycles supérieurs, [l'auteur] concède à l'Université du Québec à Montréal une licence non exclusive d'utilisation et de publication de la totalité ou d'une partie importante de [son] travail de recherche pour des fins pédagogiques et non commerciales. Plus précisément, [l'auteur] autorise l'Université du Québec à Montréal à reproduire, diffuser, prêter, distribuer ou vendre des copies de [son] travail de recherche à des fins non commerciales sur quelque support que ce soit, y compris l'Internet. Cette licence et cette autorisation n'entraînent pas une renonciation de [la] part [de l'auteur] à [ses] droits moraux ni à [ses] droits de propriété intellectuelle. Sauf entente contraire, [l'auteur] conserve la liberté de diffuser et de commercialiser ou non ce travail dont [il] possède un exemplaire.»

ACKNOWLEDGEMENTS
1 would like to thank Pascal Carbonneau, David Caron and Yan Marcotte, ail of whom 1
gladly work with on a daily basis and who contributed to the development of the process that
we now use as the foundation of our investment management process. 1 would also like to
thank Professor Cormier for his support during the writing of this paper.

TABLE OF CONTENTS
LIST OF EXHIBITS vi
RÉSUMÉ vii
ABSTRACT viii
CHAPTER 1 3
Accounting Research and equity Valuation 3
CHAPTER II 8
Efficient Markets Hypothesis......................................................................................... 8
2.1 Efficient Markets and Infonnation Asymmetry 8
2.2 Efficient Markets and lnfonnation Asymmetry: George Soros 12
2.3 Reflexivi ty.. .. __ .. .... .. .. .. _.. .... _. 13
2.4 The Stock Market as a Complex Adaptive System .. __ ... 14
2.5 Relationship between Market Value, ROIC and Growth 15
2.6 Distribution of Stock Market Returns 16
CHAPTER III 17
Fundamenta1 analysis................................................................................................... 17
3.1 Financial Statements - Are They Still Relevant?.. ._ .. _ __ 17
3.2 Role of Fundamental Analysis .. .... ... ... _.. _.22
CHAPTER IV 25
Accounting-Based Market Studies 25
4.1 The Low Book-to-Market (BM) Anomaly .. . __ .__ . 25
4.2 Future Eamings Growth ... . ........ .... _.. .. _ .28
4.3 SUE - Standardized Unexpected Eamings growth .. .... __ ... .29
CHAPTER V 31
Fair Value 318

v
CHAPTER VI 38
Experiment and Supporting Research 38
6.1 Background 38
6.2 Theoretical Support of our Investment Process 40
6.2.1 Payout Yield Research 40
6.2.2 Support for Dividends 41
6.2.3 Retum on Equïty 42
6.2.4 How Do Accounting Variables Explain Stock Movement? .. 43
6.2.5 Stock Repurchases and the EPS Enhancement Fallacy 47
6.2.6 Changing Motives for Share Repurchases 49
6.2.7 Study of US Utilities Sector; High Performance and ROEs 50
6.2.8 Payout Yield 51
6.3 Summary of the lnvestment Concept and Approach 56
6.4 Description oflnvestment Model 57
6.4.1 Investment Universe 57
6.4.2 Time Frame 58
6.4.3 Data 58
6.4.4 Stock Screening and Selection Process __ 58
6.4.5 Use of Median 60
6.4.6 Portfolio Construction and Rebalancing 60
6.5 Results of Study 62
6.5.1 Portfolio Performance versus Benchmark Performance 62
6.5.2 Portfolio Payout Yield 64
6.5.3 Importance of Overall Portfolio Characteristics 66
CONCLUSION 70
APPENDICE A 78
BIBLIOGRAPHY 80

LIST OF EXHIBITS
2.1 Theoretical Relationship between Market Value, ROIC and Growth 15
3.1 Types of Fundamental Screens 33
5.1 Feedback Loops 36
6.1 Sustainable Outperfonners 39
6.2 Distribution/ Creation ofWealth 42
6.3 Predictive Return Regressions 41
6.4 Payout Yield through Time.................................................................................... 45
6.5 Aggregate Dividends and repurchases Through Time 52
6.6 Average Annual Sector Dividend Yields and relative Retums 53
6.7 Regressions of Relative Retums on Dividends and Fundamental Factors 54
6.8 Sample of companies from 5-Factor Screen 61
6.9 Performance Summary 63
6.10 Payout Yield Summary 66
6.11 Portfolio Characteristics compared to the Benchmark........................................... 68
A.l Investment Process................................................................ 79
RÉSUMÉ EN FRANÇAIS
Suite à l'éclatement de la bulle du secteur de la technologie (dot-com) de nombreux experts ont proclamé que la recherche et l'analyse fondamentale est chose du passé. Le temps nous a démontré le contraire, et plus particulièrement lors de la récente crise du crédit où l'analyse fondamentale des états financiers et des données comptables s'est avérée un facteur crucial dans la prise de décision d'investissement.
Suite à ces événements récents, la demande pour la recherche fondamentale de haute qualité s'est fortement accrue, particulièrement celle de nature indépendante c.-à-d. des firmes qui n'ont aucun lien avec les sociétés analysées. Aujourd'hui, les investisseurs de partout à travers le monde ont un grand appétit pour ce type d'information à valeur ajoutée qui leur offre un avantage face à la concurrence
L'analyse des états financiers est un élément-clé dans le processus d'investissement et de l'analyse fondamentale. Lors de l'étude d'une entreprise, plusieurs facteurs sont prépondérants dans l'analyse des ses états financiers tel que la tendance des marges opérationnelles, l'analyse de levier financier, la qualité des actifs et les flux de trésorerie, etc.
De nombreuses études ont montré que les investisseurs peuvent obtenir des rendements anormaux (génération d'alpha) par l'utilisation de l'analyse fondamentale basée sur J'analyse des états financiers puisque les marchés financiers ne sont pas complètement efficaces.
Après avoir fait un revue de littérature sur le sujet, nous avons mis en place un portefeuille virtuel (re-balancement trimestriel) en tenant compte des facteurs suivants: 1) la croissance opérationnelle, 2) la rentabilité, 3) la redistribution des profits (dividende et rachats d'actions). Cette étude porte sur la période de janvier 2001 àjuin 2007.
Les résultats ont illustré un portefeuille qui a surperformé de manière significative lors de marchés baissiers, tout en performant de façon similaire au marché pour les périodes haussières. Les résultats ont été significatifs et ainsi les informations collectées au cours de l'exercice ont été utilisées comme cadre théorique à l'intérieur d'un processus d'investissement existant à partir de septembre 2008.
Mots clés: analyse des états financiers, recherche fondamentale, marchés financiers.

ABSTRACT
With the bursting of the dot-com bubble, many pundits proclaimed that research and
fundamental analysis were dead, but in fact just the opposite has proven true since then. The
credit crisis has once again shown that fundamental accounting-based analysis has a bright
future. lnvestors who took the time to carefully scrutinize the balance sheets of banks from
2005 to 2007 began to see a disturbing trend take form and they were able to then implement
trading strategies to profit from the eventual carnage that ensued. There has never been such
a strong demand for high qua lity research as independent research flourishes. The thirst for
value-added information that can give you an edge over the competition has grown
dramatically. Financial statement analysis is a key element of investing and fundamental
analysis - margin trends, leverage analysis, asset quality, and cash flow - anything that can
provide clues to whether a company can sustain its current performance, improve or falter is
vitally important.
Numerous studies have shown that investors can earn abnormal returns (generate alpha)
through the use of fundamental analysis of financial statements given that the financial
markets do not fully discount the information contained in historicallcurrent financial
statements (Desai, Krishnanurthy and Venkaturaman 2007). There is a lag that allows traders
to make gains and eventually close the information gap. We created a virtual equity portfolio
(rebalanced quarterly) using screens for EBITDA growth (core operating performance) and
profitability (ROE) while controlling for payout yield from January 2001 through June 2007.
The results are a portfolio that significantly outperformed in a down market, while keeping
pace with the market during rallies. The virtual results were encouraging and the information
collected during the experiment was eventually used as the framework behind the investment
process that is being used to manage a real investment portfolio as of September 2008.
Key words: fundamental analysis, financial statement analysis, financial markets.

INTRODUCTION
What is the raie of accounting research with respect to the equity markets and stock
valuations? The raie that accounting researchers can play is an important one. The myth of
efficient markets has been called into question in recent years, thus fundamental analysis can
be a very useful tool to identify winners and losers.
Financial statements are one of the key and most readily available sources of information that
can be used in the fundamental analysis process. Who is better placed to analyze financial
statements than accounting researchers?
Bauman (1996) believes fundamental analysis involves an assessment of a firm's value
(without reference to the actual priee), activities and prospects through published financial
reports, as weil as other sources of information.
According to Penman (1992), "The task of research is to discover what information projects
future earnings and, from a financial statement analysis point of view, what information in
the financial statements does this."
Fundamental analysis is an area of great relevance, a high profl1e subject matter and wide
open to accounting research. More importantly, investors are interested in this type of
research, especially when the methods and models can be used in real world scenarios to
deliver excess returns.
While the Efficient Market Hypothesis (EMH) has been the foundation of capital markets
research in accounting and has served market researchers and practitioners weil, the time has
come for the concept to evolve to the next stage. While the market and individual stocks tend
to ultimately move to fair value the process can take long periods of time and fair value may
be only be achieved for relatively short periods of time. The fact that securities spend very
little time at fair value implies that alpha generating strategies can be developed to take

2
advantage of these fair value discrepancies in the market. It remains by no means easy to beat
the market on a consistent basis, but it can and has been done.
The belief that markets are efficient has long been a guiding principal of capital markets
research. The arguments in favor of efficient markets have been weakened in recent years.
While the theory of the rational investor properly processing ail value-relevant information is
plausible in the theoretical world; information asyrnmetry and irrational behavior abound in
the marketplace. Prices do eventually move towards fair value, but they do not stay there for
long, rather prices oscillate above and below fair value (sometimes at extremes) for extended
periods of time. Consequently, active investors can add value, although is remains difficult to
do so over extended periods of time.
While there has been an increased use in low-cost index tracking products in recent years,
there have also been large sums of money that have flowed into high fee hedge funds. The
entire hedge fund sector is based on the belief that arbitrage opportunities are available in the
market and can be exploited. This being the case, the absolute explosion in the number of
hedge funds has lead to a watering down of resu lts as the talent pool thins out, with the some
of the weaker players being weeded out by the credit crisis in recent months.
The savings & loan crisis, the Long Term Capital Management (LTCM) crisis, the Dot-corn
bubble and most recently the mortgage-related credit crisis that has engulfed the US financial
system further highlight that investors do not always behave in a rational manner and that
valuation can become far out of touch with reality (fair value). While it is true that market
forces eventually lead to a readjustment it is becoming increasingly difficult to argue that
markets are efficient given the carnage.
The first part of this essay presents an overview of the key issues and debates regarding
accounting research, fundamental analysis and the capital markets. The second part is an
attempt to create stock selection model whereby we develop and implement a stock screening
process based on readily available accounting information and analyst forecasts. The
selection process looks at growth, profitability and payout data.

CHAPTERI
ACCOUNTING RESEARCH AND EQUITY VALUATION
Historically, most of the work done in this domain has emphasized the informational
perspective of accounting and the traditional valuation models such as the dividend discount
mode!. The fundamental analysis school of thought, which includes researchers such as
Stephen Penman, believes a firm's value can be derived through financial statement analysis.
Stocks are believed to deviate from their true fundamental value, sometimes for extended
periods of time, but eventually the priee moves back towards its fundamental value. This
does not mean it remains at its fundamental value for very long as it my overshoot to other
direction.
Articles by Bali & Brown, as weil as Beaver are generally regarded as tuming points in the
history of accounting research. Post 1968 research has tilted towards empiricism, has been
deemed normative and follows the positive !ine of thought as apposed to the prescriptive and
descriptive approaches that dominated the literature prior to 1970 (Gaffikin, 2007). The
systematic use of empirical data was facilitated by the widespread availability of financial
databases along with easier access to more and more powerful computers that made number
crunching easy allowed a myriad of theories to be tested in much less time than was the case
in prior generations(Gaffikin, 2007). The backbone of this research was the Efficient Market
Hypothesis (EMH), developed by Fama and French that hypothesizes that security prices
reflect ail available information.
Bali and Brown's seminal 1968 study built upon existing research in finance and economics,
which focused on fundamental analysis of which studying financial statements was a key
element. Bali and Brown (1968) tried to identify the usefulness or importance of accounting
information for the security markets and the subsequent impact on security priees (Gaffikin,

4
2007). What information moves share priees and what information is useful in identifying
future stock movements?
For most of the 1970s and 1980s research in accounting accepted for analysis purposes EMH
and the Iinear relationship between risk and reward, but since the 1990s there has been
increased criticism of EMH. In 2004, Eugene Fama stated that markets may not be efficient
because of poorly informed investors acting irrationally (Gaffikin, 2007).
Ou & Penman (1989) believe an analysis of published financial statements can uncover mis
priced stocks (expensive or inexpensive) and that investment strategies can be derived using
the fundamental information in financial statements.
According to Bauman (1996), the 1990s saw a shift towards the development of the
fundamental analysis perspective;
1. More theory-based equity valuation models,
2. Few ad hoc assumptions between future eamings, dividends and cash flows,
3. Focus has shifted from explanation of observed stock priees to the prediction of
future profitability,
4. More contextual approaches.
There are many different types of studies conducted, but sorne of the most commonly used
are (Gaffikin, 2007);
1. Event studies; information aIUlouncements and the impact on share priees,
2. Association studies; correlation between the information content accounting
information and share priee retums,
3. Fundamental analysis; search for intrinsic value.
What is interesting in al! trus is that it is exactly ail these researchers and analysts 100king for
arbitrage opportunities that eventually lead to individual securities and the broader markets

5
c10ser to an efficient state, although other market forces inevitably continue to work against
broader efficiency.
The market is complex and moves in many directions for many different reasons. While sell
side analyst forecasts are often used as the basis for analysis, many stocks, especially the
more cyclical names tend to move down way before analysts lower estimates or raise
estimates. Gaffikin (2007) states that;
There is mounting evidence that many investors do not act rationally as believed (in EMH); they, in fact, act (economically) irrationally. Accordingly, there has been a distinction drawn between smart money investors and noise (or liquidity) traders. It has been found that there is a very significant amount of noise trading and it is probably responsible for the volatility in realized retums. As noise trading is irrational, it is not possible to statistically or mathematically model it, which has direct implications for much accounting research. (Gaffikin, 2007, page 9)
Ou & Penman (1989) specify that financial statement analysis is the process by which
investors and researchers identify value-relevant information contained within a company's
financial statements. Ou & Penman highlight two different approaches to financial statement
analysis;
1. Capital markets theory in that price equals value or is at least a good approximation
over the long-term
1. Market price is a good proxy for value,
II. Look for signaIs to future stock price gains,
111. For examp1e Bali & Brown (1968) found that accounting earnings are valued
positively by investors,
IV. Graham & Dodd (1962) "future earnings power" is the single most important
factor to consider in valuation,
v. Dividends paid from earnings,
vi. Thus, given that future eamings are value relevant - identify factors in the
financial statements that are able to predict earnings.

6
2. Traditional fundamental analysis where priee does not equal value
1. Financial statements are used to calculate intrinsic value,
11. Share priee converges to intrinsic value.
The theory of efficient markets needs to evolve because while a stock priee may contain ail
known information, a large part of the stock priee is based on expectations about the future,
which are inherently difficult to predict. lt is perhaps these false assumptions about that
future leads to inefficiency as the market extrapolates current positive trends too far into the
future or assumes a stock will never emerge from a particular market environment such as a
recession. This is what makes the markets so difficult to predict - the infinite nature of the
game. Market priees are influenced by numerous factors including a company's specifie
history, CUITent economic conditions, macroeconomic outlook, political factors and the list
goes on.
According to Ohlson's (1995) interpretation of the Modigliani & Miller theorem;
Dividends displace market value on a dollar-for-dollar basis, so that dividend payment irrelevancy applies. Furthermore, dividends paid today influence future expected eamings negatively. This separates the creation of wealth from the distribution of wealth. (Ohlson, 1995, page 2)
If we follow the positive school of thought Nissim and Penman (2001), state that ln an
applied discipline such as accounting, the goal of research should be ta influence practice;
Theory can be admired on a number of dimensions, but a stream of research is ultimate1y judged on the products it delivers, how it enhances technology. (Nissim & Penman, page 1)
Nissim & Penman high1ight that equity valuation research in the finance field has stagnated
in recent years and has not moved much beyond the traditiona1 dividend discount mode!. This
has in tum opened the door to accounting researchers who have been able to use their
particular knowledge of the intlicacies of financial statements to make significant advances in
the field of equity valuation field. An example is Ohlson's residual income model has been
an important contribution to the valuation debate.

7
The process of capital markets research is all about the information content of financial
staternents in detennining stock priees. A great nurnber of empirical studies have been
conducted, but there has been a failure to develop robust structural models. The residual
incorne rnodel is one of the few in this sense. The residual incorne model was validated by
Penman (1997) who found no difference in valuation between the residual income model,
dividend discount model and discounted cash flow approaches.

CHAPTER II
EFFICIENT MARKETS HYPOTHESIS
2.1 Efficient Markets and Information Asymmetry
The financial markets are adynamie envirorunent that is constantly being bombarded by
infinite quantities of information and signais coming from ail directions. Efficient market
theory puts forward the idea that investors cannot successfully trade (earn excess retums)
using publicly available infonnation because this information is already woven into the priee
of a security.
This being said the financial markets may not be as efficient as previously believed, at
least not in the traditional sense of ail infonnation being immediately implanted in stock
priees. There has been a growing trend amongst researchers and market participants towards
the laosening of the efficient market hypothesis developed by Fama. According to Lee
(2001), stock priees do not adjust ta infonnation instantly, but rather priee converges toward
fundamental value through time as various types of traders (bath sophisticated and non
sophisticated) act on pieces of available information. Lee believes accounting research has a
golden apportunity to add value in this type of envirorunent;
Professional arbitrage involves careful monitoring of an evolving set of infom1ation sources and ongoing evaluation of their effeet on market pricing dynamics. Accounting researchers can contribute to this process by developing lower cost techniques for market arbitrage. (Lee, 200 l, page 10)
Lee's viewpoints differ from Bauman in that he believes researchers should not ignore
the CUITent market priee, but rather accounting researchers should seek to improve il.
Beaver suggests the following four implications for accounting policy's role In the
efficiency debate;

9
1. Accounting policy choices do not affect security prices as long as policies are disclosed,
2. Full disclosure in financial statement is needed to achieve an efficient market,
3. An efficient market implies that naïve investors will be price-protected by professional investors,
4. Accounting information is but one source of information for the markets.
We agree with Beaver's assessment that accounting policy does not affect security prices
as long as policy is clear to ail and we also agree with the last point that accounting
information is but one source of information. On the other hand we doubt that full disclosure
in financial statements will result in an efficient market because the financial statements
conta in historical information, whereas a company's stock price is a function of past
information and expectations about the future.
Information asymmetry results when investors do not have all the necessary information
to make informed decisions. A company's financial statements are one mechanism whereby
compames can communicate important and relevant information to current and potential
investors.
The presence of anomalies such as post-announcement drift and the interpretation of
accruals caU into question the efficiency of the capital markets. Once the principle of
efficient markets is caUed into question, what are the implications of this for accounting
research? Rather than cast a shadow over accounting research, we believe this creates an
opportunity for academics to explore different methods and develop new theories.
As Ou & Penman (1992) highlighted, share prices eventually move towards the correct
value, but this process can take a long time and investors can make or lose a great deal of
money waiting for the share price to move to an efficient level.
Bird et al. (2005) question the existence of efficient pricing from a slightly different
perspective. Their research paper delves into what are the necessary conditions required for

10
an efficient market and are these conditions in place? The interesting aspect of this article is
that it weaves the impact of investment styles into the efficient markets debate. Moreover,
what impact do index investing and momentum investing have on market efficiency?
Momentum and technical investing have become increasingly popular in recent years with
many investors paying 1ittle or no attention to the fundamentals, but rather preferring to
examine charts and trends. While hard to calculate, a significant number of market
practitioners manage money with !ittle or no regard for the underlying fundamentals.
Bird et al. suggest the availabi!ity of information (lack of information asymmetry) and
the existence of a large number of rational, profit maximizing investors are necessary to the
concept of efficiency. The increasing popularity of index funds has lead to greater than 25%
of funds in many developed equity markets being managed in this manner. Add to this the
closet indexers, momentum investors and technical investors and we have a significant
percentage of the market that is not relying on fundamental analysis. Therefore these types
of investors are not helping the price discovery process, but rather are trading on noise. The
research paper attempts to model the market behavior of three types of investors;
1. Fundamental investors,
2. Index investors,
3. Momentum investors.
A simulation model using the three types of investors is developed and the weight of
each investor class is varied in an attempt to examine price behavior. The findings offer
sorne interesting insights into market behavior. Here are the principal results as stated by
Bird et al;
1. Confirmation that a market largely composed of fundamental investors will results in a high level of market inefficiency in that prices will quickly react to the release of new information,
2. The introduction of index investors into the mode] progressively slows this reaction to new information as they come to represent an increasing proportion of the market,

11
3. Finally, the addition of another investor type, momentum investors, further slows the market reaction to new information, but will invest when a drift in priees becomes established, which eventually leads to an overreaction.
Even though the study is not based on a real world scenario, it is nonetheless thought
provoking and warrants further examination.
Hirschleifer et al. (2004) tackle the information asymmetry Issue and the lack of
efficiency in the markets from a different perspective. They state;
Limited investor attention and processing power cause systematic errors that affect market priees. (Hirschleifer et al., 2004, page 3)
Furthermore, they believe investors tendency to focus on a few well-known and widely
followed variables leads to the failure by many to assess the complete financial profile of
cornpanies. This complete financial assessment process takes time and explains, in part, why
priees adjust slowly to fair value.
lnterestingly, Hirshleifer et al. use the formula put forward by Perunan as the DNA of the
modern accounting system;
• Net Operating Assets = (sum of Operating income) - (sum of FCF)
They investigate a phenomenon they refer to as balance sheet bloat and develop a trading
strategy based on this concept. According to the authors, NOA is a cumulative measure of
the deviation between accounting value added and cash value added, hence balance sheet
bloat. An increase in accounting earnings without a commensurate increase in free cash flow
(FCF) puts into doubt future profitability.
The authors put forward sorne reasons behind underperformance by high NOA firms.
They postulate that NOA may be an indication of eamings management by the firm. Even in
the case where it is not the result of eamings management, but just coincidence the outlook is
still negative for the company.
12
The results of the hypothetical trading strategy indicate that NOA is a strong and robust
indicator of future performance for at least three years. Hence, investors overestimate future
performance of high NOA firms. The adjustment process afterwards takes time and the
company is likely to disappoint for an extended period of time. The opposite is also true as
firms with a low NOA may be underappreciated by the market and are likely to outperforrn
going forward.
2.2 Efficient Markets and Information Asymmetry: George Soros
In his most recent book, The New Paradigm for Financial Markets, George Soros, the
billionaire investor and philanthropist, argues that the theory that markets always move
towards equilibrium is a flawed theory that has lead us dangerously close to the edge of a
disaster, especially given the amount of leverage and the mind-numbingly complicated nature
of many modem financial instruments. In an interview for Bloomberg News Soros adds;
The belief that markets tend towards equilibrium is directly responsible for the CUITent market turmoi1. It encouraged the regulators to abandon their responsibility and rely on the market mechanism to correct its own excesses. (Saros, 2008)
A 25-year secular decline in interest rates along with the politicallacademic belief that
markets tended towards fair value due to the efficient market hypothesis has culminated in a
major crisis that has practically paralyzed global credit markets. Soros goes on to state that
rather than rational behavior a vicious two-way feedback loop that he calls reflexivity that
revolves around misjudgments and misconceptions that can influence market priees for
extended periods of time. While Soros' relies heavily on anecdotal evidence and on personal
opinions his work remains thought provoking and has enriched the global debate.

13
2.3 Reflexivity
The theory of reflexivity is particularly interesting when considering when considering
EMH;
Reflexivity refers ta the circular relationship between cause and effect. A reflexive relationship is bi-directional; with both the cause and effect affecting each other in a situation that renders both functions causes and effects. Reflexivity presents a problem for science because if a prediction can lead to changes in the system that the prediction is made in relation to, il becomes difficult ta assess scientific hypotheses by comparing the predictions they entait with the events that actually occur. Reflexivity is discordant with equilibrium theary, which states that markets move towards equitibrium and that nonequitibrium fluctuations are merely random noise that will soon be corrected. Reflexivity asserts that prices do in fact influence the fundamentals and that these newly-influenced set offundamentals then proceed to change expectations, thus influencing priees; the process continues ion a self-reinforcing pattern. Because the pattern is self-reinforcing, markets tend towards disequitibrium - a case in which every outcome is uniquely different from the past in a visible absence of equilibrium. Flanagan (1981) and others have argued that reflexivity complicates ail three of the traditional raies that are typically played by a classical science; explanation, prediction and control. The fact that individuals and social collectivities are capable of self-inquiry and adaptation is a key characteristic of real-world social systems, differentiating the social sciences fram the physical sciences. Reflexivity, therefore, raises real issues regarding the extent to which the social sciences may ever be 'hard' sciences analogous to classical physics, and raises questions about the nature of the social sciences. (Wikipedia)
Nelson (Legg Mason - 2008) believes that short-sellers in the financial market have
seized upon Soros' theory of reflexivity, especially since the uptick rule was removed in July
2007, to endlessly hammer down stocks and sometimes through the spreading of false
rumors. Nelson believes that financial stocks, due to the high degree of leverage, are very
susceptible to this as any loss of "confidence" is detrimental to business.

14
2.4 The stock market as complex adaptive system
As questions grow around the efficient market hypothesis, new theories develop that
attempt to build upon existing theory (EMH) by incorporating work from other domains
where theory has already evolved a !ittle further. According to Maboussin (2002), the
markets can be described as a complex adaptive system dominated by potentially irrational
participants operating with incomplete information and relying on various decision rules.
While the efficient market hypothesis has served us weil Maboussin believes the current
evidence know longer supports the theory and it does not stand up to the available empirical
evidence given that numerous researchers have discovered tradable anomalies. Inherently, it
is the discovery of these trading anomalies, which after being put into practice help restore
the market to its efficient state, but that at that point there are probably other anomalies that
will be discovered, hence a complex adaptive system.
The assumption that investors are rational and well-informed is also questionable. Capital
markets theory is based on the assumption of normal retums; the reality is that the retum
distributions exhibit high kurtosis with fat tails. 1t is precisely these fat tails that have lead us
to into trouble, or rather the discounting of these fat tails as highly un!ikely events that has
lead us into trouble. Maboussin be1ieves that while traditional capital markets theory has
served us weil, it is time to build upon this theory and move to the next phase. Maboussin
proposes what he calis, the stock market as camp/ex adaptive system. This theory builds upon
theories already used in other sciences such as physics and biology. A complex adaptive
system contains several essential mechanism and properties;
1. Aggregation; the emergence of complex, large scale behaviors from the collective inter-activeness of many less complex systems,
2. Non-linearity; cause and effect may not be simplistically linked, but may instead interact to produce exaggerated outcomes,
3. Feedback loops; amplify positive feedback and dampen negative feedback (i.e. momentum investors)

15
2.5 Relationship between Market Value, ROIC and Growth
Exhibit 2.1. Theoretical Relationship between Market Value, ROIC and Growth
Exhibit 4.1 Theoretical Relationship between Market Value~ ROIC, and Growth
WAce =S percent
Market va IUl"i Capital ratio'
1
ROIC
15%
1 .. -··6%
o 0% 5% 10% 15% 20% 25%
Revenue growlh
'Assum~ a competitive .1dv<lntage period of 10 j'fars. a!lN which ROIC = WACC is .lSSumed.
Source; McKinsey (20005)
According to McKinsey (2005), the well-regarded international consulting firrn, while
irrational behaviour can drive stocks in the short-terrn, the stock market is ultimately
grounded in fundamental economic logic, ROE, growth and free cash flow drive long-term
value with the market paying up for higher returns and higher growth. Mckinsey believes in
efficient markets, but acknowledges swings caused by emotions exist. "Market-wide price
deviations are short-lived: over the past few decades, the market corrected itself within a few
years to priee levels consistent with economic fundamentals," (McKinsey, Valuation, p, 70)
Mckinsey daim that cash flow, 1ead by a combination of revenue growth and return on
capital drives the firm value, There is a strong relationship between total retum to
shareholders and changes in performance expectations.

16
The market is not interested in accounting choices, but rather investors care about the
firrn's underlying financial perfonnance. McKinsey contend the market is efficient, but
inefficiency can last up to four years. This ends up being a question of semantics, but 1 must
admit that four years is a long time given that the average holding period of market
participants is closer to 1 year.
2.6 Distribution of Stock Market Returns
The mathematical characterization of stock market movements has been a subject of intense interest. The conventional assumption that stock markets behave according to a random Gaussian or normal distribution is incorrect. Large movements in priees (i.e. crashes) are much more common than would be predicted in a normal distribution. Research at the Massachusetts Institute of Technology shows that there is evidence that the frequency of stock market crashes follows an inverse cubic power law. This and other studies suggest that stock market crashes are a sign ofself-organized criticality in financial markets. In 1963, Benoît Mandelbrot proposed that instead offollowing a strict random walk, stock priee variations executed a LévY.flight. A LévY.flight is a random walk which is occasionally disrupted by large movements. In 1995, Rosario Mantegna and Gene Stanley analyzed a million records of the S&P 500 market index, calculating the returns over a five year period. Their conclusion was that stock market returns are more volatile than a Gaussian distribution but less volatile than a Lévy .flight. Researchers continue to study this theory, particularly using computer simulation of crowd behavior, and the applicability ofmodels to reproduce crash-like phenomena. (Wikipedia - 2008)
What do we glean from the above extract? Well, knowledge of the day and belief systems
is fluid and what is believed to be true today, may not be tomorrow, next week or one year
from now. Consequently, accounting researchers can continue to challenge established
beliefs and move in new directions with new theories and experiments. This also goes beyond
the Efficient Market Hypothesis (EMH) debate and extends to the broader debate around
Modem Portfolio Theory (MPT). MPT is being questioned as long-held beliefs surrounding
risk, return and diversification come under closer scrutiny. In times of crisis the correlation of
returns between asset classes believed to have low correlations appears to have increased.

CHAPTERIII
FUNDAMENTAL ANALYSIS
3.1 Finaocial Statemeots - Are They Still Relevant?
The world is a funny place subject to many changes in trends and fashions. This also
holds true for the financial markets. The 1990s saw the emergence of the technology bubble
that eventually bust at the start of the new millennium. Investors were often encouraged to
look beyond the CUITent financial statements and extrapolate certain unrealistic and
unsustainable growth expectations weil into the future in an attempt to justify bloated stock
priees. The value and esteem of financial statements went down in the eyes of the investing
public.
What followed was a stock market crash, scandais and enormous wealth destruction.
Strangely the argument quickly shifted to how financial statements and accountants let
investors down by not properly protecting investors from the capital destruction. The
evidence was to a certain degree already in the financial statements, but investors chose to
ignore it.
Penman (2002) acknowledges that the concept of accounting quality is vague and hard to
define. Penman looks at the issue from the proprietorship prospective of accounting theory
whereby financial statements are prepared for the benefit and use of common shareholders.
This contrasts with the enlity perspective where financial staternents are prepared for the
benefit of the firm. Penman points out sorne of the main criticisrns of the entity perspective
starting with the absence of discussion regarding property rights, the division of daims to the
firm that result in non-discriminating and even ambiguous accounting.

18
Earnings or rather the quality of earnings and their usefulness in predicting future
eamings is a central theme of Penman's work. Investors pay for future eamings, but use
current earnings as an input in the future eamings prediction mode!.
Penman's poor features ofGAAP eamings;
1. Little emphasis on the shareholder equity statement,
2. Not enough clarity on the debt versus equity financing and its impact on earnmgs,
3. Priees in financial statements,
a. Mark-to-market of equity investments,
b. Pension asset gains.
Penman's good features ofGAAP eamings;
1. Priees not in financial statements,
2. Revenue recognition and matching,
3. Accrual accounting,
4. Knowledge assets.
Penman rebuffs the notion that financial statements are backward looking or merely a
snapshot ofhistorical events. He points to various studies that highlight how current eamings
can act as an indicator to future investors as weil as the many investrnent strategies based on
financial staternent analysis that are able to consistently generate positive alpha.
According to Penman, financial statement analysis is useful in predicting future earnings
because of the inherent structural feature ofthe financial reporting model;
• Operating incorne = free cash flow + change in net operating assets
Furthermore, the interaction between variables in the double-entry accounting process
results in a chain reaction throughout the financial statements. This trail can be followed

19
through diligent financial analysis. So the problem lies not in GAAP or accounting
standards, but in the decline of firms' and accountants desire to act in good faith.
In 1998, then chainnan of the SEC, Arthur Levitt, gave a speech ln entitled The
Numbers' Came, which was a scathing review of earnings management practices. The
timing of the speech is interesting from a historical perspective, as we ail know what
happened just a few years later. Levitt was concerned that Wall Street's obsession with
quarterly earnings was leading to a breakdown in corporate ethics and the quality of earnings
was in serious doubt as managers scrambled to hit eamings targets through the use of
sometimes-dubious practices. At the core of the problem, at least in Levitt's view, was that
some managers were trying to fool the market by exploiting the inherent flexibility in the
accounting process; a flexibility that was built into the system to allow it to adapt to current
innovations, not manage eamings.
The Chairman highlighted several areas where practices were particularly disturbing
including;
1. Big bath charges,
2. Creative acquisition accounting,
3. Miscellaneous cookie jar reserves,
4. Materiality,
5. Revenue recognition.
An action plan was also proposed focusing on three areas;
1. Technical rule changes (more rules and strict guidelines),
2. Enhanced oversight (enforcement),
3. Cultural change at the corporate level (corporate governance).
While 1agree with two of the Chairman's points including the need for cultural change at
corporate level and more enforcement, 1 disagree in the area of more rules in place to limit
flexibility. Prior research has not confirmed that US GAAP produces financial statements of
superior quality ta lAS, despite being more rules-based.

20
ln response to Levitt's cali for more rules in his 1998 speech, Lundholm (1999) tackled
the issue of information quality in financial statements from another angle. He argues that
the cali for stricter guidelines will eventually have the reverse effect on financial statements
and lead to less informative statements. Lundholm adopts the viewpoint that rather than
mandating new standards in an attempt to eliminate discrepancies, a more pro-active
approach should be adopted. Firms should be encouraged to choose the best measures
themselves and augment disclosure. Companies will be encouraged to provide disclosure on
past estimations (i.e. accruals) and re-evaluate past balances. Investors will then be able to
see what percentage really occuITed and how much were false estimates. The market will
likely punish those firms that do not take advantage ofthis.
Lundholm suggests increasing the leeway in the CUITent system, but at the same time
putting in place mechanisms that would allow regulators and investors the ability to make a
value judgment on the attainability of future results (i.e. accruals). This method would be
useful for soft items such as accruals and research and development.
The method is also useful in that it will help improve comparability between companies,
while providing sorne past reference guidance for investors. Firms take more responsibility
for reporting and auditors will be in a better position to assess prior estimates.
The CFA institute released a working paper in July 2007 entitled A comprehensive
Business reporting Model - Financial reporting For lnvestor. The crux of the paper was to
highlight the importance of financial statement reporting for investors and investment
professionals. The financial statements and the business reporting model is the lens through
which investors can analyze a company's results and a key element of the investment
analysis process. Financial statements and disclosures provide critical information to
investors;
The ability to make high-quality, independent, objective and reliable investment decisions depends not only on our expertise in the use of analytical and valuation techniques, but also on the quality of the information available for us to collect, analyze and incorporate into our valuation models. (CFA lnstitute, 2007, page 7)

21
For a long period of time capital markets based empirical research in accounting relied
heavily on the premise of market efficiency. This began to change in the 80s and 90s as work
from Penman, Ohlson and others pushed for more emphasis on valuation. The quest for
intrinsic value and the use of accounting information to identify mis-priced stocks intensified
in recent years. This type of research has also gained in popularity because of the potentially
large economic benefits associated with identifying high value-added (generate alpha through
implementation of trading strategy) information relationships.
Garcia-Ayuso and Rueda (1999) published an interesting article during the last stock market
bull run, - Is Accounting Information losing Relevance - Evidence From Spain;
Investors seem to attach little or no relevance at ail to eamings and book values when they assess the value of firms operating in fast-changing, technology intensive industries ... if investments in intangibles result in eamings and book values that do not reflect the true financial position of the firm, a growing trend in these investments is likely to result in a decreasing value relevance of accounting numbers. Ayuso & Rueda 1999, page 5)
My how this idea was shattered with the advent of the Millennium!
Valuation is a mix of history and future prospects (Barth, Beaver and Landsman 2000).
Equity market values lead accounting information in reflecting value relevant information.
Equity market values contain more than just past accounting information, but this does not
mean that certain accounting information (i.e. accruals) cannot help in determining future
value or have predictive power. A main controversy of valuation-based research is that the
main market (demand) is non-academic;
Value relevance studies typically do not lead to normative conclusions or specific policy recornmendations. (Barth et al., 2000, page 12)

22
3.2 The Role of Fuodameotal Analysis
The strength of the Efficient Market Hypothesis has been eroded in recent years as
market priees may trend towards efficiency over the long-term, but priees can hover above or
below fair value for extended periods of time. An adaptive process of efficiency is in place.
The analysis of accounting information and its impact on equity markets is a very active and
often controversial research issue in accounting and finance (Briginshaw 2004). On the one
hand there are those who back efficient market hypothesis and believe the output of
fundamental analysis is already in the share priee, while at the same time there is a huge
demand for any profitable trading strategies derived from fundamental analysis.
If we look at the recent credit crisis there were sorne investors who made enormous
amounts of profits by positioning themselves short the financial sector and more specifically
investment banks. The balance sheets of institutions such as Washington Mutual, Bear
Steams, Citigroup and Leman were examined as early as 2005 by certain investors and these
shrewd investors realized that; 1) leverage was way too high (30x in sorne instances), and 2)
the quality (value) of assets was deteriorating (risk increasing). An exogenous event such as
dislocations in credit markets, a slowing economy or a bursting of the construction cycle
could (and did) potentially result in the need for banks to undertake significant de-Ieveraging
initiatives, which is what started to happen in mid-2007. Briginshaw (2004) suggests that
fundamental analysis is in essence an attempt to list stocks from most to least preferred.

23
Exhibit 3.1.: Types of Fundamental Screens
Type Orcier stocks by Exaillple Descriptioll
1 Intrillsic va Ille Frmùœl &, Use acco\Ultillg. fllnclamelltals to
Lee (1998) esrimate imrillsic vaille. ancl so orcier
stocks
2 Illtennecliare v8111e Ou &. Use <1CCO\l1ltillg. fllllclamentais to
illdicator Pellll1a n preclict future vailles of a Sliltistic
( 1990) deellled to be illlporranr for value.
sucll as change in eal'llillgs
~
.:> "Stock screen" type Solimall Use accoullting fllllclalllentals ro
inclic3tor (2003) clirectly gllide the fOlïWltioll of
portfolios
Source; Briginshaw (2004)
24
According to Mohanram (2003) the market is complex, but also inherently simple.
Investors are concemed with the big picture and key off signais such as growth, quality
(ROE) and trend (improving ROE). Mohanram (2003) found that the use of fundamental
analysis, when properly modified, can help in the selection of growth firms - separate future
wirmers from losers. Lots of work has been done on high book/market stocks, but very little
work has been done on the importance of fundamental analysis when related to growth stocks
- an area where the fundamentals sometimes take a back-seat to more abstract interpretations
of valuation.
In separating wirmers from losers Piotroski (2000) looks at profitability, cash f10w
profitability, operating efficiency and liquidity as key differentiating factors. Both Piotroski
(2000) and Mohanram (2003), when discussing fundamental analysis state that being
profitable is important, but more important is showing an increased trend of profitability.
Firms that are currently profitable are likely to continue being profitable in the future. Firms
increasing profitability are assigned a higher value as the market extrapolates the improving
trend into the future. Firms that generate cash f10ws tend to have higher quality eamings that
are more likely to persist into the future. Improving margins and operating growth on the
back of a lower equity base means that operating efficiency is improving. Given that cash
f10w is viewed is the life-blood of ail firms, a firm that can generate enough cash through
operations to auto-finance growth, while at the same time paying out cash to shareholders is
making a demonstration of quality and strength. Less use of debt and equity markets is
positively viewed by the market.
Contrary to other studies that found that the market is too quick to assume current high
growth continues indefinitely in to the future Mohanram (2003) finds that the market does
not fully discount the current fundamentals, but rather is surprised when the strong firms
remain strong and the weak firms remain weak.

CHAPTERIV
ACCOUNTING-BASED MARKET STUDIES
4.1 The Low Book-to-Market (BM) Anomaly
There have been many research studies in recent years on the book-to-market (BM)
phenomenon and its impact on perfonnance. Low BM finns are expected to underperfonn
going forward, while high BM finns are expected to outperfonn. This is the classic value
versus growth debate. Expectations for low BM (growth) finns may be too high leading to
eventual deception, while high BM finns may be underestimated, thus surprising to the
upside.
Piotrosky (2000) tackles a common theme of high BM finns' tendency to outperform,
but with a twist. Piotrosky applies an accounting-based fundamental analysis strategy to
improve the risk/retum profile of a high BM portfolio. Typically high BM portfolio retums
are driven by the outperfonnance of a few star perfonners. Piotroski tries to find evidence of
certain characteristics that can be analyzed that will allow the cream of the high BM stocks to
rise to the top. The goal is to identify those companies, which are simply undervalued
because the market is missing the positive aspects of the story from those firms that are
simply unattractive stocks. The high BM stocks are particularly suited to this type of
fundamental analysis because they are often firms followed by relatively few analysts and
less influenced by market noise.
Piotrioski points out that high BM finns tend to be neglected stocks with very little
available forecast data because analysts do not spend time on these often small and thinly
traded names. This may be a clue that the market may be underestimating the future potential
of certain finns, leaving room for upside surprises. Financial statements are ideal or rather
are the most appropriate method to analyze these types of companies because a useful

26
consensus of future earnings and cash flows are not available making the traditional
discounted cash flow models inappropriate.
An investment strategy based on nine variables in three categories is used to separate the
winners from the losers;
1. Profitability
1. ROA
Il. CFO
Ill. Change in ROA
2. Leverage
1. Change in leverage
Il. Change in liquidity
lli. Capital increase
3. Operating Efficiency
1. Change in margin
ll. Change in asset turnover
lli. Accruals
The sample uses Compustat data from the period including 1976-1996. 14043 high BM
films across 21 years are examined. The use of these particular ratios to differentiate quality
from non-quality firms results in superior performance. The author stresses that the ratios
chosen are not necessarily the most optimal factors, but they nonetheless are useful ln
continuing that financial statements can be used to develop moneymaking strategies.
The results ofPiotroski's test contradicts Fama & French's claim that the high BM firms
outperfonn simply because they are financially distressed firms, thus creating a high risk and
high retum scenario. According to Piotroski 's findings;

27
The evidence supports the view that the financial markets slowly incorporate public historical financial information into priees and that the sluggislmess appears to be concentrated in low volume, small and thinly followed firms. (Piotroski, 2000, page 34)
Mohanram (2004) uses financial statement analysis to find signais of over-excitement
and conservatism. The interesting part of this study is that it concentrates on low BM firms
as he attempts to separate the future winners from losers. Hence, which growth firms are the
real deals and which are merely flashes in the pan?
Mohanram's strategy is to buy the companies with the strongest growth fundamentals
and shorting the firms with the weakest fundamentals. The strategy relies entirely on
publicly available historical financial information statements. Using these financial
statements three types of signais were developed;
1. Fundamental profitability and cash flow
1. RüA> industry median
Il. Cash flow RüA > industry median
111. CFü > net income
2. Naïve extrapolations of present data
1. Earnings variability < industry median
Il. Sales growth variability < industry median
3. Low BM because of conservative accounting
1. R&D > industry median
ii. Cap Ex > industry median
111. Advertising> industry median
4. Mohanram analyses the fundamentals from a mispricing perspective and not a risk
effect.

28
Data used and time frame;
1. Compustat 1979-1999
2. Alilow BM finns
The results of the study are fascinating because it provides evidence that fundamental
analysis can be useful even in a growth finn environment where the traditional focus has
been on non-fundamental analysis to justify high share priees.
4.2 Future Earnings Growth
Earlier in this report we highlighted Penman's (1992) view that researchers should try to
decipher what financial infonnation helps predict future growth. Li (2003) builds on this idea
and tries to not only find factors that can predict future eamings, but he also tries to quantify
(forecast) future earnings growth several years out. This implied earnings growth from the
financial statement analysis is then compared to analysts' growth forecasts. This approach is
relevant because eamings are a key element in deterrnining stock priees. Investors pay for
eamings with the most cornmon fmancial models trying to estimate future earnings and then
discounting the results back to a present day value.
Li isolates operating 1Ocome 10 an attempt to exclude leverage and focus on value
generating activities. Performance measures from existing studies and strategies (ROA,
accruaIs) are used to develop a template that is supposed to generate a useful eamings growth
forecast mode!.
The study proposes tlnee findings;
1. Financial statement analysis can yield dependable forecasts of long-term eamings growth.
2. Analysts' long-tenn earnings forecasts do not fully reflect or incorporate financial statement infonnation.
3. The market does not fully reflect financial statement infonnation, thus leaving the door open to financial statement based strategies.

29
While Li's study adopted an interesting perspective, the actual results were weak as the
model had only minimal explanatory power, making the predictive nature of the model weak.
Alas, more weak needs ta be done building on Li's work.
4.3 SUE - Standardized Unexpected Earnings
Collins & Hribar (1999) exanune two well-known anomalies - post earmngs
announcement drift and the accrual anomaly in order to gauge if these anomalies capture the
same market inefficiency or whether they are unrelated anomalies.
Post-eamings announcement drift refers to the tendency of share prices to drift in the
same direction as the initial direction of a share price move following an earnings surprise.
This drift tends to last in upwards of 120 days. Investors extrapolate the good news into the
future.
Accrual anomaly recognizes that the market does not recognize that accruals are less
reliable than cash flows, leading them to overvalue shares of firms with bloated accrual
levels. This subsequently leads to underperformance.
Collins and Hribar build on Sioan's zero net investment hedge portfolios;
1. Long firms with largest negative accruals,
2. Short firms with largest positive accruals.
Sioan's strategy was able to generate positive excess retums. The authors modify
Sioan's study by shifting it to a quarterly basis from an annual basis in order to make it work
along side the eamings-drift anomaly. The researchers confirm that the market systematically
mis-estimates the accrual anomaly. This mispricing of accruals sets the stage for eamings
drift, which is also, occurs afterwards. The two mis-pricing anomalies present appear to be
independent of each other, thus allowing a strategy that integrates the two to generate greater
excess retums.

30
As is often the cases in research settings, academics do not always agree and evidence
can sometimes be contradictory. While there have been many studies focusing on earnings
drift strategy, Johnson and Schwartz (2000) present us with evidence that the capital markets
do in fact pay attention to accounting research when it is believed to be relevant to real world
applications. Johnson and Schwartz provide an encouraging study on how the eamings drift
phenomenon has essentially diminished, at least according to their study, because the
investment community seized on the work of accounting researchers and have effectively
shut down this particular anomaly making excess retums unlikely going forward.
The two researchers examme post-announcement earnmgs drift from 1991-1997 and
conclude that the opportunities for excess gain have been substantially eliminated;
As investors leam about leam about eamings surprise profit opportunities, they tilt their portfolios toward strategies designed to arbitrage the opportunities, and this altars the behavior of post-eamings announcement stock returns. (Johnson and Schwartz, 2000, page 2)
The authors refer to this process as the adaptive efficient stock market theory put forward
by Daniel and Titman (1999). This also confirms what the theory put forward by Penman
that markets are not efficient and that it takes time for information to be fully compounded
into security priees allowing for fundamental strategies to work.
This seems normal to me in the context that if it can be proven that a strategy works and
the strategy in question is easily applicable in a cost-effective manner then investors will
definitely act on this strategy. While the eamings-announcement drift anomaly may have
been played out, the door remains wide open for new strategies. It is then up to the
researchers to come up with the next strategy or anomal y and as we ail known there will
always be ways to earn excess retums.

CHAPTERV
FAIR VALUE
5. Fair Value
FASI57 - Definition of Fair Value;
Fair value is the price that wauld be received ta sel! an asset ar paid ta transfer a liability in an arderly transactian between market participants at the rneasurement date. (FASB, 2008)
The solution to one problem almost always contains the seed of another. (Davies, 2008, Financial Times)
Credit Suisse's David Zion (2008) put forward the case in favour of fair value in a recent
research paper. As a greater portion of the balance sheet is at marked-to-market (fair value),
the stated book value becomes more meaningful and the balance sheet gives investors a much
clearer picture of the economic value being created by the business. This allows the users of
the financial statements to get a better handle on key exposures, risks and the underlying
factors that drive the value of the assets and liabilities, while allowing for the proper
oversight. Zion answers an important question; why wou Id you pay more than book value for
a company? There are essentially three reasons to pay more than book value for a firm;
1. Value of future business,
2. Excess retums,
3. Business division with cash flows not well-captured on the balance sheet.
There is a large and ongoing debate around the merits of fair value accounting. Fair
value requires organizations to mark-to-market certain assets. While this may appear to be a
good idea on the surface the implications can be quite unsettling to the financial markets. The
complexity of financial products is a key factor to consider when considering the fair value
question (Economist 2008). Liquidity is another major issue that needs to be considered;

32
There is a saying among bankers that a shortage of capital kills you slowly and a shortage of liquidity is like a bullet in the head. (Geoffrey Wood, Case Business School from Bloomberg Article 09/22/2008 NYC Loses More Jobs, London Homes Drop as Banks Reel, By Sharon L. Lynch and Thomas Penny)
Investors must differentiate between fair value and market value, which ties this issue
into to the market efficiency debate. There is evidence that fair value rules have in essence
fueled the booms and made down cycles more painful through its impact on leverage at
financial institutions.
The fair value issue is one that clearly highlights the importance and the real world
impact of accounting considerations. Plantin, Sapra and Shin (2007) make the case that
accounting is relevant because we live in an imperfect world, where priee paid does not
necessarily equal the hypothetical vale that would prevail in a perfectly controlled or
transparent (frictionless) market. Those in favor of marking-to-market believe that market
value is a better representation of value because it is a truer reflection of the priee at which an
asset/liability can be traded for today. This allows market participants to have a better
understanding of a firm's potential value and risk profile.
Plantin, Sapra and Shin (2007) study whether fair value accounting results in much
higher than volatility in transaction priees. Is this volatility a function of accounting rules or
the underlying fundamentals? They draw from the Theory of the Second Sest from welfare
economics. Does correcting one problem amongst many make things better or does it have
the perverse affect of worsening overall welfare? The authors conclude that while historical
cost accounting has many deficiencies simply marking to market does not solve ail the
problems, but also creates new issues such as increased volatility and greater periods of
diseguilibrium. This is specifically true when the assets/liabilities being looked at are long
term in nature and illiquid. This presents particular problems for banks and other financial
institutions.
Plantin, Sapra and Shin (2005) also add to the body of knowledge on mark-to-market
with a paper that focuses on how the quest for yield amplifies financial volatility. Their

33
findings in a sense confirm the Theory of Reflexivity. 2005 was a period oflow interest rates
across the yield curve, limited spreads between asset classes and low implied volatility.
Investors began to move towards riskier assets to achieve higher yields. The increase in
demand for these riskier assets caused the yields to compress further given the inverse
relationship between priee and yield for fixed income instruments. This led sorne to increase
leverage further and move into even riskier assets. Three years Jater we now that these moves
resulted in near catastrophic consequences for the global financial system. A massive
oversight of risk ,management had occurred and billions of mortgage-related write downs
ensued. Spreads have remained fairly tight for certain debt markets such as emerging market
debt, but it is only a matter of time before this shoe also drops.
Plantin et al. (2005) restate their case that fair market accounting in uncontestable in
completely [rictionless markets, but as soon an imperfection is introduced the case is no
longer strong. They go on to suggest that the priee of a security in the market is not only a
reflection of the current trading environment, but also a stimulant for future movements.
Actions (decisions) are taken not only because the underlying investment case is solid, but
because the priee action spurs fulther action - "a loop is created as priees affect actions, and
actions affect priees". The end-result is increased cyclicality as booms are exaggerated as risk
is under-priced and leverage increased as assets appreciate in value. The opposite happens
when as asset priees come down. The real world implications of this can be quite significant
as we are witnessing today.
Allen and Carlett (2006) provide an example of how issues in one sector (insurance) can
lead to contagion in another sector (banking) when the sectors hold the same asset and are
forced to mark-to-market even when this is a long-dated asset that does not need to be
monetized any time soon.
Let's assume the insurance company and the bank hoId the same long asset. The
insurance company encounters difficuity and is forced to liquidate the long asset. Selling the
long asset is not easy as the liquidity (buyers) is in short supply. If historie cost accounting
issued then there is no contagion, but if the bank is forced to mark-to-market then its assets

34
decrease, which will force it to sell further assets to de-leverage or stop issuing loans. The
added illiquidity makes the problem worse.
Penman (2006), in his 2006 speech, listed what he believed to be the pros and cons of fair
value accounting.
- Marking to model rather than marking to market,
- Introduces excess volatility into system,
- Feedback effects could potentially heighten system risk,
- Ooes not capture economics ofbusiness.
+ Investors concemed with value not costs,
+ With time historical priees become irrelevant,
+ Reflects true economic substance,
+ Reports economic income,
+ Unbiased measurement, consistent across time and entities.
Penman's conclusion - While fair value sounds like goOd old-fashioned common sense
the case is no that straight forward. Perhaps Penman's biggest issue with fair value
accounting is the notion that revenue as we have historically perceived it becomes less
relevant as income is impacted by changes in fair value that flow through the balance sheet
and income statement.
Another point of contention is that fair value means different things to different people.
Each user - shareholder, bondholder, manager - has a different notion of fair value and its
impact on the public, investors and regulators.
Looking at the issue from the shareholder perspective is Penman's preferred point of
analysis. Perunan states that accounting is a product and should be judged on how weil it
serves customer needs. Shareholders use accounting information for two reasons; 1)
valuation and 2) stewardship. If fair value accounting improves welfare, adopt it, but if we
gain on end only to lose out on another then the debate becomes less clear. Penman considers

35
the plus/minus for the 3 levels of assets according to FASB 's classification. While the value
of Level 1 assets are easily derived in active markets, the same cannot be said for Level 2 and
Level 3 assets, which are often valued on hypothetical market priees. Penman goes on to
conclude that fair value accounting is a potent concept at the conceptual level as equity vaiue
is clearly stated on the balance sheet. The problem is that concept and reality are two very
different issues. He believes that fair value works for investment funds where a NAV can be
determined and investors trade in and out. The notion of fair value breaks down when
looking at a firm trying to run a business based on a business plan and strategy. Penman gives
the example of Coca-Cola - should the value of Coca-Cola's brand be constantly re-valued
and passed through the income statement?

--------
36
Exhibit 5.1. Feedback Loops
Fignre 2 .6: Acl.instmenr. of Le\TE'l"Dge in B0UlT1S
Adjust leverage
~~ Stronger ~
balance sheets Increase./> BIS si::e
~~ A 5S et priee b 00 ln
Source; Adrian and Shin (2008)
Adrian and Shin (2007) add to the literature making the case that fair value adjustments
can have very pro-cyclical effects on cycle (up and down). Mark-to-market results in
increased leverage at the top of the cycle and decreased leverage at the bottom, which
amplifies the highs and lows. The result is that leverage is choked out in bad times, when it is
needed most to re-start the economy. For financial institutions marking-to-market results in
balance sheets that appear (incorrectly) under-leveraged in strong economic times. There is
pressure to put more capital to work and keep returns high. This results in the assumption of
more and more leverage ail the way to the top of the cycle at which point the process
reverses. Adrian and Shin (2007) point to the active management of balance sheets, where
leverage is positively correlated with asset growth. If marking-to-market has no impact on the
market (simply accounting) then the relationship with asset growth would be inversed.
Once agam a feedback loop is created whereby appreciating assets lead to greater
demand for the asset, which in turn pushes up priees further. Asset priees have real life
consequences on balance sheets and the economy (financial system). In a low interest rate

37
environment with lots of available liquidity the consequences can be quite dire if allowed to
develop unchecked. Adrian and Shin (2007) highlight the sub-prime mortgage crisis as an
example of how the system can spiral out of control. Expanding balance sheets lead to the
need to put more capital to work. When the supply of credit-worthy mortgage borrowers ran
out the market started giving capital to people who had no business receiving a loan. In
essence a Ponzi scheme was created! Once the available pool of mortgage candidates was
completely exhausted and there was know left to buy a house the whole house of cards came
tumbling down.
In the end it was human greed and not the accounting system that failed, but the mis
interpretation of accounting mIes did play a raie in the crisis. It was not fair value that created
these feedback loops, but rather poor management and a lack of rigorous risk management.
Agency issues come into play as compensation is often unlinked to longer-telm economic
goals.

CHAPTER VI
Experiment and Supporting Research
6.1 Background
Drawing from our past investment expenence and supported by academic (i.e.
Damodoran) and institutional research (i.e. Goldman Sachs) we have focused our experiment
on expectations of future growth and profitability, which are based on internaI characteristics
(past performance, product range, and management's capabilities) and the external
environrnent (economic, political, social, and regulatory). We also focus on cash flow
generation (the Iifeblood of a company) and the ability (propensity) to return cash to
shareholders. The investment community is especially enamored with improving
performance (Piotroski 2000 and Mohanram 2003). Again based on existing research and our
own investment experience we have developed a stock selection screen that tries to identify
companies with attractive growth and profitability profiles while controlling for the payout
yield (dividends plus share repurchases). The implied assumption is that a portfolio of
companies with superior growth and profitability profile relative to the market while also
maintaining an attractive payout yield has a solid chance of outperforming throughout an
investment cycle.

39
Exhibit 6.1 Sustainable üutperformers
Superior Capital Allocation; dividends, Strong and improving
buybacks and re profitabilityand ROE investment in business
Sustainable Outperformers
Strong cash f10w growth (EBITOA)
Source; Zaccardelli (2008)
A company that can distribute cash yet still grow at an above average rate must be an
efficient allocator of capital (ROE greater than cost of equity). The market will compensate
this and the steady stream of cash can be re-invested in the company regardless. This usually
signais the quality of eamings are strong and that management is spending wisely as apposed
to make value destructive acquisitions or empire building. The payout yield also acts as an
indirect control on valuation. We do not screen for valuation specifically.

40
Exhibit 6.2. Distribution / Creation of Wealth
Dividend Paid Dividend reinvested . Distribution of wealth Creation of wealth
Company
Source; Zaccardelli (2008)
6.2 Theoretical Support of Our Investment Process
6.2.1 Payout Yield Research
Robertson & Wright (2006) point out that numerous studies have called into question the
long-held belief that dividend yields are a good predictor of future stock retums. Robertson &
Wright suggest that the changing nature of payouts may be behind the decrease in the
explanatory power of dividends. The cash flow yield (dividends plus net buybacks) may have
stronger predictive power. Dividend trends have changed, with companies relying more and
more on share buybacks for various reasons. According to Robertson & Wright the cash flow
yield displays a strong and predictive power over a long time horizon. The use of the cash
flow yield re-validates earlier theory about the predictive power of dividends. The researchers
concede that while the predictive regressions are stronger for the cash flow yield when

41
compared to the dividend yield of the non-financial dividend yield and the S&P 500 Index
dividend yield, is risky the R"2 remains relatively weak implying that a trading strategy
based on the cash fiow yield is risky.
Exhibit 6.3 Predictive Return Regressions
PRED.lCTIVE RETLIRN REGRESSI()NS
FIGURE 2.-RECURSIVE T-STATISTICS t'ROM PREDIC1l\'[ REGRESSIONS
3.5
3
1.5
0.5
o~---------,-----,---...---
1920 1925 1930 1935 1940 1945 1950 1955 1%0 1965 J970 1975 1980 J 985 1990 1995 2000
t+- S&P divider:!d yield -+- no~-1ina~dividendyield non-financial cashnow ~ield 1
Source; Robertson & Wright (2006)
6.2.2 Support for Dividends
ln bull markets dividends become less important or simply receive less attention, but
the focus eventually retums once the bear market dampens investor euphoria. The perception
and importance of dividends has varied over time, but the companies listed on the stock
markets of developed countries for the most part pay dividends. On top of that these markets
tend to have a group of investors who focus on dividends as a key element of investment

42
decisions (Manley, Muller & Glissman 2007). There is no set target for dividends and each
company adopts its own policy, but nonetheless a large body of work has developed around
the theory that there is a strong lin!< between dividends and equity value. Hence, the equity
value of equities should reflect the discounted value of future dividends. Timing varies, but
ultimately firms return cash to shareholders.
6.2.3 Return on Equity
There has been a paradigm shift in recent years as the ernphasis in valuation has rnoved
from simply looking at growth prospects to looking at profitable growth - excess returns
(Damodoran 2007). Return on equity (ROE) measures the return on the equity portion of the
investment after taking into consideration debt servicing. Darnodoran believes three issues
need to consider when using an accounting-based return such as ROE.
1. A single period retum rnay not be a true estimate of the long-term,
2. Book value of equity leaves us exposed to accounting choices,
3. Issues with accounting and tax rules will show up in ROE.
There are no fool proof measures and cash flow based analysis is not necessarily better
than measures based on accounting eamings because it inevitably requires analysts to rnake
assumptions about future cash flow and invested capital that may prove to be inaccurate
(Damodoran 2007);
The ROE of a finn that pays a large dividend or buys back stock will increase after the transaction because the book value of equity will decrease disproportionately, relative to net incorne. (Darnodoran, 2007, page 39)
Net income is also affected as the cash generated a return in previous periods. When
looking at finns with large cash balances it may be worthwhile to look at non-cash ROE that
focuses on operating ROE;

43
Value is ultimately determined by expected returns on future investments. While there is
no guarantee that high returns today can be maintained ROE is likely to remain relatively
stable over a 12 to 24 month period. (Damodoran, 2007, page 48)
Factors that need to be considered when looking at ROE (Damodoran 2007);
A firm that generates retum on equity that exceeds its cost of equity is earning a positive excess retum. The presence of these returns will draw in competitors over time putting downward pressure on these returns. Revenue growth trends revert quickly to average levels while ROE can remain high for extended periods. Ultimately, positive excess retums have to come from competitive advantages or baniers to entry into sectors. Stronger and more sustainable competitive advantages should lead to larger excess retums over longer periods. Thus, firms that have generated high retums in the past may continue to make these retums for the next few years, but the excess retums will start decreasing as firms become larger and competition increases. (Damodoran, 2007, page 56)
1. Life cycle,
2. Accounting differences,
3. Barriers to entry,
4. Reversion to the mean,
5. Luck,
6. Management quality,
7. Competitive advantages.
6.2.4 How Do Accounting Variables Explain Stock Price Movement?
Equity values are a function of two factors; invested capital and the profits (ROE) eamed
on the invested capital (Chen and Zhang 2006). Valuation work is done by trying to forecast
the level and rate of future invested capital and ROE. Thus, stock returns are a function of
company's future growth and profitability. Chen and Zhang build a model that examines 4
cash flow related factors;
1. Earnings yield,
2. Capital investment,
3. Changes in profitability,
4. Growth opportunities.

44
They conclude that equity returns are positively correlated to the four factors. The
information used in the study comes from pub1icly availab1e information using Compustat
data from 1983 to 2001. The profitability related information (earnings yield and profitability
change) have the greatest explanatory power.
Valuation literature has typically analyzed market efficiency, abnormal returns and
financial ratios (Kamstra 2003). The use of accounting information to try to value firms really
became popular in the 1990s (Lee 1999). The domain has since flourished given the vastness
of the subject matter and a strong demand from both academics and practitioners. Valuation
research is now a central theme in the accounting domain (Lee 1999). Share prices ref1ect ail
sorts of distorted beliefs about growth, management's abilities, the political situation and
social issues. The role of accounting information in valuation is to help breakdown these
beliefs into fact and fiction to detennine a true value. Lee (1999) highlights five concepts that
he believes are key to understanding valuation. Valuation is;
1. Prospective; PV ofF(CF) is subjective and imprecise (art),
2. Inter-disciplinary skills including accounting, marketing, strategy, finance, economics and marketing,
3. Valuation models are merely "pro-forma accounting systems",
4. Facilitates forecasting.
Valuation is as much art as science as it is forecasting that breathes life into the valuation
model;
Fundamenta1 analysis may be viewed as the art of using existing information, such as historical financial statements, to make better forecasts. (Lee, 1999, page 4)
Valuation mode1s are tools, that we use to improve our forecasts, but forecasting is an
inherently subjective task. Each person brings his own biases to the table.

45
There has been a shift in recent years from 100king at contemporaneous relationships
between accounting information and returns to the use of accounting information in a more
predictive fashion - residual income mode!. Economic profit has now gained widespread
acceptance as growth for the sake of growth is no longer reared. The market looks for
profitable growth.
Exhibit 6.4 Payout Yield Through Time
7.0%
[).O%
5.0%
4.0%
3.0% '---2.0% ,
~ . . '1.0% ..... - '"
;
co Ol 0 ,. ('\J ("') co co Ol Ol ~ &; ~ ~ ~ o 0Ol Ol Ol Ol Ol Ol Ol Ol Ol o 0 'r'"" \"" r ,- ,- \'"" \"",- ('\J ('\J
Dividend Yield - - - - Buybuck Yield ---Total YieiLi
Source: Empfric31 Research P3ltl1ers.
Source; Maboussin (2006)
We use payout yield because aggregate share buybacks are now larger than dividends.
The decision to buy back shares is not simply about boosting EPS, but is a function of capital
allocation alternatives including;
46
• Core business use
o Capital expenditures
o Working capital requirements
o Mergers and acquisitions
• Retum cash to shareholders
o Dividends
o Share buybacks
o Debt repayment
We look for a high payout yield because it send a signal to the market (i.e. stock is
cheap), but we do not look solely for EPS growth because we want core operating growth to
be strong. The ability to maintain a high payout yield - add economic value - is important.
Higher EPS growth thus becomes a bonus of a more efficient capital structure.
The rules governing a share buyback are typically that a share buyback is appropriate
when a share is trading below fair value assuming management properly assesses the firm's
outlook. Also, a buyback is appropriate when no other attractive investment opportunities are
available. Buybacks are also used to manage EPS, but we obviously view this as bad.
Buybacks are used to reduce dilution (we look at net buyback) and they are used to increase
leverage to achieve a more optimal capital structure.
Maboussin (2006) states that ROE in and of itself has substantial limitations, but when
combined with payout policy can shed considerable light on growth prospects.
Eamings growth = (1 - payout ratio) * ROE
Maboussin states that current ROBs are elevated by historical standards. He does not
believe eamings growth will exceed historical levels given that growth is driven by macro
factors like GDP growth. Therefore, the payout ratio will have to rise to bring eamings
growth back down to normallevels.

47
ROE = net margin * asset turnover * leverage
net margins are already high
asset tums have improved significantly
leverage unlikely to decrease as balance sheets ex-financials are in good shape
6.2.5 Stock Repurchases and the EPS Enhancement Fallacy
Oded and Michel (2008) provide further insight into the notion that simply buying back
shares to increase EPS is a useless policy that does not provide real economic value to
shareholder. In perfectly frictionless markets payout policy is irrelevant. Alas, we do not have
the luxury of frictionless markets, thus the payout policy does have a real-life impact on share
priee performance. Zhou and Ruland (2006) demonstrate that high dividend payouts are a
predictor of higher future earnings growth. Intuitively, the opposite should be true based on
the previous formula. Ode and Micehel (2008) focus on repurchases as a substitute for
dividends that drives EPS growth, but does not necessarily provide economic profit. The
researchers provide a scenario analysis
1. No payout (cash accumulation),
2. Dividends,
3. Repurchase.
Total value (firm value plus cash paid out) remains unchanged in each scenario;
Expected EPS is higher in the repurchase scenario than in the cash accumulation scenario because the expected return on the firm's assets increases with share repurchases. The reason is that the retirement of cash causes the relative weight of the safe asset (cash) in the firm' s asset composition to decrease whereas the relative weight of the risky assets increases. No value is added, however, for the existing shareholders. Instead of having safe cash in the firm, the shareholders now have safe cash in their pockets - and riskier shares. (Oded and Michel, 2008, page 65)

48
The objective is to look for the optimal risklreward and generate real econornic value
added. This is once again true in a perfectly frictionless market, but in actuality factors such
as taxes, infonnation asymmetry and agency costs make the payout policy decision quite
relevant to value creation;
For example, in actual situations, finns that engage in share repurchases probably believe one or both of the following; (1) Their shares are undervalued; (2) given the projects available for them to invest in, the remaining rnix of risky and safe assets after a share repurchase will be optimal for them. To the extent that managers are correct in either of these beliefs, the shareholders that hold their equity stake from time zero may have a greater probability of maximizing overall wealth in reality than they do in theory. Achieving the higher EPS in the repurchase scenario, however, depends partly on the finn's ability to continue to generate at least as much profitability in the future from its changing rnix of assets (including riskier assets that can introduce volatility as in the past. That is, given that an optimal mix of assets and cash exists in real-Iife situations and given that infonnation is asymmetrical, a repurchase is good news. It reveals to the public that the finn is persistently generating free cash, which the firm removes from its composition of assets through stock repurchases so that the finn will revert back to its optimal mix. Similarly, when markets are not perfect, the cost of capital generally differs from the return on investment. A finn that holds more cash than needed for its operations - namely, a firm that does not disburse its free cash - is usually destroying value for its shareholders because the return on the cash that it generates is lower than its cost of capital. In fact, this is often the reason that shareholder activists urge firms with cash hoards to initiate share repurchase programs. (Oded and Michel 2008, page 71)
Feltham and Ohlson (1999) review the empirical implications of the model they created
in 1995 - the residual income model, which has become the reference point for a host of
research since its initial publication. The FO model equates a finn's market value to
accounting infonnation and other relevant data including dividends, the discount rate and
market value. In an attempt to better understand their own model; in 1999 they took a look at
the impact of growth in relation to the backbone of the model, which is current earnings and
book value.
Feltham and Ohlson (1999) believe that expectations of future growth and earnings are
more important than historical accounting information, but the historical data remains the
starting point for analysis. The past is often extrapolated into the future. This reasoning is
generally accepted by most researchers. The Feltham-Ohlson Model provides a foundation

49
(historical accounting information) from which ta build using expectations top derive future
accounting data. Feltham and Ohlson highlight growth in net operating assets as a key
independent variable. This is why we screen for EBITDA growth, a close approximation for
cash flow growth. The Feltham-Ohlson model also makes the case that financial assets
should essentially be valued at market value. The market pays for core operating growth.
Gode-Ohlson (2006) highlight sorne of the weaknesses with a dividend-based approach
including the propensity of many growth companies to not pay dividends, the fact that
dividend policy is value neutral unless managers hoard cash or have sub-optimal financing
policies and that dividends represent wealth distribution as opposed to wealth generation.
Gode-Ohlson (2006) state that multiples are useful because they are easy lo compare and
communicate to end-users. The problems with a with discounted cash flow Analysis (DCf)
include the difficulty of understanding operating cash flow, the ease with which cash flow
can be manipulated and difficulty in forecasting free cash flow. Gode-Ohlson confirm that
priee is greater than Book Value if ROE is greater than the cost of equity and a market
premium over Book Value is anticipated economic profit to be generated in the future.
6,2.6 Changing Motives for Share Repurchases
Net share repurchases have increased in both absolute and relative to cash dividends
(Weston and Siu 2002). A major motive in the 1990s was to offset dilution. Firms that began
repurchase in the 1990s maintained characteristics similar to non-dividend paying firms of
previous periods. The repurchases were initiated for several reasons including;
1. Tax benefits,
2. Takeover defense,
3. Optimize financial structure,
4. Greater flexibility,
5. Agency issues.

50
Accounting for buybacks
1. book equity reduced,
2. cash reduced,
3. cash valued at l,
4. equity vaJued at greater than 1,
5. result id higher ROE,
6. Signal further improvements in cash flow and undervaluation.
Rate of retum of share repurchase = Cost of equity / (1 - % undervalued)
R = cost of equity / (priceNalue)
1. Rational only if the share repurchase generates a retum higher than potential
investments,
2. Market inefficiency is required.
6.2.7 Study of US Utilities Sector; High Performance and ROEs
Many companies focus on EPS as the main performance indicator (Azagury 2007).
Regulators also focus on net income and not capital discipline. The data confirms that capital
markets focus on capital discipline - ROE and ROIC less WACe - as the main driver of
value. These metrics correlate highly with total return to shareholders at the Top 40 Public
Utilities in the United States. Thus capital retums drive shareholder retums.
Despite the common belief that investors in utility stocks are interested only in high
yields, recent studies have shown a significant negative correlation between dividend yields
and total shareholder retums. A negative correlation was also seen between dividend yield
and both ROE and expected EPS growth. Azagury surmises that while dividends are a sign of
financial strength, the market believes that economically attractive projects are present and is
rewarding those companies that can make value-additive financial decisions. Azagury
highlights that active (value-added) management of a utility cannot be implemented properly

51
unless robust management and operating systems are in place (maintenance, capital
expenditures and prioritization). These attributes are directly linked to retum on equity
(ROE). It takes a total company effort to improve ROE to top-tier levels including
organization, processes, govemance, and access to information and decision-support tools.
Thus, leading companies really do execute better than second and third tier companies.
6.2.8 Payout Yield
There is significant evidence that repurchases have been used as a substitute for
dividends over the last lOto 15 years. Total cash retum to shareholders is what the focus
should be on today and in the future. Thus, dividend and repurchase policies are not
independent (Boudoukh, Michaely, Richardson and Roberts 2003).

52
Exhibit 6.5 Aggregate Dividends and Repurchases Over Time
Figure 1
Aggr-egate Di:vidends and Repul'eha.,;üs O"er- Till1e
The sSUlJ.>I" c(.n"iste ..,f firma frc'm th", snnllal COtvIPT.Jl''1'AT .:hL.. fil""" that haw n·) mù".ing ""ItH" fc·r b'~)":l"k J?qllit~~. e.!1,rning8~ b.:)·,:,k a'S&?ts. CColllnlOt\ di",ld~nds. T"'?pllrch3:~:_'S üf ':'ülnn),:))) sl.:-:u~)( and rnsrk..?t,
c.f'pil.~liz8.1l'Jn. 'Th~ bo?ight. .-,f th,:;, d~.rk sb~d('d port 1.:'[\ of the bs.rs .:):.Tt'..:-r..··nds- lü tbB 1" '.:"\t-AI d....··dl.ar anV:Hlrlt
of dividend8 ~.aid te- =mn10J) shar'" hold"'r8. The h?i.ght of tho? lI.nsh ..·Jed port ion .)f the bars .oorr.;ponds
tn the l,.ot,"'='11 dolLq..r amüllJÜ cf COTIln)·:-n sh.ttT·~ TepllT(:h::-t~Û8. B"~Jth dr..lI.ar figurot:"6 are inAHtic.n .~"LdjllSll:"C] lJ)
:20CO doU"r" lI8ing th'? oll-urban CPL Tho? line plot presents the ratio 'Jf tCltal':':'l1ll1h'J) "hare replll'cba80;
(R) l0 th"'? 8urn of ~·JJ.nll:,(.on aharE' l"'E'pu.T.:;hs,sl?8 and c',)Jnn\0t1 di .... idt?lJd,;. (D).
35').00: ,.-,-----.----,...,---,--,--,---,.---.-----.-----,---,------, O.i
o.~
0.5
0.",~
l~ fi
0.3
l~C.O:::t: 0.2
50.WO 0.1
o 0 1971 1979 1933
Source; Boudoukh, Michaely, Richardson and Robel1s (2003)
Boudoukh, Michaely, Richardson and Roberts study the relationship between returns and
dividend yields, then expand the study to look at the retums and total payout yields. They
find evidence of stock retum predictability is higher using the payout yield.
Payout yield can also be used as a quasi-economic indicator, rising as the economy
improves. This is why it is important to not only focus on yields, but quality to position
portfolio for the next uptum. In difficult times the screen leads us to the higher quality names.
While not immune to the economic cycle there is a built in adjustment for the economic

-------
53
cycle. The dividend becomes more important naturally in the down-cycle. As the economy
improves we capture growth and improving ROE, which should lead to continued
outperformance.
Exhibit 6.6 Average Anoual Sector Dividend YieJds and Relative Returns
Exhibit 2: Average annllal sector dividend yields and relative returns S&P 500 firms al Deoember 31. 2002, data from 1993-2002
30.0~·:>
• E 20.0~·o ::::1
"'§ <1> 1O. O~o :> = Il:: 0; 0.0°'0 ~ •c:
ë " •~
-10.0%. •1 -=------20.0%
0.0°/0 1.0~{. 2.0% 3.()O/., 4 .. 0°;" 5.0o,·~
Dividend yield
Sou/'ce: Go/d.·,'.'0:7n Sachs po,rrj~")l;o S!J1.1teK\'. Cnrnl-J,·/s",'r.
Source; Goldman Sachs (2003)
According to Goldman Sachs research dividends have been negatively correlated with
stock retums. They suggest focusing solely on the fundamentals of a company (EPS growth
and profitability. This being the case they found that that abnormal stock retums could be
generated by identifying companies who are poised to increase their dividends resultant to
strong underlying fundamentals.
So there is a negative relationship between dividends and retums, but the analysis
becomes more interesting when an analysis of the fundamentals and retum sis combined with
a control for dividend yields;
The measures of the underlying fundamentals are intended to capture the firm's profitability, expected earnings growth, cash generating ability and stability of cash flows. ROE is used as a measure of profitability, eamings yield as a

54
measure of expected eamings growth, cash from operations (CFO) capital expenditures and working capital as cash flow inflow and outflow. The results suggest that for any given dividend level investors could have increased their retums by considering a firrn's underlying fundamentals. (Goldman Sachs, 2003, page 5).
Exhibit 6.7 Regression of Relative Returns on Dividends and Fundamental Factors
Exhibit 4: Regression of relative returns on dividends and fundamental factors S&P 500 firms, 199:3-2002
Dependent Variable Total Relative Shareholder Returns
Independent Variables Coefficient t-statistic Intercept 42.0197 8.08 dividends per share -10.7880 -5.97
return on equity 1.1439 10.20
earn ings yield -5.8993 -15.75 cash from operations 1.5355 3.10 investment in working capital -1.7495 -3.68 capital expenditures -0.6037 -1.49 standard deviation of cash flows -0.0011 -0.82
R-squared = 14.8% N =3,629
Source: Goldmafl Sach.s Portfolio SI1Uregy, COlllpllSlai.
Source; Goldman Sachs (2003)
Goldman surmises that an unexpected increase in dividends is a positive for stock
retums. A dividend increase is a signal from management that cash flow is sustainable. It
imposes discipline on management and reduces investments in low-retum projects, while
increasing averall praductivity. An averly high dividend suggests future decline.
Gaspar, Massa, Matas, Patgiri and Reham (2005) faund that firms held by shart-term
investars are mare likely ta buy back shares as appased ta increasing the dividend payaut.
Management appears ta be catering ta shart-terrn investars who make the mast noise (pump

55
and dump stock strategy). Investor time horizons have become much shorter and greater
attention is placed on each quarterly result. This being the case the market attributes lower
signalling power to buybacks by firms under pressure from short-term investors. Studies he1p
shed light on the popularity of buybacks as investors time horizons have decreased.
Institutional investors now hold more than 50% of total equity outstanding. This shift in
ownership structure may help explain shifts in corporate payout policies. Mutual fund
holding periods have come down from 6 years in 1970 to 1 year in 2000.
ln a perfect market payout choice is irrelevant, but in reality markets are not perfectly
efficient and there is a certain degree of information asymmetry between a firm' s
management and investors. Short-term investors prefer repurchases because;
1. They do not have the incentive to fully understand a firm's investment opportunities,
2. A dollar in hand is worth more than a potential dividend further down the road,
3. A share repurchase is more likely to boost the share priee immediately.
Amott and Asness (2001) ask some interesting questions about the relationship between
dividend po1icy and eamings growth.
1. Are low payout ratios an indication that future growth will be higher?
2. Are low payout ratios an indication that current eamings are not sustainable?
3. Are earnings being retained for the purpose of empire building?
Amott & Asness (2001) conclude that managers convey through dividend policy private
information (signal) that hey will pay out more when the future is bright and 1ess when it is
dim. They a1so find that low payout ratios precede low earnings growth rates that managers
tend to pay out a 1arger share of earn.ings when they are optirnistic and smaller share when
they are less optirnistic. AIso, low payout ratios lead to inefficient capital allocation to fund
less than ideal projects leading to poor subsequent growth. Finally, high payout ratios lead to
more carefully chosen projects.

56
Grullon and Michaely (2002) showed that in 1980 repurchases accounted for 13% of
dividends and the figure rose to 113% in 2000 as repurchases were larger than dividend
payments for the first time in history. Since 1990 the majority of firms have initiated payouts
first through buybacks rather than cash dividends while the total payout ratio has remained
relatively constant. The larger, well-established firms have partially financed repurchases by
foregoing certain dividend increases. The dividend irrelevance theory of Modigliani and
Miller (1961) implies that in "perfect" capital markets dividends and share repurchases are
perfect substitutes;
The combined trend of a decreasing reliance on dividend payment and the increasing reliance on repurchases also implies that nowadays, a more appropriate tool of valuation is total payout rather than dividend payout. For example, sorne researchers argue that the historically low level of dividend yield is another indication of stock market overvaluation. The evidence here indicates that if we examine the total payout yields this conclusion may be premature. (Modiliani and Miller, 1961, page 411- 433)
According to Harris and Nissim (2004) - Convergence Trends for Profitability and
Payout Equity values are a reflection of future profitability and growth. Growth is a function
of ROE and payout. To value the equity we need to know how profitability and payout
evolve over time.
6.3 Summary of the Investment Concept and Approach
• Investment Universe
o llwest in US and Canadian companies
o Reference Index - MSCI North America (approximately 900 companies)
• Stock Selection Process
o AS-factor model with emphasis on core operating income growth, cash flow,
ROE (level & trend), dividends and buybacks
o Companies in top quartile of screening on ail five factors
o Quarterly rebalancing

57
o Used forward estimates available at the time, thus we could have chosen
losers (Emon, Nortel etc ... )
• Emphasis on sustainable growth, profitability and cash flow while controlling for
payout yield (dividends & buybacks)
• A targeted total retum approach with a built in base total retum of 7% to Il %
excluding alpha
o Dividends plus share buybacks 3% - 5%
o Nominal GDP growth 4% - 6%
• Results versus the market is a portfolio with;
o Valuation in line, but
o Higher growth rate (operating income and cash flow)
o Higher quality (ROE, dividends and share buybacks)
• The TWIST - most high yield portfolios offer low growth - not the case here
o Portfolio seeks sustainable growth, while fully participating in market rallies
o Objective is to be more resilient in down market
o Payout yield provides support in down markets
6.4 Description of Investment Model
As previously discussed our investment model is based on a stock screening system
anchored in both academic research and our own investment experience.
7.4.1 Investment Universe
The investment universe used a reference index is the MSCI North America Equity
Index, a broad-based reference index composed of approximately 900 of the largest
companies in Canada and the United States across ail 10 maj or sectors - Consumer Staples,

58
Consumer Discretionary, Energy, Financials, Healthcare, Industrials, Technology,
Telecommunications, Materials and Utilities. The Index is a free float-adjusted market
capitalization weighted Index designed to measure the performance of the US and Canadian
equity markets.
6.4.2 Time Frame
The study was conducted over a period of six and a half years starting on December 31,
2000 and ending on June 30, 2007. We believe this is appropriate time frame for the purposes
of our analysis because it encompasses an entire economic cycle from boom to bust. Also, the
time period is relatively recent and having lived through it we have a solid understanding of
the prevailing dynamics in the market, which allows us to better interpret the results.
6.4.3 Data
The data used in the study was obtained from the Factset database. Factset is a division of
Reuters, a leading provider of high quality and reliable information analytics to the global
investment community.
6.4.4 Stock Screening and Selection Process
We wanted to screen for factors that were relevant to future share priee performance
based on an analysis of existing academic research and our own investment experience. The
research highlighted in previous sections of this report indicates that share priees are in part
driven by underlying expectations for growth and profitability over the long term. There is
further evidence than improving profitability is viewed positively and that ail things being
equal (growth and profitability) the market appreciates above an average payout yield. Our
stock looks at 5 factors;

59
• EBITDA growth in the current year
• EBITDA growth next year
• Absolute retum on equity (ROE)
• Improving ROE
• Payout yield (dividend plus net share buyback)
Each company receives either a "0" or a "1" for each factor. A "1" is a positive signal
and means the company passes the hurdle that particular factor (screen). The results of the
five factors are added up to create a score for each company that ranges from 0 to 5 (perfect
score).
For the rising ROE we look at the absolute level and assign a "1" if ROE is expected to
rise in the current year. For the absolute ROE and the two EBITDA growth factors we assign
a "1" if the company's results are equal to or greater than 70% of the median result for the
market. 70% is used as the cut-off factor in order to obtain a sufficient number of companies
to build a portfolio. A more stringent % requirement resulted in an insufficient number of
companies qualifying for the portfolio.
We look at EBITDA growth in arder to capture core operating growth and because il is a
close approximation of cash flow. Since we are screening for payout yield also we want to
avoid companies that are simply increasing EPS through share repurchases, which may not
be sustainable if core growth is anemic. We are looking for profitable companies that are
growing and allocating capital efficiently.
The payout yield factor is viewed as key controlling factor and what differentiates the
model from many other models. To receive a score of "1" a company's payout yield must be
at least 1.5x the market median. We do not run any valuation screens (i.e. PIE, PIE etc ... ),
but rather the payout yield will act as a de-facto valuation control for the portfolio.

60
6.4.5 Use of Median
We have a large number of companies in the screen and to avoid the impact of outlier
results we found the median to be a more suitable comparison factor than the simple average,
although in most cases they are quite close.
6.4.6 Portfolio Construction and Rebalancing
In order for a company to pass the screen and be included in the portfolio a stock must
achieve a score of "5" meaning it passes the filter for ail five factors that we screen for. The
portfolio is rebalanced on a quarterly basis using the actual data and consensus estimates
available at that particular time. Thus, this removes the possible influence of survivorship
bias from the results. Potential "torpedo" stocks such as Emon, Nortel and WorldCom could
have potentially passed the filter and hindered perfOlmance. The fact that only data available
at the time is being used increases the robustness of the mode!. The rebalancing process does
not include transaction costs, but the goal is to keep turnover low, thus we run the screen at
the end of each quarter. The model assumes the exiting stocks and those stocks about to enter
the portfolio are bought and sold at the closing price at quarter end. A sample output of the
screening process can be seen in the chart below. Out of the approximately 900 stocks in the
screen a list of stock that passed each filter are shown. Ali these companies would be
included in the portfolio. In total 79 companies have qualified for the portfolio (as of June 30,
2007). The stocks in the portfolio are equal weighted.

61
Exhibit 6.8 Sample of companies from the 5-Factor Screen (June 30, 2007)
By sector 70% NA market Sereen Type
MEAN AIl mkt 17 434.76 MEDIAN Ali mkt 65G2.21
MEAN 27 343.39 Grealsr Grealer Grealer Grootor Grosler MEDIAN 14949.75 0 6.13 9.78 8.27 13.46
1500); 70%. 70°/, 70°/,)J Dlv+BB jEBITDA 91 EBITDA 91 ROE 1 Tickor 1 Nomo SDctor Market CaD isina RD LTM yld 2007 2008 2007 CCL" Carnlvol Corp. Consumer Discretionary 38 723.38 1 1 1 5 DLTR" Dollsr Troo Stores Ine. Consumer Discrelionary 4 340.35 , , , 1 1 5 KSS'" Kohl's Corp. Consumer Discrotionary 22 799.63 1 , , , , 5 MAR" Morrlott International Ine. Consumer Discretjonary 16841.98 , , , 1 1 5 MHP'" McGrl!lw-HlII Cos. Consumer Discretionary 24 097.52 , , , , , 5 ODP" OHlco Dopot lnc. Consumer DiSctellonory 8374.90 1 , 1 , , 5 ROST" Ros& Storos Ine. Consumer Discr9tionary 4292.17 1 , 1 1 , 5 "SJR.B" Shaw Communications Inc. (CI Bl Consumar Discrslionary 9676.68 , , 1 1 , 5
, , 1 Scoro J
, , , ,TIF" Tiffany & Co. Consumar Discrstionary 7209.53 1 5 VIA" Vltlcom Inc. (CI A) Consumer Discrslionary 28837.12 , , 1 1 , 5 , ,VIA.S" Vlacom Inc. (CI B) Cons umar Discrslionary 28857.92 , 1 , 5 WEN" Wondy's Internallonallnc. Consumer Discrolionary 3517.12 , 1 1 1 , 5 WYN" Wyndhom Worldwldo Corp. Consumer Discralionary 6904.53 , 1 1 1 1 5,AVP" Avon Produ cts Inc. Consumer Slapl&S 16217.77 1 , 1 , 5 KO' Coca~Cola Co. Consumer Slaplos 121 254.59 , 1 1 1 1 5 MKC" McCormlck & Co. Inc. Consumer Staple.s 4 987.22 1 1 1 1 1 5 CAM" Camoron International Corp. Energy 8025.34 1 1 1 1 1 5 "COS.U" Canadlan 011 Sand. Trust Energy 1 1 1 1 1 5 GSF" GlobolSontaFo Corp. Energy 16651.48 1 1 1 1 1 5 NE' Noble Corp. Energy 13125.41 1 1 1 1 1 5 RIO" Tronsocean Inc. Energy 30994.33 1 1 1 1 1 5 WFT" Wsotherlord International Ltd. Energy 18 769.95 1 1 1 1 1 5 AXP' Amorlcon E)(press Co. Finenciels 73354.83 1 1 1 1 1 5 AMP" Ameuipriso Flnanclallnc. Flnancials 15345.25 1 1 , , , 5 SCHW" Charles Schwab Corp. Financials 25961.63 , , , 1 , 5 EV' Eolon Vance Corp. Finenciels 5585.92 , , , 1 , 5 FlI" Fedoratod Inveslors Inc. Finencials 3981.10 , , , , , 5 FI TB" Flfth Thlrd Boncorp FlnanclBls 22122.17 , , , 1 , 5 FHN" Flrat Horizon National Corp. Financials 4869.77 , , , , , 5 ·GWO'" Great~Wosl L1feco Inc. Financials 30 789.29 , , , , , 5 "IGM" IGM Flnonclollnc. Financials 13712.11 , , , , , 5 JPM" JPMorgan Chaso & Co. Financials 187718.60 , , , ,, , , 1 5 "MFC" Monullfo Flnonclal Corp. Financials 61 632.48 1 1 MER" Morrill Lynch & Co. Inc. Finencials 72 270.27 , , 1 , 1
55
'PWF" Powor Flnanclal Corp. Financials 28509.71 , 1 , , ,, , , , , 5 PA.U" Prudontlal Flnanclallnc. Financlals 46000.00 5 'SLF' Sun Llfe Flnonclallnc. Financlals 29034.72 , 1 , , 1 5 WM' Was.hlngton Mutuol Inc. Financials 40 272.59 , , , , 1 5 WFC" Wolls Fargo & Co. Flnancials 118774.36 1 , , 1 1 5 WSH" Willls Group Holdings. Ltd. Financials 6 741.30 1 1 1 1 1 5 BMY" Brl$tol~Myor6 Squlbb Co. HeaHh Cate 61920.72 1 1 1 1 1 5 ESRX" E.pras$ Scripts lnc. Health Care 13567.71 1 1 1 1 1 5 HNT" Heolth Net Inc Heal1h Core 5907.00 1 , 1 1 1 5 LW Labora1ory Corp. of Amerlco Holdl Health Coro 9563.37 1 1 1 1 1 5 MCK" McKos.on Corp. Heal1h Cere 17593.80 1 1 1 1 1 5 MHS" Medco Health Solutlons Inc. HeDlth Core 22496.09 1 1 1 1 1 5 MOT" Medtronlc Ine. HeaHh Cere 59297.11 1 1 1 1 , 5 UNH" UnltedHealth Group Inc. Heallh Care 68783.29 , , 1 1 ,, , , , 5 CHRW" C.H. Roblnaon Worldwlde Inc. InduslnaLs 9067.95 1 5 HON" Honoywollintornatlonai Inc. Induslrials 45057.29 , , 1 1 1 5 MAN" Mtlnpower Inc. Induslrlals 7 846.86 , , , 1 1 , , 5 PLL" Pull Corp. Industrials 5618.05 1 1 1 5 SPW" SPX Corp. Indus trials 5160.24 , , 1 , , 5 TXP Te.tron Inc. Induslrials 13829.35 , 1 1 1 , 5 UTX" Unltod Tochnologlos Corp. Induslrials 70625.00 , 1 , 1 1 5 GWW" W.W. Gralnger Inc. Industriels 7822.49 , , , 1 , 5 A' Agllont Technologlos Inc. Information Technology 15683.52 , , , 1 , 5 CEN" Corldl.n Corp. Information Technology 4 916.99 , , , 1 , 5 DBD" Olobold Inc. Informalion Technology 3424.09 , 1 , 1 , 5 EBAY" eBay Inc. Informelion Technology 44038.7' , , 1 , , 5 EMC" EMC Corp. Informalion Technology 38414.34 , 1 1 1 , 5 INTC" Intol Corp. Informalion Tochnology 136884.30 , , 1 1 , 5 NTAP" Network Appllanco Inc. Informalion Technology 10713.61 , 1 , 1 1 5 PAYX" Puychox Inc. Informalion Technology 14949.75 1 1 1 , 1 5 STX" Sellgllie Technology lnc. Information Technology 12538.39 1 1 1 , 1 5 SNPS" Synopsya Inc. Informalion Tochnology 3715.21 1 1 1 1 1 5 VCLK" ValueCllck Ine. Informalion Tochnology 2928.72 1 1 1 1 1 5 VSEA" Varlan SemÎconducior Equlpment Informalion Tochnology 3113.47 1 1 1 1 1 5 XLNX" Xlllnx tnc. Informallon Tachnology 7921.30 1 1 1 1 1 5 APD' Air Producls & Chemlcals lnc. Malenals 17 460.43 1 1 1 , 1 5 ECL" Ecolub Inc. Malarials 10 732.08 1 1 1 1 , 5 PX' Proxolr Inc. Malarials 23098.77 , , , 1 , 5 SEP Sealed Air Corp. Malarials 5004.46 , , , 1 , 5 SON" Sonoco Products Co. Malerlals 4 304.55 , , , 1 , 5 vZ' Vorlzon Communications Inc. Telecommunication ServIces 1'9 866.67 , , 1 , , 5 AEE' Ameren Corp. Utililies 10125.47 , , , , , 5 ETR" Entergy Corp. Utililies 21 756.38 , , , , NFO" NaUonal FUQI Gas Co. Utilities 3612.17 , , , 1, , 5
5
PGN" Progre8s Energy Inc. Utililies 11671.04 , , , 1 1 5 XEL" Xcol Enorgy /nc. Utilities 8 337.37 , , , 1 1 5

62
6.5 Results of Study
The results of the back-test were quite encouraging as the portfolio outperformed the
benchmark over the course of the experiment.
6.5.1 Portfolio Performance versus Benchmark Performance
Over the 6.5 year duration of the experiment the portfolio's cumulative retum was
81.05% versus the benchmark's return of 34.40%. The cumulative value added (alpha) was
46.65%. The best quarter relative to the benchmark was QI '01 with 12.63% of
outperformance. The worst quarter was Q3'06 with a relative underperformance of -2.69%.
The best rolling 12-month period generated an outperformance of 20.63%, while the poorest
rolling 12-month period saw -2.80 of underperformance.
Usually when investors think of payout yield they assume a defensive portfolio that does
weil in down markets, but then lags in up markets. This is not the case here as the payout
yield acts as a control on valuation, but what the screening process really captures is growth
and profitability (momentum characteristics also strong). We were particularly interested to
discover that the portfolio not only keep up with the market during the rally that began
Q2 '03, but continued to outperform.
The beta of the portfolio averaged 0.82 and once again rose throughout the experiment as
the bull market gained momentum. It appears that the screen captures momentum, which
allows it to keep pace with the market during rallies.

63
Exhibit 6.9 Performance Summary
#sloek PF Bela
Q1 '01 21
0.67
Q2'01 23
057
Q3'01 28
050
Q4 '01 31
0.65
Q1 '02 31
0.85
Q2 '02 36
0.82
Q3 '02 31
0.61
Q4 '02 40
086
Q1 '03 32
088
Q2 '03 31
074
Q3 '03 32
071
Q4 '03 35
085
PF pert Beneh pert Diff
0.55 ·1207 12.63
4.17 5.82 -1.65
·9.11 -14.68 5.57
12.81 989 2.92
599 022 5.77
·7.61 -1399 638
·1376 -1738 3.62
1094 8.49 2.45
-2.16 ·2.82 067
17.73 15.56 2.18
3.46 2.64 081
18.46 1228 617
PF pert Lasl12 mth Bench pert Last 12 mlh Diff Lasl12 mlh
8.43 ·11.03 19.46
13.87 1.26 12.60
209 -18.55 20.63
-2.57 ·21.25 1868
·4.43 ·22.65 18.21
-1258 -25.69 13.11
12.76 3.85 891
29.98 23.87 611
37.49 27.66 983
PF pert sinee Ine. Bench sinee Ine Diff sinee Ine.
055 ·12.07 12.63
472 -6.25 1097
-438 ·2093 16.54
8.43 ·11.03 19.46
14.42 -1081 25.23
681 -2480 31.61
-695 -42.17 3523
4.00 ·33.68 37.68
184 -3651 3835
1957 -2095 40.52
2303 ·1830 41.34
41.49 -6.02 47.51
#stock PF Bela
Q1 '04 35
1.07
Q2 '04 35
0.90
Q3 '04 45
0.82
Q4 '04 38
076
Q1 '05 31
0.67
Q2 '05 36
068
Q3 '05 47
0.81
Q4 '05 31
0.88
Q1 '06 34
0.88
Q2 '06 42
1.07
Q3 '06 57
1.05
Q4 '06 44
102
Q1 '07 55
101
Q2 '071 71
099
Avg 37
0.82
PF pert Beneh pert Diff
-028 1.35 -1.64
0.56 1.37 -082
-0.87 -1.53 0.66
1136 9.43 1.93
-1.27 -1.85 0.58
-019 1.56 -175
3.45 437 -0.92
2.91 2.23 068
584 4.28 1.56
·258 -158 -100
225 494 -2.691
807 6.62 1.45
0.49 1.05 -0.55
983 8.17 1.66
312 1.32 1.79
PF pert Last 12 mth Beneh pert Last 12 mlh Diff Lasl12 mlh
3936 31.84 753
22.19 17.65 453
17.86 13.48 438
1076 10.62 0.14
977 7.42 2.35
903 7.61 1.42
1335 13.51 -016
489 631 ·1.41
12.01 12.44 -0.43
9.62 931 031
8.42 988 ·1.46
13.58
1
14.27 ·069
8.23 11.03 ·2.80
20.64 2078 -0 14
12.38 6.24 6.14
PI" pert sinee Ine Beneh sinee Ine. Diff sinee Ine.
. 41.20 -4.67 4587
4176 -3.29 4506
4089 -4.83 45.72
52.25 460
47.65
50.98 276
48.22
5079 4.31
46.48
54.24 8.68 45.55
5714 10.91 4623
62.99 15.19 4719
60.41 1362 4679
6266 1856 44.10
7073 2518 45.54
71.22 26.23 4499
81.05 34.40 46.65

64
~l ~~
6.5.2 Portfolio Payout Yield
The portfolio's initial payout yield was skewed towards buybacks as we were in the last
stages of the bull market. Buybacks were actually more important than dividends. As the
economy soured and the stock market declined sharply from 2000 to 2002 the balance
between dividends and buybacks tilted back towards dividends. The majority of the payout
yield came from dividends in the 2001 to 2003 time period.
As the economy and the financial markets gained momentum in 2003 and throughout
2004 we start to see a shift in the composition of the payout yield as share buybacks make a
comeback. The dividend yield remains fairly steady throughout the process, but it is the share
buybacks that tend to vary depending on what phase of the economic cycle we are in. The

65
peak in terms of buybaeks oeeurs in 2006 when buybacks are 2 times to 3 times greater than
the dividend component.
The foeus on the total payout (dividends plus buybacks) allows the portfolio to adapt to
the CUITent market conditions. In bear markets the screen tilts towards "safer" companies with
dividends, while in the bull market phase the screen captures those companies that are doing
weil, generating excess cash and using that exeess cash to buy back shares, which is
something the market likes.
The dividend buyback split also aets as a sort of market gauge. A very low dividend
component signaIs a potential peak in the market, while extremely low buybacks signal a
potential trough in the overall market. What is interesting is that the screen adjusts weil to the
changing macro-eeonomic dynamics eapturing the momentum of the market weil.

66
Exhibit 6.10 Portfolio Payout Yield Summary
MEAN" Dividend LTM + Repurchase
7.0 ----~-------------
6.0 1
4.0 - ~ - 1-------------------,=,--1 --. ~- - 1·-
3.0
::+-...e..__~ ..I-.._e..__L,-~-r'- --..,....L,-A.-,-I__...~-1ï__.-----._..._e..__L..-._-..._Ie..__-IL.,_I~__...--I"_r_"....,.,I__..._.., 12-2000 12-2001 12·2002 12-2003 12-2004 12-2005 12-2006
• PORTFOLIO DIV LTM DPORTFOLIO BB
MSCI North America" Dividend LTM + Buybacks
7.0,----------------------------------
6.0 t---------------------------------
5.0 t--------------------------------- 4.0 +-----------------------------------
30 t-----------------------------=-----
2.0 +-----..,...,----.......--\o-l--L~..(_.,_,__n__r,._;.,-- - - 1- t- f- t- t-
R ~ i- I- 1.0 011 1'1 0.0 +-f........ i'-'-,AI..LL...................... 'La...,..L.L...........,....L..,-I""-r.Cl =1[
12-2000 12-2001 12-2002 12-2003 12-2004 12·2005 12-2006
1!I MSCI NORTH AMERICA DIV 0 MSC/ NORTH AMERICA BB
6.S.3 Importance of Overall Portfolio Characteristics
It is extremely important to monitor the overall portfolio characteristics through the
experiment. I1's like the health check-up of the process. If we can consistently put together a
portfolio of stocks that as a group have superior characteristics to the market, then we stand a
reasonable chance of outperfonning the reference index over the long-tenn. ft is important
for the portfolio to have superior growth characteristics, above average profitability and a
higher payout yield compared to the index. The characteristics of the virtual portfolio
displayed these characteristics. Sales, EBITDA and EPS growth were consistently better than

67
the market average. The quality of the portfolio was strong with an above average ROE. The
dividend was basically in-line, but the payout yield was superior. Thus, the three key
elements were ail in place - growth, profitability and payout. Other important characteristics
were also in place including a lower debt profile than the market (in terms of net debt to
EBITDA), lower valuation (in terms of PIE and EVIEBITDA) and superior momentum
characteristics.

68
Exhibit 6.11 Portfolio Characteristics Compared to the Benchmark r---------"-"-"-----'--'-"-'--'-----"----"] r"-"-"--'----'---'----'--"-"-"-"-'---" : Q~un : : VALUATION : t-"-"-"-"-"-"-"-"-"-"-"-"-"-"-"-"1 t"-"-"-"-"-"-"-"-"-"-"-"-"-"-"1 ,
pfmodif MSCI NA modlf premium 1dise i pfmodif MSCI NA modlf premium 1dise i MEAN MEDIAN MEAN MEDIAN' MEAN MEDIAN. MEAN MEDIAN MEAN MEDIAN MEAN MEDIAN,.
Market Cap 43497 22278 21806 10110 995% 120.4%1 PIE 1 EV 68908 25641 33507 12502 105.7% 105.1%· LTM 20.64 20.21 2251 19.80 -8.3% 2.1 % '
NDI EBITDA NTM 0.69 0.68 1.21 0.79 -42.8% -14.0'1'1 NTM 17.47 17.18 1990 17.27 -12.2% -0.5%i ROE 2007 18.97 18.65 21.56 18.55 -12.0% 0.5%:
LTM 22.92 20.72 17.38 15.81 31.9% 31.0%1 2008 16.35 15.90 18.49 1609 -11.6% -1.2%1 NTM 23.60 21.30 17.68 16.22 33.4% 31.3%: 2009 14.43 1439 16.60 14.64 -13.1% -1.7%: 2007 24.12 22.59 17.87 16.43 35.0% 37.5%1 PEG NTM 1.47 1.40 2.02 1.47 -27.0% -5.0%1 2008 23.47 20.95 17.58 16.19 33.5% 29.4%: EVIEBITDA 2009 23.26 20.00 17.93 15.99 29.8% 25.1 %! LTM '1.61 10.80 11.42 10.48 1.7% 3.0%!
Divyield • NTM 9.98 9.59 10.21 9.33 -2.3% 2.7%i LTM 1.36 1.09 1.48 0.96 -8.3% 12.9%! 2007 1096 10.24 11.00 1002 -0.4% 2.2%, NTM 1.53 1.18 1.54 1.04 -0.4% 13.1%j 2008 9.37 908 9.57 8.91 ·2.2% 1.9%i 2007 1.42 1.13 1.52 1.01 ·6.2% 12.0%. 2009 8.22 8.10 8.56 7.95 -4.0% 1.9%: 2008 1.63 1.24 1.58 110 2.6% 123'1'1 EV/Sales 1 2009 1.66 1.26 1.54 0.91 7.4% 39.0%: LTM 291 2.33 3.28 2.57 -11.4% -93%:
L.. _ .. _~i~~.~ _. ~2.3.. _. ~:2.0.. _.. ~~~ _.• .!,;~~_ .2.9~ !!,_ .1.0l~!'! NTM 258 2.16 299 2.33 -14.3% -7.1%1 2007 278 2.36 3.13 2.44 -11.2% -3.1%:
Total Retum 2008 2.42 2.02 2.86 222 -15.4% -8.9%1 lmonth -1.13 -1.46 -1.72 -1.94 -34.4% -24.7% 2009 2.10 1.90 2.64 2.06 -20.4% -8.0%: 3 month 8.01 697 5.85 5.06 36.8% 37.6% P/B 1
1year 25.96 20.09 21.92 18.15 18.4% 10.7% LTM 3.85 4.07 3.25 3.17 18.5% 28.3%i 3year 78.86 6233 75.07 54.45 51% 14.5% NTM 3.63 3.68 3.05 291 18.8% 26.3%, 5year 141.36 122.24 172.14 102.44 -17.9% 19.3% 2007 3.78 3.95 3.14 304 20.1% 30.0%j
2008 3.42 3.31 2.84 2.62 20.6% 26.4%.
L.. _ ~9~ .. ];1.5_ •• .1;9.4__ • _ ~Tl_ .._?;43, •• _. !f!:.0:~ _ ••2..!.?:~
r-~.- ... _ .... - ... _ .... _ •. _ .... _ •• _ •• - •• _ •• _. -_ .... _ ... _ ... - .... , (' .. _.. _..._.. _.. - .. _... _.. _.. _.. _.. - ..._.. _.. _.. , , GROWTH • • MOMENTUM '
pfmodlf MSCI NA modlf premlum 1dise pfmodlf MSCI NA modlf premium / dise MEAN MEDIAN MEAN MEDIAN MEAN MEDIAN MEAN MEblAN MEAN MEDIAN MEAN MEDIAN
EPSg EPS 3mth rev NTM 17.82 15.45 12.58 12.14 41.7% 27.2% LTM 559 4.56 3.58 2.82 56.2% 61.7% 2007 21.21 16.31 10.60 10.94 100.0% 49.1% NTM 6.10 5.68 3.58 3.63 70.5% 56.7% 2008 15.79 13.78 14.79 13.30 6.8% 3.5% 2007 2.14 1.65 -0.66 0.48 -425.6% 239.8% 2009 13.50 13.63 12.35 11.91 9.3% 14.4% 2008 2.62 1.82 0.55 0.70 377.6% 160.0%
3Yr avg 17.11 15.21 12.50 12.12 37.0% 25.4% EBITDA 3mth rev EPS LTG 15.01 12.48 14.02 12.50 7.1% -0.2% LTM 2.82 2.44 1.57 1.47 79.3% 65.8%
EBITDA 9 NTM 2.60 2.69 1.56 1.71 66.7% 57.8% NTM 15.61 13.64 12.67 10.56 23.2% 29.2% 2007 1.11 0.83 -1.29 -0.16 -1860% -637.1% 2007 19.04 14.31 12.02 10.69 58.4% 33.8% 2008 1.55 1.13 0.31 0.32 392.3% 248.0% 2008 1300 12.06 14.13 10.37 ·8.0% 16.2% SALES 3mth rev 2009 9.36 8.77 975 8.68 -4.0% 1.0% LTM 3.45 258 2.34 200 47.7% 28.8%
3Yr avg 1430 13.07 12.21 10.25 17.1% 27.5% NTM 3.39 2.91 2.19 2.05 54.8% 42.0% SALES 9 2007 092 0.76 0.18 0.16 421.5% 387.6%
NTM 11.21 8.50 838 7.19 33.7% 18.3% 2008 1.31 098 0.43 0.28 208.4% 248.0% 2007 12.64 9.54 9.11 7.89 38.8% 20.9% 2008 9.69 8.21 8.17 7.11 18.7% 15.5% 2009 8.32 6.88 7.04 6.37 18.1% 8.1%
3Yr avg 10.48 8.91 8.12 7.03 29.0% 26.8%

69
WEAN Il Dividend Yield mod WEAN JI Pnce 1Eamlngs mod
3.50 ~.OO
3.00 - l~OO 1-- - A
30.00 1-- -A- --6----IlOt- - -- - 6
1\.00 lA -16-A1.00 AAAAAAAAAAA 2000
1\.00 1.00
10110 1
050 - - - - \00 f
1.50
i~ 1 ·-I~I~ll1
0110 0110 1
11·11XX1 11·1001 11·1001 11·1003 11·1110I 12·1110\ I1-lllli 11·2000 12·200\ 12·1001 11·1003 12·1110I 11·1001 12-1roi
_llll C=llfrW 4 No<llAirèn:3 _llll t=JIITW 4 HIll\Airèn:3
WEAN JI ROE mod
3O'OOr---------------- -
1\.001--------
Note: LTM -Iast twelve months (actual results), NTM - next twelve months (expected results
bases on analyst forecasts).

CONCLUSION
The relevance of accounting-based research and fundamental analysis has been questioned
numerous times through the years, but just when it seems like the future importance of
fundamental analysis is in serious doubt a new crisis emerges that highlights: 1) the
importance of this work and 2) the potential rewards from an analysis grounded in the logic
of the financial statements. This time around it is the credit crisis that has shown us that
fundamental accounting-based analysis is relevant.
One of the key elements of the investment process is financial statement analysis and
fundamental analysis such as looking at margin trends, leverage analysis, asset quality, and
cash flow. In essence investors need to look at anything that can provide insight into the
sustainability of current performance.
Throughout the essay we have highlighted numerous studies have shown that investors can
earn abnormal returns (generate alpha) through the use of fundamental analysis of financial
statements. These abnormal gains are made possible by the fact that the financial markets do
not correctly discount ail the information available in the financial statements (Desai,
Krishnanurthy and Venkaturaman 2007) and because the built-in assumptions about future
results are often erroneous. There tends to be a time-lag prior to adjustment that allows
traders to put in place arbitrage trades that eventually close the information gap. For example
Desai, Krishnanurthy and Venkaturaman found that short sellers targeted firms with high
sales growth and high accruals because this is a potential sign that current performance is not
sustainable into the future. The current mortgage-related crisis provides further evidence of
this. Several hedge funds put in place negative "bets" on the mortgage market starting in
2005 and 2006 after carefully analyzing the balance sheets of mortgage lenders and housing
market data. While these trades eventually proved to be extremely profitable in some cases

71
the investors needed to be very patient and wait up to two years for certain mortgage-related
equities ta collapse. It took sorne time, but eventually the information gap was closed.
We often asked, what is the role of accounting-based research in relation to the equity
markets and more precisely to share priee valuations? We strongly believe accounting
research can play an important role. Moreover this is an area with great public and private
interest, thus the profile of accounting researchers can benefit from providing high quality
and relevant research to the marketplace.
Bauman (1996) believes fundamental analysis involves an assessment of a firm's value
(without reference to the actual priee), activities and prospects through published financial
reports, as weil as other sources of information. Given that financial statements are one of the
primary tools and perhaps the most important source of information used in fundamental
analysis that is better placed to analyze financial statements than accounting researchers?
Articles by Bali & Brown and Beaver are generally regarded as tuming points in the history
of accounting research. Post 1968 research has tilted towards empiricism, has been deemed
normative and follows the positive line of thought as apposed to the prescriptive and
descriptive approaches that dominated the literature prior to 1970 (Gaffikin, 2007). The
systematic use of empirical data was facilitated by the widespread availability of financial
databases along with easier access ta more and more powerful computers that made number
crunching easy allowed a myriad of theories to be tested in much less time than was the case
in prior generations(Gaffikin, 2007). The backbone of this research was the Efficient Market
Hypothesis (EMH), developed by Fama and French that hypothesizes that security priees
reflect ail available information.
The Efficient Market Hypothesis (EMH) role as the foundation of capital markets research in
accounting has weakened in recent years. It remains the starting point of most discussions,
but the endgame has proven to be very diverse. Over the long haul the market and individual
stocks ultimately move towards fair value, but this process can take extended periods of time
and the fair value scenario may only hold up for short periods of time as the market
overshoots to both the upside and then subsequently to the downside. Given that securities

72
only spend a relatively short period time at true fair value levels the opportunity for alpha
generating strategies exists and can be successfully employed by practitioners. As the
arguments in favor of efficient markets weaken the idea of a rational investor properly
processing a11 value-relevant information has also come under increased criticism as
information asymmetry and irrational behavior are quite common in the financial markets.
Generating alpha on a consistent basis remains a difficult task, but it can and has been done.
While accounting information and fundamental analysis is often brushed aside as being
boring and irrelevant the truth is that for a boring topic accounting research sure does
generate a lot of interest and the impact of things like fundamental analysis and accounting
rule changes can have significant impacts on the equity markets (i.e. fair value). The
controversy surrounding the analysis of accounting information and its impact on equity
markets is unlikely to go away anytime soon, thus ample opportunities for research in this
area remain. The backers of the efficient market hypothesis believe the output of fundamental
analysis is already in the share price, but ironica11y there is a huge demand for any profitable
trading strategies derived from fundamental analysis. Briginshaw (2004) suggests that
fundamental analysis is in essence an attempt to list stocks from most to least preferred.
Historically, research in this area has focused on the informational perspective of accounting
and the traditional valuation models such as the dividend discount mode!. The fundamental
analysis school of thought believes a firm's value can be derived through financial statement
analysis. Stocks are believed to deviate from their true fundamental value, sometimes for
extended periods of time, but eventually the price moves back to its fundamental value. Ou
& Penman (1989) believe an analysis of published financial statements can uncover
mispriced stocks and that investment strategies can be derived using the fundamental
information in financial statements.
Bali and Brown's seminal 1968 study built upon existing research in finance and econornics,
which focused on fundamental analysis of which studying financial statements was a key
element. Bail and Brown (1968) tried to identify the usefulness or importance of accounting
information for the security markets and the subsequent impact on security prices (Gaffikin,

73
2007). What infOlmation moves share prices and what infolmation is useful in identifying
future stock movements.
Most researchers and market participants have changed their point of view regarding the
efficient market hypothesis (EMH) concept developed by Fama. According to Lee (2001),
stock prices do not adjust to information instantly, but rather price converges toward
fundamental value through time as various types of traders (both sophisticated and non
sophisticated) act on pieces of available information. The presence of anomalies such as
post-announcement drift and the interpretation of accruals once again cali into question the
efficiency of the capital markets. Lee believes accounting research has a golden opportunity
to add value in this type of environment.
Bird et al. suggest the availability of information (Jack of information asymmetry) and the
existence of a large number of rational, profit maximizing investors are necessary to the
concept of efficiency. The increasing popularity of index funds has lead to greater than 25%
of funds in many developed equity markets being managed in this manner. Add to this the
closet indexers, momentum investors and technical investors and we have a signi ficant
percentage of the market that is not relying on fundamental analysis. Therefore these types
of investors are not helping the price discovery process, but rather are trading on noise.
In recent years George Soros has become one of the most outspoken critics of the efficient
markets hypothesis and has railed against the trends towards deregulation that have increased
risk across the marketplace. Soros argues that the theory that markets always move towards
equilibrium is a flawed theory that has lead us dangerously close to the edge of a disaster,
especially given the amount of leverage and the mind-numbingly complicated nature of many
modem financial instruments. Soros believes that rather than rational behavior a vicious two
way feedback loop that he calls reflexivity has evolved around misjudgments and
misconceptions that can influence market priees for extended periods oftime.
Naturally as questions about the validity of the efficient markets hypothesis gained
momentum a quest for new theories and potential explanations has ensued. Amongst some of
the more interesting theories is the idea of the market as complex adaptive system brought

74
forward by Maboussin. According to Maboussin (2002), the markets can be described as a
complex adaptive system dominated by potentially irrational participants operating with
incomplete information and relying on various decision rules. Maboussin believes that
efficient markets theory were a good starting point in past years, but now the stream of
research and thought needs to move forward. Rather than criticize efficient market theory it
needs to be viewed as a natural historical process and should be used as one of the building
block of current theories. While the efficient market hypothesis has served us weil Maboussin
believes the current evidence know longer supports the theory and it does stand up to the
available empirical evidence given that numerous researchers have discovered tradable
anomalies. An adaptive process of efficiency is in place.
The argument is far from over as McKinsey, the very influential consulting firm, continues to
support the efficient market theory. McKinsey believes that white irrational behaviour can
influence stocks in the short-term, ultimately the fundamentals prevail. ROE, growth and free
cash flow drive long-term value with the market paying up for higher retums and higher
growth. Mckinsey believes in efficient markets, but acknowledges swings caused by
emotions exist. "Market-wide price deviations are short-lived; over the past few decades, the
market corrected itself within a few years to price levels consistent with econonùc
fundamentals."
Finally, we concluded the essay with a discussion of the findings from an equity screening
process we set up over a 6 and a half year time frame. A hypothetical equity portfolio was
created and run from December 30, 2000 through June 30, 2007. The portfolio was
developed around the idea that the market rewards growth, profitability and that keeping
these factors constant a higher payout yield could only improve the results. The results are a
portfolio that significantly outperfonned in a down market, while keeping pace with the
market during rallies. The virtual results were encouraging and the information collected
during the experiment was eventually used as the framework behind the investment process
that is being used to manage a real investment portfolio as of September 2008.
The market price of a stock is based on expectations of future growth and profitability, which
are based on internai characteristics (past performance, product range, and management' s
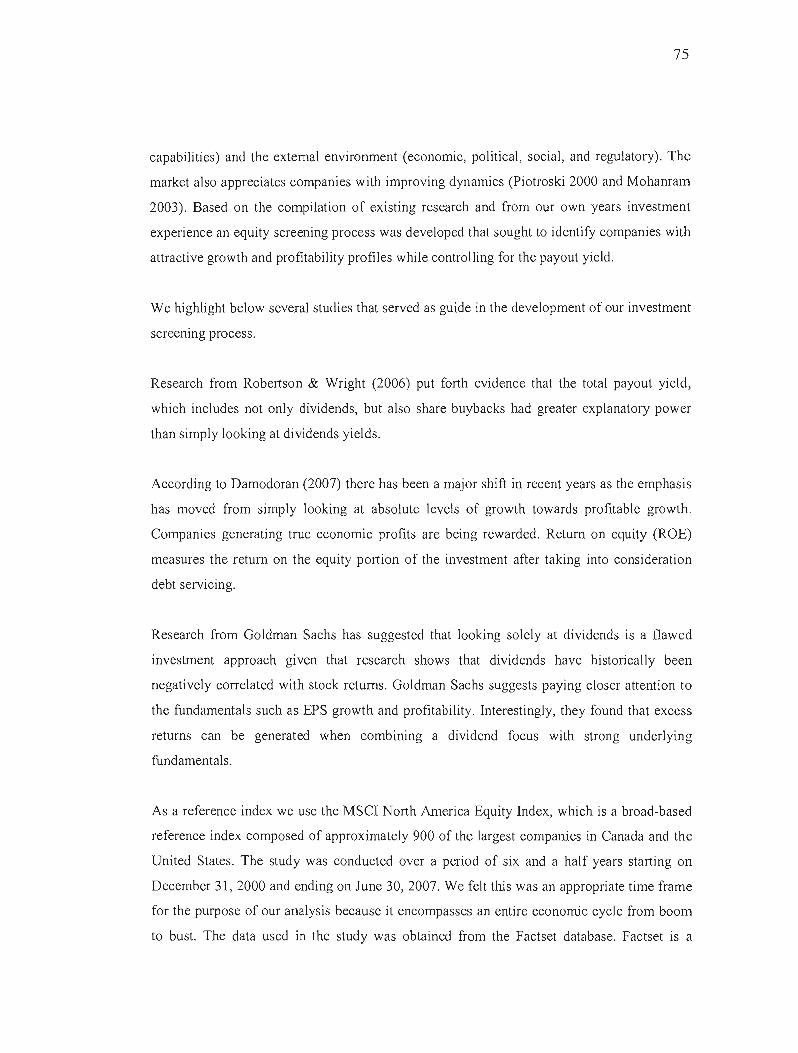
75
capabilities) and the extemal environrnent (economic, political, social, and regulatory). The
market also appreciates companies with improving dynamics (Piotroski 2000 and Mohanram
2003). Based on the compilation of existing research and from our own years investment
experience an equity screening process was developed that sought to identify companies with
attractive growth and profitability profiles while controlling for the payout yield.
We highlight below several studies that served as guide in the development of our investment
screenmg process.
Research from Robertson & Wright (2006) put forth evidence that the total payout yield,
which includes not only dividends, but also share buybacks had greater explanatory power
than simply looking at dividends yields.
According to Damodoran (2007) there has been a major shift in recent years as the emphasis
has moved from simply looking at absolute levels of growth towards profitable growth.
Companies generating true economic profits are being rewarded. Return on eguity (ROE)
measures the retum on the equity portion of the investment after taking into consideration
debt servicing.
Research from Goldman Sachs has suggested that looking solely at dividends is a flawed
investment approach given that research shows that dividends have historically been
negatively correlated with stock retums. Goldman Sachs suggests paying closer attention to
the fundamentals such as EPS growth and profitability. Interestingly, they found that excess
retums can be generated when combining a dividend focus with strong underlying
fundamentals.
As a reference index we use the MSCI North America Equity Index, which is a broad-based
reference index composed of approximately 900 of the largest companies in Canada and the
United States. The study was conducted over a period of six and a half years starting on
December 31,2000 and ending on June 30, 2007. We felt this was an appropria te time frame
for the purpose of our analysis because it encompasses an entire economic cycle from boom
to bust. The data used in the study was obtained from the Factset database. Factset is a

76
division of Reuters, a leading provider of information analytics to the global investment
community.
The actual stock screening and security selection process was based on factors derived from
our own experience and supported by the academic research previously cited. There is
evidence that an analysis method based on future growth expectations and profitability is able
to highlight attractive investment ideas. AIso, aH things being equal (growth and profitability)
the equity markets appear to appreciate an above average payout yield. The stock screen
examines 5 factors;
• EBITDA growth in the current year
• EBITDA growth next year
• Absolute return on equity (ROE)
• Improving ROE
• Payout yield (dividend plus net share buyback)
The resu1ts of the experiment were positive and the virtual portfolio outperformed the
benclunark throughout the studied time frame. For the entire 6.5 year duration of the
experiment the portfolio's cumulative return was 81.05% versus the benclunark's return of
34.40%. The portfolio screen naturally shifted the emphasis from buybacks to dividends
within the payout yield as the economy moved from a weak economic state to a steady period
economic expansion. In order to be successful the portfolio need to have a strong
combination of growth, profitability and payout yield versus the market. The characteristics
of the virtual portfolio displayed these characteristics. Sales, EBITDA and EPS growth were
consistently better than the market average. The quality of the portfolio was strong with an
above average ROE. The dividend was basically in-line, but the payout yield was superior.
Thus, the three key elements were a11 in place - growth, profitability and payout. Other
important characteristics were also in place including a lower debt profile than the market (in
terms of net debt to EBITDA), lower valuation (in terms of PIE and EV/EBITDA) and
superior momentum characteristics.

77
The results of the experiment were encouraging and allowed us to move forward with the
project, which we discuss in the annexe. The experiment has also allowed us to demonstrate
that even with a relatively simple premise we were able to put together a portfolio of stocks
that consistently outperfonned the market throughout an entire economic cycle. While there
is no guarantee that this particular set of screens will work going forward it nonetheless
provides evidence that the development of alpha generating trading strategies is possible.
These strategies will always work indefinitely over time because once a strategy becomes
widely known arbitrage opportunities dirninish, but this may take several years. A good
example of this is the carnage in the hedge fund sector in 2007 and 2008 as many funds were
employing the same strategies. As these strategies were forced to be unwound it created a
negative spiral effect that has hurt the entire industry. Nonetheless, a strategy that can work
weil for a few years until the arbitrage opportunity is eliminated is still interesting and
highlights that the market takes time to move towards efficiency.
While liquidity and risk premiums also play a role in determining value, we do not address
risk premiums and liquidity in our study as we are trying to identify the relative wi!U1ers
within the market versus a specifie benchmark and not the absolu te winners.
In conclusion, accounting research, financial statements and fundamental analysis are very
important parts of the priee discovery process that drives the world's financial markets. As
long as the financial markets exist there will be opportunities to exploit investment
opportunities through the use of fundamental analysis.

APPENDICE A
The investment concept and the information we obtained during the experiment was used as
the framework for the investment philosophy and process used to manage a US Mutual Fund.
Following the encouraging results obtained from the back test a "virtual" fund was created
and managed from July 1, 2007 through August 31, 2008. The virtual fund tried as much as
possible to simulate real life conditions, which included ail transactions being booked on our
internai systems with fictitious transaction costs applied. The green light for the real fund was
given during the summer of '08 and we took over management of a US mutual fund on
September 1,2008.
The real fund differs from the experiment in that the 5-factor screen is used in the initial step
of a bottom-up investment process. Thus the screen is a source of idea generation. The factors
used remain the same although sorne modifications to the approach have been made. The
screens are now run on a sector by sector basis in order to generate ideas for sector. Please
see the chart below for a quick overview of the current investment process.

t"j ~ =------3-5lage InvestmenlProcess------ g..... ~ ....
1" Idea Generation j FllI1damenlal Analysis 1 POOf~io Construction 11 1
-= -< (l>
3 'Il
(l>
.....='"0
Invesbnenl Universe , , Id r "'l o ea genera 10/1 (l>Fundamenlal analysis ) I( Seleclion COOlmittee (")
'Il
1 ---- 'Il~~L850USslocks 1 ~ ~ 1
1
Long·lisl ShC(j·lisl Portfolio1 1
ll.1
ConslHIIer SlapIes, • 1
Discl!fiooMy, Energy 1 r 1 8Ot0120slocks 1 1 50 10 75 slocks 1 1 40 to 60 stocks-Finaocials,lOOuslrials
Triggerrepxis_l<1ni>gy, 1 ( _ .....,... )
PO!lful~'lfuimMateria~, T~ecom, Utiliües on grOll1h, PIOIila:iIy!ld payou1 ( ....""1""",••", ~ IC
~e . Cl~,iocalionandllllllion. Ris~coolnil
'- ..... __ ..... ,.- 1
Risk Conlr~: seclor conslraints (abs~ule +1· 5%), maximum weighl per posilion (5%)
Seclor analysis: Induslry roadmaps, idenl~ cyclical and secular Irends,lhemalic analysis, currenl issues
\0 -..l

BIBLIOGRAPHY
Allen, F. and Carletti, E. (2006). "Mark-to-Market Accounting and Liquidity Pricing," CFS Working Paper Series 2006117, Center for Financial Studies. Available at SSRN: http://ssrn.com/abstract=919900
Abarbanell, J. and Bushee, B.J. (1997). "Fundamental Analysis, Future Earnings, and Stock Priees", Journal of Accounting Research, Vol 35, No l, Spring 1997. Available at SSRN: http://ssrn.com/abstract=2827
Adrian, T. and Shin, H.S. (2008). "Liquidity and Leverage", FRB of New York Staff Report, May 2008, No. 328. Available at SSRN: http://ssrn.com/abstract=1139857
Amott, R.D. and Asness, C.S. (2001). "Does Dividend Policy Foretell Earnings Growth?", Available at SSRN: http://ssm.com/abstract=295974 or DOl: 10.2139/ssrn.295974
Azagury, J. (2007). "How To Achieve High Perfonnance", Public Utilities Fortnightly, September 2001, pp. 60-65.
Barth, M.E., Beaver, W.H. and Landsman, W.R. (2001). "The Relevance of the Value Relevance Literatme For Financial Accounting Standard Setting: Another View(January 2001)", JAE Rochester Conference April 2000. Available at SSRN: http://ssm.com/abstract=246861 or DOl: 10.2139/ssm.246861
Bauman, M. P. (1996). "A Review of Fundamental Analysis Research in. Accounting", Journal of Accounting Literature, Vol. 15, pp. 1-33.
Boudoukh, J., Michae1y, R., Richardson, M.P. and Roberts, M.R. (2007). "On the Importance of Measuring Payout Yield: Implications for Empirical Asset Pricing", Journal of Finance, Vol. LXII, No. 2, April 2007. Available at SSRN: http://ssm.com/abstract=88081 0 or DOl: 10.2139/ssm.480171
Briginshaw, 1. (2004). "The Effect of Changing Valuation Parameters on Abnonnal Returns from a Fundamental Analysis Strategy", Working paper, University of California, Berkeley, 2004.
Chen, P.F. and Zhang, G. (2007). "How Do Accounting Variables Explain Stock Priee Movements? Theory and Evidence.", Journal of Accounting and Economies, 2007; HKUST Business School Research Paper No. 07-02. Available at SSRN: http://ssrn.com/abstract=977678

81
Collins, D.W. and Hribar, P. (2000). "Earnings-Based and Accrual-Based Market Anomalies: One Effect or Two?", Journal of Accounting & Economics, vol 29, 2000,101-124. Available at SSRN: http://ssrn.com/abstract=166455 or DOl: 10.2139/ssm.166455
Cohen, AJ. (2003). "Dividends and equity investing under the new tax law: focus on company performance, not dividends", Goldman Sachs Accounting Research.
Damodaran, A. (2007). "Return on Capital (ROC), Return on Invested Capital (ROIe) and Return on Equity (ROE): Measurement and Implications". Available at SSRN: http://ssrn.com/abstract=1105499
Davies, P.J. (2008). "Insight: True impact of mark-to-market on the credit crisis", Financial Times, February 282008.
Desai, H., Srinivasan K. and Kumar V. (2007). 'The role of fundamental analysis in information arbitrage: Evidence from short seller recommendations", Working paper, South Methodist University.
Distribution of Stock Market Returns. http://en.wikipedia.org/wiki/Stock_market_crash
Dobbs R., Rehm W., (2005). "The value of share buybacks", McKinsey on Finance Vo116, Summer 2005.
Egan, W.J. (2007). "The Distribution ofS&P 500 Index Returns". Available at SSRN: http://ssrn.com/abstract=955639
Gaffikin, M. (2007) "Accounting Research and Theory: The age of neo-empiricism," Australasian Accounting Business and Finance Journal: Vol. 1: Iss. l, Article 1.
Gustavo, Grullon, Roni and Michaely (2002). "Dividends, Share Repurchases, and the Substitution Hypothesis", Journal of Finance, American Finance Association, vol. 57(4), pages 1649-1684,08.
Gode, D.K. and Ohlson, lA. (2006). "A Unified Valuation Framework for Dividends, Free Cash Flows, Residua1 Income, and Earnings Growth Based Models". Available at SSRN: http://ssrn.com/abstract=884310
Harris, T., and Nissim, D. (2004). "Convergence trends for profitability and payout." Working Paper, Columbia University.
He, T., Bird, R.G., Thosar, S. and Woolley, P. (2004) "The Case for Market lnefficiency: Investment Style and Market Pricing", EFMA 2004 Basel Meetings Paper. Avai1able at SSRN: http://ssm.com/abstract=495704
Hirshleifer, D.A., Hou, K., Teoh, S.H. and Zhang, y. (2004). "Do Investors Overvalue Firms With B10ated Balance Sheets?", EFA 2004 Maastricht Meetings Paper No. 3233; Dice Center Working Paper No. 2004-18. Avai1able at SSRN: http://ssrn.com/abstract=404120
82
Jing. L. and Ohlson, J.A. (2000). "The Feltham-Ohlson (1995) Model: Empirical implications", Journal of Accounting, Auditing & Finance; Summer2000, Vol. 15 Issue 3, p321-331.
Johnson, W.B. and Schwartz Jr., W.c. (2000). "Evidence that Capital Markets Learn from Academic Research: Earnings Surprises and the Persistence of Post-Announcement Drift", Available at SSRN: http://ssm.com/abstract=255603 or DOl: 10.2139/ssm.255603
Kamstra, M. (2003). "Pricing Firms on the Basis of Fundamentals", Federal reserve Bank of America, Economic review, First Quarter 2003, p. 49-69.
Koller, T., Goedhart, M., and Wesse1s, D. (2005). "Valuation: Measuring and Managing the Value of Companies", John Wiley & Sons, Fourth Edition, McKinsey.
Kothari, S.P. (2001). "Capital Markets Research in Accounting", Journal of Accounting & Economics, Vol. 31, Nos. 1-3, September 2001. Avai1able at SSRN: http://ssm.com/abstract=286653
Lee, C.M. (1999). "Accounting-Based Valuation: Impact on Business Practices and Research", Accounting Horizons, Vol. 13, No. 4, December 1999, p. 413-425.
Lee, C.M. (2001). "Market Efficiency and Accounting Research: A Discussion of 'Capital Market Research in Accounting' by S.P. Kothari", JAE Rochester Conference April 2000. Available at SSRN: http://ssrn.com/abstract=258495 or DOl: 10.2139/ssm.258495
Levitt, A., (1998). "The Numbers Game", (September 1998), http://www.sec.gov/news/speech/speecharchive/1998/spch220.txt
Li, S. (2003). "Applying financia1 statement ana1ysis to forecast earnings growth and eva1uate PIE ratios.", University of Columbia, working paper.
Mauboussin, M. (2006). "C1ear Thinking About Share repurchases", Legg Mason Capital Management, January 10, 2006.
Mauboussin, M.J. (2002). "Revisiting Market Efficiency: The Stock Market as a Complex Adaptive System", Journal of Applied Corporate Finance, Volume 14, No. 4 - Winter 2002, pp. 8-16.
Miller, M. and F. Modigliani (1961). "Dividend Policy, Growth, and the Valuation of Shares." Journal of Business, Vol. 34: 411-433.
Mohamam, P. (2005), "Separating Winners from Losers among Low Book-to-Market Stocks usingFinancial Statement Analysis", Review of Accounting Studies (10), 133-170.Availab1e at SSRN: http://ssm.com/abstract=403180 or DOl: 10.2139/ssrnA03180

83
Mohanram P. (2003). "Is Fundamental Analysis Effective for Growth Stocks?", Stem School of Business Working Paper.
Nelson, D.E. (2008). "Legg Mason value Fund Monthly Commentary as of March 31 2008".
Nissim, D., Penrnan, S.H. (2001). "Ratio Analysis and Equity Valuation: From Research to Practice", Review of Accounting Studies, Vol. 6, No. l, pp.109-154.
Oded, J. and Michel, A. (2008). "Stock repurchases and the EPS Enhancement Fallacy", Financial Analysts Journal, July/August 2008, Vol. 64, No. 4, pp. 62-75.
Ohlson, J.A. (1995). "Earnings, Book Values and Dividends in Equity Valuation", Contemporary Accounting Research, Spring 1995, Vol. Il, No. 2, pp. 661-687.
Ou, J.A. and Penrnan, S.H. (1989). "Financia1 statement analysis and the prediction of stock returns", Journal of Accounting and Economies, Vol. Il, July, pp. 295-329.
Patgiri, R., Massa, M., Gaspar, lM., Matos, P.P. and Rehman, Z. (2005). "Can Buybacks be a Product of Shorter Shareholder Horizons?", AFA 2005 Philadelphia Meetings Paper; EFA 2005 Moscow Meetings Paper. Available at SSRN: http://ssm.com/abstract=649482
Penrnan, S.H. (1992). "Return to fundamenta1s", Journal of Accounting Auditing and Finance, Vol. 4, No.7, pp.465-83.
Penman, S.H. (2003). "The Quality ofFinancial Statements: Perspectives from the Recent Stock Market Bubb1e", Accounting Horizons, Supplement, Vol. 17, pp. 77-96. Availab1e at SSRN: http://ssrn.com/abstract=319262 or DOl: 10.2139/ssrn.319262
Penrnan, S. H. (2007). 'Financial Reporting Quality: is fair value a plus or a minus?' Accounting and Business Research, Vo.37, Special Issue: 33-44.
Piotroski, lD. (2000). "Value investing: The use ofhistorical financial statement information to separate winners from losers", Journal of Accounting Research 38, 1-41. Available at SSRN: http://ssrn.com/abstract=249455
Plantin, G., Sapra, H. and Shin, H.S. (2005). "Marking to Market, Liquidity, and Financial Stability", Monetary and Economie Studies, 2005, 23(S 1), pp. 133-55. Available at SSRN: http://ssm.com/abstract=1186342
Plantin, G., Sapra, H. and Shin, H.S. (2007). "Marking to Market: Panacea or Pandora's Box?", Journal of Accounting Research, Vol. 46, No. 2, pp. 435-460, 2008. Available at SSRN: http://ssrn.com/abstract=1186362
Reflexivi ty. http://en.wikipedia.org/wikilReflexivity_%28social_theory%29
Robertson, D. And Wright, S. (2006). "Dividends, Total Cash Flow To Shareholders, and Predictive return Regressions", The Review of Economies and Statistics, February 2006.

84
Russell J.1. (1999). "Reporting on the Past: A New Approach to Improving Accounting� Today", Accounting Horizons, December 1999, pp. 315-322. Available at SSRN:� http://ssrn.comiabstract=lSS30S or DOl: 10.2139/ssrn.1SS30S� Soros, G. (200S). "Soros Lambastes Market Theory, Says It Created Super Bubble",� Bloomber Newswire, April 4, 200S.�
Weston, J.F., and Juan A.S. (2003). "Changing Motives for Share Repurchases", University� ofCalifomia, Los Angeles, Anderson Graduate School of Management, Finance, Paper 3-03.� Zion, D., Varshney, A. and Comett, C. (200S). "Focusing on Fair Value", Credit Suisse�
Accounting Research, June 7, 200S.�