l41: advanced operating systems - university of cambridge · l41: advanced operating systems...
TRANSCRIPT

L41: Advanced Operating SystemsThrough tracing, analysis, and experimentation
L41 Lecture 1Dr Graeme Jenkinson
21 January 2019

Getting started
• What is an operating system?• Operating systems research• About the L41 module• Laboratory reports• Kernel tracing with DTrace• The probe effect• The kernel: Just a C program?• A little on kernel dynamics: How work happens
L41 Lecture 1 - Advanced Operating Systems

What is an operating system?
(Whiteboarding exercise)
L41 Lecture 1 - Advanced Operating Systems

What is an operating system?
[An OS is] low-level software that supportsa computer’s basic functions, such as
scheduling tasks and controlling peripherals.- Google hive mind
L41 Lecture 1 - Advanced Operating Systems

General-purpose operating systems… are for general-purpose computers:• Servers, workstations, mobile devices• Run applications – i.e., software unknown at design time• Abstract the hardware, provide ‘class libraries’• E.g., Windows, Mac OS X, Android, iOS, Linux, BSD, …
L41 Lecture 1 - Advanced Operating Systems
Userspace Local and remote shells, management tools, daemonsRun-time linker, system libraries, logging and tracing facilities
– system-call layer –
Kernel System calls, hypercalls, remote procedure call (RPC)*Processes, filesystems, IPC, sockets, managementDrivers, packets/blocks, protocols, tracing, virtualisationVM, malloc, linker, scheduler, threads, timers, tasks, locks
* Continuing disagreement on whether distributed-filesystemservers and window systems ‘belong’ in userspace or the kernel

Other kinds of operating systemsSpecialise the OS for a specific application or environment:• Embedded, real-time operating systems
• Serve a single application in a specific context• E.g., WiFi access points, medical devices, washing machines, cars• Small code footprint, real-time scheduling• Might have virtual memory / process model• Microkernels or single-address space: VxWorks, RTEMS, L4• Now also: Linux, BSD (sometimes over a real-time kernel), etc.
• Appliance operating systems• Apply embedded model to higher-level devices/applications• File storage appliances, routers, firewalls, ...• E.g., Juniper JunOS, Cisco IOS, NetApp OnTap, EMC/Isilon• Under the hood, almost always Linux, BSD, etc.
Key concept: Operating system as a reusable componentL41 Lecture 1 - Advanced Operating Systems
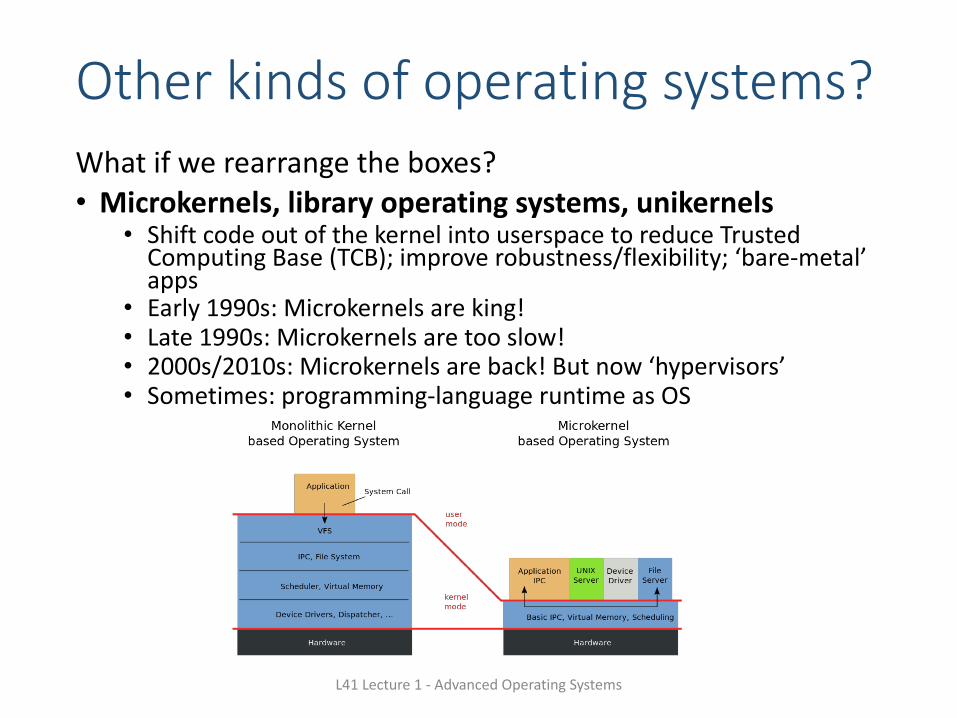
Other kinds of operating systems?What if we rearrange the boxes?• Microkernels, library operating systems, unikernels
• Shift code out of the kernel into userspace to reduce Trusted Computing Base (TCB); improve robustness/flexibility; ‘bare-metal’ apps
• Early 1990s: Microkernels are king!• Late 1990s: Microkernels are too slow!• 2000s/2010s: Microkernels are back! But now ‘hypervisors’• Sometimes: programming-language runtime as OS
L41 Lecture 1 - Advanced Operating Systems

Other kinds of operating systems?
• Hypervisors• Kernels host applications; hypervisors host virtual
machines• Virtualised hardware interface rather than POSIX• Paravirtualisation reintroduces OS-like interfaces for
performance• A lot of microkernel ideas have found a home here• E.g., System/370, VMware, Xen, KVM, VirtualBox, bhyve,
...• Containers• Host OS as hypervisor, but using the process model• Really more about code/ABI (Application Binary
Interface) distribution and maintenanceL41 Lecture 1 - Advanced Operating Systems

What does an operating system do?
• Key hardware-software surface• Low-level abstractions and services
• Operational model: bootstrap, shutdown, watchdogs• Process model, IPC: processes, threads, IPC, program model• Resource sharing: scheduling, multiplexing, virtualisation• I/O: drivers, local/distributed filesystems, network stack• Security: authentication, encryption, ACLs, MAC, audit• Local or remote access: console, window system, SSH• Libraries: math, protocols, RPC, crypto, UI, multimedia• Monitoring/debugging: logs, profiling, tracing, debugging
Compiler? Text editor? E-mail package? Web browser? Can an operating system be “distributed”?
L41 Lecture 1 - Advanced Operating Systems

Why study operating systems?
The OS plays a central role in whole-system design when building efficient, effective, and secure systems:• Strong influence on whole-system performance• Critical foundation for computer security• Exciting programming techniques, algorithms, problems
• Virtual memory; network stack; filesystem; run-time linker; …
• Co-evolves with platforms, applications, users• Multiple active research communities• Reusable techniques for building complex systems• Boatloads of fun (best text adventure ever)
L41 Lecture 1 - Advanced Operating Systems

Where is the OS research?A sub-genre of systems research:• Evolving hardware-software interfaces
• New computation models/architectures• New kinds of peripheral devices
• Integration with programming languages and runtimes• Concurrent/parallel programming models; scheduling• Security and virtualisation• Networking, storage, and distributed systems• Tracing and debugging techniques• Formal modeling and verification• As a platform for other research – e.g., mobile systemsVenues: SOSP, OSDI; ATC; EuroSys; HotOS; FAST; NSDI; HotNets; ASPLOS; USENIX Sec.; ACM CCS; IEEE SSP; …
L41 Lecture 1 - Advanced Operating Systems

What are the research questions?Just a few examples: By changing the OS, can I…• Create new abstractions for new hardware?• Make my application run faster by…
• Better masking latency?• Using parallelism more effectively?• Exploiting new storage mediums?• Adopting distributed-system ideas in local systems?
• Make my application more {reliable, energy efficient}• Limit {security, privacy} impact of exploited programs?• Use new language/analysis techniques in new ways?Systems research focuses on evaluation with respect to applications or workloads: How can we measure whether it is {faster, better, ...}?
L41 Lecture 1 - Advanced Operating Systems
Teaching operating systems
• Two common teaching tropes:• Trial by fire: in micro, recreate classic elements of operating
systems: microkernels with processes, filesystems, etc.• Research readings course: read, present, discuss, and write
about classic works in systems research• This module adopts elements of both styles while:
• mitigating the risk of OS kernel hacking in a short course• working on real-world systems rather than toys; and• targeting research skills not just operating-system design
• Trace and analyse real systems driven by specially crafted benchmarks• Possible only because of recent developments in
tracing and hardware-based performance analysis tools
L41 Lecture 1 - Advanced Operating Systems

Aims of the module (1/2)
Teaching methodology, skills, and knowledgerequired to understand and perform research on contemporary operating systems by…• Employing systems methodology and practice• Exploring real-world systems artefacts through
performance and functional evaluation/analysis• Developing scientific writing skills• Reading selected original systems research papers
L41 Lecture 1 - Advanced Operating Systems

Aims of the module (2/2)On completion of this module, students should:• Have an understanding of high-level OS kernel
structure. • Gained insight into hardware-software interactions
for compute and I/O.• Have practical skills in system tracing and
performance analysis.• Have been exposed to research ideas in system
structure and behaviour.• Have learned how to write systems-style
performance evaluations. L41 Lecture 1 - Advanced Operating Systems

PrerequisitesWe will take for granted:• High-level knowledge of OS terminology from an
undergraduate course (or equivalent); e.g.,:• What schedulers do• What processes are … and how they differ from threads• What Inter-Process Communication (IPC) does• How might a simple filesystem might work
• Reasonable fluency in reading multithreaded C• Working knowledge of Python (or R)• Comfort with the UNIX command-line environment• Undergraduate skills with statistics
(mean/median/mode/stddev/t-tests/linear regression/boxplots/scatterplots ... )
You can pick up some of this as you go (e.g., IPC, Python, t-tests), but will struggle if you are missing several
L41 Lecture 1 - Advanced Operating Systems

Module structure –four complementary strands• 3x two-hour lectures in FS09
• Theory, methodology, architecture, and practice• 5x two-hour labs in SW02
• Start with 10-20-minute lecturelets on artefacts, practical skills• Remainder on hands-on measurement and experimentation – learn
skills required to write assigned lab reports, start on experiments• Lab experimental questions must be answered in your lab reports
• Assigned research and applied readings• Selected portions of module texts – learn skills, methodology• Historic and contemporary research papers – research exposure
• Marked lab reports• Based on experiments done in (and out) of scheduled labs• Refine scientific writing style suitable for systems research• One ‘practice run’ marked but not assessed ß not optional!• Two assessed; 50% of final mark each
L41 Lecture 1 - Advanced Operating Systems
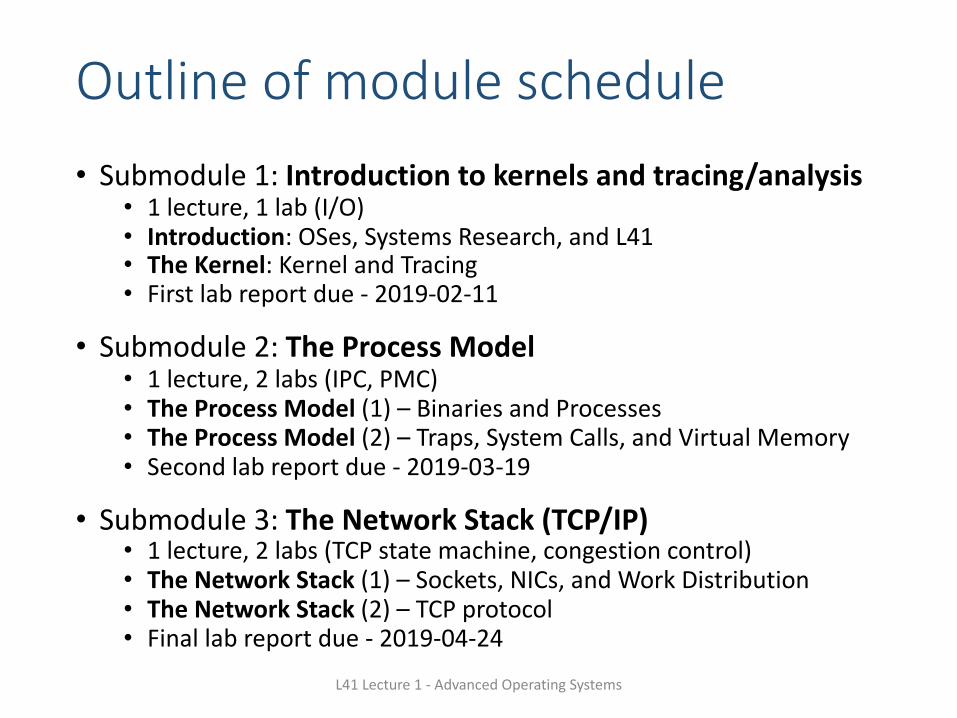
Outline of module schedule• Submodule 1: Introduction to kernels and tracing/analysis
• 1 lecture, 1 lab (I/O)• Introduction: OSes, Systems Research, and L41• The Kernel: Kernel and Tracing• First lab report due - 2019-02-11
• Submodule 2: The Process Model• 1 lecture, 2 labs (IPC, PMC)• The Process Model (1) – Binaries and Processes• The Process Model (2) – Traps, System Calls, and Virtual Memory• Second lab report due - 2019-03-19
• Submodule 3: The Network Stack (TCP/IP)• 1 lecture, 2 labs (TCP state machine, congestion control)• The Network Stack (1) – Sockets, NICs, and Work Distribution• The Network Stack (2) – TCP protocol• Final lab report due - 2019-04-24
L41 Lecture 1 - Advanced Operating Systems

The platformTI BeagleBone Black• 1GHz ARM Cortex-A8 32-
bit CPU• Superscalar pipeline,
MMU, L1/L2 caches• FreeBSD operating
system (13-CURRENT) + DTrace• Bespoke “potted
benchmarks”• Jupyter notebook
measurement and analysis environment
L41 Lecture 1 - Advanced Operating Systems

Labs and lab reportsLab reports document an experiment and analyse its results – typically using one or more hypotheses.Our lab reports will contain the following sections (see notes, template):
L41 Lecture 1 - Advanced Operating Systems
Some formats break out (e.g.) experimental setup vs. methodology, and results vs. discussion. The combined format seems to work better for systems experimentation as compared to (e.g.) biology.• The target length is 10 pages excluding appendices, references• Over-length reports will be assessed within page limit• Appendices may not be read if too long, and should not be
essential to understanding the core content of the report
1. Title + abstract (1 page) 5. Conclusion (1-2 para)
2. Introduction (1-2 para) 6. References
3. Experimental setup and methodology (1-2 pages)
7. Appendices
4. Results and discussion (3-4 pages)

Module texts – core materialYou will need to make frequent reference to these books both in the labs and outside of the classroom:
Operating systems: Marshall Kirk McKusick, George V. Neville-Neil, and Robert N. M. Watson, The Design and Implementation of the FreeBSD Operating System, 2nd Edition, Pearson Education, Boston, MA, USA, September 2014.
Performance measurement: Raj Jain, The Art of Computer Systems Performance Analysis: Techniques for Experimental Design, Measurement, Simulation, and Modeling, Wiley - Interscience, New York, NY, USA, April 1991.
Tracing and profiling: Brendan Gregg and Jim Mauro, DTrace: Dynamic Tracing in Oracle Solaris, Mac OS X and FreeBSD, Prentice Hall Press, Upper Saddle River, NJ, USA, April 2011.
L41 Lecture 1 - Advanced Operating Systems

Module texts – additional materialIf your OS recollections feel a bit hazy:
Operating systems: Abraham Silberschatz, Peter Baer Galvin, and Greg GagneOperating System Concepts, Eighth Edition, John Wiley & Sons, Inc., New York, NY, USA, July 2008.
If you want to learn a bit more about architecture and measurement:
Performance measurement and diagnosis: Brendan Gregg, Systems Performance: Enterprise and the Cloud, Prentice Hall Press, Upper Saddle River, NJ, USA, October 2013.
L41 Lecture 1 - Advanced Operating Systems

Dynamic tracing with DTrace• Bryan M. Cantrill, Michael W. Shapiro, and Adam H.
Leventhal. Dynamic Instrumentation of Production Systems, USENIX ATC 2004.• “Facility for dynamic instrumentation of production systems”
• Unified and safe instrumentation of kernel and user space
• Zero probe effect when not enabled
• Dozens of providers representing different trace mechanisms
• Tens (hundreds?) of thousands of instrumentation probes• D language: C-like scripting language with predicates, actions• Scalar variables, thread-local variables, associative arrays
• Data aggregation and speculative tracing• Solaris, Mac OS X, FreeBSD; Linux + Windows modules
• Wide influence – e.g., on Linux SystemTap, eBPF
• Our tool of choice in this course23L41 Lecture 1 - Advanced Operating Systems

DTrace scripts• Human-facing, C-like D Programming Language• One or more {probe name, predicate, action} tuples• Expression limited to control side effects (e.g., no loops)• Specified on command line or via a .d file
24
Probe name Identifies the probe(s) to instrument; wildcards allowed; identifies the provider and provider-specific probe name
Predicate Filters cases where action will execute
Action Describes tracing operations
fbt::malloc:entry /execname == "csh"/ { trace(arg0); }
Probe name Predicate Action
L41 Lecture 1 - Advanced Operating Systems

Some FreeBSD DTrace providers• Providers represent data sources – instrumentation types:
• Apparent duplication: FBT vs. event-class providers?• Efficiency, expressivity, interface stability, portability
25
Provider Descriptioncallout_execute Timer-driven “callout” event probes
dtmalloc Kernel malloc()/free()
dtrace DTrace script events (BEGIN, END)
fbt Function Boundary Tracing (function prologues, epilogues)
io Block I/O read/write
ip,udp,tcp,sctp TCP/IP events
lockstat Kernel locking primitives
proc,sched Kernel process, scheduling primitives
profile Profiling timers
syscall System-call entry/return
vfs Virtual File System operations
L41 Lecture 1 - Advanced Operating Systems

Tracing kernel malloc() calls• Trace first argument to kernel malloc() for csh• NB: Captures both successful and failed allocations
26
# dtrace -n'fbt::malloc:entry /execname=="csh"/ { trace(arg0); }'
Probe Use FBT to instrument malloc() function prologue
Predicate Limit actions to processes executing csh
Action Trace the first argument (arg0)
CPU ID FUNCTION:NAME0 8408 malloc:entry 640 8408 malloc:entry 27480 8408 malloc:entry 480 8408 malloc:entry 392
^C
L41 Lecture 1 - Advanced Operating Systems

Aggregations – summarising traces• Aggregations allow early, efficient reduction• Scalable multicore implementations (i.e., commutative)
27
Aggregation Descriptioncount() Number of times calledsum() Sum of argumentsavg() Average of argumentsmin() Minimum of argumentsmax() Maximum of argumentsstddev() Standard deviation of argumentslquantize() Linear frequency distribution (histogram)quantize() Log frequency distribution (histogram)
@variable = function(.. args ..);printa(@variable)
L41 Lecture 1 - Advanced Operating Systems

Profiling kernel malloc() calls by csh
28
fbt::malloc:entry/execname=="csh"/{ @traces[stack()] = count(); }
Probe Use FBT to instrument malloc() function prologue
Predicate Limit actions to processes executing csh
Action Keys of associative array are stack traces (stack()); values are aggregated counters (count())
^Ckernel`mallockernel`fork1+0x14b4kernel`sys_vfork+0x2ckernel`swi_handler+0x6a8kernel`swi_exitkernel`swi_exit
3...
L41 Lecture 1 - Advanced Operating Systems

D Intermediate Format (DIF)
29
# dtrace –Sn'fbt::malloc:entry /execname == "csh"/ { trace(arg0); }'
DIFO 0x0x8047d2320 returns D type (integer) (size 4)OFF OPCODE INSTRUCTION00: 29011801 ldgs DT_VAR(280), %r1 ! DT_VAR(280) = "execname"01: 26000102 sets DT_STRING[1], %r2 ! "csh"02: 27010200 scmp %r1, %r203: 12000006 be 604: 0e000001 mov %r0, %r105: 11000007 ba 706: 25000001 setx DT_INTEGER[0], %r1 ! 0x107: 23000001 ret %r1
NAME ID KND SCP FLAG TYPEexecname 118 scl glb r string (unknown) by ref (size 256)
Pred
icate
DIFO 0x0x8047d2390 returns D type (integer) (size 8)OFF OPCODE INSTRUCTION00: 29010601 ldgs DT_VAR(262), %r1 ! DT_VAR(262) = "arg0"01: 23000001 ret %r1
NAME ID KND SCP FLAG TYPEarg0 106 scl glb r D type (integer) (size 8)
Actio
n
L41 Lecture 1 - Advanced Operating Systems

DTrace: Implementation
30
malloc()
Kernel image
Function Boundary Tracing provider
dtmalloc provider
DTrace - probe context
dtrace_probe()
DIFinterpreter
(predicates, actions)
Buffers
Per-script, per-CPU
buffer pairs
Userdtrace
process
CPU ID FUNCTION:NAME 0 30408 malloc:entry dtrace 608 0 30408 malloc:entry dtrace 608 3 30408 malloc:entry dtrace 120 3 30408 malloc:entry dtrace 120 3 30408 malloc:entry dtrace 324 0 30408 malloc:entry intr 1232 0 30408 malloc:entry csh 64 0 30408 malloc:entry csh 3272 2 30408 malloc:entry csh 80 2 30408 malloc:entry csh 560
dtrace -n 'fbt::malloc:entry { trace(execname); trace(arg0); }'
dtrace -n 'dtmalloc::temp:malloc /execname=“csh”/ { trace(execname); trace(arg3); }'
CPU ID FUNCTION:NAME 1 54297 temp:malloc csh 1024 1 54297 temp:malloc csh 64
dtrace_ioctl()
(copyout())
Userlanddtrace
command
DTrace process DTrace output
copied out
buffer
L41 Lecture 1 - Advanced Operating Systems

The Probe Effect• The probe effect is the unintended alteration of system
behaviour that arises from measurement• Software instrumentation is active: execution is changed
• DTrace minimises probe effect when not being used…• ... but has a very significant impact when it is used• Disproportionate effect on probed events
• Potential perturbations:• Speed relative to other cores (e.g., lock hold times)• Speed relative to external events (e.g., timer ticks)• Microarchitectural effects (e.g., cache, branch predictor)
• What does this mean for us?• Don’t benchmark while running DTrace ...• ... unless measuring probe effect• Be aware that traced applications may behave differently• E.g., more timer ticks will fire, I/O will “seem faster”
31L41 Lecture 1 - Advanced Operating Systems
Probe effect example:dd(1) execution time
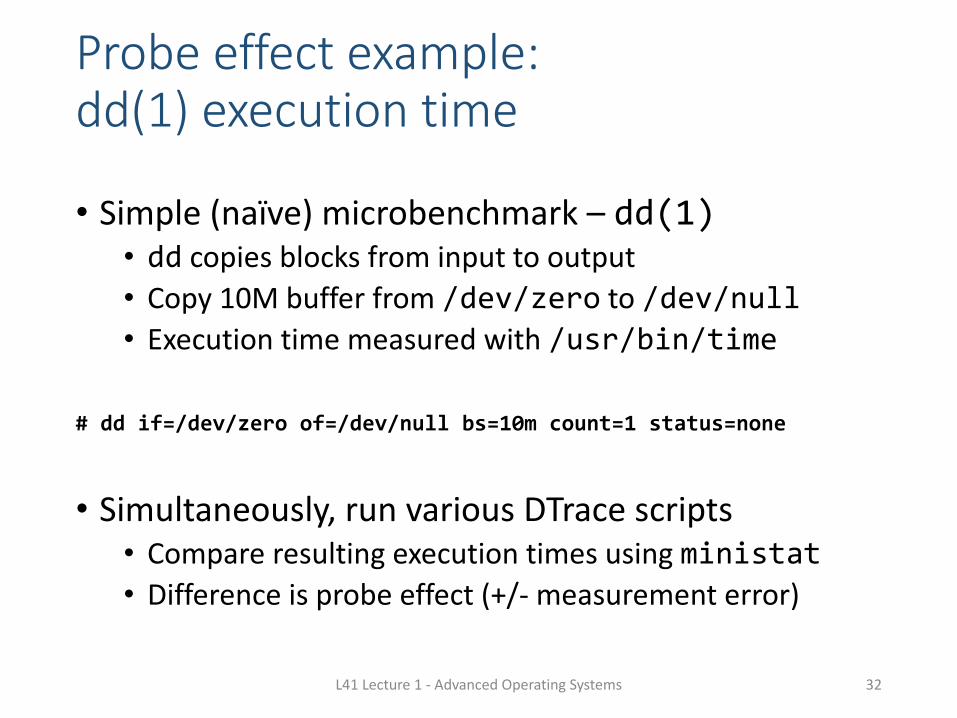
• Simple (naïve) microbenchmark – dd(1)• dd copies blocks from input to output
• Copy 10M buffer from /dev/zero to /dev/null• Execution time measured with /usr/bin/time
# dd if=/dev/zero of=/dev/null bs=10m count=1 status=none
• Simultaneously, run various DTrace scripts• Compare resulting execution times using ministat• Difference is probe effect (+/- measurement error)
32L41 Lecture 1 - Advanced Operating Systems

Probe effect 1: memory allocation• Using the dtmalloc provider, count kernel memory allocations:
33
• No statistically significant overhead at 95% confidence level
x no-dtrace+ dtmalloc-count+------------------------------------------------------------------------------+| * || * || * +||x * +||x * +||* * *|| |_______________|______A______M__________A_____|__________________| |+------------------------------------------------------------------------------+
N Min Max Median Avg Stddevx 11 0.2 0.22 0.21 0.20818182 0.0060302269+ 11 0.2 0.22 0.21 0.21272727 0.0064666979No difference proven at 95.0% confidence
dtmalloc:::{ @count = count(); }
L41 Lecture 1 - Advanced Operating Systems

Probe effect 2: locking• Using the lockstat provider, track kernel lock acquire, release:
34• 109% overhead – 170K locking operations vs. 6 malloc() calls!
x no-dtrace+ lockstat-count+------------------------------------------------------------------------------+| x +|| x +|| x + +||x x + +||x x + +||x x x + + +|| |_A_| |_A_M|+------------------------------------------------------------------------------+
N Min Max Median Avg Stddevx 11 0.2 0.22 0.21 0.20818182 0.0060302269+ 11 0.42 0.44 0.44 0.43454545 0.0068755165Difference at 95.0% confidence
0.226364 +/- 0.00575196108.734% +/- 2.76295%(Student's t, pooled s = 0.0064667)
lockstat:::{ @count = count(); }
L41 Lecture 1 - Advanced Operating Systems

Probe effect 3: limiting to dd(1)?• Limit the action to processes with the name dd:
35
• Well, crumbs. Now 168% overhead!
x no-dtrace+ lockstat-count-dd+------------------------------------------------------------------------------+| + || x + || x + || x + || x + ||x x + ||x x + ||x x x + + + +|||_A| |_A| |+------------------------------------------------------------------------------+
N Min Max Median Avg Stddevx 11 0.2 0.22 0.21 0.20818182 0.0060302269+ 11 0.54 0.57 0.56 0.55818182 0.0075075719Difference at 95.0% confidence
0.35 +/- 0.0060565168.122% +/- 2.90924%(Student's t, pooled s = 0.00680908)
lockstat::: /execname == "dd"/{ @count = count(); }
L41 Lecture 1 - Advanced Operating Systems

Probe effect 4: stack traces• Gather more locking information in action – capture call stacks:
36
x no-dtrace+ lockstat-stack* lockstat-stack-dd+------------------------------------------------------------------------------+| * || * || * || * ||xx ++ ** ||xx ++ ** ||xx + +++ ** *+||AM |_MA_|A| |+------------------------------------------------------------------------------+
N Min Max Median Avg Stddevx 11 0.2 0.22 0.21 0.20818182 0.0060302269+ 11 1.38 1.57 1.44 1.4618182 0.058449668
1.25364 +/- 0.0369572602.183% +/- 17.7524%
* 11 1.5 1.55 1.51 1.5127273 0.0142062731.30455 +/- 0.00970671626.638% +/- 4.66261%
lockstat::: { @stacks[stack()] = count(); }lockstat::: /execname == "dd"/ { @stacks[stack()] = count(); }
L41 Lecture 1 - Advanced Operating Systems

The kernel: “Just a C program”?• I claimed that the kernel was mostly “just a C program”• This is indeed mostly true, especially in higher-level subsystems
37
Userspace Kernelcrt/csu locorertld Kernel linkerShared objects Kernel modulesmain() main(), platform_start()libc libkernPOSIX threads API kthread KPIPOSIX filesystem API VFS KPIPOSIX sockets API socket KPIDTrace DTrace… …
L41 Lecture 1 - Advanced Operating Systems

The kernel: not just any C program
• Core kernel: ≈3.4M LoC in ≈6,450 files• Kernel runtime: Run-time linker, object model, scheduler,
memory allocator, threads, debugger, tracing, I/O routines, timekeeping
• Base kernel: VM, process model, IPC, VFS w/20+ filesystems, network stack (IPv4/IPv6, 802.11, ATM, …), crypto framework
• Includes roughly ≈70K lines of assembly over ≈6 architectures• Alternative C runtime – e.g., SYSINIT, curthread• Highly concurrent – really very, very concurrent• Virtual memory makes pointers .. odd• Debugging features – e.g., WITNESS lock-order verifier• Device drivers: ≈3.0M LoC in ≈3,500 files
• 415 device drivers (may support multiple devices)38L41 Lecture 1 - Advanced Operating Systems

Spelunking the kernel
• Kernel source lives in /usr/src/sys:• kern/ – core kernel features• sys/ – core kernel headers
• Useful resource: http://fxr.watson.org/39
% lsMakefile ddb/ mips/ nfs/ sys/amd64/ dev/ modules/ nfsclient/ teken/arm/ fs/ net/ nfsserver/ tools/boot/ gdb/ net80211/ nlm/ ufs/bsm/ geom/ netgraph/ ofed/ vm/cam/ gnu/ netinet/ opencrypto/ x86/cddl/ i386/ netinet6/ pc98/ xdr/compat/ isa/ netipsec/ powerpc/ xen/conf/ kern/ netnatm/ rpc/contrib/ kgssapi/ netpfil/ security/crypto/ libkern/ netsmb/ sparc64/
% ls kernMake.tags.inc kern_racct.c subr_prof.cMakefile kern_rangelock.c subr_rman.cbus_if.m kern_rctl.c subr_rtc.ccapabilities.conf kern_resource.c subr_sbuf.cclock_if.m kern_rmlock.c subr_scanf.c...
L41 Lecture 1 - Advanced Operating Systems

How work happens in the kernel• Kernel code executes concurrently in multiple threads
• User threads in the kernel (e.g., a system call)• Shared worker threads (e.g., callouts)• Subsystem worker threads (e.g., network-stack workers)• Interrupt threads (e.g., Ethernet interrupt handling)• Idle threads
40
# procstat -atPID TID COMM TDNAME CPU PRI STATE WCHAN
0 100000 kernel swapper -1 84 sleep swapin0 100006 kernel dtrace_taskq -1 84 sleep -
...10 100002 idle - -1 255 run -11 100003 intr swi3: vm 0 36 wait -11 100004 intr swi4: clock (0) -1 40 wait -11 100005 intr swi1: netisr 0 -1 28 wait -
...11 100018 intr intr16: ti_adc0 0 20 wait -11 100019 intr intr91: ti_wdt0 0 20 wait -11 100020 intr swi0: uart -1 24 wait -
...739 100064 login - -1 108 sleep wait740 100079 csh - -1 140 sleep ttyin751 100089 procstat - 0 140 run -
L41 Lecture 1 - Advanced Operating Systems

Work processing and distribution• Many operations begin with system calls in a user thread
• But may trigger work in many other threads; for example:
• Triggering a callback in an interrupt thread when I/O is complete
• Eventually writing back data to disk from the buffer cache
• Delayed transmission if TCP isn’t able to send immediately
• We will need to be careful about these things, as not all
work we are analysing will be in the obvious user thread
• Multiple mechanisms provide this asynchrony; e.g.:
41
callout Closure called after wall-clock delay
eventhandler Closure called for key global events
task Closure called .. eventually
SYSINIT Function called when module loads/unloads
* Where closure in C means: function pointer, opaque data pointer
L41 Lecture 1 - Advanced Operating Systems

For next time
• McKusick, et al. – Chapter 3
• Cantrill, et al. 2004 – full article
• Read Ellard and Seltzer, NFS Tricks and Benchmarking Traps• Skim the handout, L41: DTrace Quick Start
(available from L41 module website)
• Be prepared to try out DTrace on a real system
42L41 Lecture 1 - Advanced Operating Systems