l10g18 carrying capacity - into the...
TRANSCRIPT
Carrying Capacity – Grade Ten
1
Ohio Standards Connection:
Life Sciences Benchmark G Describe how human activities can impact the status of natural systems. Indicator 18 Describe ways that human activities can deliberately or inadvertently alter the equilibrium in ecosystems. Explain how changes in technology/biotechnology can cause significant changes, either positive or negative, in environmental quality and carrying capacity.
Lesson Summary: In this lesson students will be engaged in learning how human activities can deliberately or inadvertently alter the equilibrium of ecosystems through human behavior and/or use of technology/biotechnology that impacts environmental quality and carrying capacity. Students will engage in graphing and interpreting data about the bald eagle, beaver and yeast populations. Students will evaluate their own understanding of carrying capacity by using a radar diagram; they will use a summarizing strategy to extend their knowledge and will learn how environmental problems are identified and solved. They will become engaged in the lesson by responding to “Believe It or Not” cards. Estimated Duration: Three hours
Commentary: This lesson provides students with an opportunity to engage in a variety of minds-on and hands-on activities. Students are given a variety of situations to relate carrying capacity to real-world data on animals of Ohio. They are also challenged to evaluate environmental problems and possible solutions.
Pre-Assessment: Have the students rank their understanding of key terms and concepts related to carrying capacity by using a radar diagram, found in Attachment A, Carrying Capacity Pre-Assessment. Toward the end of the lesson they will use the same radar diagram (using a different colored ink) to monitor their growth of understanding of this content. Scoring Guideline: Provide a copy of Attachment B, Summary Sheet so that each student can record his/her understanding of each term/concept. This form will give you a good visual summary of your students’ understanding of carrying capacity. Use this information to provide intervention when necessary.
Carrying Capacity – Grade Ten
2
Post-Assessment: • Duplicate and distribute Attachment C, Carrying Capacity Post- Assessment for students
to complete. • This post-assessment has students graph deer population data and then analyze the data
by responding to questions about it. Other carrying capacity concepts are also tested. Scoring Guideline: See Attachment D, Carrying Capacity Post-Assessment Key to evaluate student responses.
Instructional Procedures: 1. Engage the students in the lesson by showing a video clip about any case study on the
results of negative human impact on natural communities/ecosystems (e.g., Exxon Valdez, California Condor, Beluga Whales).
2. Believe It or Not – Engagement Activity. Before class complete the following: • Make a set of Believe It or Not Cards. Take an index card or card stock material and
copy one of the following statements on a card with the associated number:
1. The Cuyahoga River caught fire; 2. The songs of birds are no longer heard in Guam; 3. Watch out for the bears when you are in eastern Ohio woods; 4. Genetic engineering has transferred bacteria genes into crop plants that causes the
plants to create natural pesticides; 5. Genetic engineering has contributed to the decline of the monarch butterfly; 6. Through biotechnology a terminator gene has been created; 7. In China, married couples are allowed to have only one child; 8. Phosphates in laundry detergent lead to huge fish kills in Lake Erie; 9. America has an aging population; 10. Settlement and industrialization during Ohio’s first 100 years were devastating to
Ohio’s wildlife and forests; 11. Bears, buffalo, bobcats, wolves and elk were once a part or Ohio’s landscape; 12. The miracle pesticide (DDT) lead to the near extinction of many bird species; 13. Building dams and farming practices lead to the decrease, endangerment or
extinction of many aquatic species; 14. American burying beetles have been released into Southern Ohio; 15. Golden rice contains a daffodil gene; 16. The demise of the Mayan and Easter Island cultures is believed to have resulted
from the human population exceeding the carrying capacity.
• Make sure that the number of cards is adjusted so that everyone in the class has at least one partner with the same card.
• On the black board write the following instruction: Look at the statement on your card and write in your science journal.
Carrying Capacity – Grade Ten
3
I believe the information on my card, because … or
I do not believe the information on my card because … If students do not keep science journals, have them write their statements on a sheet of paper.
• Make an overhead transparency of Attachment E, Believe It or Not Discussion Guide to help direct the follow-up discussion of the activity. Attachment F, Believe It or Not Discussion Guide Answer Key may be used to help guide discussion.
3. As the students come into class have them draw a Believe it or Not card out of a container.
4. Direct students to respond to the information on the card by addressing one of the statements above. Give the students five minutes to respond to the information on the card.
5. Have the students with the same card number find each other (i.e., #1 finds another student with a #1). Once students have found their partner, have them compare answers.
Instructional Tip: Have students research the statement on their card as a homework assignment to determine if it is true or false. 6. Lead a discussion about the information on the cards. Many of the students will know
some information about the items on the cards because of their own knowledge from television, magazines, zoos and other life experiences. Before discussing each card, one option is to have the entire class vote on whether the item on the card is true or false. If students have researched the environmental statements, they could share what they learned from their research. As the discussion continues, be sure to explain how technology and biotechnology has played a role in the human impact and the carrying capacity of the ecosystem.
Exploration Activity 1: Where Have All the Eagles Gone? 7. Distribute to each student a piece of graph paper and Attachment G, Where Have All The
Eagles Gone? 8. Have students graph and analyze data on the history of Ohio’s bald eagle population
(Attachment G, Where Have All the Eagles Gone? The data for this activity has been supplied by the Ohio Department of Natural Resources.) Data on the history of Ohio’s beaver population has been supplied in Attachment H, Beaver Data. Expand the lesson by having the students substitute the beaver data for the bald eagle data. Another option is to have half of the class use the bald eagle data and half use the beaver data.
9. After the students have completed the homework assignment, lead the class in a discussion about the interpretation of the data. Make an overhead transparency of Attachment G, Where Have All The Eagles Gone? and fill in the answers during the discussion.
Carrying Capacity – Grade Ten
4
10. As background information, read about Ohio’s bald eagle population or research bald eagle populations in other parts of the nation to enhance the class discussion. Conduct an Internet search to have other bald eagle data available to use in the discussion.
Explanation Activity 1: Yeast Population Demonstration 11. In front of the class, mix warm water (about 100-150 ml), sugar (about two teaspoons)
and yeast (about one-fourth of a package of dry yeast). Put the mixture into two test tubes. Add a few drops of bleach to one tube.
Instructional Tip: • Schedule the demonstration at the beginning of the period and have students periodically
make observations. • Be sure to wear safety goggles and follow all safety procedures. 12. Discuss with students the growth requirements of yeast (warm environment, food supply,
space, etc.). 13. Ask the students to make predictions about what is going to occur in each of the two
tubes. Have the students write their predictions in their science journal or on a piece of notebook paper. Also, have the students make a list of what they believe to be limiting factors for the yeast population in each tube.
14. Every 10 minutes, have the students make observations and record what is happening in the two tubes.
15. At the end of the period, lead the class in a discussion of what is happening to the populations in both tubes. This discussion should focus on limiting factors, carrying capacity and the introduction of human impact (as represented by the bleach) on populations. Be sure to emphasize that human impact can be both positive and negative.
Explanation Activity 2: Summarizing the Text 16. Locate information on population patterns and human impact on the environment. This
may be found in the class textbook, however it may be in different chapters. An Internet search may produce valuable background information.
17. Make a list of key vocabulary words or concepts the students should learn from the textbook pages you have selected.
18. Write three key vocabulary terms (i.e. carrying capacity, limiting factor, population) on the blackboard. Have the students read the paragraphs or pages in the textbook that contain these three key terms. Give the students a reasonable amount of time to read the text selection. After that exercise, have the students write a 30- to 50-word summary of what they have read. The number of pages read and the number of vocabulary words will determine the number of words in the summary. The summary should include the key vocabulary words.
19. Have students pair with each other and have them read and edit each other’s summary. 20. Have several of the students share their summaries with the class. 21. Optional: Develop a class summary.
Carrying Capacity – Grade Ten
5
Expansion Activity 1: Analyzing Human Impact 22. Lead the class in brainstorming both positive and negative human impact on natural
populations and ecosystems. Be sure to review brainstorming rules with the students (not being critical, being respectful, working toward consensus, etc). An example of the recommended format for brainstorming is shown below:
Example Format Organism/Ecosystem: White Tail Deer in Ohio Negative Impact: habitat destruction and over-hunting Positive Impact: deer reintroduced into Ohio, adequate population size to allow for controlled hunting
Other examples can include genetic engineering of corn, strip mining, pollution, use of low phosphate detergents or green sea turtle population.
Expansion Activity 2: Solving Environmental Problems 23. Describe for students some of examples where there has been successful resolution to
environmental issues (i.e. Nashua River, Lake Washington, beaver population in Ohio). 24. Discuss the steps in solving environmental problems.
a. Assessment; b. Risk analysis; c. Public education; d. Political action; e. Follow-up.
25. Alternative A: Select one or several environmental issues and have the students form five-member panels. Have each student research and present one of the steps in solving the environmental problem.
26. Alternative B: Have the students identify an environmental issue that impacts their town, school, or county. Have them research the issues and develop a plan, following the steps listed above.
Expansion Activity 3: Lesson Closure 27. Have the students review their pre-assessment (radar diagram) and rate their current
understanding. Have the students use a different colored ink than they used the first time they rated their understanding. You may want to do the group summary again.
28. Review lesson objectives with students: a. Recognize and identify positive impacts of technology/biotechnology on
ecosystems; b. Recognize and identify negative impacts of technology/biotechnology on
ecosystems; c. Understand what limiting factors control a population; d. Describe how human activities can have both positive and negative impact on
ecosystems;
Carrying Capacity – Grade Ten
6
e. Know the vocabulary associated with this lesson; f. Know the steps generally used to solve an environmental problem.
29. Be able to describe several examples (case histories) of the impact of technology/biotechnology on ecosystems.
30. Review the lesson vocabulary: bioaccumulation, biomagnification, carrying capacity, limiting factors, biodiveristy, population, population size, S-curve, J-curve, population density, R-strategists, K-strategists, biotechnology, technology.
Differentiated Instructional Support: Instruction is differentiated according to learner needs, to help all learners either meet the intent of the specified indicator(s) or, if the indicator is already met, to advance beyond the specified indicator(s). • Have students working towards the standards make flash cards of key terms and
concepts. • Provide students working towards the standards with graphs with X- and Y-axis already
labeled for the Where have all the Eagles Gone? activity. • Pair a student working beyond the standard with a student who is working toward the
standards for cooperative learning activities. • Have students make a concept map of key terms and concepts as a review of the lesson. Extensions: • Give students a list containing different food chains and have them create a food web.
When the student finishes the web, remove one organism from the web by covering it up with a self-sticking piece of paper. This represents a change in the environment that has caused that organism to be eliminated. Have the student write a paragraph explaining how the rest of the food web is affected by the absence of that organism. Students can do this activity individually or in groups.
• Find a legend or some other culturally-interesting fact about the bald eagle and write a summary on the information you found.
• Design a public information pamphlet about bald eagles. Homework Options and Home Connections: • Have students identify a problem that impacts their county, town or school. Have the
students find newspaper articles or editorials about the problem. After completing the research, have students write an article for the school newspaper about the problem, write a letter to the editor, or make an informational poster to be displayed in the cafeteria or a student commons area.
• Alert students to opportunities to attend a public meeting where some environmental impact issue is being discussed.
• Interview an adult family member about an environmental issue that has impacted his/her life.
Carrying Capacity – Grade Ten
7
Interdisciplinary Connections: English Language Arts: • Research
Benchmark B: Evaluate the usefulness and credibility of data and sources. Benchmark C: Organize information from various resources and select appropriate sources to support central ideas, concepts and themes. Benchmark D: Use style guides to produce oral and written reports that give proper credit for sources and include an acceptable format for source acknowledgement.
Materials and Resources: The inclusion of a specific resource in any lesson formulated by the Ohio Department of Education should not be interpreted as an endorsement of that particular resource, or any of its contents, by the Ohio Department of Education. The Ohio Department of Education does not endorse any particular resource. The Web addresses listed are for a given site’s main page, therefore, it may be necessary to search within that site to find the specific information required for a given lesson. Please note that information published on the Internet changes over time, therefore the links provided may no longer contain the specific information related to a given lesson. Teachers are advised to preview all sites before using them with students. For the teacher: Transparencies, two test tubes, yeast, sugar, bleach, goggles, lab apron. For the student: Graph paper, two test tubes, yeast, sugar, bleach, goggles, lab apron. Vocabulary: • bioaccumulation • biomagnification • carrying capacity • limiting factors • biodiveristy • population • population size • S-curve • J-curve • population density • R-strategists • K-strategists • biotechnology • technology
Carrying Capacity – Grade Ten
8
Technology Connections: • The Department of Natural Resources has many resources to help students
www.dnr.state.oh.us. • Ohio Environmental Protection Agency has many resources to aid students
www.epa.state.oh.us
Research Connections: Marzano, R., Pickering, D., Pollock, J. Classroom Instruction that Works: Research-Based Strategies for Increasing Student Achievement, Alexandria, VA: Association for Supervision and Curriculum Development. 2001.
Identifying similarities and differences enhances students’ understanding of and ability to use knowledge. This process includes comparing, classifying, creating metaphors and creating analogies and may involve the following: • Presenting students with explicit guidance in identifying similarities and differences; • Asking students to independently identify similarities and differences; • Representing similarities and differences in graphic or symbolic form.
Cooperative learning groups have a powerful effect on student learning. This type of grouping includes the following elements: • Positive interdependence; • Fact-to-face promotive interaction; • Individual and group accountability.
General Tips: • Multiple activities are listed for various parts of the lesson. It is not intended that the
teacher do every activity with his/her classes, but for the teacher to select the activities that address the cognitive levels and learning styles of students.
• Secure and read the following journals to help your understanding of what has happened to the Ohio environment over the last 100 years: Wild Ohio Magazine, Spring 2003. Ohio: Ohio Department of Natural Resources, 2003; Wild Ohio Magazine, Fall 2003. Ohio: Ohio Department of Natural Resources, 2003.
Attachments: Attachment A, Carrying Capacity Pre-Assessment Attachment B, Summary Sheet Attachment C, Carrying Capacity Post-Assessment Attachment D, Carrying Capacity Post-Assessment Key Attachment E, Believe It or Not Discussion Guide Attachment F, Believe It or Not Discussion Guide Answer Key Attachment G, Where Have All the Eagles Gone? Attachment H, Beaver Data
Carrying Capacity – Grade Ten
9
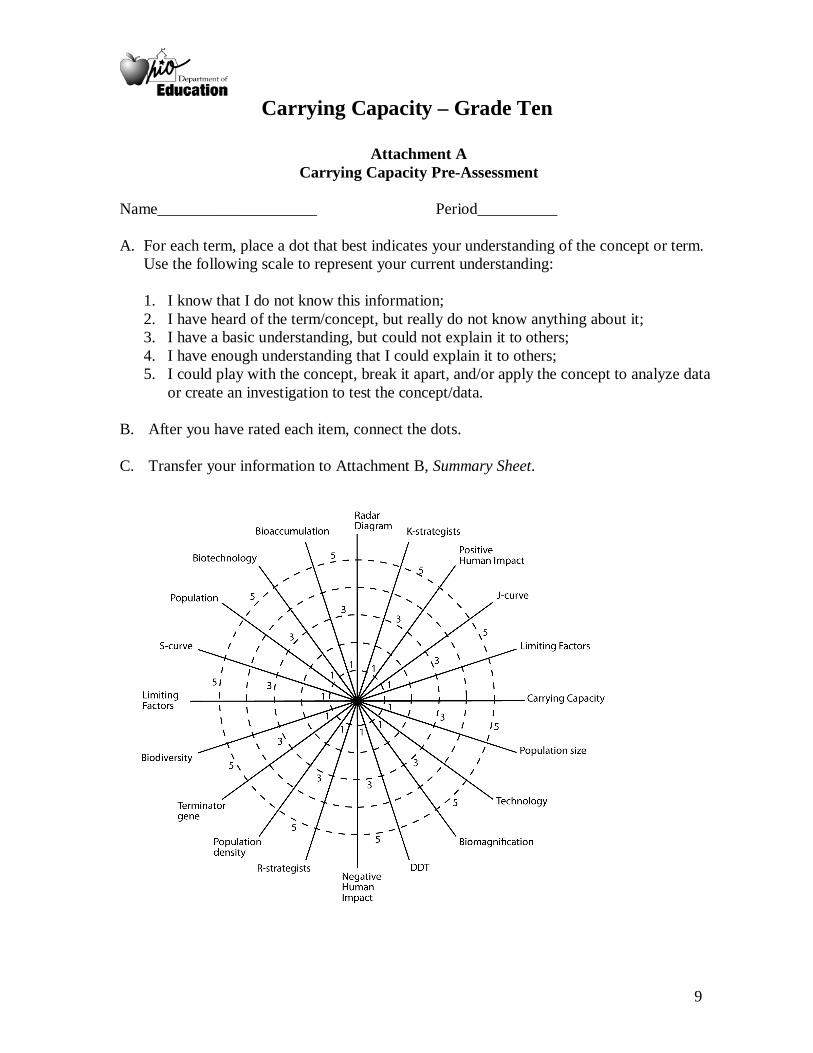
Attachment A Carrying Capacity Pre-Assessment
Name____________________ Period__________ A. For each term, place a dot that best indicates your understanding of the concept or term.
Use the following scale to represent your current understanding: 1. I know that I do not know this information; 2. I have heard of the term/concept, but really do not know anything about it; 3. I have a basic understanding, but could not explain it to others; 4. I have enough understanding that I could explain it to others; 5. I could play with the concept, break it apart, and/or apply the concept to analyze data
or create an investigation to test the concept/data.
B. After you have rated each item, connect the dots. C. Transfer your information to Attachment B, Summary Sheet.
Carrying Capacity – Grade Ten
10
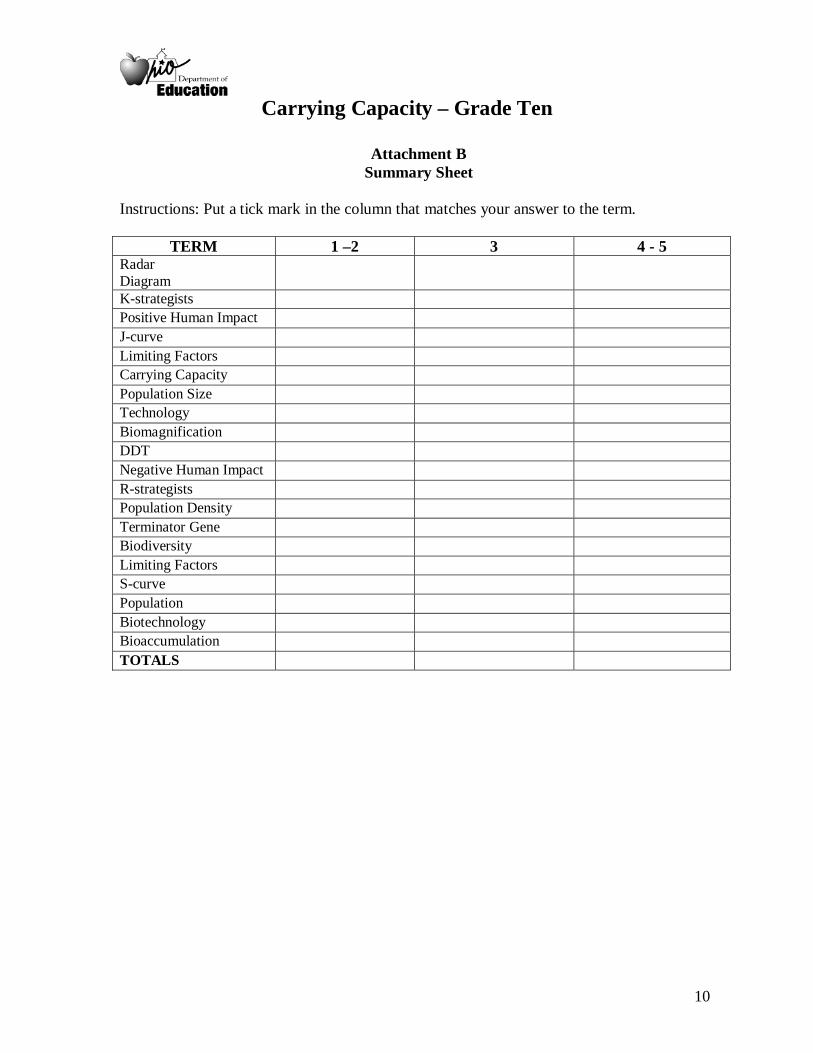
Attachment B Summary Sheet
Instructions: Put a tick mark in the column that matches your answer to the term.
TERM 1 –2 3 4 - 5 Radar Diagram
K-strategists Positive Human Impact J-curve Limiting Factors Carrying Capacity Population Size Technology Biomagnification DDT Negative Human Impact R-strategists Population Density Terminator Gene Biodiversity Limiting Factors S-curve Population Biotechnology Bioaccumulation TOTALS
Carrying Capacity – Grade Ten
11
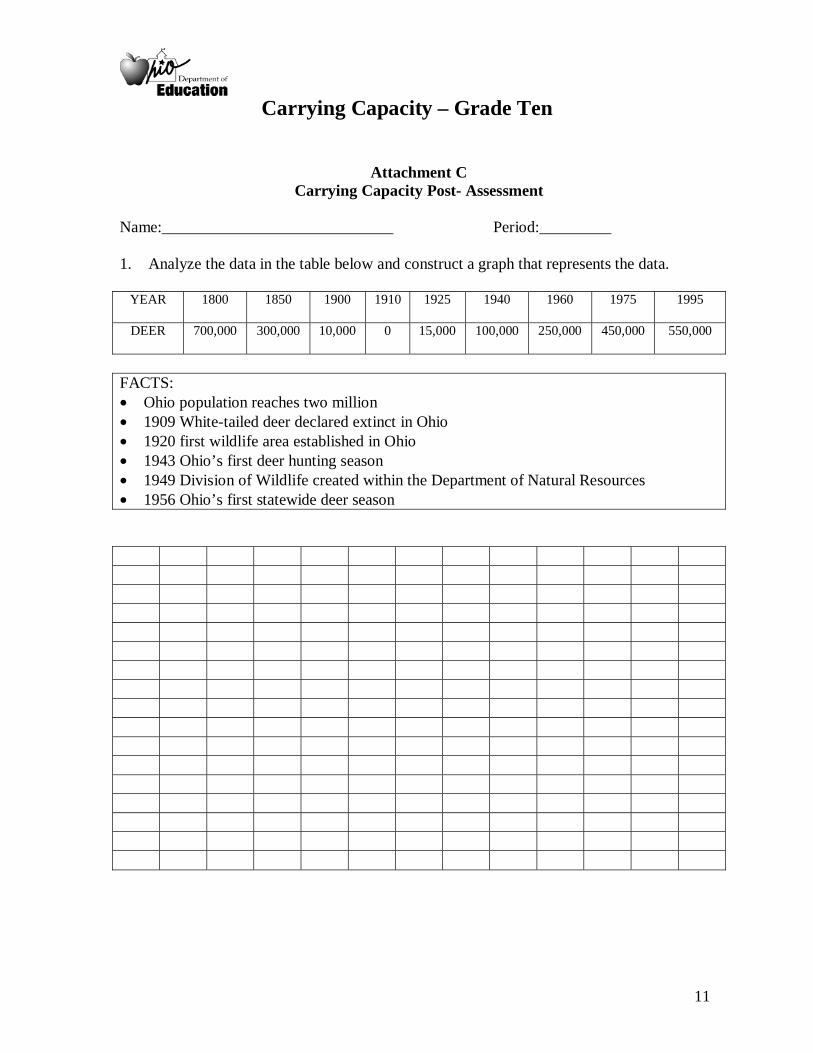
Attachment C
Carrying Capacity Post- Assessment Name:_____________________________ Period:_________ 1. Analyze the data in the table below and construct a graph that represents the data.
YEAR
1800 1850 1900 1910 1925 1940 1960 1975 1995
DEER
700,000 300,000 10,000 0 15,000 100,000 250,000 450,000 550,000
FACTS: • Ohio population reaches two million • 1909 White-tailed deer declared extinct in Ohio • 1920 first wildlife area established in Ohio • 1943 Ohio’s first deer hunting season • 1949 Division of Wildlife created within the Department of Natural Resources • 1956 Ohio’s first statewide deer season
Carrying Capacity – Grade Ten
12
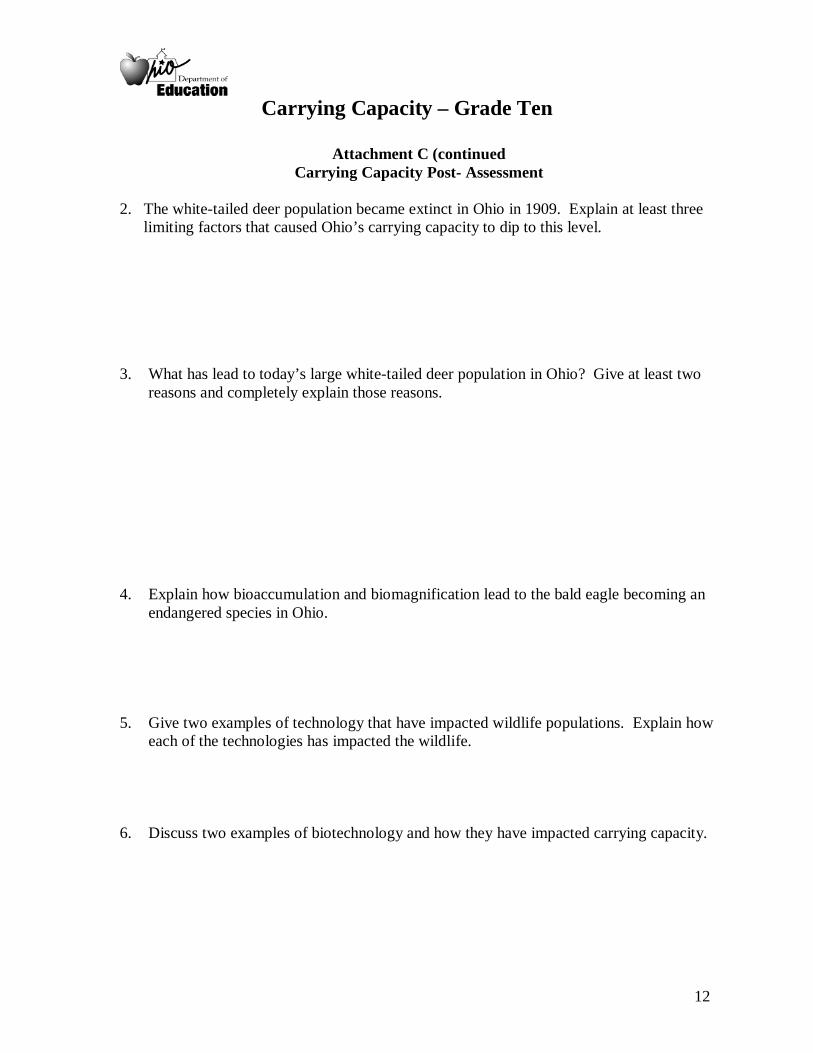
Attachment C (continued Carrying Capacity Post- Assessment
2. The white-tailed deer population became extinct in Ohio in 1909. Explain at least three
limiting factors that caused Ohio’s carrying capacity to dip to this level. 3. What has lead to today’s large white-tailed deer population in Ohio? Give at least two
reasons and completely explain those reasons.
4. Explain how bioaccumulation and biomagnification lead to the bald eagle becoming an endangered species in Ohio.
5. Give two examples of technology that have impacted wildlife populations. Explain how
each of the technologies has impacted the wildlife. 6. Discuss two examples of biotechnology and how they have impacted carrying capacity.
Carrying Capacity – Grade Ten
13
Attachment D Carrying Capacity Post-Assessment Key
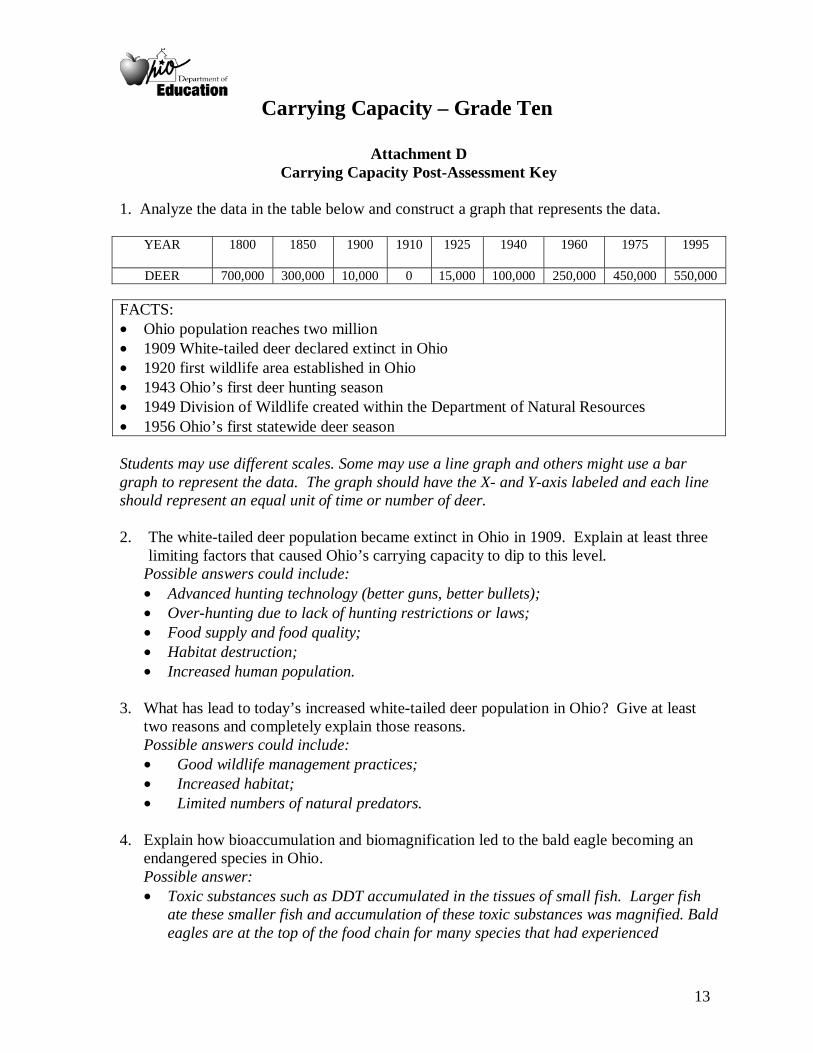
1. Analyze the data in the table below and construct a graph that represents the data.
YEAR
1800 1850 1900 1910 1925 1940 1960 1975 1995
DEER 700,000 300,000 10,000 0 15,000 100,000 250,000 450,000 550,000 FACTS: • Ohio population reaches two million • 1909 White-tailed deer declared extinct in Ohio • 1920 first wildlife area established in Ohio • 1943 Ohio’s first deer hunting season • 1949 Division of Wildlife created within the Department of Natural Resources • 1956 Ohio’s first statewide deer season Students may use different scales. Some may use a line graph and others might use a bar graph to represent the data. The graph should have the X- and Y-axis labeled and each line should represent an equal unit of time or number of deer. 2. The white-tailed deer population became extinct in Ohio in 1909. Explain at least three
limiting factors that caused Ohio’s carrying capacity to dip to this level. Possible answers could include: • Advanced hunting technology (better guns, better bullets); • Over-hunting due to lack of hunting restrictions or laws; • Food supply and food quality; • Habitat destruction; • Increased human population.
3. What has lead to today’s increased white-tailed deer population in Ohio? Give at least
two reasons and completely explain those reasons. Possible answers could include: • Good wildlife management practices; • Increased habitat; • Limited numbers of natural predators.
4. Explain how bioaccumulation and biomagnification led to the bald eagle becoming an
endangered species in Ohio. Possible answer: • Toxic substances such as DDT accumulated in the tissues of small fish. Larger fish
ate these smaller fish and accumulation of these toxic substances was magnified. Bald eagles are at the top of the food chain for many species that had experienced
Carrying Capacity – Grade Ten
14
Attachment D (continued) Carrying Capacity Post-Assessment Key
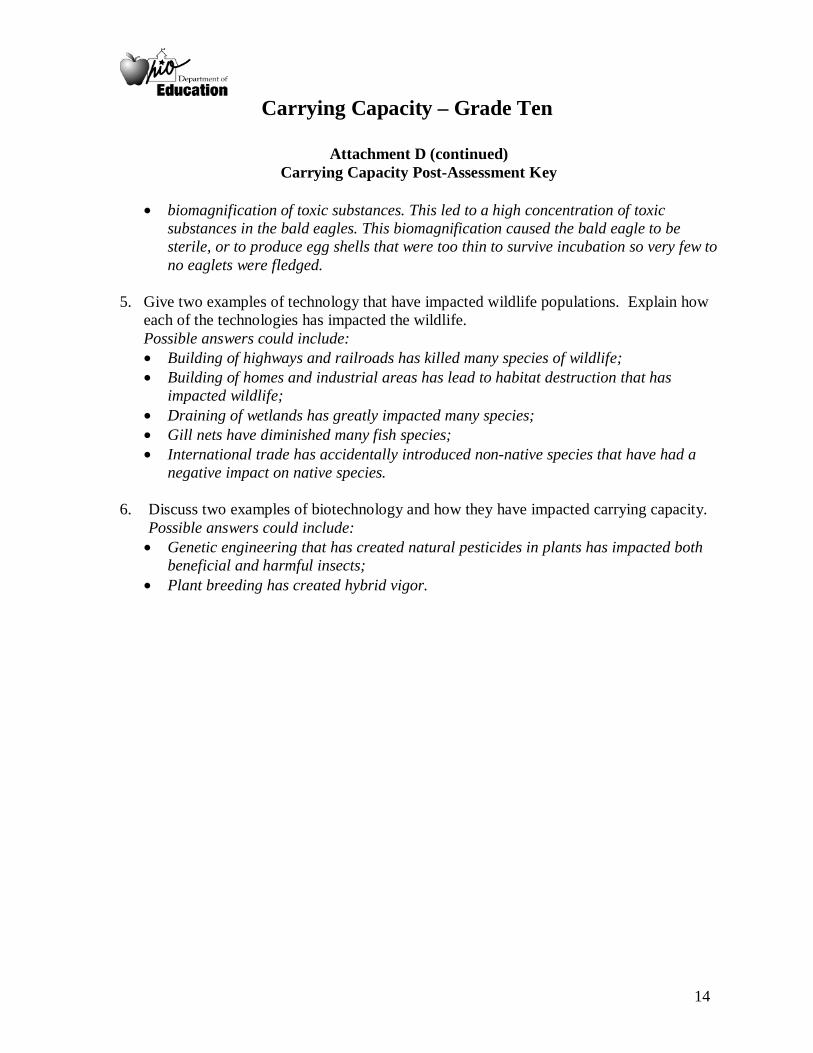
• biomagnification of toxic substances. This led to a high concentration of toxic
substances in the bald eagles. This biomagnification caused the bald eagle to be sterile, or to produce egg shells that were too thin to survive incubation so very few to no eaglets were fledged.
5. Give two examples of technology that have impacted wildlife populations. Explain how
each of the technologies has impacted the wildlife. Possible answers could include: • Building of highways and railroads has killed many species of wildlife; • Building of homes and industrial areas has lead to habitat destruction that has
impacted wildlife; • Draining of wetlands has greatly impacted many species; • Gill nets have diminished many fish species; • International trade has accidentally introduced non-native species that have had a
negative impact on native species. 6. Discuss two examples of biotechnology and how they have impacted carrying capacity.
Possible answers could include: • Genetic engineering that has created natural pesticides in plants has impacted both
beneficial and harmful insects; • Plant breeding has created hybrid vigor.
Carrying Capacity – Grade Ten
15
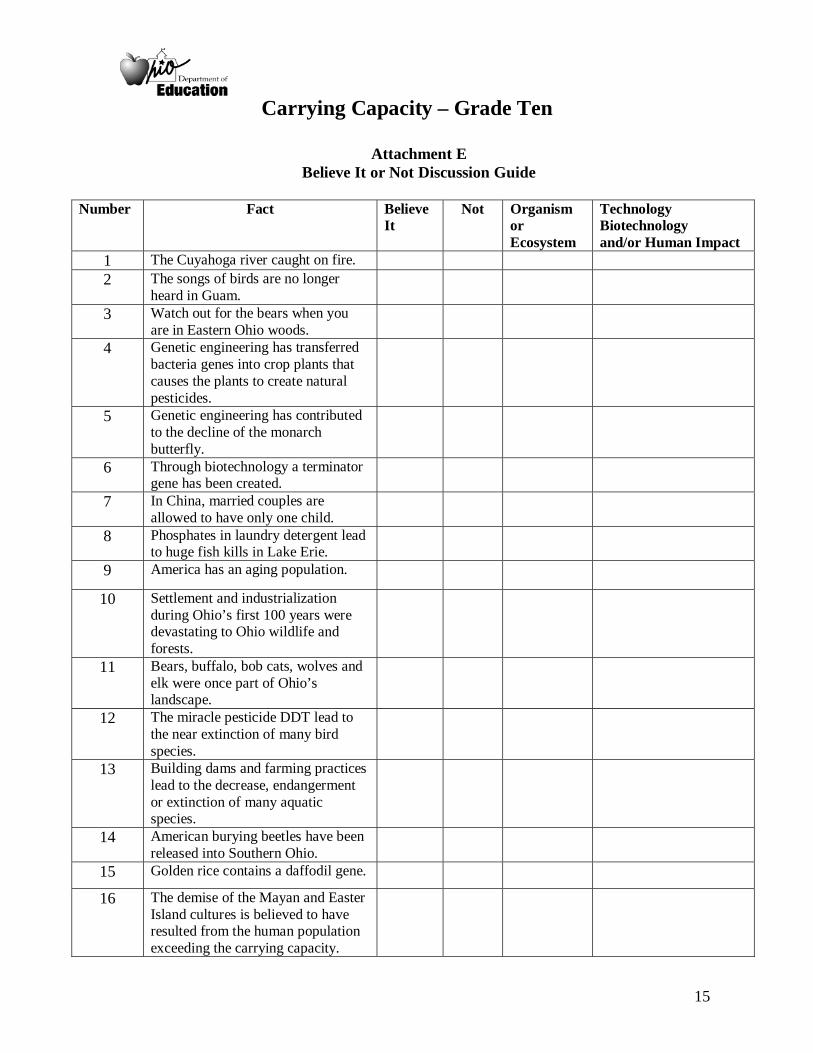
Attachment E Believe It or Not Discussion Guide
Number Fact Believe
It Not Organism
or Ecosystem
Technology Biotechnology and/or Human Impact
1 The Cuyahoga river caught on fire. 2 The songs of birds are no longer
heard in Guam.
3 Watch out for the bears when you are in Eastern Ohio woods.
4 Genetic engineering has transferred bacteria genes into crop plants that causes the plants to create natural pesticides.
5 Genetic engineering has contributed to the decline of the monarch butterfly.
6 Through biotechnology a terminator gene has been created.
7 In China, married couples are allowed to have only one child.
8 Phosphates in laundry detergent lead to huge fish kills in Lake Erie.
9 America has an aging population.
10 Settlement and industrialization during Ohio’s first 100 years were devastating to Ohio wildlife and forests.
11 Bears, buffalo, bob cats, wolves and elk were once part of Ohio’s landscape.
12 The miracle pesticide DDT lead to the near extinction of many bird species.
13 Building dams and farming practices lead to the decrease, endangerment or extinction of many aquatic species.
14 American burying beetles have been released into Southern Ohio.
15 Golden rice contains a daffodil gene.
16 The demise of the Mayan and Easter Island cultures is believed to have resulted from the human population exceeding the carrying capacity.
Carrying Capacity – Grade Ten
16
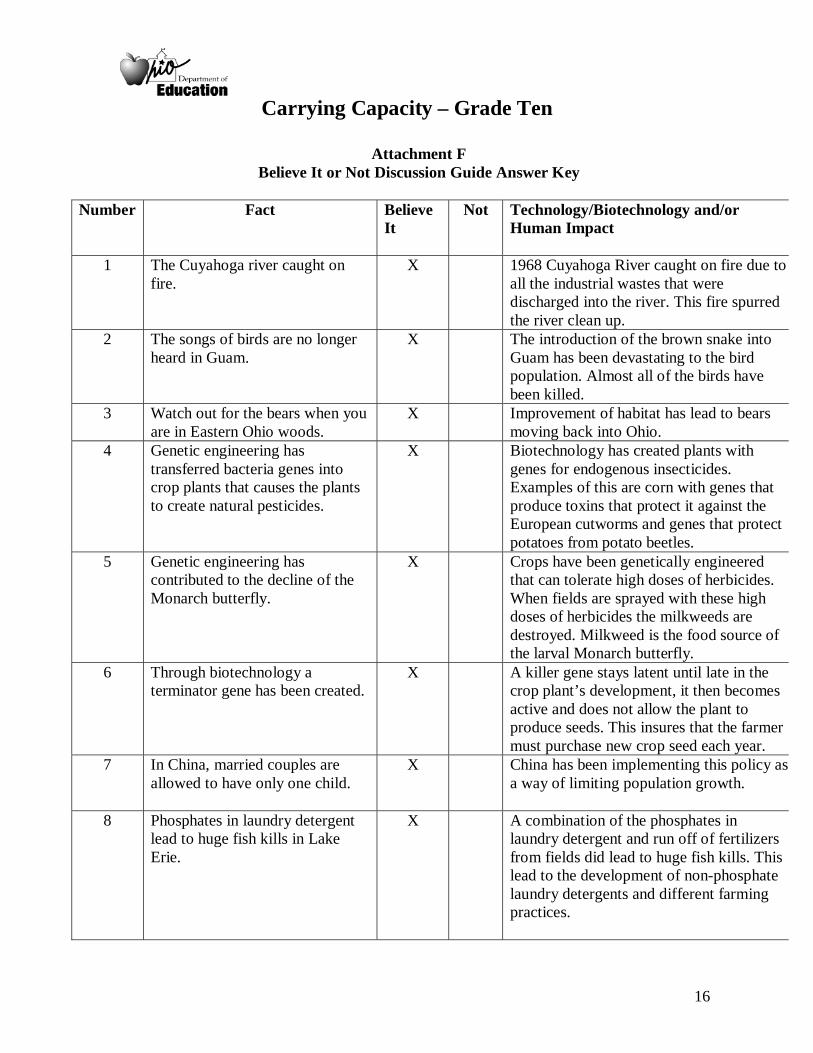
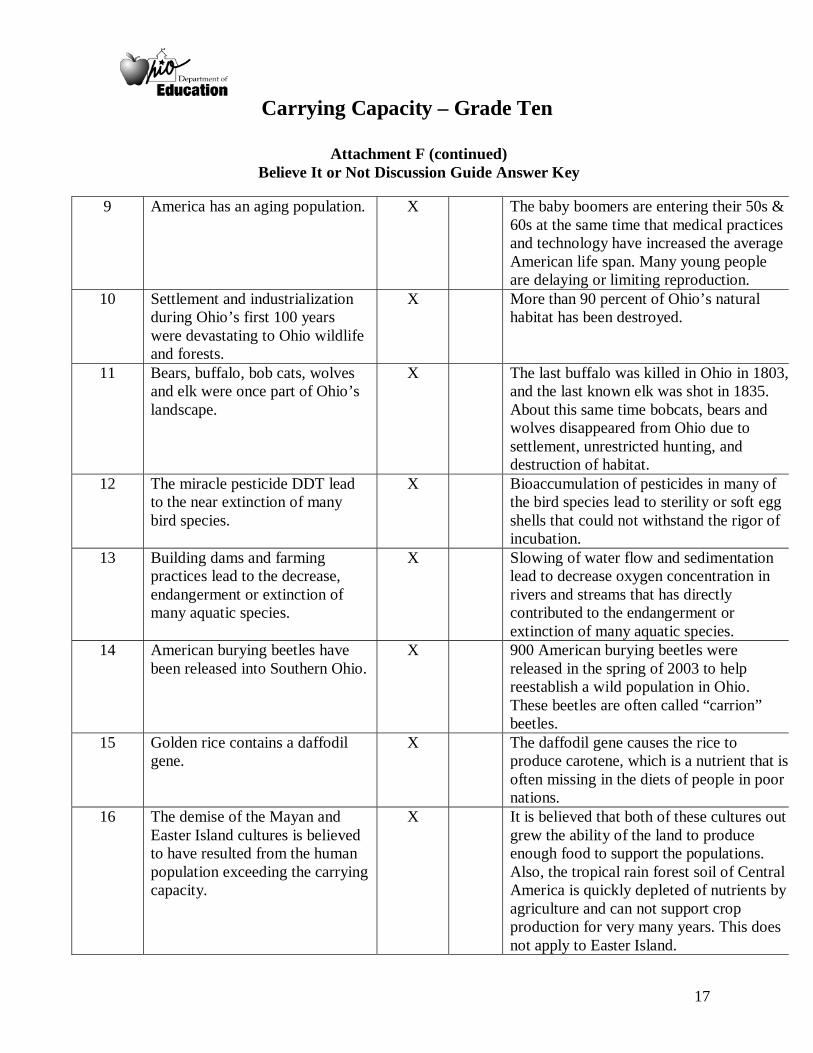
Attachment F Believe It or Not Discussion Guide Answer Key
Number Fact Believe
It Not Technology/Biotechnology and/or
Human Impact
1 The Cuyahoga river caught on fire.
X 1968 Cuyahoga River caught on fire due to all the industrial wastes that were discharged into the river. This fire spurred the river clean up.
2 The songs of birds are no longer heard in Guam.
X The introduction of the brown snake into Guam has been devastating to the bird population. Almost all of the birds have been killed.
3 Watch out for the bears when you are in Eastern Ohio woods.
X Improvement of habitat has lead to bears moving back into Ohio.
4 Genetic engineering has transferred bacteria genes into crop plants that causes the plants to create natural pesticides.
X Biotechnology has created plants with genes for endogenous insecticides. Examples of this are corn with genes that produce toxins that protect it against the European cutworms and genes that protect potatoes from potato beetles.
5 Genetic engineering has contributed to the decline of the Monarch butterfly.
X Crops have been genetically engineered that can tolerate high doses of herbicides. When fields are sprayed with these high doses of herbicides the milkweeds are destroyed. Milkweed is the food source of the larval Monarch butterfly.
6 Through biotechnology a terminator gene has been created.
X A killer gene stays latent until late in the crop plant’s development, it then becomes active and does not allow the plant to produce seeds. This insures that the farmer must purchase new crop seed each year.
7 In China, married couples are allowed to have only one child.
X China has been implementing this policy as a way of limiting population growth.
8 Phosphates in laundry detergent lead to huge fish kills in Lake Erie.
X A combination of the phosphates in laundry detergent and run off of fertilizers from fields did lead to huge fish kills. This lead to the development of non-phosphate laundry detergents and different farming practices.
Carrying Capacity – Grade Ten
17
Attachment F (continued) Believe It or Not Discussion Guide Answer Key
9 America has an aging population. X The baby boomers are entering their 50s &
60s at the same time that medical practices and technology have increased the average American life span. Many young people are delaying or limiting reproduction.
10
Settlement and industrialization during Ohio’s first 100 years were devastating to Ohio wildlife and forests.
X More than 90 percent of Ohio’s natural habitat has been destroyed.
11 Bears, buffalo, bob cats, wolves and elk were once part of Ohio’s landscape.
X The last buffalo was killed in Ohio in 1803, and the last known elk was shot in 1835. About this same time bobcats, bears and wolves disappeared from Ohio due to settlement, unrestricted hunting, and destruction of habitat.
12 The miracle pesticide DDT lead to the near extinction of many bird species.
X Bioaccumulation of pesticides in many of the bird species lead to sterility or soft egg shells that could not withstand the rigor of incubation.
13 Building dams and farming practices lead to the decrease, endangerment or extinction of many aquatic species.
X Slowing of water flow and sedimentation lead to decrease oxygen concentration in rivers and streams that has directly contributed to the endangerment or extinction of many aquatic species.
14 American burying beetles have been released into Southern Ohio.
X 900 American burying beetles were released in the spring of 2003 to help reestablish a wild population in Ohio. These beetles are often called “carrion” beetles.
15 Golden rice contains a daffodil gene.
X The daffodil gene causes the rice to produce carotene, which is a nutrient that is often missing in the diets of people in poor nations.
16 The demise of the Mayan and Easter Island cultures is believed to have resulted from the human population exceeding the carrying capacity.
X It is believed that both of these cultures out grew the ability of the land to produce enough food to support the populations. Also, the tropical rain forest soil of Central America is quickly depleted of nutrients by agriculture and can not support crop production for very many years. This does not apply to Easter Island.
Carrying Capacity – Grade Ten
18
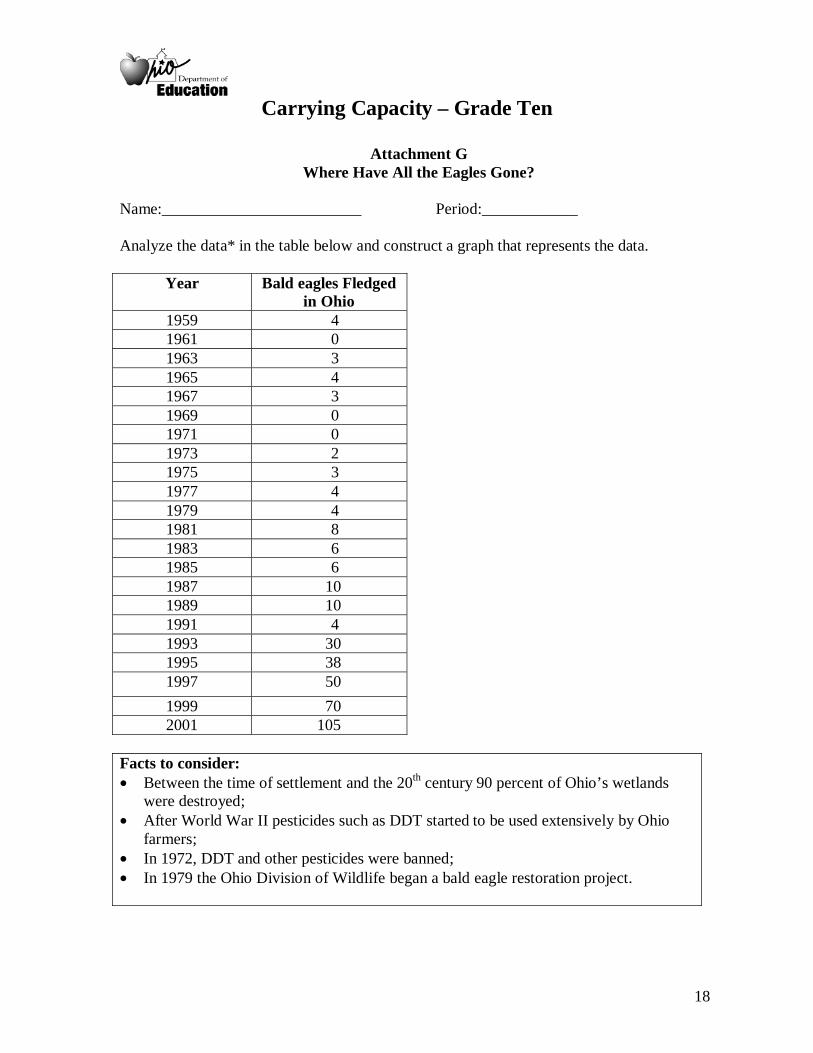
Attachment G Where Have All the Eagles Gone?
Name:_________________________ Period:____________ Analyze the data* in the table below and construct a graph that represents the data.
Year Bald eagles Fledged
in Ohio 1959 4 1961 0 1963 3 1965 4 1967 3 1969 0 1971 0 1973 2 1975 3 1977 4 1979 4 1981 8 1983 6 1985 6 1987 10 1989 10 1991 4 1993 30 1995 38 1997 50
1999 70 2001 105
Facts to consider: • Between the time of settlement and the 20th century 90 percent of Ohio’s wetlands
were destroyed; • After World War II pesticides such as DDT started to be used extensively by Ohio
farmers; • In 1972, DDT and other pesticides were banned; • In 1979 the Ohio Division of Wildlife began a bald eagle restoration project.
Carrying Capacity – Grade Ten
19
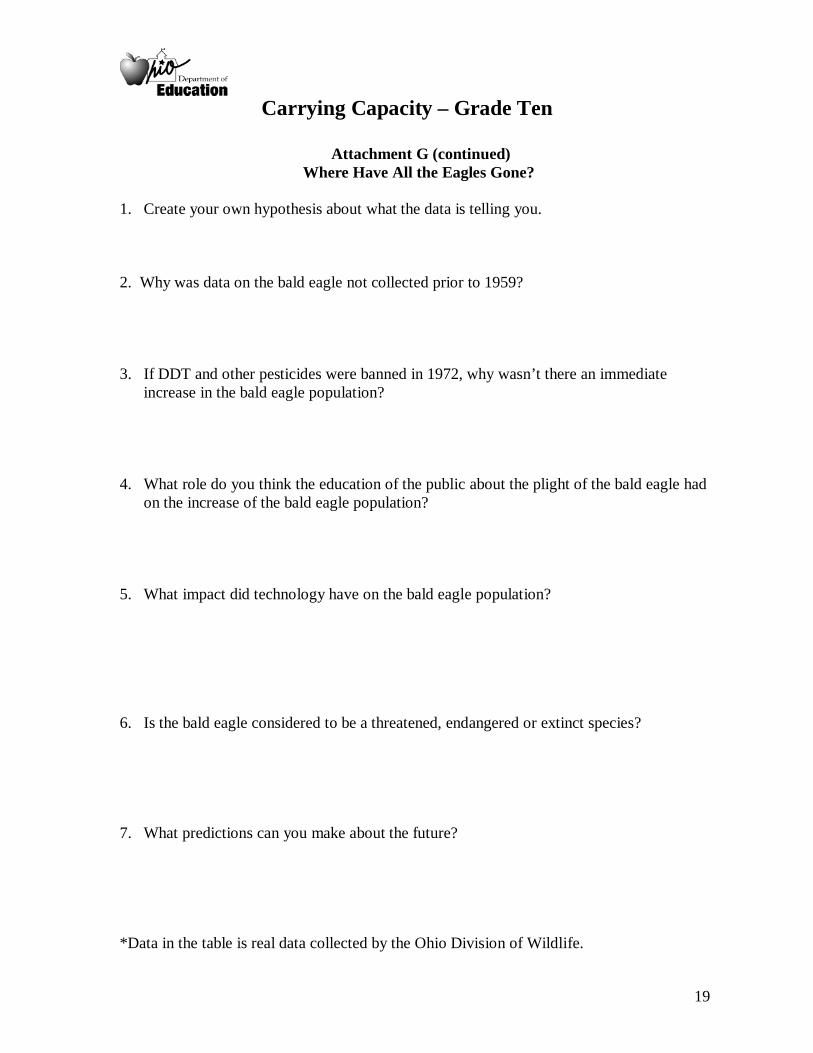
Attachment G (continued) Where Have All the Eagles Gone?
1. Create your own hypothesis about what the data is telling you. 2. Why was data on the bald eagle not collected prior to 1959? 3. If DDT and other pesticides were banned in 1972, why wasn’t there an immediate
increase in the bald eagle population? 4. What role do you think the education of the public about the plight of the bald eagle had
on the increase of the bald eagle population? 5. What impact did technology have on the bald eagle population? 6. Is the bald eagle considered to be a threatened, endangered or extinct species? 7. What predictions can you make about the future? *Data in the table is real data collected by the Ohio Division of Wildlife.
Carrying Capacity – Grade Ten
20
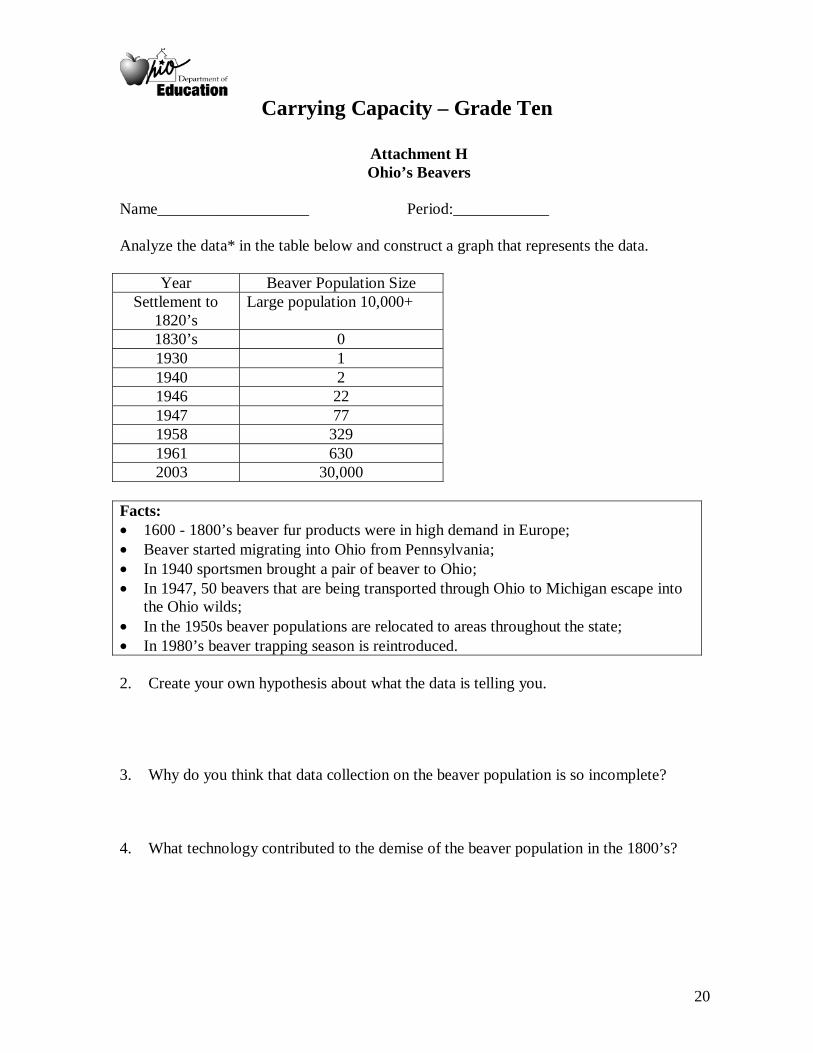
Attachment H Ohio’s Beavers
Name___________________ Period:____________ Analyze the data* in the table below and construct a graph that represents the data.
Year Beaver Population Size
Settlement to 1820’s
Large population 10,000+
1830’s 0 1930 1 1940 2 1946 22 1947 77 1958 329 1961 630 2003 30,000
Facts: • 1600 - 1800’s beaver fur products were in high demand in Europe; • Beaver started migrating into Ohio from Pennsylvania; • In 1940 sportsmen brought a pair of beaver to Ohio; • In 1947, 50 beavers that are being transported through Ohio to Michigan escape into
the Ohio wilds; • In the 1950s beaver populations are relocated to areas throughout the state; • In 1980’s beaver trapping season is reintroduced. 2. Create your own hypothesis about what the data is telling you.
3. Why do you think that data collection on the beaver population is so incomplete? 4. What technology contributed to the demise of the beaver population in the 1800’s?
Carrying Capacity – Grade Ten
21
Attachment H (continued) Ohio’s Beavers
5. How did humans impact the beaver population both in a negative and a positive way? 6. What role do you think the education of the public about the plight of the beaver has had
on the increase of the beaver population? 7. What predictions can you make about the future of the beaver? Extension Activities: A) Find a legend or another culturally interesting fact about the beaver and write a summary
on the information you found. B) Design a public information pamphlet about beaver. *Data is not exact and is based on the article “The Role of Beaver in Ohio’s History” by Chris Dwyer (Wild Ohio Magazine, Fall 2003. Ohio: Ohio Department of Natural Resources).