l reiax, reicx, reiix qq2 3 commentary commentary resistant to threats from online retailers....
TRANSCRIPT

L REIAX, REICX, REIIX Q2 CommentaryQ3 Commentary
As of September 30, 2015 Total Return (net of fees) 1 Month Q3 YTD 1 Year Annualized
ITD* Cumulative
ITD* REIAX 2.26% 1.00% -2.78% 9.89% 14.49% 26.69% REIAX w/ Load -3.65% -4.83% -8.38% 3.56% 10.68% 19.41% REICX 2.15% 0.81% -3.27% 9.04% 13.65% 25.06% REIIX 2.15% 1.07% -2.61% 10.04% 14.70% 27.10% MSCI US REIT Index 3.03% 2.06% -4.26% 9.47% 13.53% 24.83%
Performance data quoted represents past performance and is no guarantee of future results. Total return figures include the reinvestment of dividends and capital gains. Current performance may be lower or higher than the performance data quoted. Investment return and principal value will fluctuate so that an investor’s shares, when redeemed, may be worth more or less than original cost. For the most recent month end performance, please call (800) 207-‐7108. Returns showing less than one year are cumulative. *ITD represents inception-‐to-‐date data. The Fund’s inception date was 12/31/2013. The gross operating expense ratio for the Class A, C, and Institutional Shares are 2.84%, 3.59% and 2.59%, respectively. The Fund’s investment advisor contractually agreed, until April 30, 2016, to waive its fees and/or pay operating expenses so that the net expense ratios of the Class A, C and I Shares do not exceed 1.50%, 2.25% and 1.25%, respectively. Otherwise, performance shown would have been lower. Performance results with load reflect the deduction for Class A Shares of the 5.75% maximum front end sales charge. Class C Shares are subject to a contingent deferred sales charge of 1.00% when redeemed within 12 months of purchase. Performance presented without the load would be lower if this charge was reflected. Fund performance may be subject to substantial short-‐term changes. The West Loop Realty Fund institutional share class produced a total return of +1.07% for the third quarter of 2015, which compares to +2.06% for the MSCI US REIT Index over the same period. Detractors from relative performance included an overweight allocation to the hotel sector as well as stock selection in the self-storage and shopping center sectors, while stock selection in the data center/tech, mall, and health care sectors contributed positively to relative performance.
Attribution The hotel sector has been hurt recently over concerns that the macroeconomic environment and new supply in the form of Airbnb will result in a deceleration in revenue per available room (or RevPAR) growth. At current prices, hotel stocks are discounting a significant negative trend in fundamentals, which may be cause for upside if they remain as strong as we believe they will. Sovran Self Storage (NYSE: SSS) underperformed the self-storage sector during the quarter. Unlike its peers, SSS has no exposure to California markets, which has negatively affected its relative revenue growth profile. Sovran’s Houston exposure (~11% of net operating income, or NOI) has also put pressure on the stock price despite management forecasting Houston NOI growth to exceed the portfolio average. Additionally, the Fund’s allocation to Kite Realty Group (NYSE: KRG) within the shopping center sector detracted from relative performance. KRG has been trading at a substantial discount to its net asset value (or NAV) as some investors have not given the company credit for its improved portfolio quality and growth outlook. The allocation to CyrusOne (NASDAQ: CONE) and CoreSite Realty (NYSE: COR) within the data center/tech sector enhanced the Fund’s performance for the quarter. The data center/tech sector is expected to have strong growth driven by continued acceptance of the “cloud” and increased demand for more mobile and video capacity. Not owning CBL & Associates Properties (NYSE: CBL), a class B and C mall Real Estate Investment Trust (REIT), was the main reason for outperformance within the mall sector. We favor mall REITs with more exposure to higher-quality class A properties, which tend to have a stronger growth profile and are more resistant to threats from online retailers. Healthcare Realty Trust (NYSE: HR), which focuses on medical office buildings (MOBs), contributed to the Fund’s relative performance within the health care sector. HR benefits from increasing outpatient visits to its properties, which are mostly affiliated with large hospital systems.
West Loop Realty Fund | Q3 Commentary
2
The REIT Way to Measure Risk The advent of Modern Portfolio Theory in the 20th Century, along with fully functioning stock exchanges and computers, created a golden era for data analysis, return expectations, and optimizing portfolios for the highest return at a given level of risk. Who wouldn’t want the highest return and lowest risk? While understanding the calculation of historical returns is somewhat ubiquitous, the word ‘risk’ can have different meanings to different people.
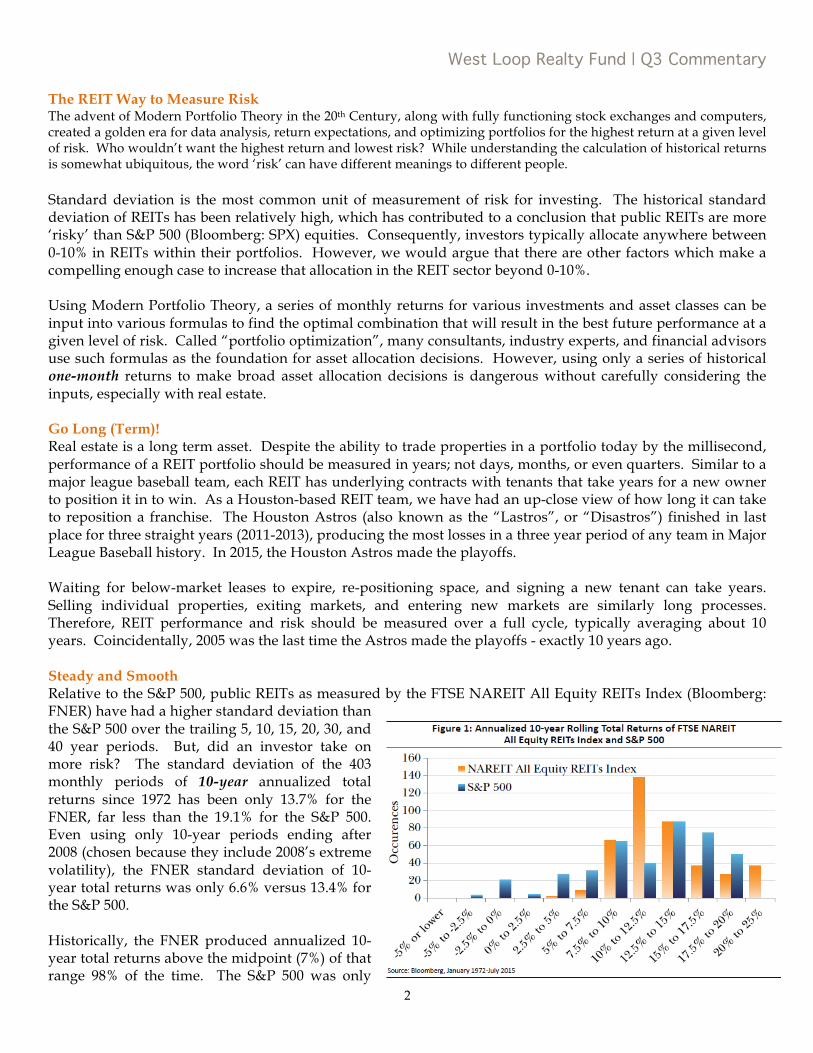
Standard deviation is the most common unit of measurement of risk for investing. The historical standard deviation of REITs has been relatively high, which has contributed to a conclusion that public REITs are more ‘risky’ than S&P 500 (Bloomberg: SPX) equities. Consequently, investors typically allocate anywhere between 0-10% in REITs within their portfolios. However, we would argue that there are other factors which make a compelling enough case to increase that allocation in the REIT sector beyond 0-10%. Using Modern Portfolio Theory, a series of monthly returns for various investments and asset classes can be input into various formulas to find the optimal combination that will result in the best future performance at a given level of risk. Called “portfolio optimization”, many consultants, industry experts, and financial advisors use such formulas as the foundation for asset allocation decisions. However, using only a series of historical one-month returns to make broad asset allocation decisions is dangerous without carefully considering the inputs, especially with real estate. Go Long (Term)! Real estate is a long term asset. Despite the ability to trade properties in a portfolio today by the millisecond, performance of a REIT portfolio should be measured in years; not days, months, or even quarters. Similar to a major league baseball team, each REIT has underlying contracts with tenants that take years for a new owner to position it in to win. As a Houston-based REIT team, we have had an up-close view of how long it can take to reposition a franchise. The Houston Astros (also known as the “Lastros”, or “Disastros”) finished in last place for three straight years (2011-2013), producing the most losses in a three year period of any team in Major League Baseball history. In 2015, the Houston Astros made the playoffs. Waiting for below-market leases to expire, re-positioning space, and signing a new tenant can take years. Selling individual properties, exiting markets, and entering new markets are similarly long processes. Therefore, REIT performance and risk should be measured over a full cycle, typically averaging about 10 years. Coincidentally, 2005 was the last time the Astros made the playoffs - exactly 10 years ago. Steady and Smooth Relative to the S&P 500, public REITs as measured by the FTSE NAREIT All Equity REITs Index (Bloomberg: FNER) have had a higher standard deviation than the S&P 500 over the trailing 5, 10, 15, 20, 30, and 40 year periods. But, did an investor take on more risk? The standard deviation of the 403 monthly periods of 10-year annualized total returns since 1972 has been only 13.7% for the FNER, far less than the 19.1% for the S&P 500. Even using only 10-year periods ending after 2008 (chosen because they include 2008’s extreme volatility), the FNER standard deviation of 10-year total returns was only 6.6% versus 13.4% for the S&P 500. Historically, the FNER produced annualized 10-year total returns above the midpoint (7%) of that range 98% of the time. The S&P 500 was only

West Loop Realty Fund | Q3 Commentary
3
able to exceed 7% in 81% of the 10-year periods over the same time frame. Additionally, the worst 10-year period since 1972 for public REITs produced an annual total return of +3.4%, which compared to -3.4% for the S&P 500. Therefore, for those who have a longer term time horizon, they may find that public REITs have had more predictable returns, better downside protection, and less risk – even using the all-powerful standard deviation metric. Volatile Earnings, Volatile Returns REIT earnings are more predictable and less volatile than comparable metrics for the S&P 500. As such, REIT earnings growth, as measured by Funds From Operations (FFO) have had much lower volatility than S&P 500 earnings growth. From 2001 to 2014, the standard deviation of REIT FFO growth (according to FNER) was only 12.1%, while the S&P 500’s earnings growth had a standard deviation of 18.0%! In contrast to many S&P 500 companies (excluding the 24 REITs in the S&P 500 of course), REITs enter into contracts that lock in revenues for periods of up to 20 years, depending on the property type. The contractual nature of REIT revenues protects the rental payments, even as the earnings and stock prices of a REIT’s underlying tenants may be declining. It is generally accepted that rent is one of the last expenses to be cut by a company looking to cut costs. Additionally, the diversification within many REITs, and especially a portfolio of REITs, tends to provide further risk mitigation if a particular geographic market, property type, or tenant industry is experiencing a decline. The companies in the West Loop Realty Fund as of June 30, 2015 owned 6,539 properties across 10 property types, not including the cell tower REITs (each owns thousands of towers) or the franchised/managed hotels by Starwood Hotels (NYSE: HOT). Excluding multifamily, self storage, and lodging, the portfolio has well over 20,000 tenants spread across all industries. Geographically, the portfolio is spread across the country in all regions and over 170 metropolitan service areas (or MSAs). New York City is the largest MSA by square footage, and accounts for less than 10% of the portfolio. Valuation Techniques We have lauded the effectiveness of using NAVs for valuing REITs many times in this publication. In addition to filing a 10-Q, each REIT issues a ‘Supplemental’ each quarter with 10-50 pages of company details which aide in determining REIT earnings and NAV calculations. Public REIT values are somewhat tied to their NAVs, which has prevented them from becoming too overvalued or undervalued (except for 2008-2009 when it happened for all asset classes). Unfortunately, NAV is not applicable to many other companies outside of REITs. Instead, investors are expected to determine fair value via other methods, most commonly an earnings multiple. In our 2Q 2015 Commentary, we explained the danger of using historical multiples to determine fair value of a company. Ultimately, the multiple used is a best guess opinion that rarely has substantial comparable transactions to use as evidence. Its inexact nature increases the probability that market multiples will be more volatile and experience swings too far in one direction or another. We believe an investor should feel more confident in the future earnings and fair value estimates of REITs than those of S&P 500 companies, which implies less risk. Less Obsolescence Well-located real estate has possibly the least obsolescence risk of any industry. Sometimes referred to as ‘irreplaceable’, the values of such properties seem to have very little downside risk for long term investors. While its tenants may succumb to competition, a well-located property will almost always be able to re-lease an empty space, and often at a premium to the prior tenant’s rent!

West Loop Realty Fund | Q3 Commentary
4
For example, FAO Schwarz closed its doors at the GM Building (767 Fifth Avenue in New York City) on July 15 after almost 30 years. During that period, FAO Schwarz filed for bankruptcy twice, and now it is owned by Toys R Us, another struggling retailer. The private equity investors in FAO Schwarz and Toys R Us have likely lost a considerable portion of their investment. However, the owner of the GM Building, Boston Properties (NYSE: BXP), will be able to replace FAO Schwarz with a tenant or tenants paying a much higher rate. FAO Schwarz was paying about $20 million annually, or $323 per square foot (sqft), on its 62,000 sqft, 3-floor footprint. Though BXP has not given any estimate on the new rent the space could garner, the 14,000 sqft on the ground floor alone could produce annual rent of over $30 million assuming a rental rate of $2,250 per sqft, a conservative estimate given that asking rents for street retail on Fifth Ave as of June 30 were over $3,400 per sqft. Upon fully re-leasing the space, we believe BXP could stand to receive $25 million more in net operating income than it was under the prior lease with FAO Schwarz. At a 4% cap rate (again conservative for the most valuable office building in the world) and adjusting for its minority partner’s 40% interest, re-tenanting the FAO Schwarz space would add $375 million to BXP’s net asset value (or NAV), or $2.20 per share. The above scenario happens constantly for mall REITs, as all of their tenants are subject to changing trends that may make them obsolete. As shown in Figure 2, the mall REIT same store net operating income (SSNOI) and even tenant sales grew consistently in the face of varying amounts of tenant bankruptcies. In most cases, investors in the retailers that went bankrupt or had to close stores experienced significant losses, while the REIT landlord benefited from the ability to replace an underperforming tenant at a higher rate. REITs are Homebodies S&P 500 equities have significantly more international risk than public REITs. According to S&P/Dow, approximately 40% of S&P 500 company revenues are from outside of the US. While it can be argued that international exposure adds diversification, it also brings additional risk. A slowdown in China, Japanese deflation, falling commodity prices (Brazil and Russia), Middle East violence, and Greek insolvency can significantly alter corporate and consumer behavior. In addition to geopolitical risk and economic risk, currency fluctuations against the US dollar also change earnings when translated into US Dollars. In contrast, US REITs derive only 3% of their value from abroad according to Green Street Advisors. With little to no currency risk and a lack of exposure to more volatile economies, REIT earnings and valuations are well-insulated from crises and recessions that may significantly affect traditional equities. Shareholder Capital Allocation Most companies have stated leverage and external growth goals, along with a property type and geographic focus, that should give investors comfort that the management team is not going to stray from any of the characteristics that may have made the company attractive. For example, an investor who likes Essex Property Trust (NYSE: ESS) because of its West Coast multifamily exposure can feel confident that the management team will not buy or invest in properties outside of that geographic area. In addition, in the REIT sector, investors can feel more comfortable that their interests are aligned with management –the average insider ownership of 181 REITs analyzed by SNL Financial was 7.2% as of December 31, 2014. In comparison, the average insider ownership of the S&P 500 was 1.8% as of the same date.

West Loop Realty Fund | Q3 Commentary
5
Historically, the REIT dividend has accounted for about half of the total return and putting cash in the hands of the shareholders via a higher dividend yield gives them the power of capital allocation and increases the probability of reaching the desired return. Similarly, active managers such as ourselves can use the liquidity from dividends and trading to shift the portfolio toward geographic markets, property types, and management teams that we believe will produce a return above that required by our assessment of risk. If no opportunities are available, we can hold cash until one presents itself. Cozy up to a Higher REIT Allocation We by no means would advocate throwing all risk metrics out of the door, nor are we trying to paint the picture that every S&P 500 company is more risky than every REIT. REITs have been associated with risk and volatility in the past, but we believe that should not be the case, especially today. After looking deeper into the available data, REITs have offered a similar or better return profile to the S&P 500, but with less risk. An investor with a time horizon of 10 years or more should seriously consider a minimum allocation to REITs throughout the cycle, and may feel comfortable with a larger allocation depending on valuation, fundamentals, and portfolio goals. To put a hypothetical allocation in perspective, commercial real estate comprises about 15% of the US economy, and over 18% when excluding residential real estate from the denominator. With predictable earnings, high transparency, well-covered dividends, record low leverage, and a lack of international exposure, an investor should focus on long term positive REIT fundamentals and ignore short term volatility that can give the appearance of above average risk. As of September 30, 2015 the Fund's Top 10 holdings were as follows: Simon Property Group (SPG) 9.20%, Sovran Self Storage (SSS) 5.57%, Avalonbay Communities (AVB) 5.04%, Boston Properties (BXP) 4.79%, Camden Property Trust (CPT) 4.67%, Vornado Realty Trust (VNO) 3.79%, General Growth Properties (GGP) 3.74%, Essex Property Trust (ESS) 3.68%, Crown Castle International (CCI) 3.36% and EastGroup Properties (EGP) 3.35% INDEX DEFINITIONS Indices are unmanaged, do not reflect the deduction of fees or expenses, and are not available for direct investment. Each index discussed above is comprised of different investments and asset classes. Different types of investments and asset classes have different characteristics, including with respect to guarantees, fluctuation of principal and/or return and tax features. The performance of the Fund will differ, and may vary materially, from that of any index. Risks inherent in the following indices include, but are not limited to, real estate industry concentration risk (non-‐diversification), interest rate risk (as interest rates rise bond prices usually fall), the risk of issuer default, and inflation risk. One cannot invest directly in an index. The MSCI US REIT Index is a free float-‐adjusted market capitalization weighted index that is comprised of equity REITs that are included in the MSCI US Investable Market 2500 Index, with the exception of specialty equity REITs that do not generate a majority of their revenue and real estate rental and leasing operations. The index represents approximately 85% of the US REIT universe. One cannot invest directly in an index. NAREIT Equity REIT Index (FNER) -‐ The NAREIT Equity REITs Index is a free-‐float adjusted, market capitalization-‐ weighted index of U.S. Equity REITs. Constituents of the Index include all tax-‐qualified REITs with more than 50 percent of total assets in qualifying real estate assets other than mortgages secured by real property. Inception Date: 1971 Risks: real estate risk (non-‐diversification), interest rate risk (as interest rates rise bond prices usually fall), the risk of issuer default, and inflation risk exist. The S&P 500 Index is a broad-‐based, unmanaged measurement of changes in stock market conditions based on the average of 500 widely held common stocks.

West Loop Realty Fund | Q3 Commentary
6
RISK AND OTHER DISCLOSURES: Effective September 30, 2014, the Fund changed its fund name from “Chilton Realty Income & Growth Fund” to “West Loop Realty Fund.” Chilton Capital Management, LLC remains as the Fund’s sub-‐advisor. The Fund’s investment objective, principal investment strategies and principal risks remain the same. Before investing you should carefully consider the West Loop Realty Fund’s investment objectives, risks, charges and expenses. This and other information about the Fund is in the prospectus and summary prospectus, a copy of which may be obtained by calling 800-‐ 207-‐7108 or by visiting the Fund’s website at www.libertystreetfunds.com. Please read the Fund’s prospectus or summary prospectus carefully before investing. An investment in the West Loop Realty Fund is subject to risk, including the possible loss of principal amount invested and including, but not limited to, the following risks, which are more fully described in the prospectus:
• The Fund invests in Real Estate Investment Trusts (REITs), which involve additional risks compared to those from investments in common stock. REITs are dependent upon management skills; generally may not be diversified; and are subject to heavy cash flow dependency, defaults by borrowers, self-‐liquidation, and tax risks.
• Investments in REITs involve risks including, but not limited to, market risk, interest rate risk, equity risk and risks related to the real estate market.
• The Fund will be closely linked to the performance of the real estate markets. The Real Estate industry is subject to certain market risks such as property revaluations, interest rate fluctuations, rental rate fluctuations and operating expenses, increasing vacancies, rising construction costs and potential modifications to government regulations.
• REITs are subject to declines in the value of real estate as it relates to general and local economic conditions and decreases in property revenues. Continued disruptions in the financial markets and deteriorating economic conditions could adversely affect the value of the Fund’s investments.
• As a non-‐diversified fund, the Fund may focus its assets in the securities of fewer issuers, which exposes the Fund to greater market risk than if its assets were diversified among a greater number of issuers.
• The Fund’s investments will be concentrated in the real estate sector. The focus of the Fund’s portfolio on a specific sector may present more risks than if the portfolio were broadly diversified over numerous sectors.
• Foreign investment risk. These risks include currency fluctuations, economic or financial instability, lack of timely or reliable financial information or unfavorable political or legal developments. Foreign companies are generally subject to different legal and accounting standards than U.S. companies.
• The Fund invests in small and mid-‐cap real estate companies, which may involve less trading and, therefore, a larger impact on a stock’s price than customarily associated with larger, more established company stocks.
• In order to qualify for the favorable tax treatment generally available to regulated investment companies, the Fund must satisfy certain diversification requirements. The Fund’s strategy of investing in a relatively small number of securities may cause it inadvertently to fail to satisfy the diversification requirements. If the Fund were to fail to qualify as a regulated investment company, it would be taxed in the same manner as an ordinary corporation, and distributions to its shareholders would not be deductible by the Fund in computing its taxable income.
The Fund may not be suitable for all investors. We encourage you to consult with appropriate financial professionals before considering an investment in the Fund. Distributed by Foreside Fund Services, LLC. www.foreside.com