l iquid c rystals p aul d upiano m andeep s ingh
Post on 19-Dec-2015
214 views
TRANSCRIPT

LIQUID CRYSTALSPAUL DUPIANO
MANDEEP SINGH

LIQUID OR SOLID? Liquid crystals are non-classical states of matter, which is
somewhere between a liquid and a solid. Flows like a liquid, but has orientational preference,
depicted by n vector below

TYPES• Liquid crystals can be categorized and
characterized by the type of ordering of the molecules.
• The orderings are – Nematic, Smectic, Chiral, Blue, Discotic.
• The above are phases of Thermotropic LCs only.
• Thermotropic phases are temperature sensitive.

NAMETIC PHASE• Nametic LCs are uniaxial i.e.
have 1 perfered orientation.• The molecules, however, are
scattered at random throughout the liquid solvent (mostly water).
• This is because of the polarity of the molecule, which is possibly due to the carbon and nitrogen bond.

5CB/C18H19NThermotropic LCNematic between 18°C and
35°CDue to relatively small size
London dispersion forces are relatively low, but the compound is highly polar.
The polarity is the main cause for viscosity.
The 5CB LC has an anti-parallel local structure.

Anisotropic Properties
•Properties are direction dependent
•Sanding with and against the grain of wood
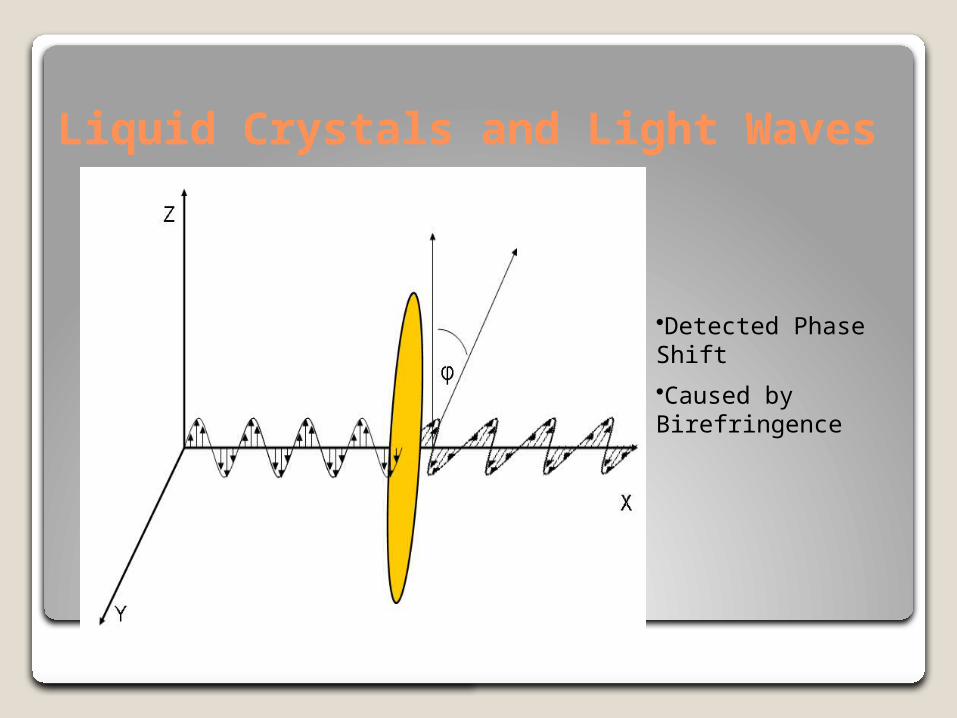
Liquid Crystals and Light Waves
•Detected Phase Shift
•Caused by Birefringence

Cross Polarizers
•Unpolarized Light
•Polarized Light in Z direction
•Electric Field Perpendicular to 2nd Polarizer
•No Light Passes Through

Cross Polarizers + Liquid Crystal
•Phase shift Occurs
•Electric field no longer perpendicular to Polarizer
•Light Passes through
•Same Principle in LCD

Defects
•Bright Areas as expected
•What do the dark areas represent?
• No phase shift in light
• Different phase shift from bulk
•Phase shift Orientational Order

Defects Schematically
•Central Defect affects other particles
• Induced Dipoles
• Based on Orientation
•Orientational disorder greatest towards central point
•Pinwheel Like appearance

How to Model Liquid Crystals
• Maeir-Saupe Theory• Focus on single
particle• Generalize
• As a Fluid • Non-Newtonian Fluid • Additional Properties
• Accounts for Orientation

Experimental Study
• Detecting Defects in Nematic Phase• Correlate Defects with forces affecting disorder
• Observing the formation of instabilities• Correlate instabilities with model predictions
• Promote the validity of new liquid crystal model

Liquid Crystals - Experiments on Horizontal Surface

Defects in Liquid Crystals• Nematic order breaks the rotational symmetry
during the isotropic phase• Singularities due to some odd boundary
conditions or external field which do not permit uniform orientation

Point Defects
Scale: 4.2 mm

Experiments on Horizontal Surface• Surfaces
• Glass Slide• Silicon Wafer
• Observed defects under the polarizing microscope• Rotated the polarizer to see the rotational disorder in the
liquid crystal
• Observed instabilities and instable spreading at comparatively lower relative humidity
• Took pictures using high speed camera• Room Humidifier – after the failure of humidity stage• Room Heater• Humidity and temperature sensor

Experiments (Continue)• Different experiments to increase relative
humidity• Slide covered with glass lid which was kept over the
humidifier • Covered the whole microscope with plastic and kept
humidifier on floor• Tried to humidify the whole room• Alcohol cotton on the edges of the slide

Instabilities• Different stages in Liquid Crystals at various
temperatures and increasing humidity• Fingerings• Usually occur at higher temperature and humidity
and start to develop at the boundary line• Temperature: between 24 and 28 degree Celsius• Relevant Humidity: between 60% and 80%
• Instable spreading • Temperature: between 24 and 28 degree Celsius• Relevant Humidity: greater than 80%

Results – Silicon Surface• Silicon Wafer
• Not any exciting behavior – opposite to what described in Poulard & Cazabat’s paper
• No spreading but instabilities at 40% RH and 25 degrees
Instabilities on Silicon surface
Scale: 4.5 mm

Results – Horizontal Surface
• Stable spreading at 40% RH and 25˚C• Glass Slide
Scale: 4.2 mm, Time = T1
Scale: 4.2 mmTime = T2
T2 > T1
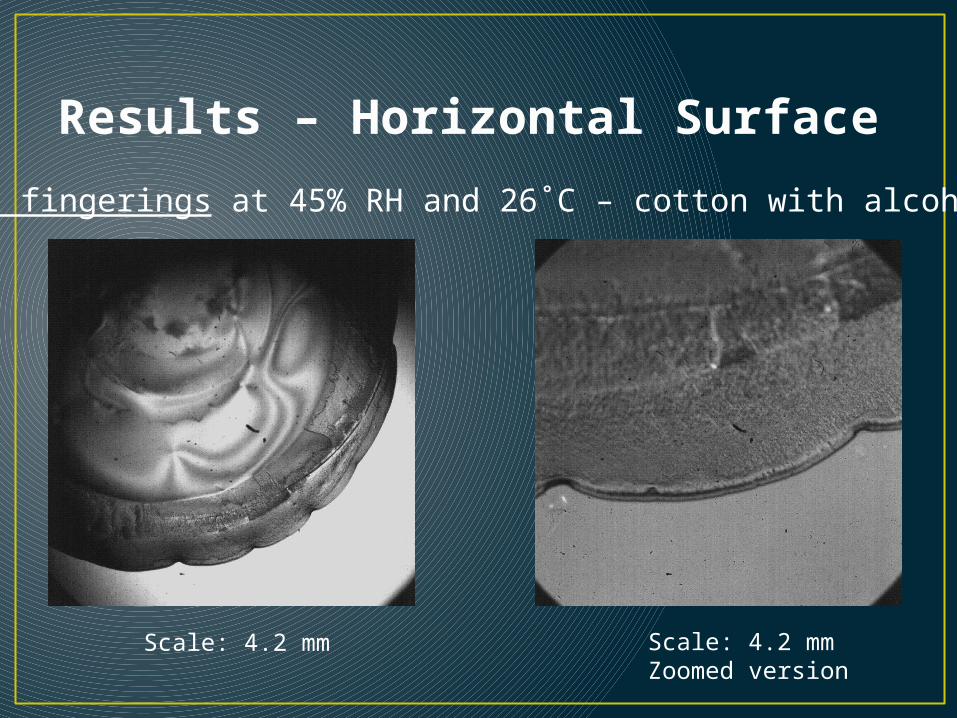
Results – Horizontal Surface
Instable fingerings at 45% RH and 26˚C – cotton with alcohol covered
Scale: 4.2 mm Scale: 4.2 mmZoomed version

Results – Horizontal Surface
Instable spreading at 90% RH and 28˚C – glass lid covered on the glass slide
Scale: 4.2 mm Scale: 4.2 mm

Liquid Crystals Inclined Plane

Formation of instabilities Accumulation of fluid on a strip Formation of the droplets Surface tension and gravity Spreading down an incline surface.
Spreading on inclined surface

Surfaces Silicon Wafer
Liquid Crystals down an inclined plane Depositing liquid crystals on surface Different angles Multiple fingers Distance between the fingers and the distance travel
Observed behavior Strange behavior of liquid crystals on an incline
plane Observed under the microscope after some time
Experiments on an Inclined Plane

Different methods applied Micro-Syringe Syringe and Glass Slide
Liquid crystals surrounded by alcohol cotton Glass Slide passing against moving fluid Glass slide, Silicon Wafer and Syringe Single Glass Slide Two Glass Slide
Pictures
Experiments (Continue)

Results - Inclined Plane
Silicon Wafer◦ Instabilities at a 45 degree angle

Strange behavior of Liquid Crystals down an inclined plane
ResultsInclined Plane
Scale: 1.05mm

Spreading at 15º angle
Spreading down an incline
Scale: 1.05mm

Parameters of Equation and Estimations

Equation and Parameters
• C: surface tension• B: how fast the system wants to move• N: how we know it is liquid crystal• u: effects of gravity

Equations of Parameters
•

Reductions• Plugging L into U leaves:
• Plugging U into C causes the following reduction:
• Plugging U and L into B makes:
• In the incline plane example, we use:• with instead because takes into consideration the angle of incline.

Numerical Values• Known Values• Surface Tension: • Density: • Viscosity: • Gravity:

Scale Values• After substitutions:• The value δ is a scale factor given by:• where H is the height of the NLC and L is the capillary length
above

Comparisons to Experiments• We take , which is a good value based on our experimental
data.• This yields:
• Experimentally, we saw values of between:• and
• The difference in values come from the change in velocity as the liquid thins.