l. g och – f ebruary 2011 spc & msa using minitab
TRANSCRIPT
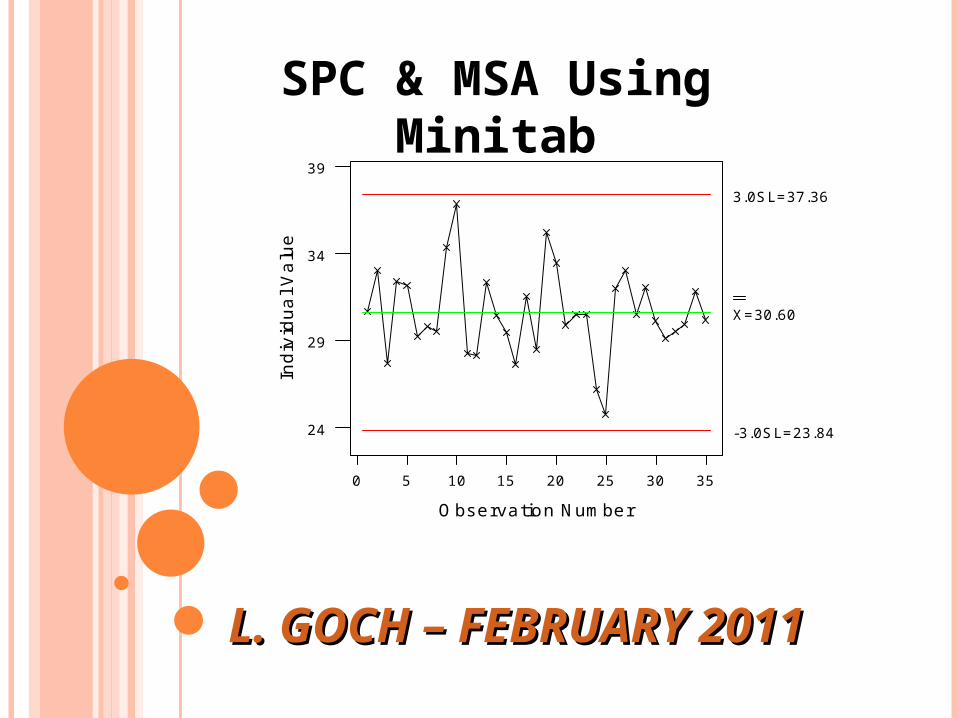
35302520151050
39
34
29
24
Observation Number
Indi
vidu
al V
alu
e
I Chart for C1
X=30.60
3.0SL=37.36
-3.0SL=23.84
L. GOCH – FEBRUARY L. GOCH – FEBRUARY 20112011
SPC & MSA Using Minitab

AGENDAContinuous & Attribute Data IMR Charts Xbar & R Charts Xbar & S Charts
MSAs Using Xbar & S Charts for MSAs Non-Destructive Variable MSAs
(NOTE: Minitab will also Analyze Destructive Variable MSAs & Attribute MSAs)
SPC & MSA using Minitab.mtb

DATA PLOTTED OVER TIME
MO
NIT
OR
ED
C
HA
RA
CT
ER
IST
IC
UCL
Center Line
LCL
UCL = Upper Control Limit / LCL = Lower Control Limit
Plotted Data
THE BASIC CONTROL CHARTKEY COMPONENTS
Control Limits are Control Limits are NOT NOT Spec Spec LimitsLimits

COMMON CAUSES VS SPECIAL CAUSES

Individual-X & Individual-X &
Moving Range ChartMoving Range Chart

CONTROL CHARTSINDIVIDUAL /MOVING RANGE
Use: When only have 1 measurement per time period When want to chart Counts. When want to chart Percentages (%’s).
Do NOT use P-Charts if the values are <10% or subgroup sample size >100 since it violates basic P-Chart assumptions.
Need a minimum of 10 data points
Variation Short Term: Measures relatively rapid changes over
time (Moving Range chartMoving Range chart) Long Term: Measures relatively gradual changes over
time(Individuals chartIndividuals chart)
Charts are Based on a Subgroup Size of 1

I / MR CHART: STAT > CONTROL CHARTS > I-MR
Open worksheet Exh_QC.mtwExh_QC.mtw
I-MR Chart analyzes individual data over time.

I / MR CHART: STAT > CONTROL CHARTS > RUN CHART
Rule #1

Is there a shift at Observation # 25?Is there a shift at Observation # 25?
MINITAB EXERCISEINDIVIDUALS / MOVING RANGE OUTPUT
454137332925211713951
1050
1000
950
900
850
Observation
Indiv
idual V
alu
e
_X=936.9
UCL=1010.9
LCL=862.8
454137332925211713951
100
75
50
25
0
Observation
Movin
g R
ange
__MR=27.8
UCL=91.0
LCL=0
11
2
2
2
2
6
1
1
6
5
1
2
2
22
22
2
1
222
22
66
6
1
I-MR Chart of Weight

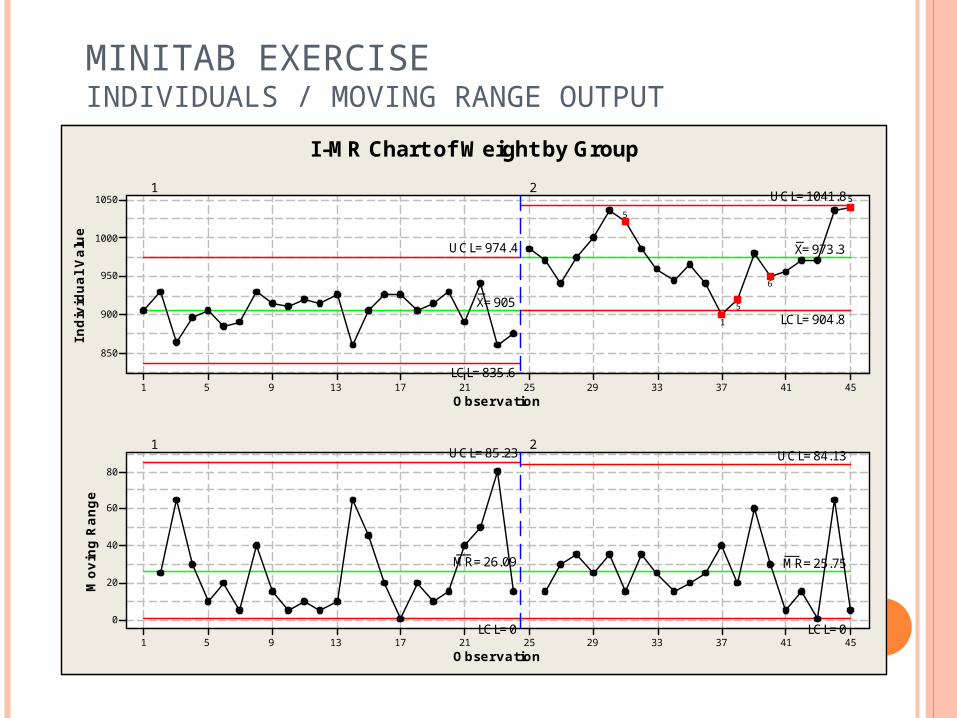
MINITAB EXERCISEINDIVIDUALS / MOVING RANGE OUTPUT
Group Group ColumColumn n AddedAdded
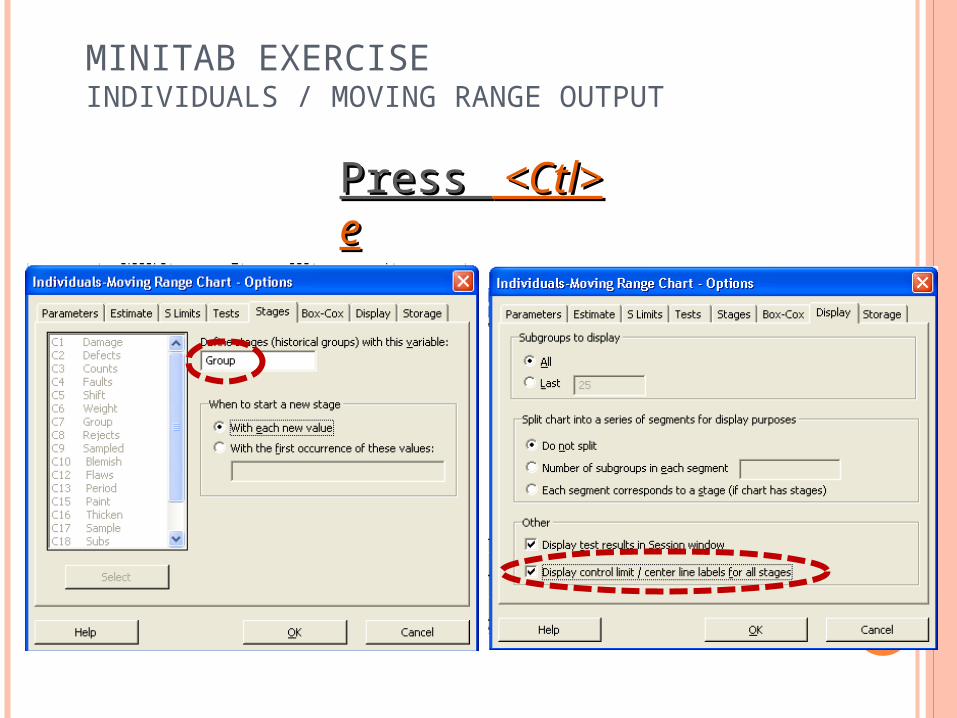
MINITAB EXERCISEINDIVIDUALS / MOVING RANGE OUTPUT
Press Press <Ctl> <Ctl> ee
MINITAB EXERCISEINDIVIDUALS / MOVING RANGE OUTPUT
454137332925211713951
1050
1000
950
900
850
Observation
Indiv
idual V
alu
e
_X=905
_X=973.3UCL=974.4
UCL=1041.8
LCL=835.6
LCL=904.8
1 2
454137332925211713951
80
60
40
20
0
Observation
Movin
g R
ange
__MR=26.09
__MR=25.75
UCL=85.23 UCL=84.13
LCL=0 LCL=0
1 2
5
6
5
1
5
I-MR Chart of Weight by Group
Xbar & R ChartXbar & R Chart

CONTROL CHARTSX BAR / R CHART
AdvantagesAdvantagesSensitive to changes in data
Limitation Limitation Unlike the Individual Chart, the Xbar Chart control limits do not represent the overall data range. They represent the range of the subgroup averages.

CONTROL CHARTSX-BAR / R CONTROL CHARTS
GATHERING DATAGATHERING DATADefine rational basis for subgroupingSelect sample size for the subgroupsSelect sampling frequencyNeed a minimum of 10 subgroups
VARIATIONVARIATION Short Term: Measures the variation within the
Subgroups based on the subgroup range (Range chart) Long Term: Measures the variation between the
Subgroups based on the subgroup average (X Bar chart)

XBAR-R CHARTS: STAT > CONTROL CHARTS > VARIABLES CHARTS FOR SUBGROUPS > XBAR-R
Open worksheet Camshaft.mtwCamshaft.mtw

MINITAB EXERCISE - XBAR / R CHARTS OUTPUT
What do the Charts tell us?
We need to look at the individual suppliers.
191715131197531
602
601
600
599
598
Sample
Sam
ple
Mean
__X=600.072
UCL=601.722
LCL=598.422
191715131197531
6.0
4.5
3.0
1.5
0.0
Sample
Sam
ple
Range
_R=2.860
UCL=6.048
LCL=0
1
Xbar-R Chart of Length

MINITAB EXERCISE - XBAR / R CHARTS
o Stack Data:Stack Data:Stack the 2 Suppliers so the data can be looked at together on the same chart

MINITAB EXERCISE - XBAR / R CHARTS
37332925211713951
602
600
598
Sample
Sam
ple
Mean
__X=599.548
__X=600.23UCL=600.321
UCL=602.474
LCL=598.775
LCL=597.986
Supp1 Supp2
37332925211713951
8
6
4
2
0
Sample
Sam
ple
Range
_R=1.341
_R=3.890
UCL=2.835
UCL=8.225
LCL=0 LCL=0
Supp1 Supp2
1
6
1
Xbar-R Chart of Lengths by Supplier

Xbar & S ChartXbar & S Chart

CONTROL CHARTSX BAR / S CHART
AdvantagesAdvantages Very sensitive to changes in data. Also, the center line of the S-Chart
provides a good estimate for the data’s standard deviation.
Limitation Limitation The Xbar Chart control limits do not represent the overall data range. They represent the range of the subgroup averages.

CONTROL CHARTSX-BAR / S CONTROL CHARTS
GATHERING DATAGATHERING DATADefine rational basis for subgroupingAn S-Chart is typically used when the
subgroup’s sample size is > 9Select sampling frequencyNeed a minimum of 10 subgroups
VARIATIONVARIATION Short Term: Measures the variation within the
Subgroups based on the subgroup stddev (S chart) Long Term: Measures the variation between the
Subgroups based on the subgroup average (X Bar chart)
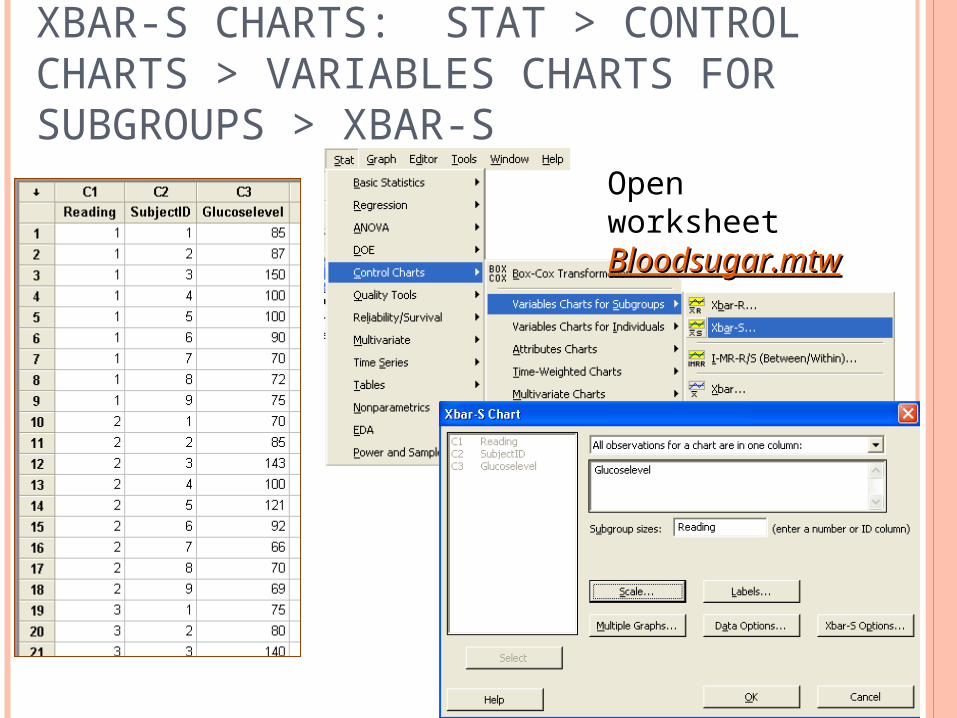
XBAR-S CHARTS: STAT > CONTROL CHARTS > VARIABLES CHARTS FOR SUBGROUPS > XBAR-S
Open worksheet Bloodsugar.mtwBloodsugar.mtw

MINITAB EXERCISE - XBAR / S CHARTS OUTPUT
What do the Charts tell us?
We need to look at the individual people.
191715131197531
120
100
80
Sample
Sam
ple
Mean
__X=101.03
UCL=130.72
LCL=71.35
191715131197531
50
40
30
20
10
Sample
Sam
ple
StD
ev
_S=28.77
UCL=50.67
LCL=6.88
Xbar-S Chart of Glucoselevel

MINITAB EXERCISE - XBAR / S CHARTS
o Sort Data:Sort Data:Sort the data by SubjectID & Reading

MINITAB EXERCISE – I-MR CHARTS
16314512710991735537191
200
150
100
50
Observation
Indiv
idual V
alu
e
1 2 3 4 5 6 7 8 9
16314512710991735537191
60
45
30
15
0
Observation
Movin
g R
ange
1 2 3 4 5 6 7 8 9
1
1
66
6
155
51
66
5
1
1111
8
68
151
1
65
56
1
1
11
1
11
1
1
1
I-MR Chart of Glucoselevel by SubjectID

Xbar & S Charts used Xbar & S Charts used for MSA’sfor MSA’s

MSA: X BAR / S CHART
AdvantagesAdvantages Pictorial look at MSA results Measurement error can easily be calculated
% R&R and %P/T can easily be calculated Daily Calibration Data can be used
Limitation Limitation Will NOT detect measurement that varies by
nominal value (e.g. large parts having more or less measurement error than small parts)

MSA: X-BAR / S CHART
GATHERING DATAGATHERING DATANeed Multiple measurements per time periodCan use 1 or more PartsNeed a minimum of 10 subgroups
VARIATIONVARIATION S Chart: Displays the Measurement Error. A good
measurement system will be in-control Xbar Chart: Displays any Drift over time in the
average measurements. A good measurement system will be in-control for each individual Part.

MSA: X-BAR / S CHART
Multiple Multiple Measurements Measurements per Day on per Day on mostmost Days.Days.
1 Calibration Part 1 Calibration Part per Facilityper Facility
3 Facilities3 Facilities Sorted Sorted by Facility by Facility
Date & TimeDate & Time
Open worksheet Daily Calibration Daily Calibration Data.mtwData.mtw

XBAR-S CHARTS: STAT > CONTROL CHARTS > VARIABLES CHARTS FOR SUBGROUPS > XBAR-S
Open worksheet Daily Calibration Daily Calibration Data.mtwData.mtw

MSA: X-BAR / S CHART OUTPUT
Need to add the Measurement Error.
Nov-23Nov-16Nov-09Nov-03Nov-26Nov-13Nov-04Nov-29Nov-19Nov-09Nov-02
600
550
500
450
400
Date
Sam
ple
Mean
__X=511.8
__X=500.8
__X=538.8
UCL=594.3 UCL=604.2
UCL=560.2
LCL=429.3
LCL=397.4
LCL=517.5
DHM DSM GSO
Nov-23Nov-16Nov-09Nov-03Nov-26Nov-13Nov-04Nov-29Nov-19Nov-09Nov-02
100
75
50
25
0
Date
Sam
ple
StD
ev
_S=31.0
_S=27.5
_S=8.0
UCL=101.4
UCL=89.8
UCL=26.2
LCL=0 LCL=0 LCL=0
DHM DSM GSO
1
1
2222
1
1
1
Xbar-S Chart of Actual Measurement by Facility
Tests performed with unequal sample sizes

MSA: X-BAR / S CHART RESULTS
CommentsCommentsSpec is +/- 50. %P/T target is < 30%None of Facilities meet the measurement
error targetDaily Calibration Check procedures need
investigated since producing dramatically different results
Facilitly ~Sbar
Multiplier ~ Meas Error
%P/T
DHM 31.0 2.575 +/- 80 80/50 = 160%
DSM 27.5 2.575 +/- 71 71/50 = 142%
GSO 8.0 2.575 +/- 21 21/50 = 42%

Variables MSA Variables MSA (Non-Destructive Testing)(Non-Destructive Testing)

VARIABLES MSA: STAT > QUALITY TOOLS> GAGE STUDY > GAGE R&R STUDY (CROSSED)
Minimum RequirementsMinimum RequirementsMinimum 10 parts: ~3 at low end of
spec, ~4 parts in middle of Spec, ~3 parts at high end of spec (NOTE: some parts should be out of spec)
3 Operators (NOTE: if only 1 operator measures parts, 1 operator may be used for MSA)
3 Repeated Measurements
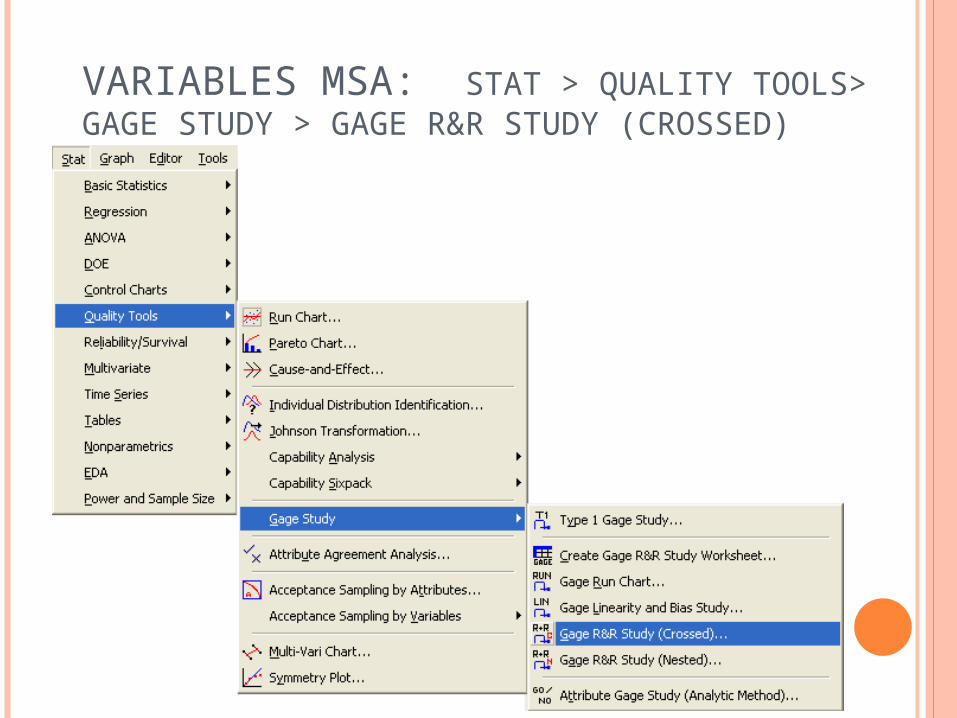
VARIABLES MSA: STAT > QUALITY TOOLS> GAGE STUDY > GAGE R&R STUDY (CROSSED)

VARIABLES MSA: STAT > QUALITY TOOLS> GAGE STUDY > GAGE R&R STUDY (CROSSED)

VARIABLES MSA: GRAPH RESULTS
Part-to-PartReprodRepeatGage R&R
100
50
0
Perc
ent
% R&R
% P/T
1.0
0.5
0.0
Sam
ple
Range
_R=0.342
UCL=0.880
LCL=0
A B C
14
12
10
Sam
ple
Mean
__X=12.201
UCL=12.551
A B C
LCL=11.852
10987654321
14
12
10
Part
CBA
14
12
10
Operator
10 9 8 7 6 5 4 3 2 1
14
12
10
Part
Ave
rage
ABC
Operator
Gage name: Gage 1Date of study: Feb 18. 2011
Reported by: Lisa GochTolerance: 8-16Misc:
67.1%
96.0%
14.6%20.9%
12.9%18.4%19.5%
27.9%
Components of Variation
R Chart by Operator
Xbar Chart by Operator
Measurement by Part
Measurement by Operator
Operator * Part Interaction
Gage R&R (ANOVA) for Measurement

VARIABLES MSA: SESSION WINDOW RESULTS
Measurement Error: +/- 0.78 (i.e. 1.55721/2 = 0.78)
Both the Part & the Operator significantly effect the part measurements.

SPC/MSA - SUMMARY
The reliability of Control Charts are dependent on the selection of Rational Subgroups. Pick the wrong subgroup and the results can be very misleading.
The reliability of MSAs are dependent on the selection of the actual Parts. Pick Parts with too much or too little variation between them and the results can be very misleading.