l brands to separate into two leading retail companies to
TRANSCRIPT
L Brands to Separate into Two Leading Retail Companies to Maximize Long-Term Value Creation
June 21, 2021

2
Forward Looking Statements
• the spin-off may not be consummated within the anticipated time period or at all;• disruption to our business in connection with the proposed spin-off and that we could
lose revenue as a result of such disruption; • the spin-off may not be tax-free for U.S. federal income tax purposes; • a loss of synergies from separating the businesses that could negatively impact the
balance sheet, profit margins or earnings of both businesses or that the companies resulting from the spin-off do not realize all of the expected benefits of the spin-off;
• the combined value of the common stock of the two publicly-traded companies willnot be equal to or greater than the value of our common stock had the spin-off notoccurred;
• general economic conditions, consumer confidence, consumer spending patterns and market disruptions including pandemics or significant health hazards, severe weather conditions, natural disasters, terrorist activities, financial crises, political crises or other major events, or the prospect of these events;
• the novel coronavirus (COVID-19) global pandemic has had and is expected to continue to have an adverse effect on our business and results of operations;
• the seasonality of our business;• difficulties arising from turnover in company leadership or other key positions;• our ability to attract, develop and retain qualified associates and manage labor-related
costs
• the dependence on mall traffic and the availability of suitable store locations on appropriate terms;• our ability to grow through new store openings and existing store remodels and expansions;• our ability to successfully operate and expand internationally and related risks;• our independent franchise, license and wholesale partners;• our Digital channel businesses;• our ability to protect our reputation and our brand images;• our ability to attract customers with marketing, advertising and promotional programs;• our ability to maintain, enforce and protect our trade names, trademarks and patents;• the highly competitive nature of the retail industry and the segments in which we operate;• consumer acceptance of our products and our ability to manage the life cycle of our brands, keep up
with fashion trends, develop new merchandise and launch new product lines successfully;• our ability to source, distribute and sell goods and materials on a global basis, including risks related
to:• political instability, environmental hazards or natural disasters;• significant health hazards or pandemics, which could result in closed factories, reduced
workforces, scarcity of raw materials, and scrutiny or embargoing of goods produced in infected areas;
• duties, taxes and other charges;
Safe Harbor Statement Under the Private Securities Litigation Reform Act of 1995
We caution that any forward-looking statements (as such term is defined in the Private Securities Litigation Reform Act of 1995) contained in this presentation or made by our Company or our management involve risks and uncertainties and are subject to change based on various factors, many of which are beyond our control. Accordingly, our future performance and financial results may differ materially from those expressed or implied in any such forward-looking statements. Words such as “estimate,” “project,” “plan,” “believe,” “expect,” “anticipate,” “intend,” “planned,” “potential” and any similar expressions may identify forward-looking statements. Risks associated with the following factors, among others, in some cases have affected and in the future could affect our financial performance and actual results and could cause actual results to differ materially from those expressed or implied in any forward-looking statements included in this presentation or otherwise made by our company or our management::

3
Safe Harbor Statement Under the Private Securities Litigation Reform Act of 1995
We are not under any obligation and do not intend to make publicly available any update or other revisions to any of the forward-looking statements contained in this presentation to reflect circumstancesexisting after the date of this presentation or to reflect the occurrence of future events even if experience or future events make it clear that any expected results expressed or implied by those forward-looking statements will not be realized.
Non‐GAAP Financial MeasuresThis presentation contains financial measures which have not been calculated in accordance with United States generally accepted accounting principles (“GAAP”), because they are a basis upon which our management assesses our performance and we believe they reflect the underlying trends and indicators of our business. Although we believe these measures may be useful for investors for the same reasons, these financial measures should not be considered as an alternative to GAAP financial measures as a measure of the Company’s financial condition, profitability and performance or liquidity. In addition, these financial measures may not be comparable to similar measures used by other companies. In the Appendix to this presentation, we provide further descriptions of these non-GAAP measures and reconciliations of these non-GAAP measures to the corresponding most closely related GAAP measures.
• legal and regulatory matters;• volatility in currency exchange rates;• local business practices and political issues;• potential delays or disruptions in shipping and transportation and related pricing
impacts;• disruption due to labor disputes; and
• changing expectations regarding product safety due to new legislation;• our geographic concentration of vendor and distribution facilities in central Ohio;• fluctuations in foreign currency exchange rates;• the ability of our vendors to deliver products in a timely manner, meet quality standards
and comply with applicable laws and regulations;• fluctuations in product input costs;• our ability to adequately protect our assets from loss and theft;• fluctuations in energy costs;• increases in the costs of mailing, paper, printing or other order fulfillment logistics;
• claims arising from our self-insurance;• our and our third-party service providers' ability to implement and maintain.• information technology systems and to protect associated data;• our ability to maintain the security of customer, associate, third-party and company information;• stock price volatility;• our ability to pay dividends and related effects;• shareholder activism matters;• our ability to maintain our credit rating;• our ability to service or refinance our debt and maintain compliance with our restrictive covenants;• our ability to comply with laws, regulations and technology platform rules or other obligations related
to data privacy and security;• our ability to comply with regulatory requirements;• legal and compliance matters; and• tax, trade and other regulatory matters
Forward Looking Statements

4
Creating Two Industry-Leading Independent Publicly Traded Retailers
#1 Specialty Home Fragrance & Fragrant Body Care in North America #1 U.S. Lingerie Brand
1,752Stores Across the U.S. and Canada
299InternationalFranchise Locations
30%LTM Q1 2021
Digital Penetration
$7.1bnLTM Q1 2021
Revenue
$2.1bnLTM Q1 2021
Operating Income
929Stores Across the
U.S., Canada and China
458InternationalFranchise Locations
43%LTM Q1 2021
Digital Penetration
$6.1bnLTM Q1 2021
Revenue
$600mmLTM Q1 2021
Adjusted Operating Income2
Mid to High-Single Digit Revenue GrowthLow to Mid-20’s Operating Income Rate
Mid-Single Digit Revenue GrowthMid-Teens Operating Income Rate
Differentiated Long-Term (3-5 years) Targets
Source: 1Data as of Q1 2021; 2See reconciliation of reported to adjusted results in the Appendix

5
Compelling Strategic Rationale for Separation
5
Creates two industry-leading, highly-focused retailers
Distinct strategic and management focus on specific operational and growth priorities
Differentiated investment opportunities, aligning each company with its natural shareholder base
Ability for the investment community to value each business independently and enhance shareholder value
Tailored capital deployment strategies based on each company’s operating and financial model
5

6
Bath & Body Works at a Glance
6Source: 1 Fiscal Year 2020 BBW net sales for US and Canada; 2Fiscal Year 2020 BBW net sales; 3U.S. and Canada store sales; 4BBW segment as reported
Category dominant: The Specialty Fragrance Retailer
Sustained track record of double-digit topline growth (12% prior 5-year CAGR) and success with true omnichannel presence including best-in-class
digital penetration
Highly profitable across all locations in U.S. and Canada with a diverse real estate portfolio across venue tiers and types
Numerous powerful levers to drive future growth at high and consistent margins
Highly-experienced management team with the right focus to execute on strategies for increased shareholder value
Investment Highlights
Balanced Channel Mix2
+47%3Stores sales growth Q1 ‘21 vs. Q1 ‘19
+123%Digital net sales growth
Q1 ‘21 vs. Q1 ‘19
Home Fragrance(~40%)
Soaps & Sanitizers(~20%)
Body Care &Fragrance (~35%)
Category Mix1
+127%4Increase in operating
income Q1 ‘21 vs. Q1 ‘19
31%
31%
35%
3%

7
Continued Execution at Bath & Body Works Creates Opportunities for Long-Term Growth
7
Growth in Existing Categories Will continue to innovate and drive the market through new forms, new
fragrances and additional products
New or Adjacent Categories Opportunities for growth in new categories including hair care, skin care
and organic/naturals product lines
Continued Momentum in Digital Channels Continuing to invest in capabilities to provide an exceptional customer
experience
International Expansion Additional growth opportunities through expansion of geographies, stores
and digital sales
Growth DriversFinancial Summary
BBW Adjusted Operating Income ($ in millions)2
2See reconciliation of reported to adjusted results in the Appendix
Digital penetration1 16% 19% 32%
Note: 1Bath & Body Works Digital net sales % of BBW U.S. and Canada
% sales 23% 23% 28%
30%
30%
BBW Revenue ($ in millions)
$4,776 $5,356 $6,434 $7,143
2018 2019 2020 Q1 '21 LTM
$1,103 $1,224$1,832 $2,136
2018 2019 2020 Q1 '21 LTM

8
Bath & Body Works – Three to Five Year Financial Targets
8
Metric Target
U.S. and Canada Store Comps Growth Low to mid-single digit
U.S. and Canada Square Footage Growth Low-single digit
Digital Channel Sales Growth High-single digit to mid-teens
International Sales Growth High-teens to low-twenties
Total Sales Growth Mid to high-single digit
Operating Income Growth Mid to high-single digit
Operating Income Rate Low to mid-twenties
99
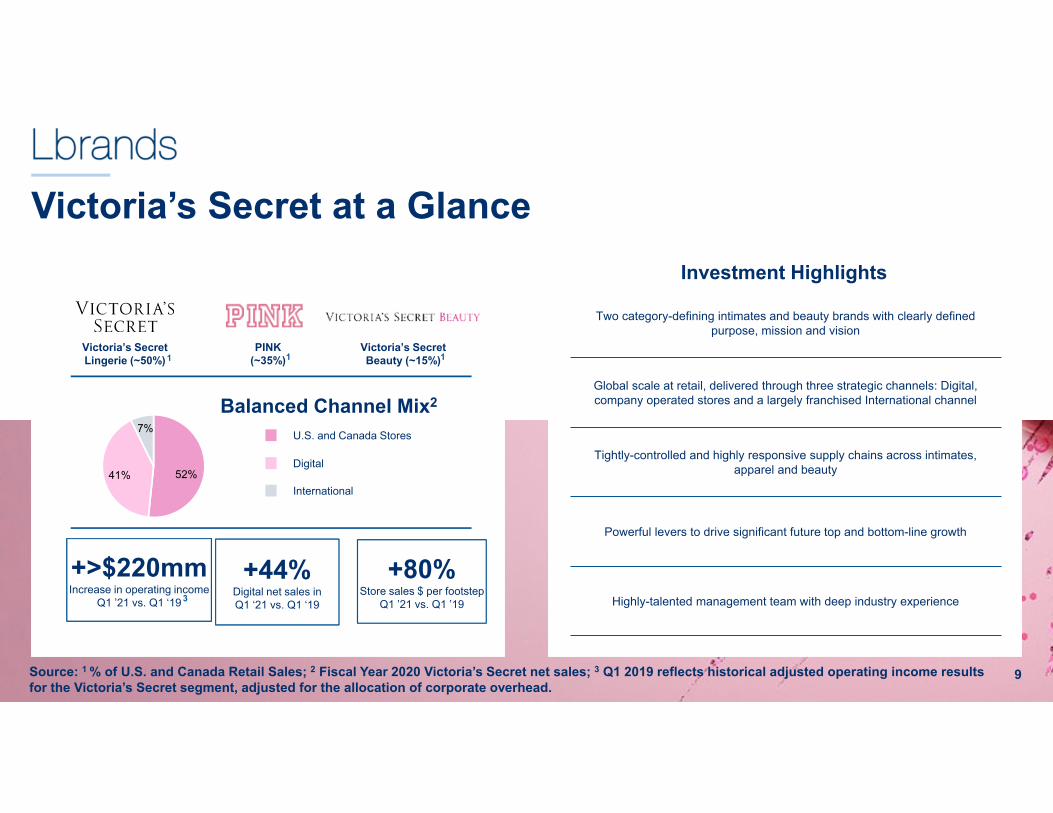
Victoria’s Secret at a Glance
Source: 1 % of U.S. and Canada Retail Sales; 2 Fiscal Year 2020 Victoria’s Secret net sales; 3 Q1 2019 reflects historical adjusted operating income results for the Victoria’s Secret segment, adjusted for the allocation of corporate overhead.
Two category-defining intimates and beauty brands with clearly defined purpose, mission and vision
Global scale at retail, delivered through three strategic channels: Digital, company operated stores and a largely franchised International channel
Tightly-controlled and highly responsive supply chains across intimates, apparel and beauty
Powerful levers to drive significant future top and bottom-line growth
Highly-talented management team with deep industry experience
Investment Highlights
52% 41%
7% U.S. and Canada Stores
International
Digital
Balanced Channel Mix2
+80%Store sales $ per footstep
Q1 ’21 vs. Q1 ’19
+>$220mmIncrease in operating income
Q1 ’21 vs. Q1 ‘19
+44%Digital net sales inQ1 ‘21 vs. Q1 ‘19
PINK(~35%)
Victoria’s SecretBeauty (~15%)
Victoria’s SecretLingerie (~50%)1 1 1
3

10
Evolve Merchandise Assortment and Marketing to Inspire Women Around the World with Products and Experiences that Uplift and Champion Them
Continue to Drive Penetration and Growth in our Digital Channel Believe that our global brands and our scaled retail footprint in U.S. and Canada is a
unique platform to continue to grow our digital business Omni-channel initiatives, including buy online pick-up in store, and an increased focus
on mobile and application interactions
Expand our International Business Increase our international store count, enabled by a new store design, lower costs and
flexible store formats Country-specific web platforms tailored to local languages and preferences and
through additional regional expansion
Continue Optimizing Customer Experience through Elevated and Profitable Company-Operated Stores Refreshing existing stores and working towards a store of the future that will include
smaller, more flexible space to meet the needs of our customer and accommodate shifting consumer preferences for omni-channel shopping
Victoria’s Secret is Well Positioned for Long-Term Sustainable Growth
10
Growth DriversFinancial SummaryVictoria’s Secret Revenue ($ in millions)
Victoria’s Secret Adjusted Operating Income ($ in millions)2
Digital penetration1 24% 25% 44%
1 Victoria’s Secret digital sales % of VS U.S. and Canada 2See reconciliation of reported to adjusted results in the Appendix
% sales 6% 1% 2%
43%
10%
$8,103 $7,509 $5,413 $6,073
2018 2019 2020 Q1 '21 LTM
$481
$81 $98
$600
2018 2019 2020 Q1 '21 LTM

1111
Metric Target
Total Sales Growth
Digital Penetration
Mid-single digit
~50%
Operating Income Growth High-single digit
Operating Income Rate Mid-teens
Victoria’s Secret – Three to Five Year Financial Targets

12
Transaction Details
12

13
Pathway to Completion
13
Transaction Structure
Planned as a tax-free spin-off of Victoria’s Secret to L Brands shareholders
Timing & Other Matters
Financial Implications
Both companies expected to be well-capitalized with flexibility to fund growth priorities and capital allocation strategies
Each company will set its own capital allocation policies
Expected to be completed by August 2021, subject to customary closing conditions including, but not limited to:
• Effectiveness of a Form 10 registration statement on file with the U.S. SEC
• Receipt of a tax opinion of legal counsel with respect to the tax-free nature of the separation
• Final approval from L Brands’ Board of Directors
Public company leadership roles in place and Victoria’s Secret & Co. board members named
Both businesses are planning investor days to further communicate strategy, growth opportunities and capital structure

14
Appendix
14

15
Bath & Body Works ‐ Adjusted Operating Income Reconciliation($ in millions)
2018 2019 2020 Q1 2021 TTM Q1 2021 Q1 2020Operating Income ‐ GAAP 1,103$ 1,224$ 1,821$ 2,125$ 380$ 76$ Restructuring Charges1 ‐$ ‐$ 11$ 11$ ‐$ ‐$ Adjusted Operating Income 1,103$ 1,224$ 1,832$ 2,136$ 380$ 76$
Adjusted Operating Income % of Sales 23% 23% 28% 30% 26% 10%
1In the second quarter of 2020, we recognized pre‐tax severance charges of $11 million related to restructuring activities.

16
Victoria's Secret ‐ Adjusted Operating Income (Loss) Reconciliation($ in millions)
2018 2019 2020 Q1 2021 TTM Q1 2021 Q1 2020Operating Income (Loss) ‐ GAAP 400$ (892)$ (101)$ 498$ 226$ (373)$ Asset Impairments 1 81$ 253$ 214$ 117$ ‐$ 97$ Restructuring Charges 2 ‐$ ‐$ 51$ 51$ ‐$ ‐$ Hong Kong Store Closure and Lease Termination 3 ‐$ ‐$ (36)$ (36)$ ‐$ ‐$ Establishment of Victoria's Secret U.K. and Ireland Joint Venture 4 ‐$ ‐$ (30)$ (30)$ ‐$ ‐$ Impairment of Goodwill 5 ‐$ 720$ ‐$ ‐$ ‐$ ‐$ Adjusted Operating Income (Loss) 481$ 81$ 98$ 600$ 226$ (276)$
Adjusted Operating Income % of Sales 6% 1% 2% 10% 15% ‐31%
1We recognized pre‐tax impairment charges of $97 million and $117 million related to certain store and lease assets in the first and second quarter of 2020, respectively. We recognized pre‐tax impairment charges of $218 million and $35 million related to certain store and lease assets in the third and fourth quarter of 2019, respectively. In the third quarter of 2018, we recognized an $81 million pre‐tax impairment charge related to certain store assets.2In the second quarter of 2020, we recognized pre‐tax severance charges of $51 million related to restructuring activities.3In the second quarter of 2020, we recognized a net pre‐tax gain of $36 million related to the closure and termination of our lease for the Hong Kong flagship store.4In the third quarter of 2020, we recognized a pre‐tax gain of $30 million related to the establishment of a joint venture for the U.K. and Ireland business with Next PLC.5In the fourth quarter of 2019, we recognized a $690 million pre‐tax goodwill impairment charge related to the North America reporting unit. In the third quarter of 2019, we recognized a $30 million goodwill impairment charge (no tax impact) related to the Greater China reporting unit.