l 2e2lseo sshh e - ornl.gov
TRANSCRIPT

L 2E2LSEO SShh E
1

' _ '_" ' ' -7 ................... ~ ~ .~ .. ~
.................... ~ .... .... .. . ...... .. ~ . . . . . . . . . . . . . . . . . . .

Central Research Library 4500N, MS-6191
ION AL LA3Q R AT0 RY MANAGFD 6%' MARTIN MARIETTA ENERGY SYSTEMS. ING FOR THE II 5 DEPARTMENT OF ENERGY
POST OFFICE BOX 2008 OAK RIDGE, TENNESSEE 37831
January 6, 1993
To: Recipients of subject report
Report No.: ORNL/TM-12036 Classification: Unclassified
Authors: J. E Walker, J. J. Pernna, S. M. R ~ b ~ n ~ ~ ~
Subject: Valley Storage Tanks
was pcintd with d the back and aEix e
haical error on page 19. Attacked is a. replacement page. to your eopy(ics) of the report.
We regret any inconvenience this error may have caiesed and appreciate your coopcration in correcting it.

I ! . I
y j - IN-TANK EYAPORA'IOR DEMONSTRATIONS DURDNG lM/l991
AT THE ORNL MELTON VALLEY SKIRAGE TANKS
J. E Walker, Jr. J. J. Perona
S. M. Robinson
Engineering Development Section Chemical Technology Division
Oak Ridge National Laboratory* Oak Ridge, Tennessee 37831
Date Published: October 1992
'Managed by Martin Marietta Energy Systems, Inc., for the U.S. Department of Energy under contract DE-AcX35-84OR21400.
3 4456 0 3 6 7 2 3 2 7


ABSTRACT ........................................................ 1
1 . INTRODUCTION ................................................. 1
2 SYSEMDESCRIPTION ........................................... 5
3 . EVALUATION OF ITE PERFORMANCE ............................. 7 3.1 In-Tank Evaporation Performance Data .......................... 8 3.2 Calculation of Approach to Saturation of Exit Air ................... 3.3 Equipment Operation ........................................ 9 3.4 Projected In-Tank Evaporation Effectiveness ......................
8
10
4 . COMPARISON WlTH IN-TANK EVAPORATION MODEL PREDICTIONS ............................................... 13
5 . METHODS TO ENHANCE EVAPORATION RATES ................... 15 5.1 Increasing the Air Sparge Rate ................................ 15 5.2 VaultHeating ............................................. 17 5.3 Out-of-Tank Evaporation .................................... 18
6 . SUMMARYANDRECOMMENDATIONS ............................ 21
7 . REFERENCES .................................................. 23
Appendix CALCULATION OF PERCENT SATURATION FOR SPARE AIR ... 25
iii


IN-TANK EVAPORATION AT TKE O W MELTON VALL;Ey SK)RAGE TANKS
J. E Walker, Jr. J. J. Perona
S. M. Robinson
The results of this report indicate that in-tank evaporation (ITE) should be continued to reduce the inventory of supernate in the Melton Valley Storage Tanks (MVST) until additiona1 storage tanks and/or treatment facilities can be installed. Several equipment problems were encountered during the initial operation of the ITE. All of these have been addressed with the exception of the replacement of the air compressor that was originally used in the hydrofracture process and the intermittent wetting of the high efficiency particulate air (HEPA) filters. The compressor is being replaced with a unit that is designed €or continuous operation. Filter wetting needs further investigation. ITE will help reduce the supernate inventory in the W S T using the existing equipment but will not eliminate the need for solidification campaigns. Several options are available to increase the evaporation rate above that achieved in this study to minimize dependence on solidification campaigns until new tanks and/or treatment systems become available. These include increasing the air sparge flow rate through the MVST, adding heat to the MVST, and pumping the supernate to an evaporator located near the MVST. Evaluations of the feasibility and cost effectiveness for the more promising options began in FY 1991 and will continue in FY 1992.
1. IINTRODUCITON
The MVST are an important part of the storage system for liquid low-level waste
(LLLW) at Oak Ridge National Laboratory (ORNL). These tanks are used to collect
LLLW that is currently concentrated by the U L W evaporator and to store the waste
until additional tanks and/or treatment facilities can be constructed. The Waste Handling
and Packaging Plant (WHPP) that will process the stored waste in the MVST for final
disposal will not come on-line before 2000. Funding delays could postpone startup an
additional 5 years. Additional storage tanks are being planned to accommodate the delays
in the treatment facilities, but these tanks will not be operational before 1997.
1

2
Historical data from 1986-1988 shows that an average of -26,OOo gal/year of liquid
low-level waste concentrate (LLLWC) was transferred to the MVST during this time
period.'
Volume reduction activities have reduced LLLWC generation rates to - 13,000
gal/year the last 2 years, but new programs and Isotopes Facilities Shutdown are likely to
increase this rate to 18,000 gabear for the next 5-10 years. Waste transfer from tbe
remedial action programs will also increase the MVST inventory aver the next 5-10 years.*
At the present LLLWC generation rate, the MVST are expected to reach their maximum
capacity during 1993 if no action is taken to reduce the volume of waste in the tanks.
Bench-scale tests at ORNL have shown that SO-70% of the liquid in the MVST could be
evaporated prior to solids precipitation? Therefore, the near-term strategy for
management of the LLLWC stored in the MVST is to sparge the tanks with air to
evaporate the excess water from the tanks and to concentrate the stored LLLWC to the
point of near saturation.'> I735 at ambient temperatures is not expected to be sufficient
to keep the LLLWC inventory below the maximum capacity of the MVST until 1997.
Therefore, up to four campaigns (including one in 1989) are being planned to solidify
50,000 gal of supernate per campaign in concrete. Methods to enhance the supernate
evaporation rate are also being considered to minimize the number of solidification
campaigns.
A mathematical model was developed to predict ITE evaporation rates as well as
to determine the power requirements necessary to heat the MVST LLLWC to obtain the
enhanced evaporation rates. The modeling efforts were performed by Florida
International University and Martin Marietta Energy Systems, Inc., Engineering on the
33% pnxle~s .~ '~ Preliminary evaluations indicated that the evaporation rate from the
MVST could help reduce the inventory of supernate. Adding heat to achieve faster

3
evaporation rates would needed to be considered to avoid solidification campaigns and/or
overfilling the MVST. The results from the modeling need to be verified with actual
operating data.
Implementation of ITE at the MVST began in 1990 using 10-year old equipment
installed for use in the hydrofracture process with the intent of sparging of the MVST
over a &month period to verify the effectiveness of ITE.’ Recommendations for future
evaporation operations were to be made based on the evaluation of this data. ITE took
place over 3 months in 1991 and was shut down because of breakdown of the air sparge
compressor. This report summarizes ITE operations to date, evaluates the performance,
compares actual data with the mathematical modeling, and makes recommendations for
improving the evaporation process.
An air sparge system, previously used to mix the tanks for disposal of L U W C by
hydrofracture, is piped into each tank (Fig. 1). The sparge system consists of five 6-in.-
diam draft tubes, each with a 1-in. internal air supply line. Compressed air is metered into
the tanks by individual rotameters on each of these five lines. The design rate is 20 scfm
at 30 psig per rotameter, which translates into 100 s c h per tank Each tank is also
equipped with an air line providing sweep air that operates when the tanks are not being
sparged. E the tanks are being sparged, the flow of sweep air may be reduced or
eliminated at the operators discretion. The air from both the spargers and the sweep
exhausts through a flowmeter prior to entering a collection header serving all four tanks in
a vault. The collection header discharges into a demister that removes entrained and
condensed liquid and returns this liquid to one of two tanks. The air from the demister is
heated to prevent condensation in subsequent filtration steps. The heated air is passed

DEW POINT @ 350F I & CHILLER
I 800 SCFM 35 PSlG
SWEEP AIR
AMBIENT AIR l-l-H;F ROUGHING
FILTER
RH - RELATIVE HUMIDITY T - TEMPERATURE F - FLOW RATE
ORNL DWC 90A-885
7 ----- r
! ALL LINES AND EXHAUST EQUIPMENT WITHIN BOUNDARY HAVE BEEN HEAT TRACED AND INSULATED
A STACK
,,/ I a-, I HEPA
ROUGHING FILTER
HEATER 1 Yi P
AIR V A C U U M
RELIEF
Schematic Diagram of the MVST Tank Ventilation System After Modifications.

5
through HEPA filters prior to exiting through a blower and a local lO-in.-diam, 1Zft-high
stack The exit filters are rated for 1,OOO scfm. The compressor and chiller, which are
located in Building 7860, supply 800 s c h of air at a 35°F dew point and 30 pig. All tank
off-gas piping, filters, and stacks have been heat traced and insulated to prevent
condensation in the off-gas lines.

6
2 SYSTEMDESCRIPTION
The MVST system consists of eight 50,000-gal storage tanks located in two vaults.
The tanks and the vaults have separate ventilation systems. Schematic diagrams of the
vault and tank ventilation systems are presented in Figs. 1 and 2, respectively.
Filtered air is introduced into each vault near the ceiling through five 6-in.diam
pipe nipples (Fig. 1). The vault ventilation air exhausts through five 6-in.-diam pipe
nipples located on the opposite wall. The vault ventilation system operates at flow rates
up to 1,400 scfm and can be increased to 1,700 scfm if a vault plug needs to be removed.
The exhaust air is passed through HEPA filters prior to exiting through the vault
ventilation blower and the 8-in.-diam x 1Zft-high stack.

ORNL DWG 90A-883
f * TO STACK
FXHAIISTFR
////////////////
MVST
ARRESTOR
MVST
( MVST c-
MVST c-
VAULT
*
4-
4-
4-
4-
FILTER
Schematic Diagram of the MVST Vault Ventilation System

8
3. EVALUATION OF ITE PERFORMANCE
The ITE equipment was installed at the MVST in 1990. Existing equipment was
used when possible to minimize costs. Most of the existing equipment had been installed
for use in the hydrofracture process approximately 10 years ago and had not been
operated for over 5 years. New instrumentation for determining the relative humidity and
the temperature entering and exiting each tank was installed in order to follow the XTE
process. Safety shutdown instrumentation was installed to eliminate the risk of tank
overpressurization during sparging activities.
As would be expected with old equipment that had been shut down for years,
several operational problems were encountered during the 1990 preoperational test
period. The chiller/dryer that dehumidifies the sparge air entering the MVST did not
operate properly and was replaced. The relative humidity/temperature probes did not
function properly and were replaced with probes of a different design. The in-line
heaters, which were designed to heat the off-gas from the MVST to prevent the HEPA
filters from becoming wet, required maintenance before they operated properly.
Operational pretesting was completed in 1990 and the XTE test was begun in early 1991 to
demonstrate the effectiveness of the ITE process.
Two incidents of HEPA filter wetting occurred - one on April 2, 1990, 5 d after
the total flow had been brought up to 600 ft3/min, and then on April 23, 1991, after the
system had been operating at about 400 ft3/min for around 2 months. The currently
installed demisters are AGS Industries mesh style 4BA, according to the drawings. The
demister for each vault contains a pad 4-in. thick and 16-in. in dia. This style is
recommended for clean liquids and should provide greater than 99% removal of drops 10
pm and larger. The design velocity through the pad is 10 ft/s for gases at the atmospheric

9
density of air and higher (K=035). At a flow rate of 400 fp/min per vault, the velocity is
5 ft/s, somewhat lower than the design value. However, the efficiency does not drop off
significantly for 10 micron drops until the velocity is below 2 to 3 ft/sec. Re-entrainment
becomes a problem at 20 to 30 ft/sec, or a flow rate above 1500 ft3/min per vault. It does
not seem likely that the wetting was caused by excessive velocities through the demisters.
A possible cause was malfunction of the heaters between the demisters and the filters.
3.1 In-Tank Evaporation Performance Data
The ITE equipment was operated almost continually on four of the MVST (W-24,
W-25, W-26 and W-27) from February 4, through April 22, 1991. The air sparge rate was
slowly ramped up to the maximum tested sparge rate of approximately 120 sctin per tank
(468 sch for 4 tanks) during the first half of the test period. The sparge air enters the
W S T sparge tubes at about 12 psig and exits the tanks at atmospheric pressure. The
sparge rate was not increased above 468 s c h because of concerns that higher flow rates
might cause wetting of the HEPA filters. The system was shut down on April 22 because
the air compressor began leaking unacceptable quantities of oil into the cooling water and
sparge air.
During the 3-month operational period, about 900 gal of water were evaporated
from the MVST as shown in Table 1. This figure was calculated from relative humidity,
temperature and flow rate readings. Partial pressures of water in the exit air were
calculated as shown in the Appendix
10
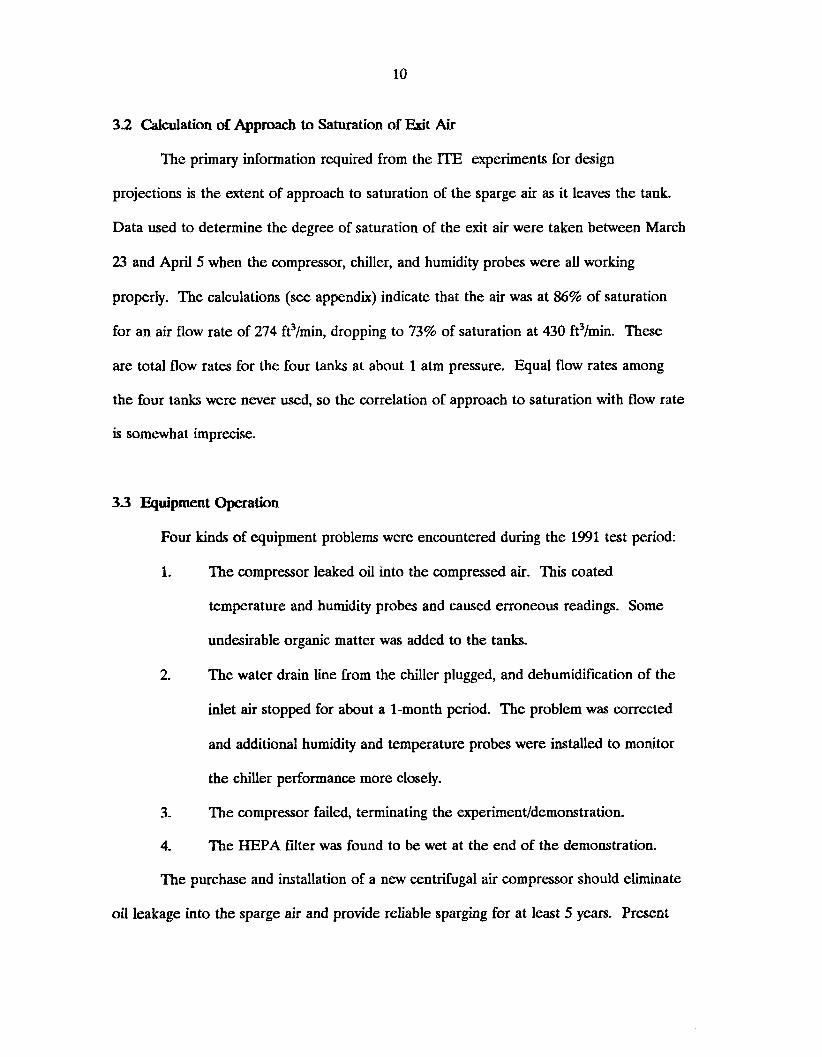
3 2 Calculation of Approach to Saturation of E t Air
The primaIy information required from the ITE experiments for design
projections is the extent of approach to saturation of the sparge air as it leaves the tank.
Data used to determine the degree of saturation of the exit air were taken between March
23 and April 5 when the compressor, chiller, and humidity probes were all working
properly. The calculations (see appendix) indicate that the air was at 86% of saturation
for an air flow rate of 274 ft3/min, dropping to 73% of saturation at 430 ft3/min. These
are total flow rates for the four tanks at about 1 atm pressure. Equal flow rates among
the four tanks were never used, so the correlation of approach to saturation with flow rate
is somewhat imprecise.
33 Equipment Operation
Four kinds of equipment problems were encountered during the 1991 test period:
1. The compressor leaked oil into the compressed air. This coated
temperature and humidity probes and caused erroneous readings. Some
undesirable organic matter was added to the tanks.
The water drain line from the chiller plugged, and dehumidification of the
inlet air stopped for about a 1-month period. The problem was corrected
and additional humidity and temperature probes were installed to monitor
the chiller performance more closely.
The compressor failed, terminating the experiment/demonstration.
The HEPA filter was found to be wet at the end of the demonstration.
2.
3.
4.
The purchase and installation of a new centrifugal air compressor should eliminate
oil leakage into the sparge air and provide reliable sparghg for at least 5 years. Present

11
estimates for the new compressor/air dryer system are about $140,000. This appears to be
an attractive option for making new storage space available in the MVST.
3.4 Projected In-Tank Evaporation Eifkdvena
The calculations in Table 1 taken for air sparge rates >400 fP/min (measured at
the exit when alI four tanks were sparged) indicate that 6.8 gal/d/tank were evaporated
from the MYST during the test period. The inlet air during the test was dried to a 40°F
dew point by the chiller. Assuming that ITE is on line 80% of the time, the inlet air is
dried to a -40°F dew point by a desiccant dryer, and six tanks are sparged; 17,000 gaVyear
could be evaporated. If the air compressor is replaced in mid-1992, 76,000 gal of
supernate could be evaporated before 1997 when additional LLLW storage tanks are
scheduled to be operational. Under these conditions, I'D3 would be capable of
evaporating the newly generated waste produced from normal operations during this time.
However, it would not be capable of working off any of the existing inventory nor would it
provide the capacity to handle emergencies or waste transferred from the inactive LLLW
tanks. XTE would eliminate the need for a 50,OOO-gal solidilkation campaign before 1997.

12
Table 1. In-tank evaporation performance b m February 4, to April 22,1991
Amount of water evaporated
ID# Air flow rate' Period Water out Water in Net To tal
1-54 180 6.83 12.9 3.32 9.58 65.4
(ft3/min) (dl (gaW (gaud) (gaud) (gal)
55-98 163 10.0 10.9 3.68 7.22 72.2
99-107 134 1.0 9.48 5.66 3.81 3.8
108-194b
195-199 2% 1.83 26.4 7.10 19.3 35.3
200-225 439 8.20 34.3 10.6 23.7 194.7
226-233 328 1.83 24.0 7.95 16.0 29.4
234-236 363 1.0 27.6 8.81 18.8 18.8
237-238 274 1.33 23.6 6.61 17.0 22.6
239-252 362 5.5 34.7 8.69 26.0 143.0
253-266 468 8.33 43.3 13.2 30.1 250.4
267-269 420 2.5 40.0 11.8 28.2 70.6
TOTAL 906.2
'Measured at the NVST efnuent. bChiIler condensate drain plugged.
13
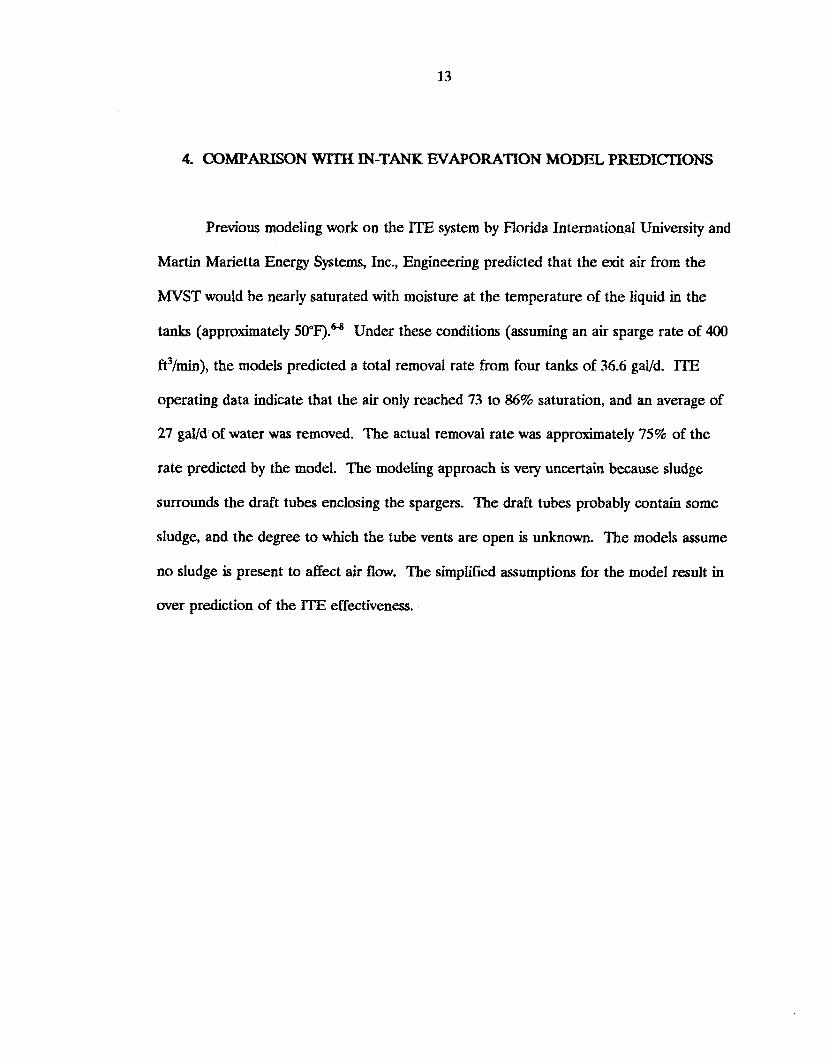
4. COMPARISON WITH IN-TANK EVAPORATION MODEL PREDICTIONS
Previous modeling work on the ITE system by Florida International University and
Martin Marietta Energy Systems, Inc., Engineering predicted that the exit air from the
MVST would be nearly saturated with moisture at the temperature of the liquid in the
tanks (approximately 50°F')- Under these conditions (assuming an air sparge rate of 400
ft3/min>, the models predicted a total removal rate from four tanks of 36.6 gaud. ITE
operating data indicate that the air only reached 73 to 86% saturation, and an average of
27 gaud of water was removed. The actual removal rate was approximately 75% of the
rate predicted by the model. The modeling approach is very uncertain because sludge
surrounds the draft tubes enclosing the spargers. The draft tubes probably contain some
sludge, and the degree to which the tube vents are open is unknown. The models assume
no sludge is present to affect air flow. The simplified assumptions for the model result in
over prediction of the ITE effectiveness.

14
5. METHODS TO EVAPORATION RATES
Evaluation of the ITE performance data in Sect. 4 indicates that evaporation rates
of 17,000 gal/year are achievable using the existing ITE system (after the leaking
compressor is replaced). This is only sufficient to process the predicted waste generation
rates in the near future. In order for ITE to process the expected future waste generation
plus work off the present inventory in the MVST to avoid solidification campaigns before
1997 (when new tank capacity is expected to be available), measures will need to be
implemented to enhance the evaporation rate. The following options are available: (1)
increasing the air sparge flow rate through the MVST, (2) adding heat to the MVST, and
(3) pumping the supemate to an evaporator located near the MVST, that is, out-of-tank
evaporation (OTE). Each of these will be discussed below.
5.1 Increasing the Air Sparge Rate
Steady year-around sparging is assumed for tanks W-24,25, 26, 27, 28, and 31.
Tanks W-29 and 30 will not be sparged to permit the supernate to settle in preparation
for a solidification campaign. It is also assumed that the compressor is operated at its full
rated capacity and the flow is evenly distributed among the six tanks. This would result in
flows of at least 150 ft3/min per tank depending on ambient temperature.
Average supernate temperatures were assumed to track average air temperatures
as follows:

15
__ _ _
Months Measured Average air Assumed average temperature supernate temperature
("E, ("F)
December - February 41
March - May 57
June - August 75
Sptember - November 59
45
55
70
60
The composition of the exit air is then estimated:
Super Vapor Vapor temperature pressure pressure Saturation Air
water water x 0.92 effectiveness Composition ("F) (mm Hg) (= Hg) (mol %)
45 7.6 7.00 0.75 0.0070
55 11.1 10.2 0.75 0.0102
70 18.8 17.3 0.75 0.0173 fa 13.2 12.1 0.75 0.0122
The total pressure was taken as 749 mm Hg in this calculation.
me design specifications of the new compressor are 1150 s c h at 30 psig referred
to inlet conditions of 14.7 pig and 94°F; however, 207 ft3/min will be used to regenerate
the desiccant dryer. Thus, the compressor can provide 64.0 lb/min of sparge air at the
reference conditions. The maximum mass flow rate for a centrifugal one-stage compressor
would increase by 23% when the inlet temperature drops to WE Average air mass flow
rates for the four seasons are estimated as follows, assuming a h e a r relationship with
absolute temperature: wkter, 77.3; spring, 74.5; summer, 70.5; and fall, 73.2 The yearly
average m a flow rate is 73.9 lb/min. The new desiccant air dryer has a d q h t
specification of a F , or a humidity ratio of 0.00008 lb waterAb air. The air entering the

16
tanks would bring in about 1.0 gaud of water. The water carried out with the exit air is
obtained from the exit air compositions in the above table. The compositions are
converted to humidity ratios by multiplying by the ratio of molecular weights (18/29).
Humidity ratio of exit air Water out
(lbH,O/lbAIR) (gaW
Winter 0.0043 57.4
Spring 0.0063 81.0
Summer 0.0107 130
Fall 0.0076 96.0
Water out minus in
(gaud)
56.4
80.0
129
95.0
Assuming that the air sparge is done 80% of the time during a year, the total
amount of water evaporated is estimated to be 26,OOO gal. This estimate assumes that a
flow of about 150 ft3/min of air could be sparged through each tank, compared with the
100 ft3/min assumed in previous estimates. A review of the piping between the
compressor and the tanks with Engineering Personnel indicates that it can accommodate
the increased flow rate. If air flow is limited to 100 ft3/min per tank for the six tanks, the
amount of water evaporated would be reduced by one-third, or to about 17,000 gaweas.
5 2 VaultHeating
The temperature of the supernate strongly affects the rate of evaporation.
Heating the sparge air is certainly the most effective way to enhance the rate, but
experimentation is required to provide an estimate of the amount. The modekg
approach is very uncertain because of the sludge that surrounds the draft tubes enclosing
the spargers. The draft tubes probably contain some sludge, and the degree to which the

17
tube vents are open is unknown. The evaporation data provide a basis for estimating the
fraction of the heat that would be transferred from the air to the liquid, but the fraction
transferred that actually vaporizes water cannot be reliably predicted.
The approach of heating the vault air was addressed in considerable detail by the
Process Engineering Section of the Engineering Division.' Taking into account heat
exchange through the vault walls to the ground and ambient air, their analysis showed that
supplying 150°F air tu the cells would raise the average waste temperature to 75°F in
about 5 months. Temperatures would fluctuate seasonably during subsequent years,
generally remaining in the 70 to 80°F range. This would require a power supply of about
80 k W and an annual power cost of about $30,000. Using an average supernate
temperature of 75°F and a saturation eficiency of 75%, the evaporation rate would be
increased to about 30,000 gaVyear, sparging six tanks at a rate of lo0 ft3/min each.
Heating the sparge air, as opposed to the cell air, would put the heat at the air-
supernate interface where evaporation takes place. In the cell air heating case above, a
flow rate of 2800 scfm was used. The sparge air flow is only 600 ft3/min by contrast. It is
recommended that an experimental run be made with heated sparge air to measure the
effectiveness of this option.
I t is estimated that heating of the W S T could not be implemented before 1993.
Since solidification campaigns are scheduled for FY 1991, 1992, and 1993, this process
probably only has the capability to avoid one solidification campaign if waste generation
rates remain at present levels and new storage tanks stay on schedule.

18
53 Out-of-Tank Evaporation
There are about 200,000 gal of supernate in the six MVST that have been
analyzed." The total in all eight tanks is estimated to be about 270,000 gal.' Walker
reports volume reduction results for air-sparging experiments with maximum solids
concentrations ranging from 640 g/L for W-31 to 823 g/L for W-28.3 These air-sparging
results were used to predict OTE volumes as shown in Table 2.
Table 2 predicted out-of-tan% evaporation results
Solids concentration
Supernate Volume Presently After evaporation Water evaporated
Tank (gal) (g/L) (g/L) (gal)
W-24 34,200 377 698 15,700
W-25 24,000 343 679 11,700
W-26 30,100 369 67 1 13,500
W-27 29,200 358 725 14,800
W-28 43,600 485 823 17,900
W-29 unknown
W-30 Unknown
W-31 39,600 35 1 640 17,900
TOTAL 91,500
The average amount that can be evaporated from each of the six tanks sampled is
estimated to be 15,250 gal. If this amount could be evaporated from W-29 and W-30, the
total water evaporated would be 122,OOO gal. This estimate assumes that the OTE
campaign is done in a short time span (a few months), so that the amount of fresh
incoming waste slurry is not significant. If the evaporator were left in place and operated

19
over a period of years, much more water could be evaporated. Since this process probably
could not bc implemented before 1993, it could only be used to avoid one of the presently
planncd solidification campaigns.
An evaporator that might be considered for this service is one of the Limn
Aquavap VC series. A VC-30 ( 3 0 g a l k ) is in use at Three Mile Istand (TMI) Unit I1
processing radioactive water resulting from the 1979 accident. The major constituent of
the water at TMI is boron, which enters the evaporator at a concentration of 3500 ppm.
The overheads concentration averages 3.5 ppm, €or a decontamination factor of loo0
based on the feed. The evaporator achieves a solids concentration of lo%, so that the
decontamination €actor between the liquid and vapor phases is about 28,000.
Tbe radioactivity of the MVST supernates is dominated by 137Cs, which ranges
from 1.88 x 10' Bq/mL in W-30 to 2.21 x IO6 in W-26. Assuming that the supernate of
W-26 is concentrated by a factor of 1.8 (672/369) and a decontamination factor of 28,ooO
is applied, the ovcrheads c ~ ~ c e ~ ~ ~ ~ ~ ~ ~ ~ n of 137Cs would be 140 Bq/rnL. In comparison, the
waste acceptance criteria for the Process Waste Trealmcnt Plant (PWTP) is 400 BqL. A
large dilution factor is requircd in order €or the overheads to bc sent to the PWTP.
~ ~ e ~ ~ ~ i ~ ~ ~ i ~ conccrns include: (1) shielding requirements, (2) process flow
arrangcments, and (3) evaporator location. From the radionuclide inventories of the tank
supernates, it is clear that *37Cs daininates the shielding requirements. Using W-31 as an
example, the products (curies x gatnrna million electron volts) are taken for each nuclide
and 137Cs accounts for 94% of the total, '%Cs for about 596, and the remainder of the

20
nuclides for 1%. Therefore, the dose rate from 137Cs can be used to a good
approximation.
The supernate of W-26 is the hottest and gives an unshielded dose rate of 206
mrem/h/L as a point source. The concentrate tank of the VC-300 evaporator has a
volume of 110 gal in a 2 x 3 x 3 ft shape. The relaxation length for 137Cs in water is 11
cm, so, accounting for self-attenuation, the tank would effectively represent a volume of
11 cm x 3 ft x 3 ft, or about 20 gal. The unshielded dose at one foot distance from the
concentrate tank is then estimated as 15 rem/h. Shield thicknesses to reduce the dose rate
to 1.5 mrem/h (a factor of l0,OOO) are about 2 ft of ordinary concrete or 3 in. of lead.
Remote operation and maintenance of the evaporator would be required.
The volume of supernate that would be held at the evaporator facility would be
small compared to the 30,000 to 40,OOO gal of supernate in a single tank. Clearly, it would
be extremely undesirable to return the concentrate from the evaporator to the tank from
which the evaporator is being fed. If this were done, the concentration of the feed stream
from the tank would increase with time, the supernate would cycle through the evaporator
many times as it was concentrated and rediluted, and the evaporator would be operating
for much of the time on highly-concentrated feed. The system would work best if one
tank could be emptied of supernate by some means (perhaps by a solidification campaign
or ITE), so that it could receive evaporator concentrate. Thus, as the tanks were
processed, one would always be available to receive concentrate. The question of whether
the piping arrangements are in place to permit this scheme of operation must be answered
if OTE is to be seriously considered.

21
6. SUMMARY AND R E C O M M E " S
The ITE equipment was installed at the MVST in 1990. Existing equipment was
used as much as possible. Most of the existing equipment had been installed for use in
the hydrofiacture process approximately 10 years ago, was not designed for ITE service,
and had not been operated for over 5 years. As would be expected, several operational
problems were encountered. All of these have been addressed except the replacement of
the air compressor and the wetting of the "EPA filters. The purchase and installation of
a new centrifugal air compressor should eliminate oil leakage problems and provide
reliable sparging for at least five years. The cause of the wetting of the filters must be
investigated and corrected. Present estimates for the new compressor/airdryer system are
about $14O,OOO. This appears to be an attractive option for making new storage space
available in the MVST and the unit is being replaced.
The results of this report indicate that ITE should continue to reduce the
inventory of supernate in the MVST until additional storage tanks and/or treatment
facilities can be installed The ITE data indicate that 17,000 garnear could be evaporated
under the demonstrated operating conditions. Assuming the air compressor is replaced in
mid-1992, 76,000 gal of supernate could be evaporated before 1997 when additional
LLLW storage tanks are scheduled to be operational. Under these conditions, ITE would
be capable of evaporating 90% of the newly generated waste produced from normal
operations during this time period, which would avoid one 50,000-gal solidification
campaign before 1997.
In order for ITl3 to process the expected future waste generation in addition to
working off the present inventory in the MVST in an attempt to avoid up to two

22
solidification campaigns before 1997, measures will need to be implemented to enhance
the evaporation rate. The options are available: (1) increasing the air sparge flow rate
through the MVST, (2) adding heat to the MVST, and (3) pumping the supernate to an
evaporator located near the MVST @e., O'IE). Increasing the air sparge rate appears to
be the most attractive option at the present time. The feasibility and implementation
costs for these options have been evaluated in more detail during of FY 1992.

23
1. DePaoli, S. M., "Contingency Plan €or the Oak Ridge National Laboratory Liquid Low-Level Waste System," ORNLfiM-11227, December 1989.
2. T. J. Abraham, et al., "Review of the Inactive Liquid Low-Level Waste Tanks," Letter Report to Sid Garland, June 1990.
3. Walker, J. F., Jr., "Bench-Scale Testing in Support of the In-Tank Evaporation Process," Letter Report to T. J. Abraham, June 1989.
4. McNeese, L. E., et al., "Overall Strategy and Program Plan for Management of Radioactively Contaminated Liquid Waste and Transuranic Sludges at the Oak Ridge National Laboratory," ORNWIU-10757, December 1988.
5. Robinson, S. M., "Update of the ORNL Liquid Low-Level Waste Management Strategy," Award Fee Milestone WM-15 ( A D S Milestone WMEX-3781, Oak Ridge National Laboratory, April 1991.
6. Ebadian, M. A, "Evaporating Water from the MVST €or the Purpose of Producing Liquid Concentrate Storage Capacity," Letter Report to T. 3. Abraham, November 1989.
7. Llewellyn, G. H. and W. R. Williams, "Heat and Mass Transfer €or the In-Tank Sparging of Melton Valley Storage Tanks," OR"G/?NF-90/1, May 11, 1990.
8. Walker, J. E, Jr., "Modelling of In-Tank Evaporation at the ORNL Melton Valley Storage Tanks," Letter Report to S. N. Robinson, July 1990.
9. Walker, J. F., Jr., %-Tank Evaporation Startup and Evaluation," ORNGCF-90/249, July 1990.
10. Sears, M. B., et al., "Sampling and Analysis of Radioactive Liquid Wastes and Sludges in the Melton Valley and Evaporator Facility Storage Tanks at O m " ORNWIU- 11652, September 1990.
11. Kusik, C. L and H. P. Meissner, "Vapor Pressures of Water Over Aqueous Solutions of Strong Electrolytes," IEC Process Des. Develop., 12, 112-115, (1973).


Ap- CALCULATIONOFPERCENT SATURATION FOR SPARGE AIR

26
Appendk CAIXUIATION OF PERCENT SATURATION FOR SPARGE AIR
The extent of approach to saturation of the air leaving the MVST was calculated as
follows:
1. The partial pressure of water in the combined exit air from the tanks was
obtained from humidity and temperature readings at W-stack (instruments 9 and
10) and W-stack 2 (instruments 3 and 4). The duplicate humidity readings agreed
within 2 or 3% and the temperature readings within 1 or 2°C. The instruments
are located after an air heater, which prevents condensation in the exit line.
2. The vapor pressure of the supernate is calculated from the average tank
temperature and corrected for the effect of the salts by the method of Kusik and
Meissner." For the four tanks W-24 through W-27, sodium concentration varied
from 2.9 to 4.3 M, potassium from 0.2 to 1.3 M, nitrate from 3.3 to 4.5 M, and
chloride from 0.07 to 0.1 M. Many other constituents are present in trace
amounts. Total cations averaged about 4.1 M, and total anions about 4.1 M. The
vapor pressure correction factor for 4 Msodium nitrate is 0.91 at 77°F. Lowering
the temperature to 45°F increases the factor to 0.93. Increasing the
concentration to 5 M decreases the factor to 0.88. Thus, the factor is not very
sensitive to the range of variables in this system.
3. The approach to saturation of the exit air is obtained from the ratio of the partial
pressure of water in the exit air to the vapor pressure of the supernate. Liquid
temperatures in the MVST increased by about 6°F between February 4 and
April 22. This increase indicates that the tanks are fairly responsive to ambient
air temperature. Temperatures among the four tanks varied by about 4°F. The
temperature average of the tanks was used in looking up vapor pressures.

27
Calculations for the partial pressures follow:
Vapor Partial Air Record ExitH ExjtT Press Pressure Flow rate
(%I (“C) (mmHg) ( m H s 1 (ft3/min)
197 43 23 21.1 9.1 2% 198 27 27.5 27.5 7.4 2% 199 35 23 21.1 7.4 2%
200 27 25.5 24.5 6.6 430 201 27.5 26 25.2 6.9 430 202 34.5 22.5 20.4 7.0 430
8.0 average
6.8 average
229 42.5 19 16.5 7.0 230 30 24.5 23 6.9 231 25 28.5 29.2 7.3 232 285 26 25.2 7.2
234 29.5 25 23.8 235 30.5 26 25.2 236 41 20.5 18.1
7.1 average
7.0 7.7 7.4
328 328
363 363 363
7.4 average
237 31.5 25.5 24.5 7.7 274 238 41.5 23.5 21.7 9.0 274
Having obtained water partial pressures in the exit gas, we now proceed to find supernate vapor pressures:
8.3 average
Supernate Vapor pressure Vapor pressure temperature water Salt supernate
Date Records (“C) (mm wz) factor (mm Hg)
3/23 197 to 199 11.4 10.1 0.92 9.3 200 to 202 11.4 10.1 0.92 9.3
11.6 10.2 0.92 9.4
414 237 to 239 11.9 10.5 0.92 9.7 4/3 4/2 234t0236 11.6 10.2 0.92 9.4 3/24 229t0232
Estimates for the degree of approach to saturation achieved in these experiments are:
Flow rate’ Percent of Saturation (iP/min) (%)
274 86
2% 86
328 76 363 79 430 73
‘At MVST &t


29
ORNIJTM-12036
1. 2. 3. 4. 5. 6. 7. 8. 9.
10. 11. 12. 13. 14. 15. 16. 17. 18.
W. D. Arnold P. T. Barton J. M. Be wich J. T. Be{ S. E. Breeding C. H. Brown C. H. Bvers D. A. Cbnatser k G. Croff J. S. Davidson D. L. Daugherty S. M. DePaoli C. k Easterday
C. E Frye W. Fulkerson H. R. Gaddis
~.~p;xJgr.
19. 20. 21. 23. 24. 25.
26-28. 29. 30. 3 1. 32. 33. 34. 35. 36.
37-46. 47.
48-57.
R. K. Genung 3. R. Hightower J. H. Hooyman 5: &.Hzdzik
endrick T. E Kent K. H. Kin Jones
C. P. Mamod R C. Mason L E. McNeese D.R.McTa art S. R. Michas J. R. Parrott, Jr. B. D. Patton J. J. Perona D. J. Peterson S. M. Robinson
J. L. Mad % ox
58. 59. 60. 61. 62. 63. 64. 65. 66. 67.
68-77. 78.
79.
80-81. 82. 83.
S. T. Rude11 T. F. Scanlan C. B. Scott R B. Shelton R. C. Stewart L. E Stratton W. T. Thorn J. R. T r a b a l r M. W. TuU D. W. Turner J. E Walker Central Research
Document Reference
Laboratory Records Laboratory Records, R.C. ORNL Patent Section
Library
Section
EXTERNAL DISTRIBUTION
84.
85-94.
Office of Assistant Mana er, Energy Research and Development, DOE-OR, P.O. Box 2001, Oak Ridge, 7"f 37831 Office of Scientific and Technical Information, P. 0. Box 62, Oak Ridge. 'IN 37831
95. Dr. Alli Badian, Florida International Universi Mechanical Engineering Department, University Park Campus, Miami, F? 33199
