l-2 luminosities and distances - associazione vox … case greek letter to constellation names more...
TRANSCRIPT
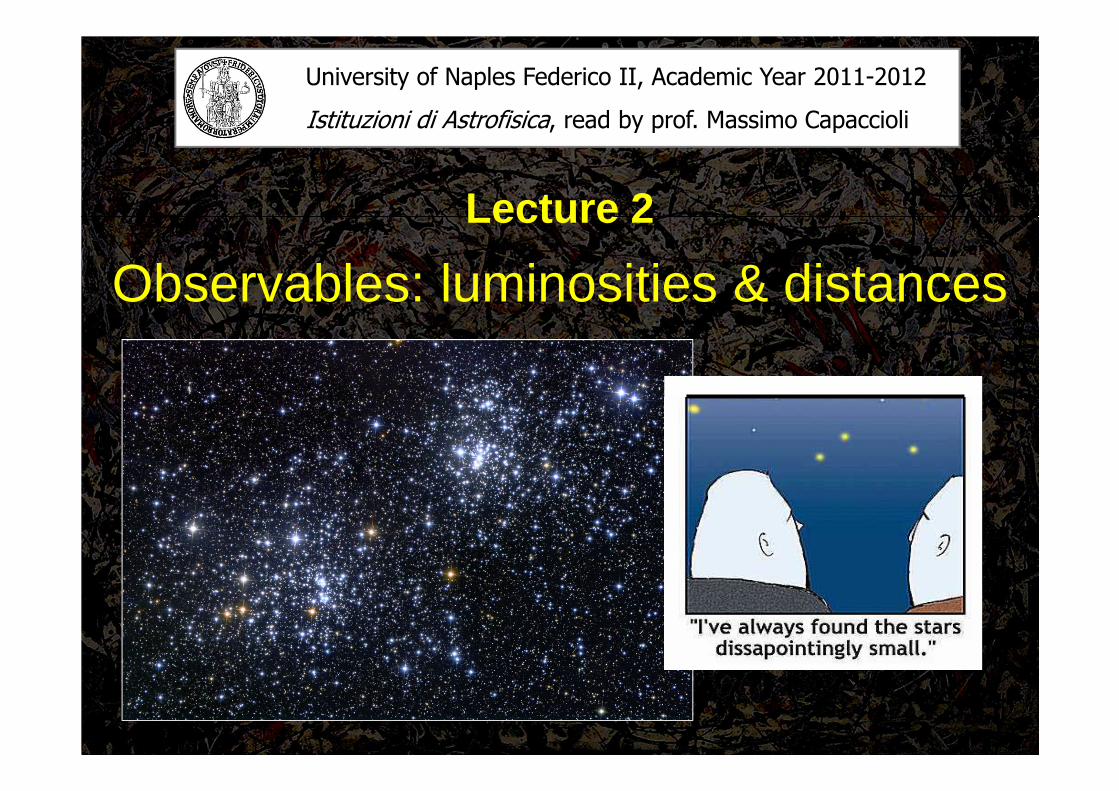
Lecture 2
Observables: luminosities & distances
University of Naples Federico II, Academic Year 2011-2012
Istituzioni di Astrofisica, read by prof. Massimo Capaccioli

Learning outcomes
The student will see:
• how stars are named;
• a recapitulation of concepts of photometry;
• what are stellar magnitudes and colors, and hoe they are measured;
• some of the basic photometric systems of magnitudes;
• how cosmic distances are measured: parallaxes , photometric distance
indicators, Hubble law;
• how to define absolute magnitudes.
• that magnitudes and colors of stars correlate in the so called HR diagram.

Shedir (α Cas)
A stellar field: use “figures” to commit it to memory
Constellations are usually just prospectical
Orion in 3D andin projection
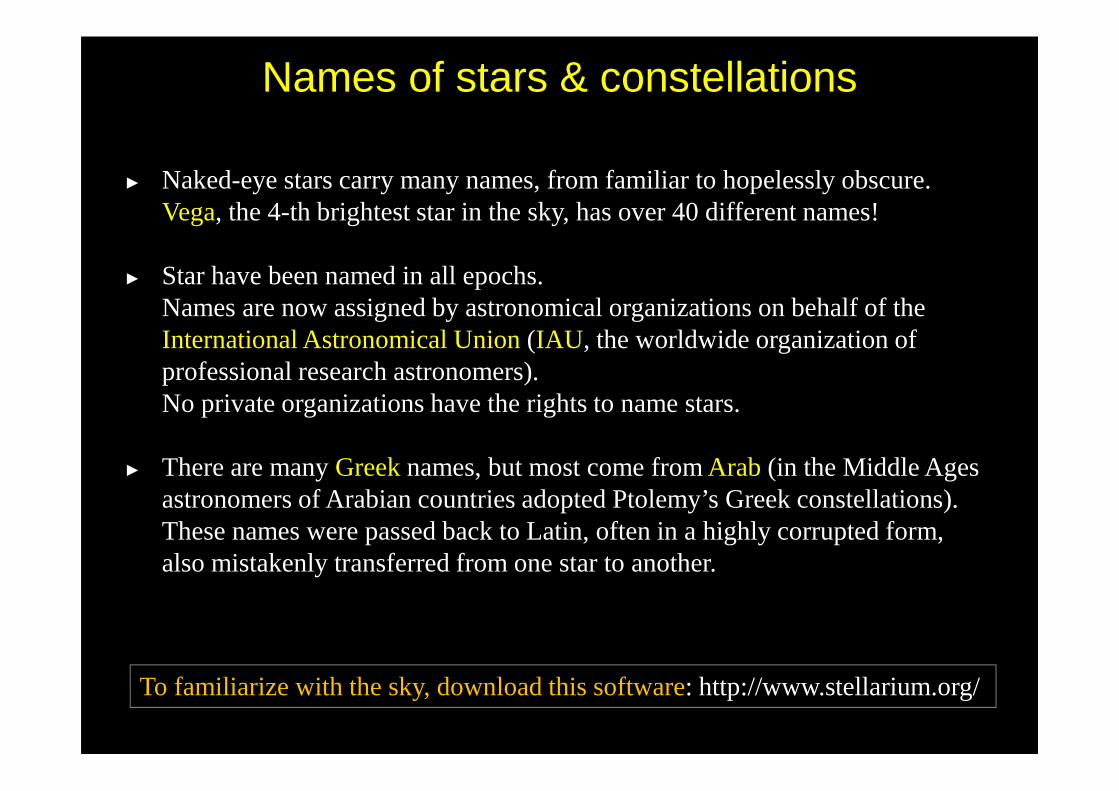
Naked-eye stars carry many names, from familiar to hopelessly obscure.Vega, the 4-th brightest star in the sky, has over 40 different names!
Star have been named in all epochs. Names are now assigned by astronomical organizations on behalf of the International Astronomical Union(IAU, the worldwide organization of professional research astronomers). No private organizations have the rights to name stars.
There are many Greeknames, but most come from Arab(in the Middle Ages astronomers of Arabian countries adopted Ptolemy’s Greek constellations). These names were passed back to Latin, often in a highly corrupted form, also mistakenly transferred from one star to another.
Names of stars & constellations
To familiarize with the sky, download this software: http://www.stellarium.org/
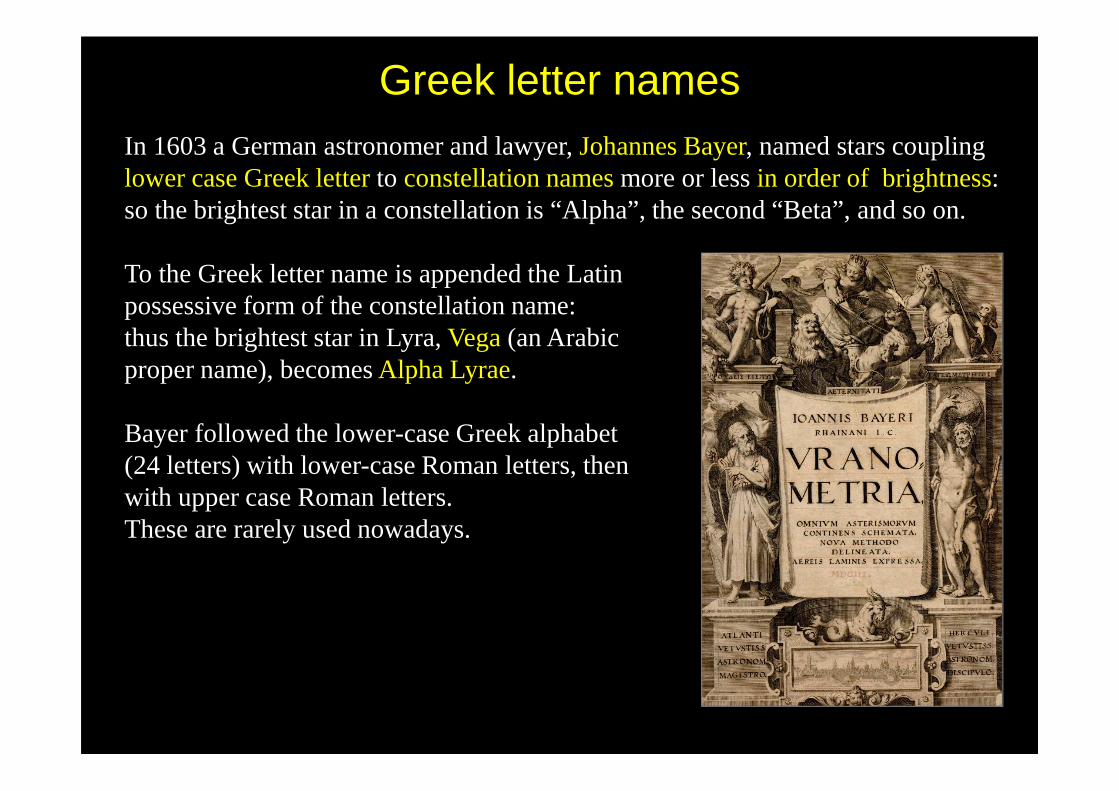
In 1603 a German astronomer and lawyer, Johannes Bayer, named stars coupling lower case Greek letter to constellation namesmore or less in order of brightness: so the brightest star in a constellation is “Alpha”, the second “Beta”, and so on.
To the Greek letter name is appended the Latin possessive form of the constellation name: thus the brightest star in Lyra, Vega(an Arabic proper name), becomes Alpha Lyrae.
Bayer followed the lower-case Greek alphabet (24 letters) with lower-case Roman letters, then with upper case Roman letters. These are rarely used nowadays.
Greek letter names
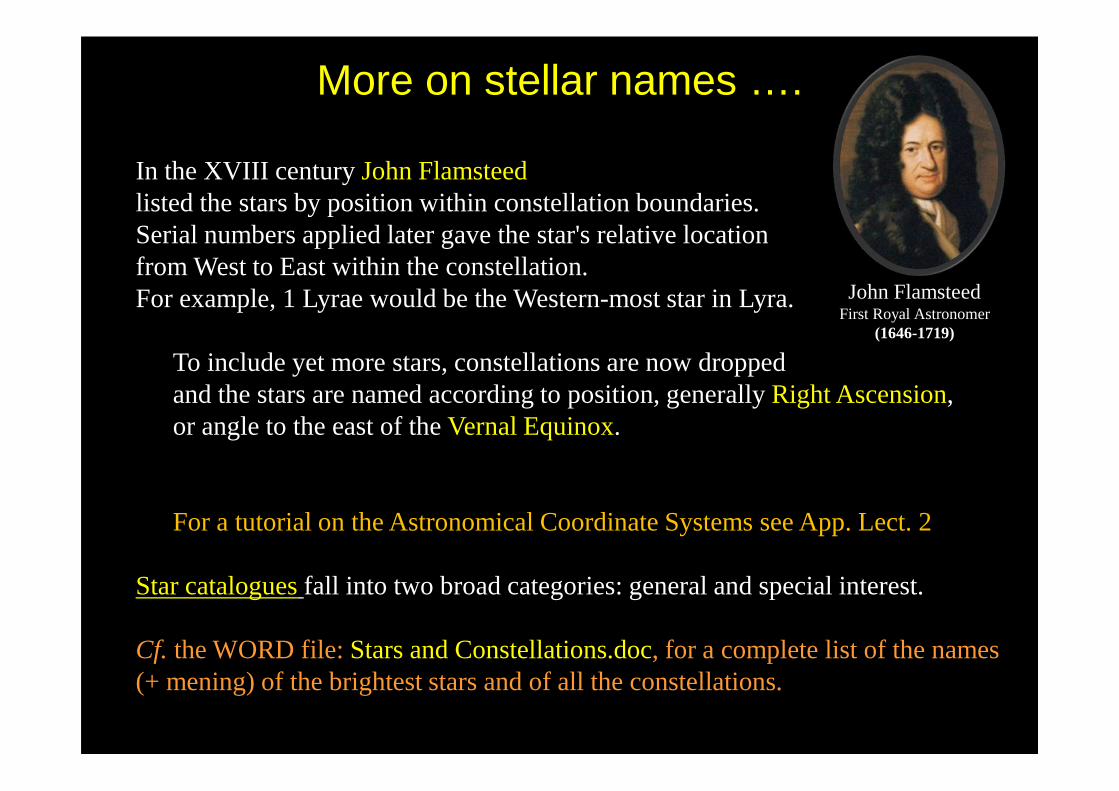
In the XVIII century John Flamsteedlisted the stars by position within constellation boundaries. Serial numbers applied later gave the star's relative location from West to East within the constellation. For example, 1 Lyrae would be the Western-most star in Lyra.
To include yet more stars, constellations are now dropped and the stars are named according to position, generally Right Ascension, or angle to the east of the Vernal Equinox.
For a tutorial on the Astronomical Coordinate Systems see App. Lect. 2
Star cataloguesfall into two broad categories: general and special interest.
Cf. the WORD file:Stars and Constellations.doc, for a complete list of the names (+ mening) of the brightest stars and of all the constellations.
More on stellar names ….
John Flamsteed First Royal Astronomer
(1646-1719)

The appearance of stars
Betelgeuseis a red giant, and one of the largest stars known.
Rigel is one of the brightest stars in the sky; blue-white in colour.
Betelgeuse = α Orionis(hand of the central one)
Rigel = β Orionis(foot of the central one)
Bayer’s Uranometria
Stars exhibit a large variety of brightnesses and colors.
photometry
radiation specific intensi
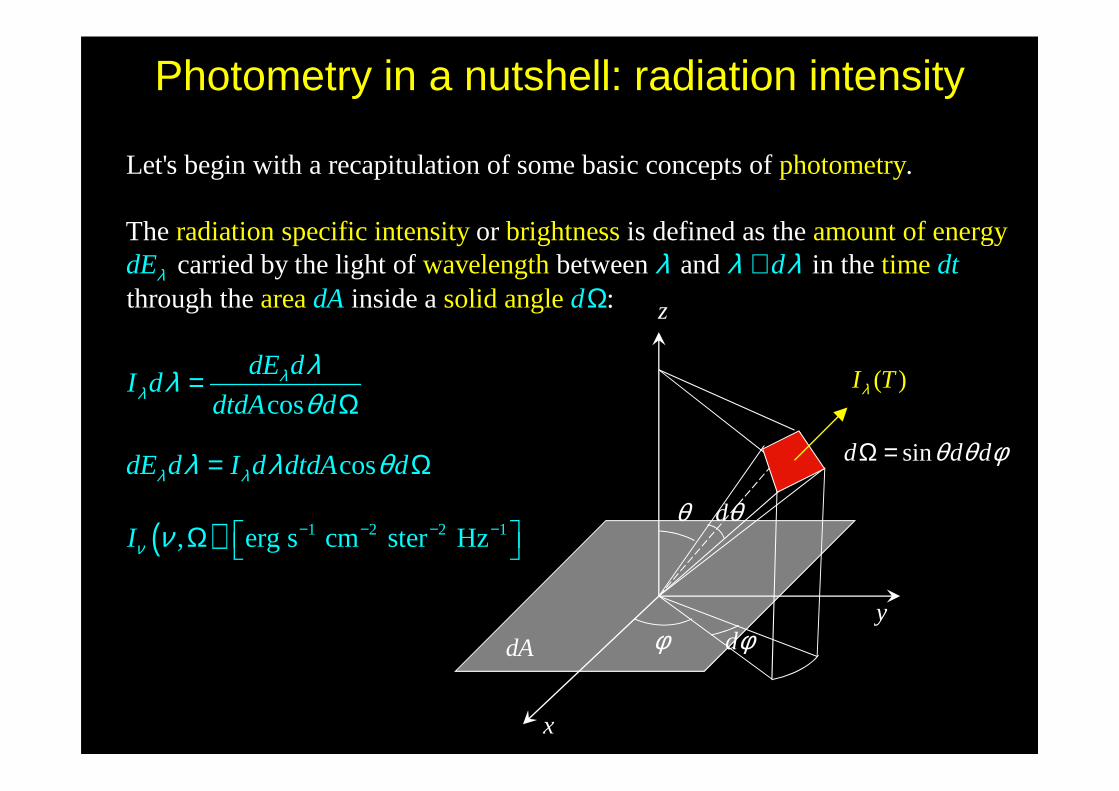
Let's begin with a recapitulation of some basic concepts of .
The or is defined as the carried b
ty brigy the
htness amount of light of
energywavelength b en etwedEλ
( ) 1 2 2 1
and in the through the ins
timearea solid angle
cos
cos
, erg s cm st
ide a
e z
:
r H
d dtdA d
dE dI d
dtdA d
dE d I d dtdA d
I
λλ
λ λ
ν
λ λ λ
λλθ
λ λ θ
ν − − − −
+Ω
=Ω
= Ω
Ω
x
y
z
dA φ dφ
θ
sind d dθ θ φΩ =
dθ
( )I Tλ
Photometry in a nutshell: radiation intensity

2
5
Max Planck in 1901 radiation black body absorption coefficient idenThe formula derived by for the from a
, . . a body with that's why isat blall wa ackvelengths ( ), is
tica
2( )
1
l to 1
hc
kT
hcB T
i
e
e
λλ
λ
λ=
−
( )( )
3
2
2 / 2
0 0 0
or
The emitted by a i
s just:
We will do this int
total energ
(how ?)2
( )
1
y rate bla
cos
cos
ck body
si
n
h
kT
A
hB T
c e
dE dI dA d d L d
dt
L B d dA d d
ν ν
λλ λ
π π
λφ θ λ
ν
λ θ λ λ
λ θ θ θ φ∞
= = =
=
−
= Ω =
= ∫ ∫ ∫ ∫
4Stefegrat an-Boion later ltzmann laand find the :w .L A Tσ=
cos
dE d
dI d
dA dtλ
λλλθ
=Ω
Max Planck (1858-1947)
x
y
z
dA φ dφ
θ
sind d dθ θ φΩ =
dθ
( )I Tλ
Radiation intensity of a black body
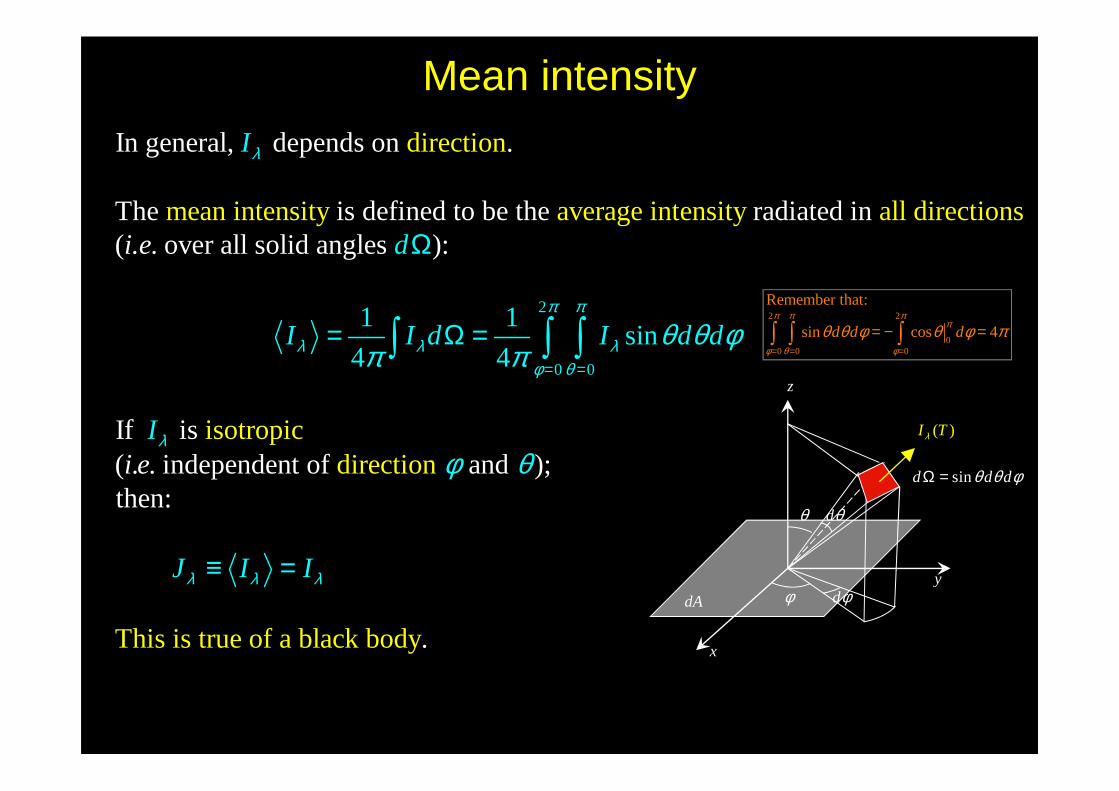
0
In general, depends on .
The is defined to be the radiated in ( over all
directi
solid a
on
mean intensity average intngles ):
ensity
all directions
1
4
1
4
I
d
I I d I
i.e.
λ
π
λ λ λφ θπ π =
Ω
= Ω =∫ ∫2
0
isotropic directio
If is ( . . independent of and );then:
n
This is true of a black b
si
y
n
od .
d d
I
J I
i
I
e
π
λ
λ λ λ
θ θ φ
φ θ
=
≡ =
∫
x
y
z
dA φ dφ
θ
sind d dθ θ φΩ =
dθ
( )I Tλ
Mean intensity
2 2
00 0 0
Remember that:
sin cos 4d d dπ π π
π
φ θ φ
θ θ φ θ φ π= = =
= − =∫ ∫ ∫
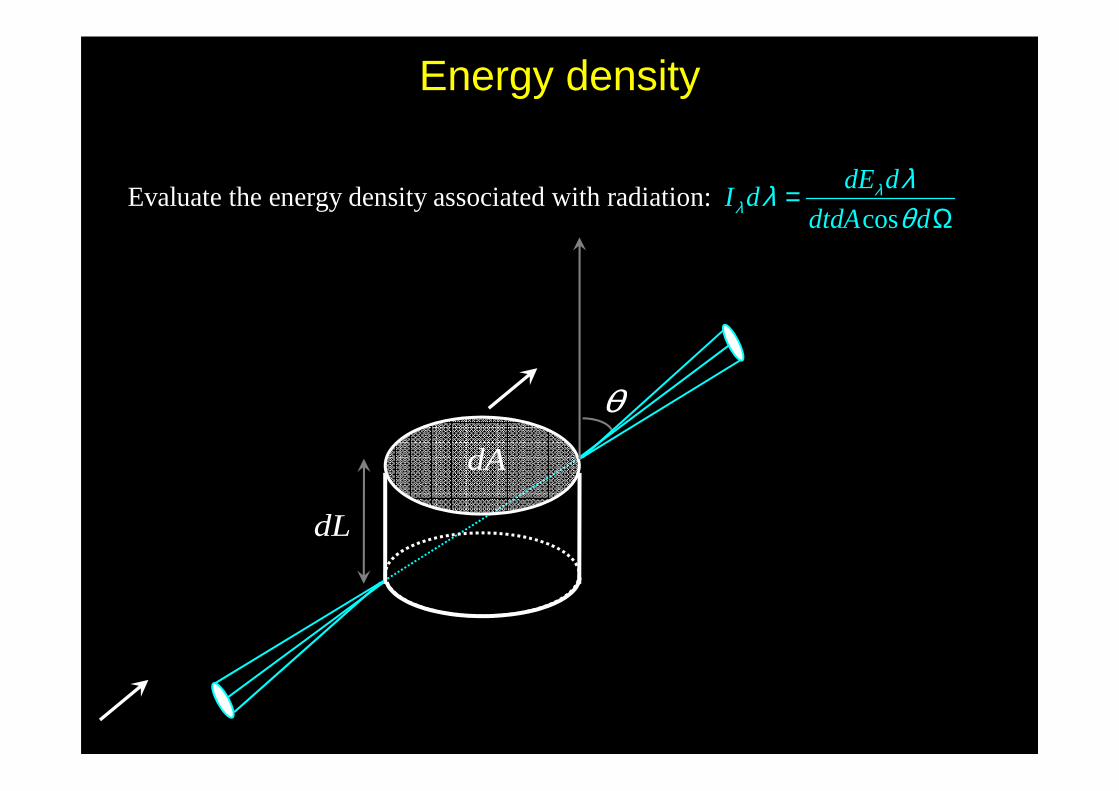
Evaluate the energy density associated with radiationc
:os
dE dI d
dtdA dλ
λλλθ
=Ω
z
θ
dA
dL
Energy density
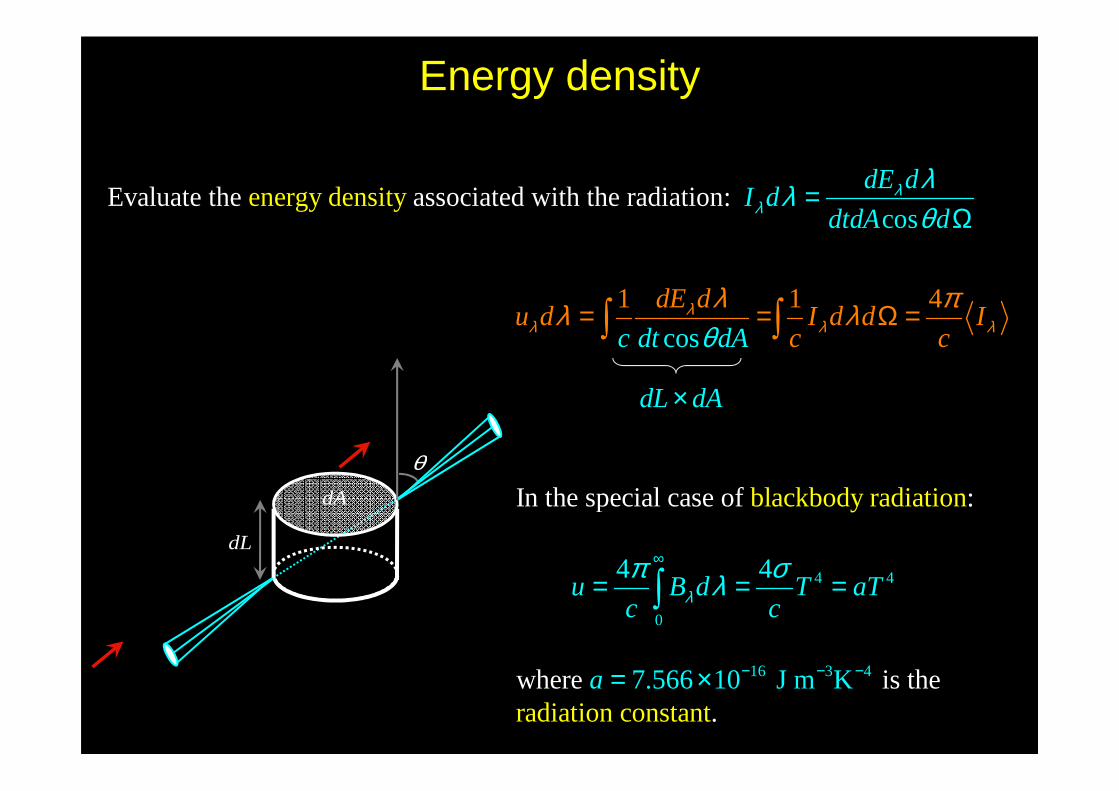
4 4
0
16 3 4
blackbody raIn the special case of :
diation
ra
cos
1 1 4
diation
where is t
4 4
7.566 10 J m K h
e .constant
c dt dA
dL dA
u B
dE du d I d d I
c
d T aTc c
c
a
λλ λ λ
λ
θ
π
λ πλ λ
σλ∞
− − −
= = Ω
×
= =
×
=
=
=
∫ ∫
∫
Evaluate the associated with the radiat energy density cos
ion:dE d
I ddtdA d
λλ
λλθ
=Ω
z
θdA
dL
Energy density
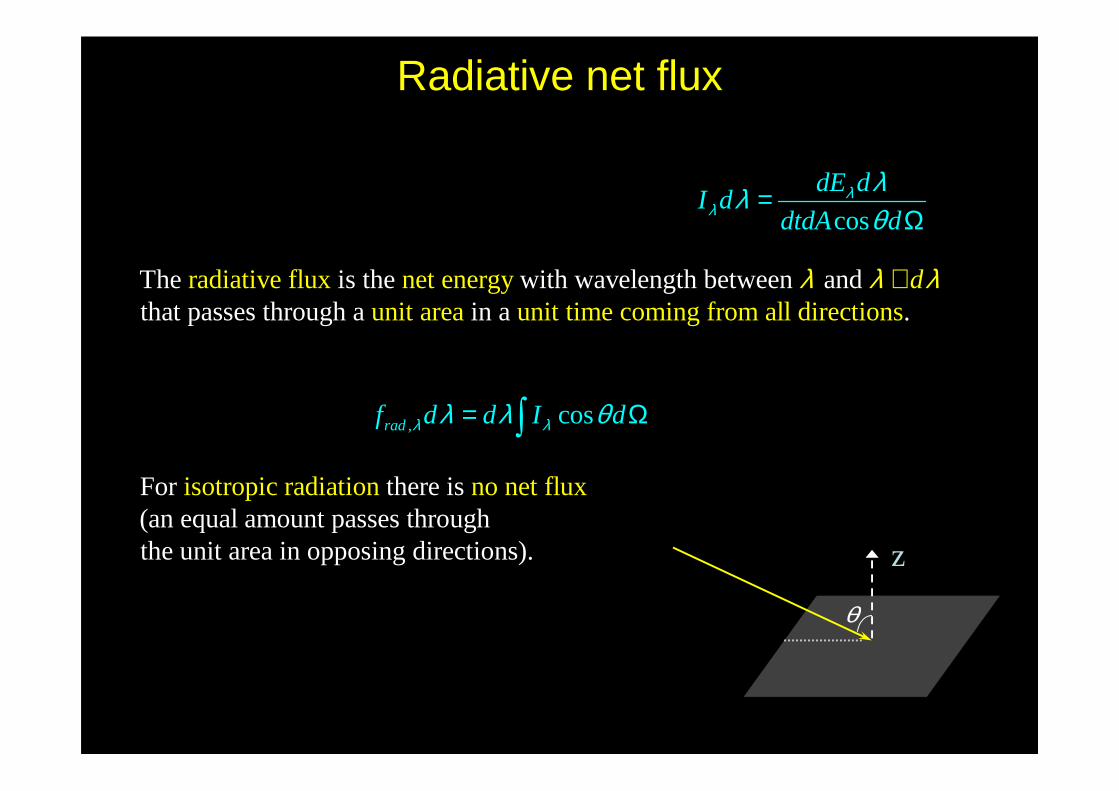
The is the with wavelength between and that passes thro
radiative flux net energy unugh a
i
cos
dE dI d
dtdA
d
dλ
λλλθ
λ λ λ+
=Ω
, co
t area unit time coming from all directions
isotropic radiation no ne
in a .
For there is (an equal amount passes
t flux through
the unit area in op
sradf d d I dλ λλ λ θ= Ω∫
posing directions).
Radiative net flux
θ
z
z
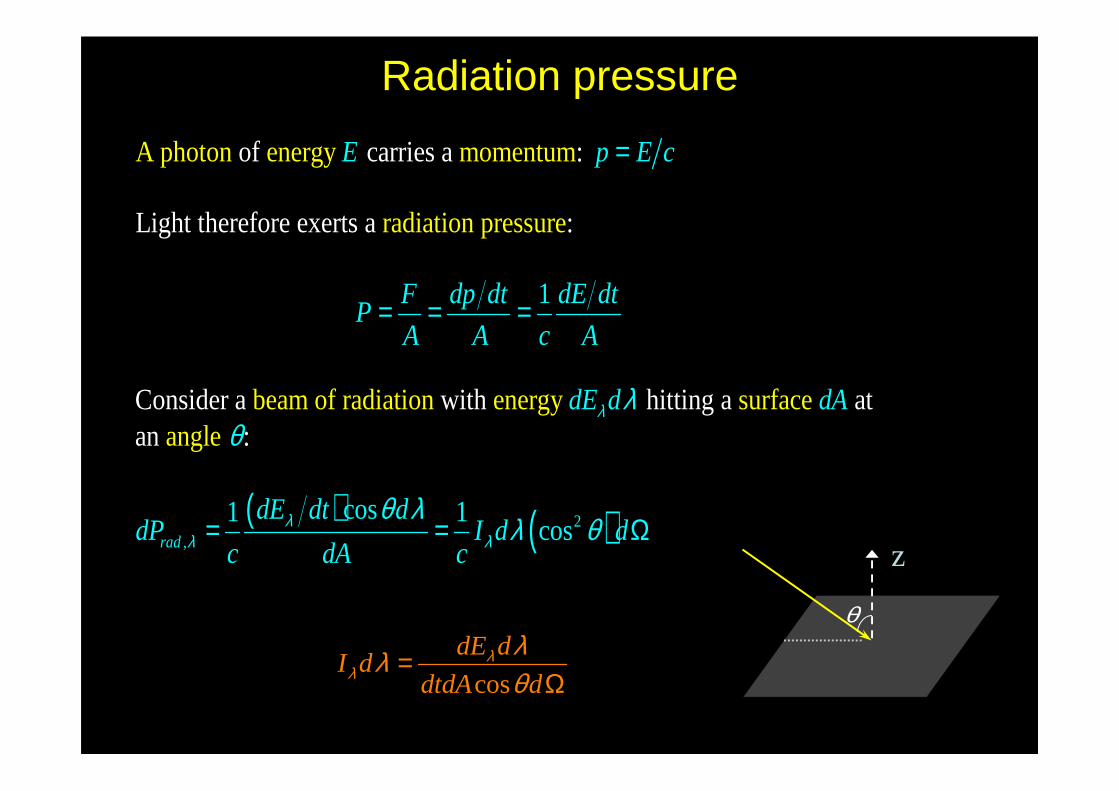
of carries a :
Light therefore exerts a :
Consider a with hitting a
A photon energy momentum
radiation pressure
beam of radiation
energy s
1
E p E c
F dp dt dE dtP
A A c A
dE dλ λ
=
= = =
( ) ( )2,
urfaceangle
at an :
cos1 1cosrad
dA
dE dt ddP I d d
c dA cλ
λ λ
θ
θ λλ θ= = Ω
Radiation pressure
cos
dE dI d
dtdA dλ
λλλθ
=Ω
θ
z
z
( ) ( )
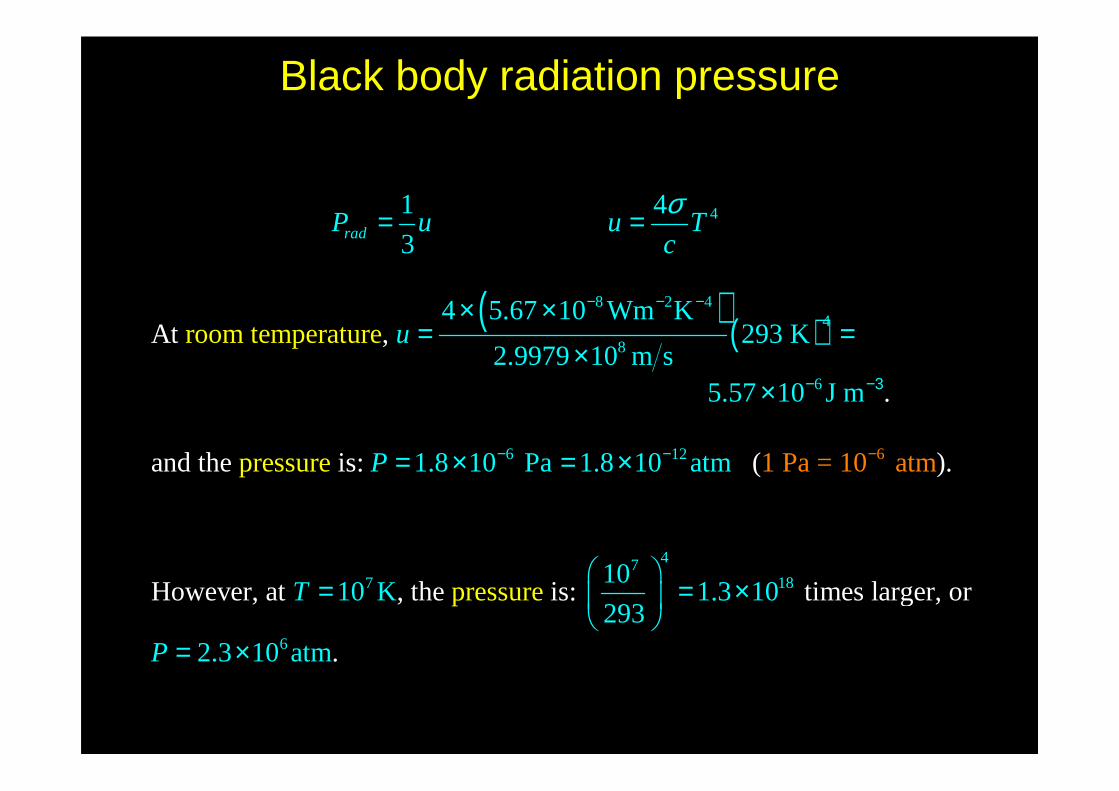
4
8 2 44
8
1 4
3
4 5.67 10 Wm K293 K
2.997
room temperature
A9 10 m s
t ,
radP u u Tc
u
σ
− − −
= =
× ×= =
×6
6 12
477 18
6
61 Pa = 10 a
.
and the is: ( ).
How
ever, at , t
pressure
prehe is:
5.57 10 J m
1.8 10 Pa 1.8 10 atm
1010 K 1.3 10
2 tissure mes l
9arger,
t
3
2.3 1 0 t
o
m
a
r
P
T
P
−
− −3
− −
×
= × = ×
= = ×
= × m.
Black body radiation pressure

cos
dE dI d
dtdA dλ
λλλθ
=Ω
( )
,
2,
Mean intensity (sometimes written ):
Energy density:
Radiative f
1
4
1 4
cos
1cos
lux:
Radiation pressure:
rad
rad
J I I d
u d I d d Ic c
f d d I d
P I d dc
λ λ λ
λ λ λ
λ λ
λ λ
π
πλ λ
λ λ θ
λ θ
= Ω
= Ω =
= Ω
= Ω
∫
∫
∫
∫
Recap of the formulae
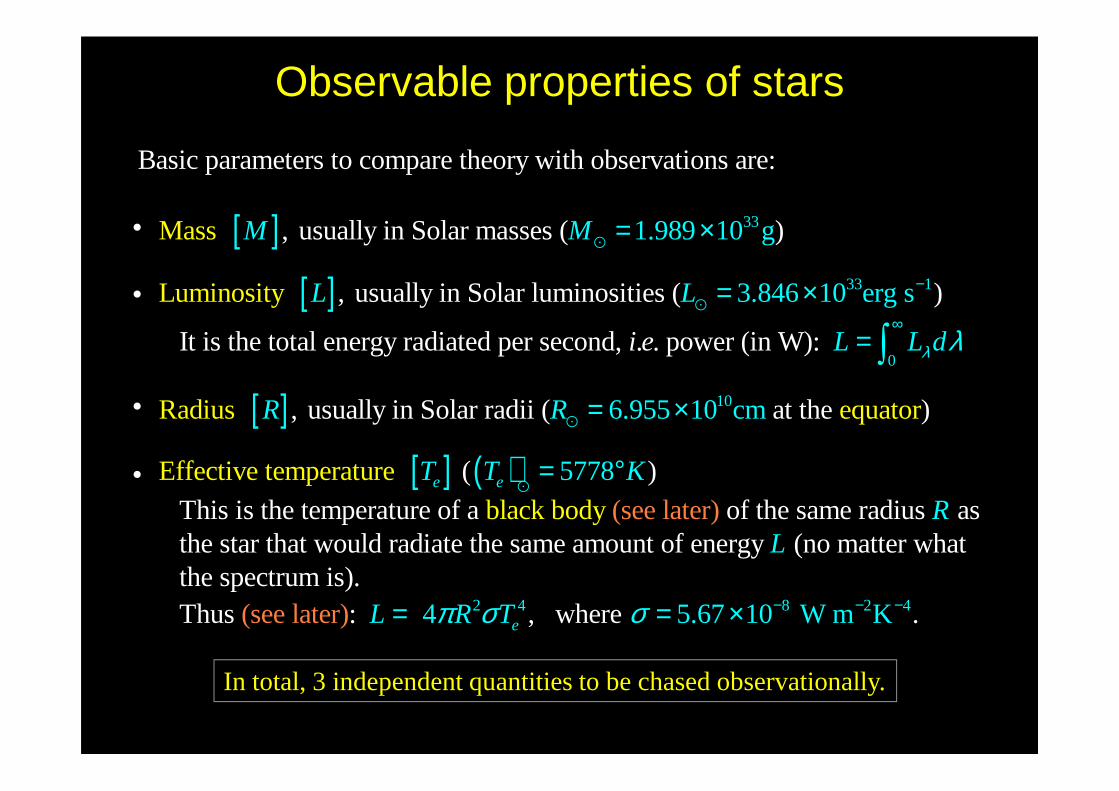
Observable properties of stars
In total, 3 independent quantities to be chased observationally.
[ ]
[ ]
33
33 1
1.989 10
Basic parameters to compare theory with observations are:
, usually in Solar masses ( )
, usually in Solar luminosities
Mass
Luminosity
g
3.846 10 erg ( )
It is t
he tota
s
M M
L L −
= ×
= ×
⊙
⊙
[ ]0
10
l energy radiated per second, . . power (in W):
, usually in Solar rad 6.955 Radius 10 equator
Effective
ii ( at t
temperat
he )
c
m
u
L L d
R R
i e λ λ∞
=
= ×
∫
⊙
[ ] ( )( )
This is the temperature of a of the same radius as the star that would radiate the same amount of e
(see laternergy
5778
(no ma
re
bltter what
the spectrum is
ack body )e eT T K
RL
= °⊙
2 4 8 2 4
). Thus : , wher(see later) 4 5.6 e . 7 10 W m KeL R Tπ σ σ − − −= = ×

Apparent brightness of stars
Star nameRelative
brightnessDistance [light years]
Sirius -α CaM 1 8.5
Canopus -α Car 0.49 98
Alpha Cen 0.23 4.2
Vega -α Lyr 0.24 26
Arcturus -α Boo 0.25 36
Capella -α Aur 0.24 45
The apparent brightnessof stars depends on both: their intrinsic luminosity, their distancefrom the observer, the intervention of some sort of extinction.
Their colorsare independent of distance.
Why this is so?
The five brightest stars
The five nearest stars
Star nameRelative
brightnessDistance [light years]
Proxima Cen 0.0000063 4.2
Alpha Cen 0.23 4.2
Barbard’s star 0.000040 5.9
Wolf 359 0.000001 7.5
Lalande 21185 0.00025 8.1
In the following we will consider • brightnessand• distanceof the stars.
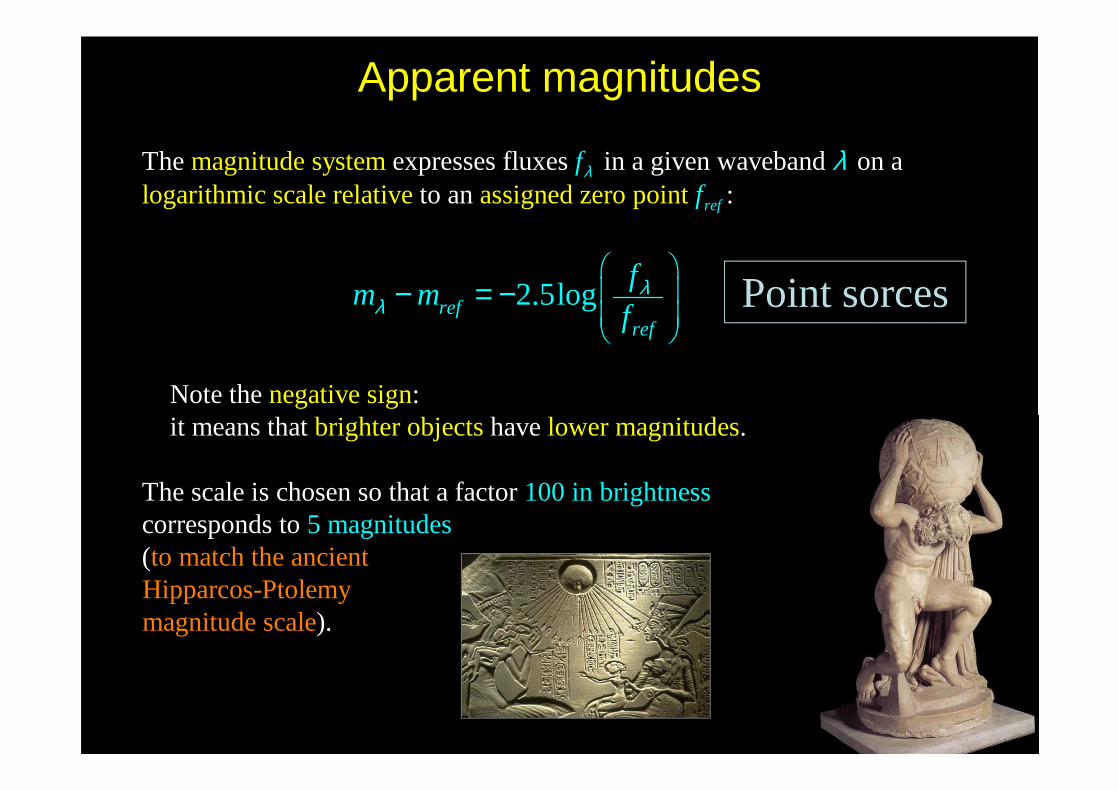
Apparent magnitudes
magnitude systemlogarithmic scale relative assigned zero pThe expresses fluxes in a given waveband on a
to an :
oint
n
Note the
2.5log
ref
refref
ff
fm m
f
λ
λλ
λ
− = −
: it means that have .
The scale is chosen so that a factor corresponds
egative signbrighter object
100 in brightness 5 magnitude
to match the ancient H
s
i
to (
pparc
s lower magnitud
os-Ptolemy m
es
agnitude scale).
Point sorces

Apparent magnitudes: examples
Object Apparent visual mag
Sun −26.5Full moon −12.5Venus −4.0Jupiter −3.0Sirius −1.4Polaris 2.0Eye limit 6.0Pluto 15Reasonable telescope limit (8-m telescope, 4-h integr.)
28
Deepest image ever taken (Hubble UDF)
29
9
(29 6)/2.5 46/5
At 29, this reaches more than 10 times fainte
The faintest (deepest) telescope image taken so far is the
r than we can see with the naked eye. 10
HST Ultra-Deep Field.
10
m
−
=
= ≈ 910
2.5logrefref
fm m
fλ
λ
− = −
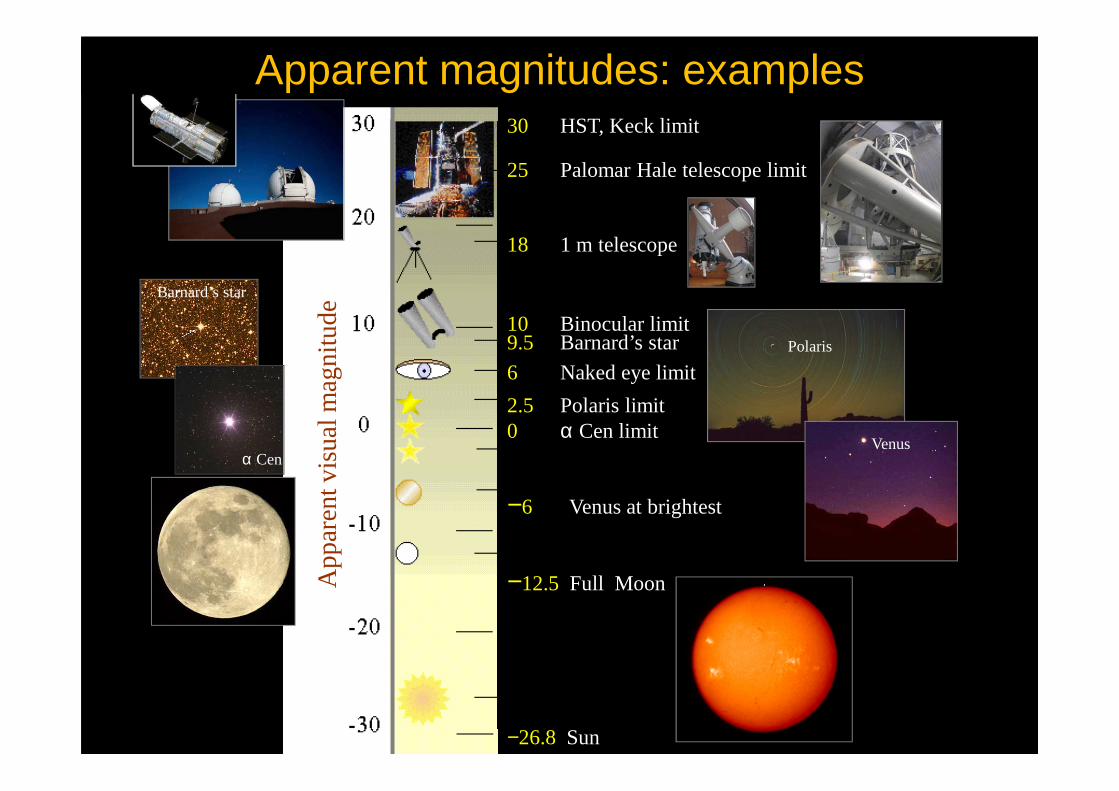
30 HST, Keck limit
6 Naked eye limit
25 Palomar Hale telescope limit
18 1 m telescope
10 Binocular limit9.5 Barnard’s star
2.5 Polaris limit 0 α Cen limit
−6 Venus at brightest
−12.5 Full Moon
−26.8 Sun
Ap
par
ent v
isu
al m
agn
itud
e
α Cen
Barnard’s star
Venus
Polaris
Apparent magnitudes: examples

Stars of different apparent magnitudesThe summer triangle
α Cygni
α Lyrae
α Aquilae
Standard star
Actual measure of a monochromatic flux
( )( )
0Actually, the is quite different from the
measure relative to a band centered at , returned by the detector of the
observing equipment
flux outside
.
The
the atmosphere
mai n causesof this chan
f
f
λλ λ
0
ge are a consequence of:
1. the ,
2. the of the various elements in the observing equipment.
Atmospheric extinction can be taken
atmospheric extinction
filtering
care by a proper observational
b
r
y
st
f
ategy.

plane
parallel lay ho
Let's mod
w good?
el the atmosphere by
( ).
ers
extinction along
( ) ( )
T the line of sighe is:
,
wher
ht
extie the nction coefficient
x
dfk h dx
f x
k
λλ
λ
= −
0 0
0
it depends on
time too, indeed sec = a
depends on and (
). Since ( ):
Integration along the visual gives:
ir massec
( )sec sec . ( )
sec
altitu
s
(
de
h h
h
x h z
dfk h z dh z d
f h
dfz d f h
f
z
λλ λ
λ
λλ λ
λ
λ
τ
τ∞ ∞
=
= − = −
= − →∫ ∫
0 0
sec ( )) ( ) e
( ) optical
, where:
, is d( ept) tsec hhe .
z
h h
f
d k h z dh
λτλ
λ λ λτ τ
− ∞
∞ ∞
= ∞
∞ = =∫ ∫
Zenith
dh dhsecz
x
zground at h0
above sea level
zenithal distance
Atmospheric extinction
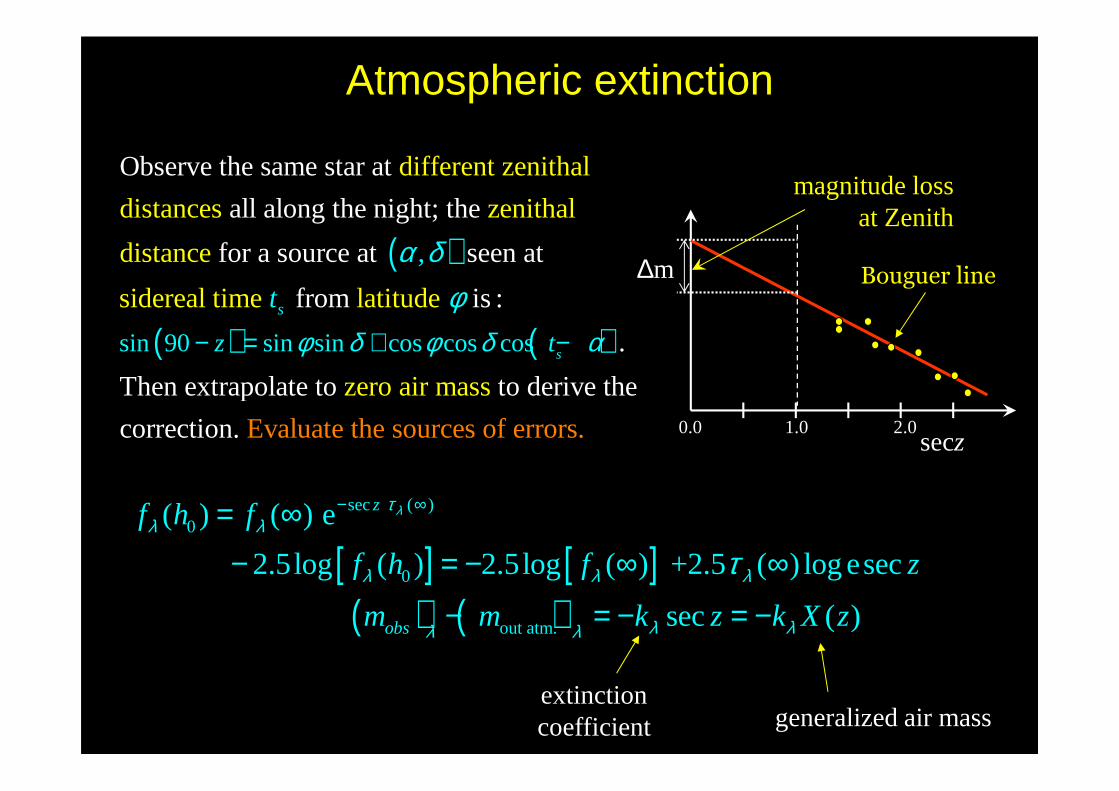
[ ] [ ]( ) ( )
sec ( )0
0
out atm.
( ) ( ) e
2.5log ( ) 2.5log ( ) +2.5 ( ) log esec
sec ( )
z
obs
f h f
f h f z
m m k z k X z
λτλ λ
λ λ λ
λ λλ λ
τ
− ∞= ∞− = − ∞ ∞
− = − = −
0.0 1.0 2.0
∆m
secz
Bouguer line
magnitude lossat Zenith
extinction coefficient generalized air mass
( )
( ) ( )sin 90 sin sin cos cos cos
Observe the same star at
all along the night; the
for a source at seen at
different zenithal
distances zenithal
distance
sidereal time lat from i tude is :
.
Then e
,
s
s
z t
t
φ δ φ δ α
α δφ
− = + −
xtrapolate to to derive the
c Evaluat
zero air
e the soorrection urces of
mas
err
s
. ors.
Atmospheric extinction

Actual measure of a monocromatic flux
( )
The effects of ( . ., glass filters, reflectivities or transmission properties of the optics, sensitivity of the detector) may
all the filters
transfer function be summed up into a
which acts on the
e g
T λ( )
( )( ) ( )
( )
0
0
0
0
of the object, , in such a way that:
, where is typically the center of t
spectral energy distribution
broad bandhe
defined by . Idea zlly, is ero eve but in the intrywhere e
f
T f d
f
T d
TT
λ
λ λ λλ λ
λ λ
∞
∞=∫
∫
( ) ( )( )
2
1
2
1
1 2
0
2 1 2 1
rval where it is unity.
If so, , the is , and: band wid2 th
f d
f
d
λ
λλ
λ
λ λ
λ λλ λ λ λ λ λ λ
λ
÷
= + ∆ = + =∫
∫

Artificial lights at night
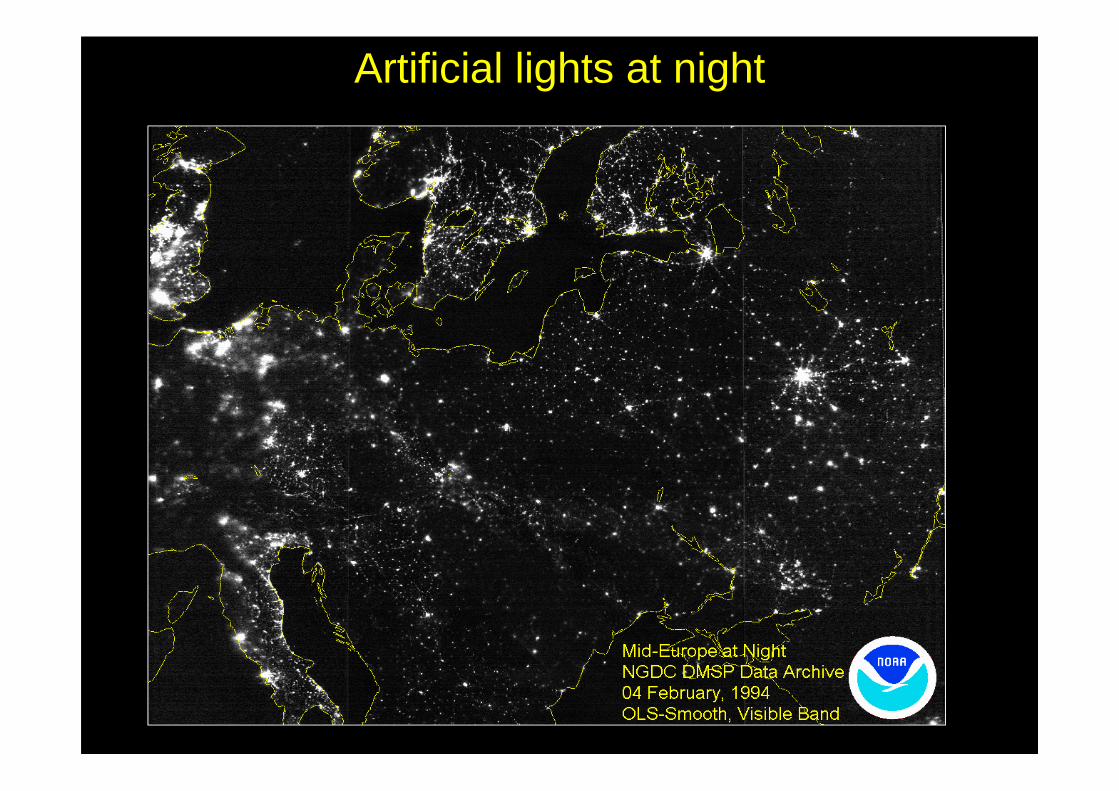
Artificial lights at night
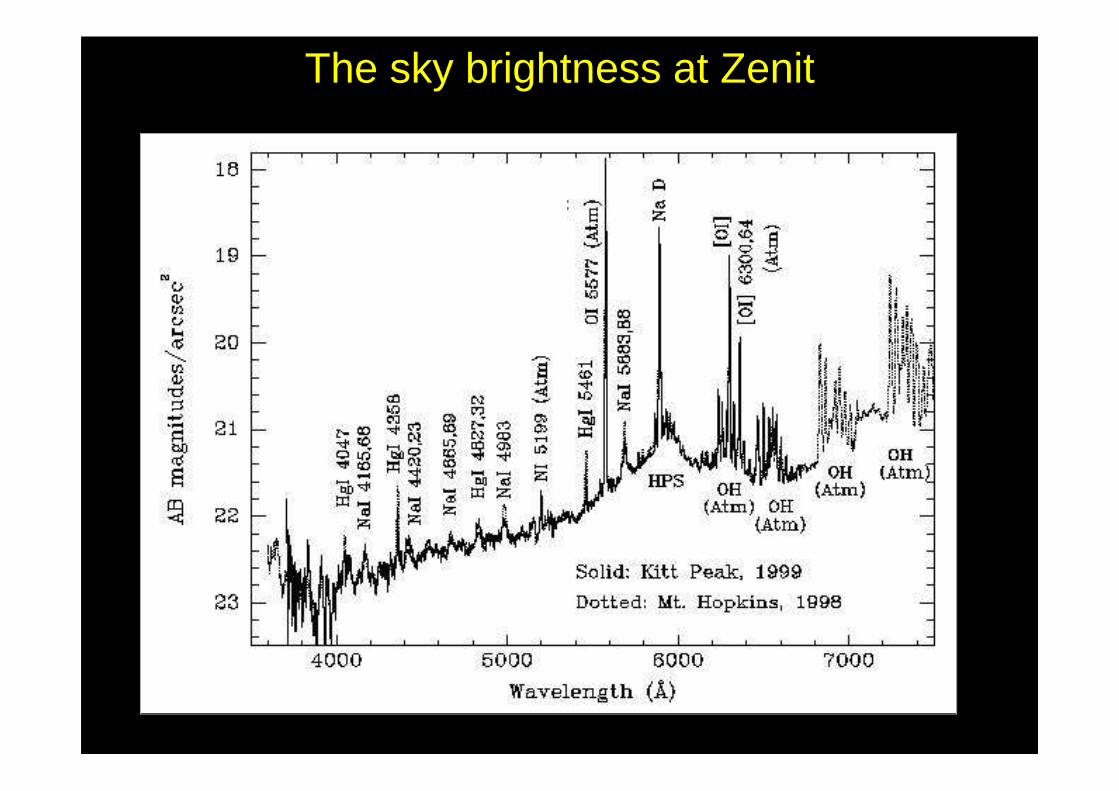
The sky brightness at Zenit

Hal
f ab
sorp
tion
alti
tud
e (k
m)
Wavelength (Å)
The atmospheric absorption

Spectra of the night sky and of Sun
( ) ( )
( )0
0
2.5log
T f d
m q
T dλ λ
λ λ λ
λ λ
∞
∞
= − +
∫
∫
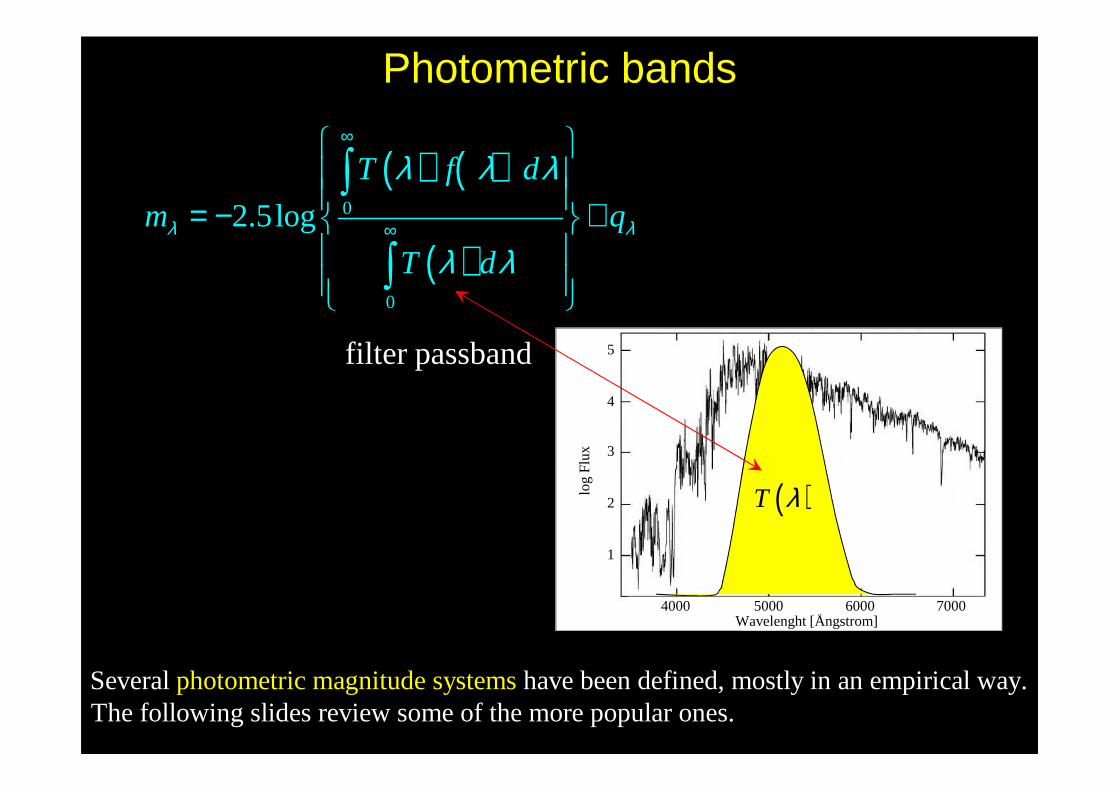
Photometric bands
( )T λ
Several have been defined, mostly in an empirical way. The following slides review som
photometric magnitudee of the more popular
sys on
temses.
Wavelenght [Ångstrom]
log
Flu
x
5
4
3
2
1
4000 5000 6000 7000
filter passband
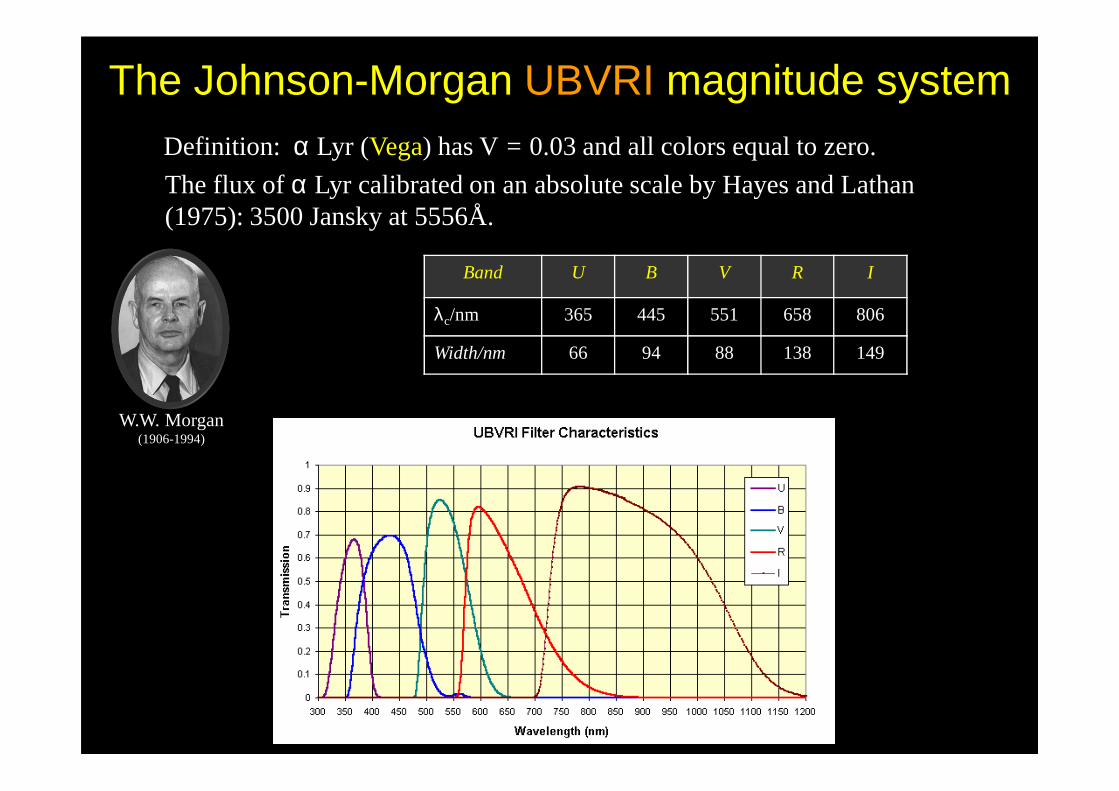
The Johnson-Morgan UBVRI magnitude systemDefinition: α Lyr (Vega) has V = 0.03 and all colors equal to zero.
The flux of α Lyr calibrated on an absolute scale by Hayes and Lathan (1975): 3500 Jansky at 5556Å.
W.W. Morgan(1906-1994)
Band U B V R I
λc/nm 365 445 551 658 806
Width/nm 66 94 88 138 149
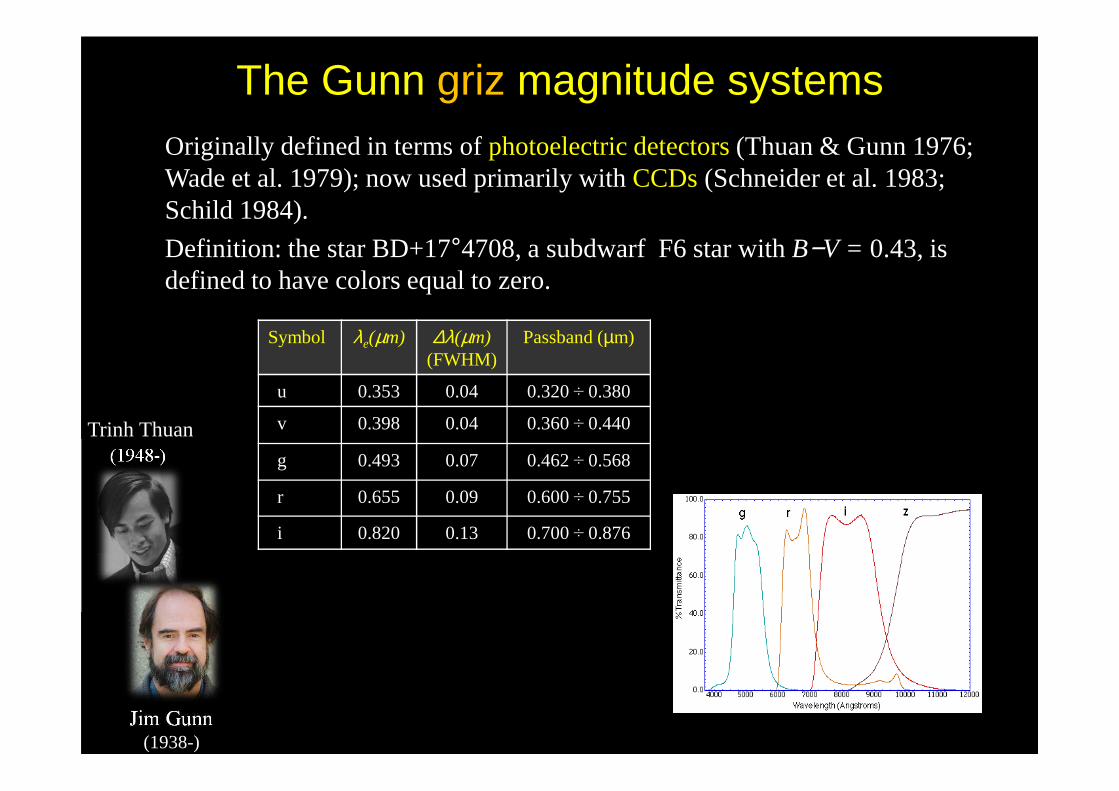
The Gunn griz magnitude systemsOriginally defined in terms of photoelectric detectors(Thuan & Gunn 1976; Wade et al. 1979); now used primarily with CCDs(Schneider et al. 1983; Schild 1984).
Definition: the star BD+17°4708, a subdwarf F6 star with B−V = 0.43, is defined to have colors equal to zero.
Jim Gunn (1938-)
Trinh Thuan(1948-)
Symbol λe(µm) ∆λ(µm) (FWHM)
Passband (µm)
u 0.353 0.04 0.320 ÷ 0.380
v 0.398 0.04 0.360 ÷ 0.440
g 0.493 0.07 0.462 ÷ 0.568
r 0.655 0.09 0.600 ÷ 0.755
i 0.820 0.13 0.700 ÷ 0.876
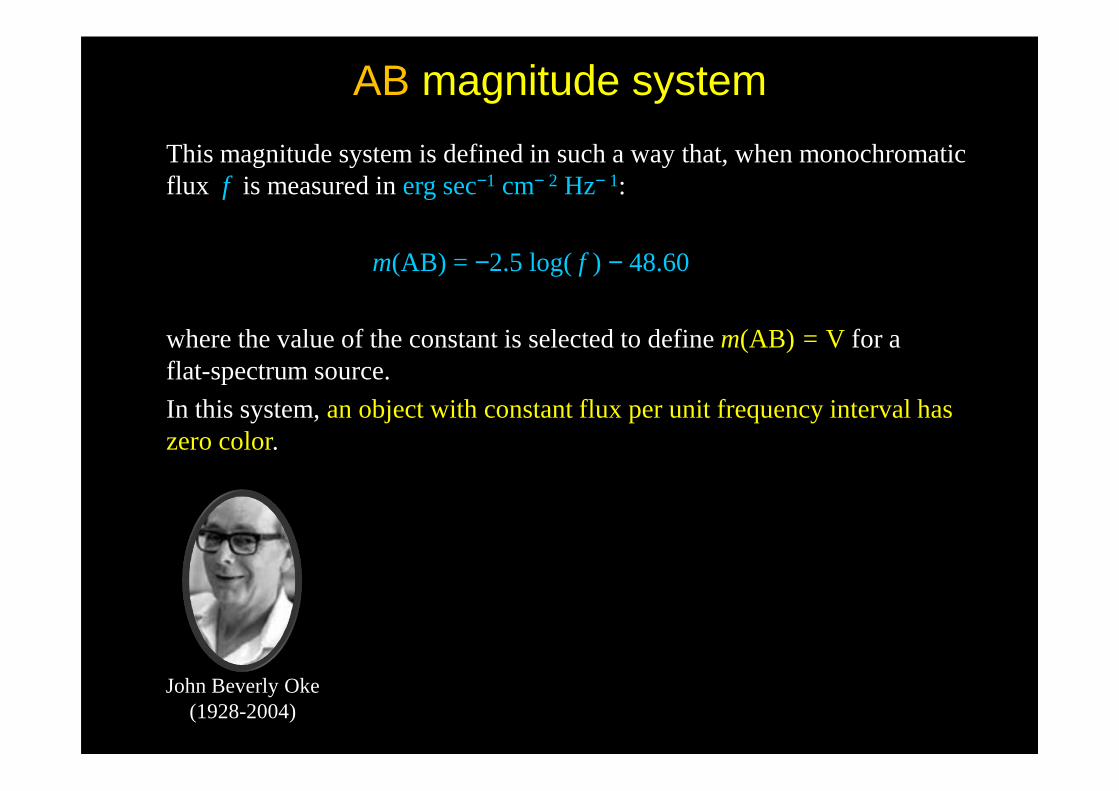
AB magnitude system
This magnitude system is defined in such a way that, when monochromatic flux f is measured in erg sec−1 cm− 2 Hz− 1:
m(AB) = −2.5 log( f ) − 48.60
where the value of the constant is selected to define m(AB) = V for a flat-spectrum source.
In this system, an object with constant flux per unit frequency interval has zero color.
John Beverly Oke(1928-2004)

Band name
Central λλλλ[mm]
Bandwidth[mm]
Flux of Vega[Jy]
U 0.37 0.066 1780
B 0.45 0.094 4000
V 0.55 0.088 3600
R 0.66 0.14 3060
I 0.81 0.15 2420
J 1.25 0.21 1570
H 1.65 0.31 1020
K 2.20 0.39 636
( ) ( )( )
,
0,
2.5log 2.5log
2.5logVegam f f
f mλ λ λ
λ λ
= − += − +
Cfr. http://www.astro.utoronto.ca/~patton/astro/mags.html#conversions
Imagine a source which has a constant flux of 10 Jy at all frequencies.
What is its magnitude in the U band? And in the V and K bands?
N.B.: the flux unit or Jansky (symbol Jy) is a non-SI unit of electromagnetic flux density equivalent to 10−26 W m−2 Hz−1.
Apparent magnitudes: exercise
Karl Gunther Jansky (1905-1950)
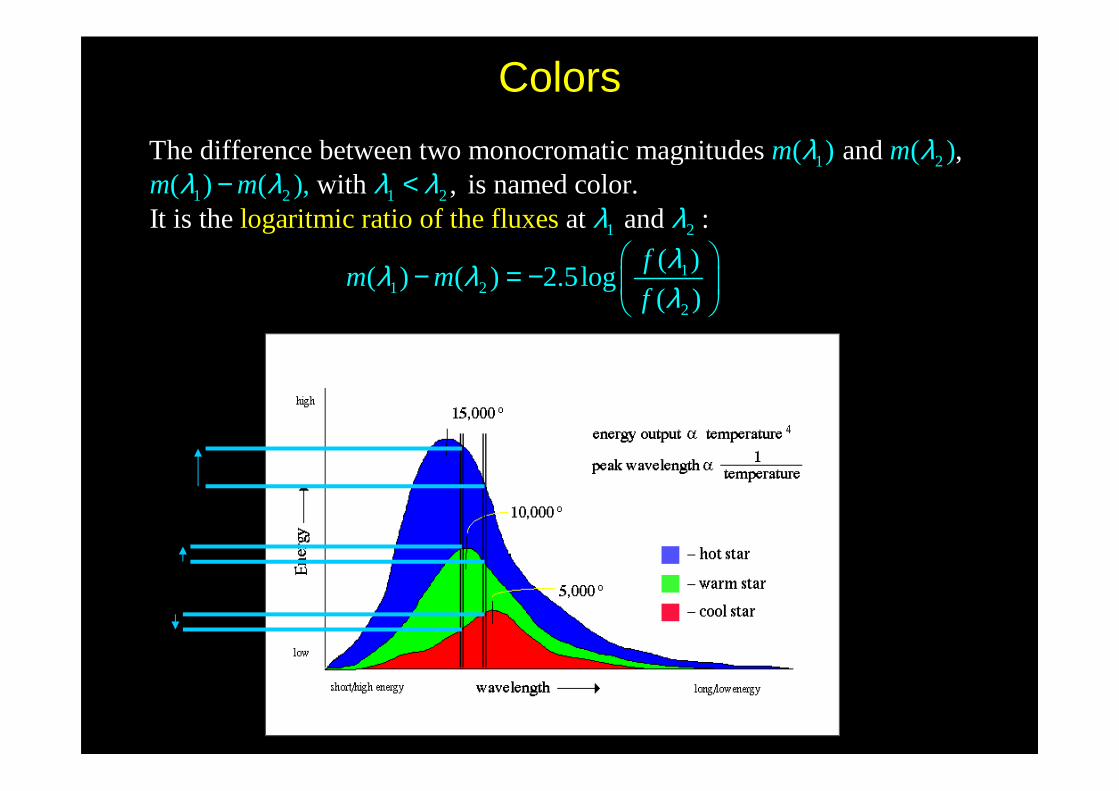
Colors
1 2
1 2 1 2
1 2
1
The difference between two monocromatic magnitudes and , with , is named
logaritmic ratio of thecolor.
It is the at and :
( ) ( )( )
fluxes
( ),
( ) (
m mm m
m m
λ λλ λ λ λ
λ λ
λ λ
− <
− 12
2
( )) 2.5log
( )
f
f
λλ
= −
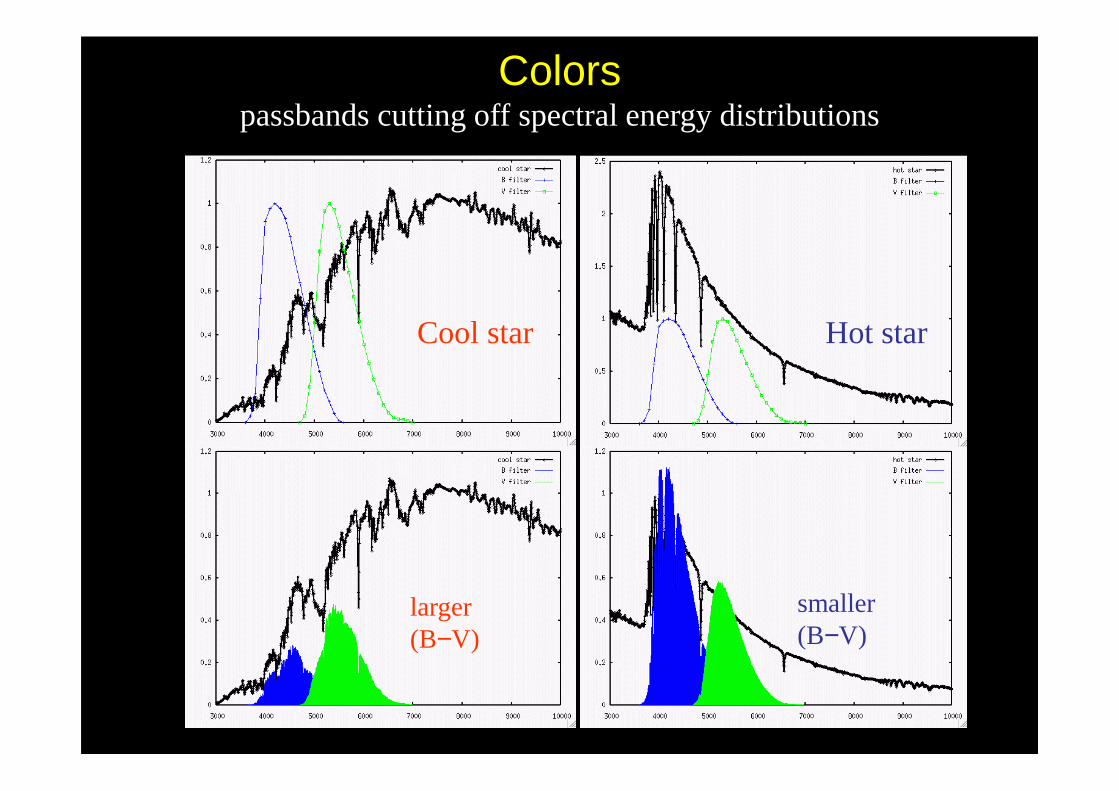
Colorspassbands cutting off spectral energy distributions
Cool star Hot star
larger (B−V)
smaller (B−V)
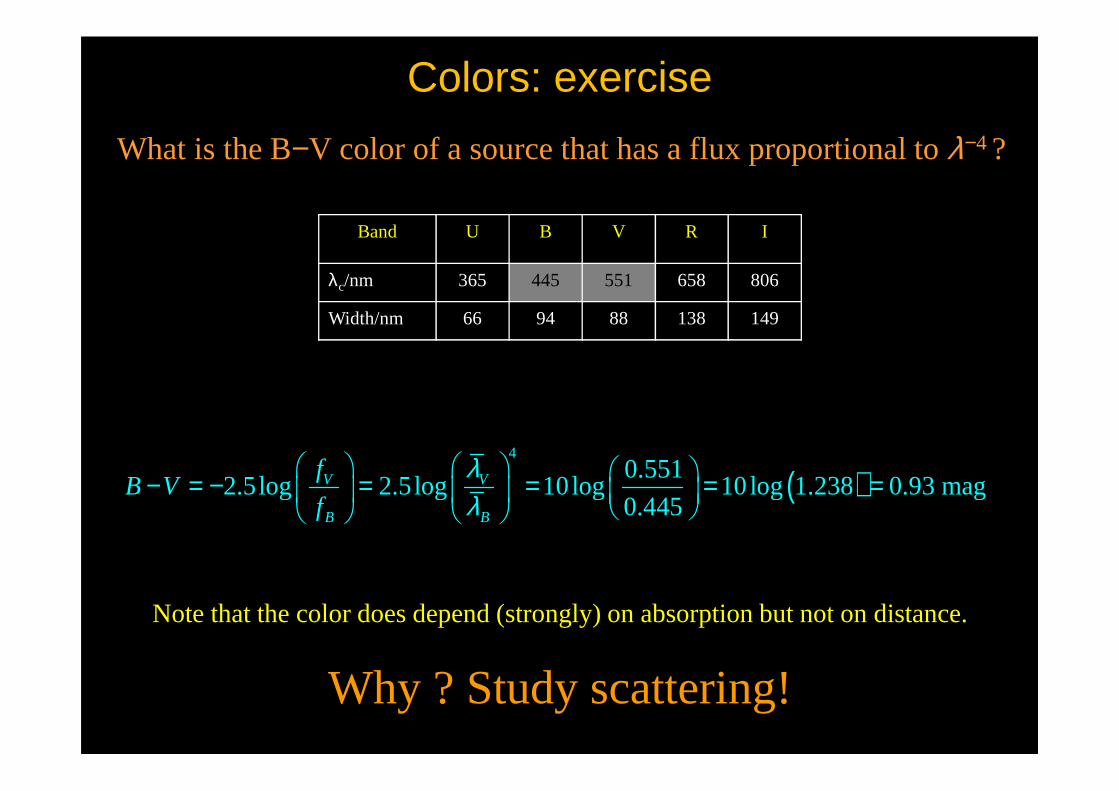
What is the B−V color of a source that has a flux proportional to λ−4 ?
Colors: exercise
( )4
0.5512.5log 2.5log 10log 10 log 1.238 0.93 mag
0.445V V
B B
fB V
f
λλ
− = − = = = =
Band U B V R I
λc/nm 365 445 551 658 806
Width/nm 66 94 88 138 149
Note that the color does depend (strongly) on absorption but not on distance.
Why ? Study scattering!

basic unit Astronomical Unit circular
In the cosmic distance scale, the is the = radius of of a point orbit sidereama l ss o yearrbiting about the
semimajo
(AU)
r ax S
isun in one
of Earth'
s orb≈
2 3
it
Kepler's third law
How do we measure this
.
Relative distances of planets from Sun can be determined from : .
which, given , for Earth and Mars, writes:
?
Mars
Mar
P aP P
P
P
⊕
⊕
∝
2 3
8
.
1 AU = 1.49598×10 km.
s Mars
a
a⊕
=
Unit of distance: the Astronomical Unit (AU)
360° relative to distant stars
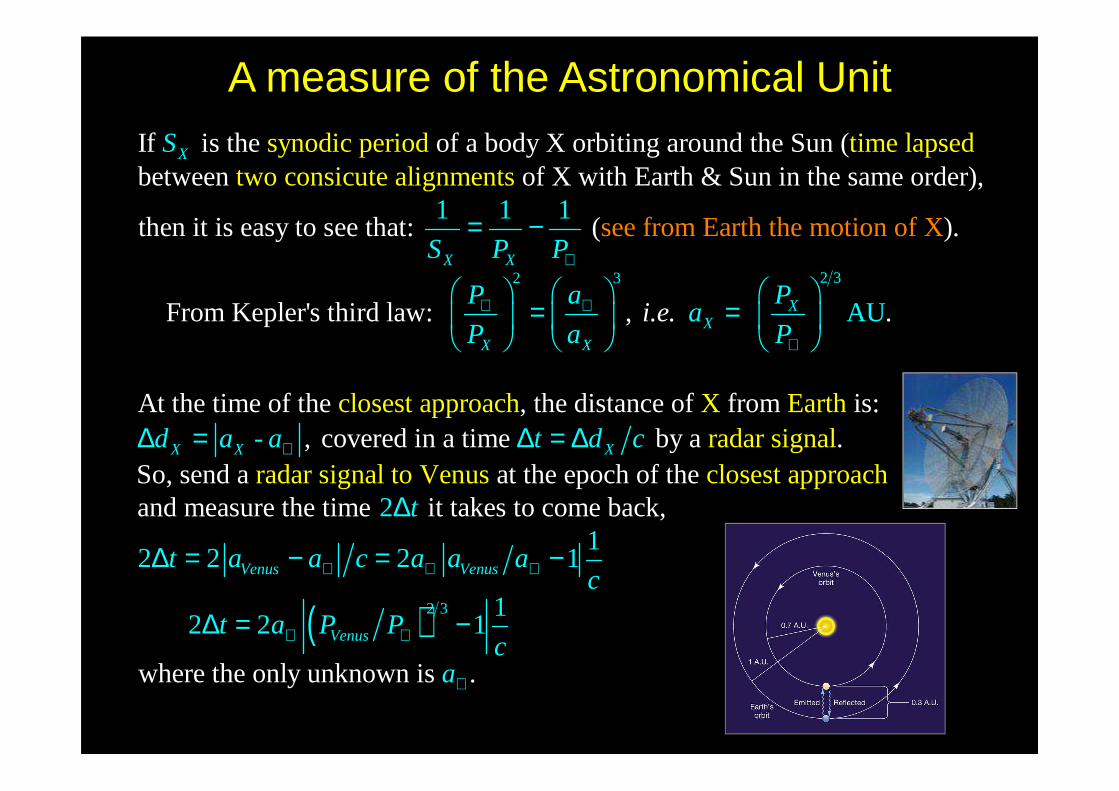
A measure of the Astronomical Unitsynodic period time lapsed
two consicute alIf is the of a body X orbiting around the Sun (between of X with Earth & Sun in the same order),
then it is easy to see that:
ignments
see f
1 1( r
1
X
X X
S
S P P⊕= −
2 32 3
).
From Kepler's third law: , .
At the time of the , the distance of from isclos
est approach X :, covered
om Ear
in aEarth
th the motion of X
AU
- t
XX
X X
X X
P a Pa
P a Pi.e.
d a a
⊕ ⊕
⊕
⊕
= =
∆ = ime by a .So, send a at the epoch of the and measure the time it take
radar si
s to com
gnalradar signal to Venus clos
21
2 2 2
est
e back, approa
ch
1
2 2
X
Venus Venus
Venus
t d c
t
t a a c a a ac
t a P P
⊕ ⊕ ⊕
⊕
∆ = ∆
∆
∆ = − = −
∆ = ( )2 3
where the only unknown is
11
.c
a
⊕
⊕
−
The “parallax” is the apparent shift in position of a nearby star, relative to background stars, as Earth moves around the Sun in its orbit.
This defines the unit 1 parsec = 206265 AU = 3.0857×10¹³ km ~ 3.2616 ly.
1 AU
p
d
second
s of a
rc
parsec
parallax in
distanxe to star in s
1
d ppd
==
=
Stellar Parallax: 1 pc ≈ 3.3 ly

Measuring Parallax The star with the largest parallax is Proxima Cen,
with p = 0".7723±0".0024
(from the Hipparcos Catalogue, cfr. webpage).
Compute its distance ? d [pc] =1/p"
These small angles are very difficult to measure from ground; the atmosphere tends to blur images on scales of ~1 arcsec.
It is possible to measure smaller parallax angles but only down to ~ 0.02 arcsec(corresponding to a distance of 1/0.02 = 50 pc).
Until recently, accurate parallaxes were only available for a few 102 very nearby stars.
Comparison of ground-based picture of the GC M4 with an HST Wide-Field Planetary Camera 2 image showing white dwarfs.
Proxima Centauri
Since Earth is ~8 kpc from Galactic Center, it is clear that this method is only useful for stars in the immediate Solar neighborhood.
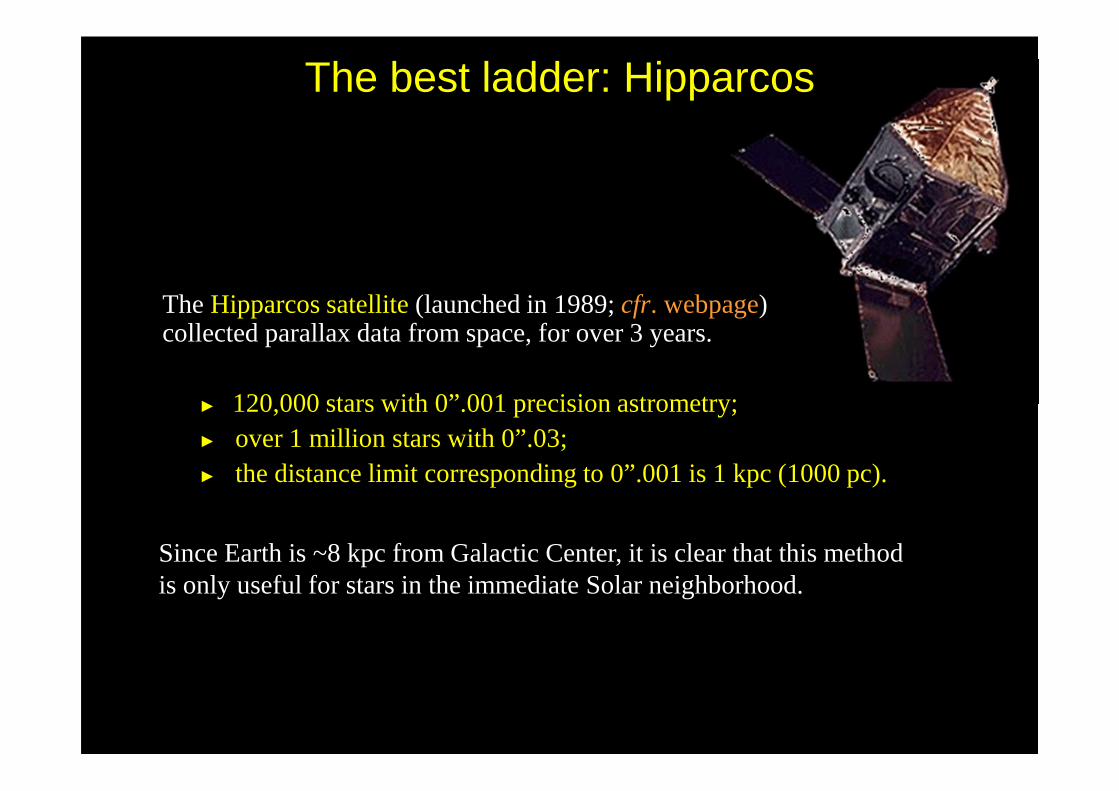
The best ladder: Hipparcos
The Hipparcos satellite (launched in 1989; cfr. webpage) collected parallax data from space, for over 3 years.
120,000 stars with 0”.001 precision astrometry; over 1 million stars with 0”.03; the distance limit corresponding to 0”.001 is 1 kpc (1000 pc).
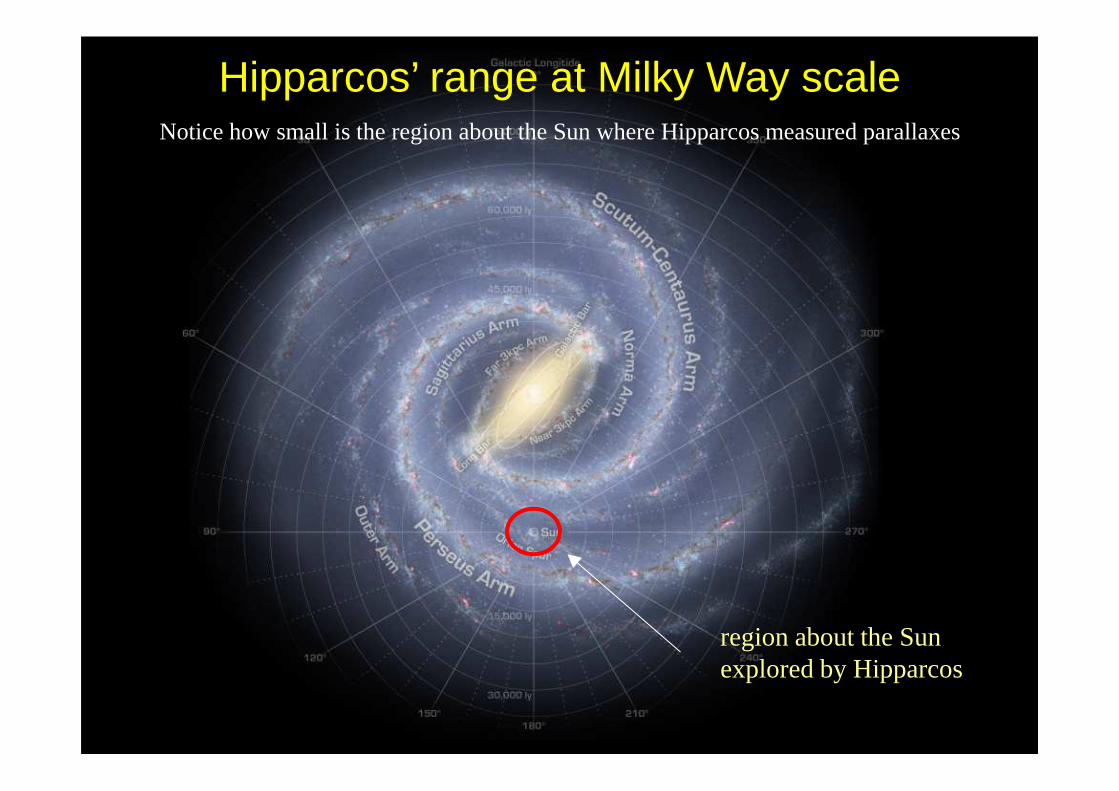
region about the Sun explored by Hipparcos
Hipparcos’ range at Milky Way scaleNotice how small is the region about the Sun where Hipparcos measured parallaxes

Since for the nearest stars d > 1 pc, we will measure p < 1 arcsec;
e.g.at d = 100 pc, p = 0.01 arcsec.
Telescopes on groundhave a resolution~ 1";
HSThas a resolution 0.05" ⇒even so, distances are difficult to gauge!
Hipparcos(High Precision Parallax Collecting)
satellite measured 105 bright stars with δp ~ 0.001"
⇒ confident distances for stars with d < 150 pc.
Hence ~105 stars with well measured parallax distances.
HST
Hipparcos
Limits of the parallax
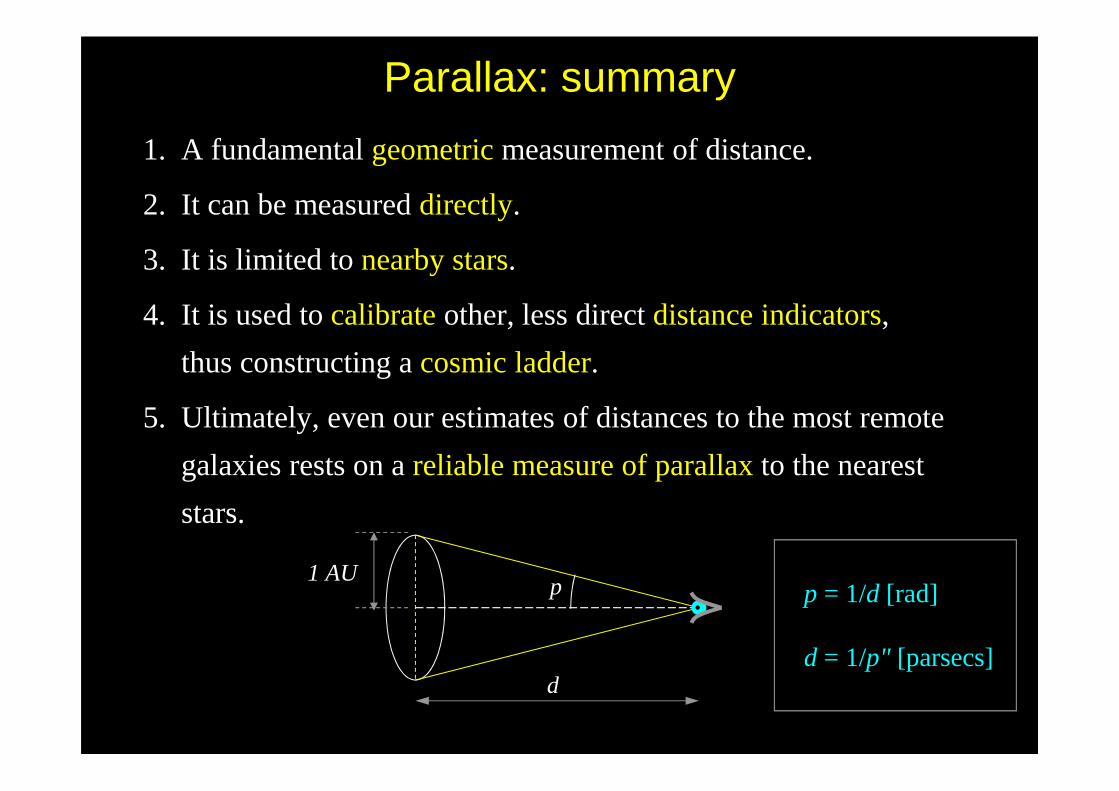
Parallax: summary
1. A fundamental geometricmeasurement of distance.
2. It can be measured directly.
3. It is limited to nearby stars.
4. It is used to calibrateother, less direct distance indicators,
thus constructing a cosmic ladder.
5. Ultimately, even our estimates of distances to the most remote
galaxies rests on a reliable measure of parallax to the nearest
stars.
For small angles: p = 1/d [rad]
d = 1/p" [parsecs]if is in arc seconds
1AUp p
d
•
d
1 AU
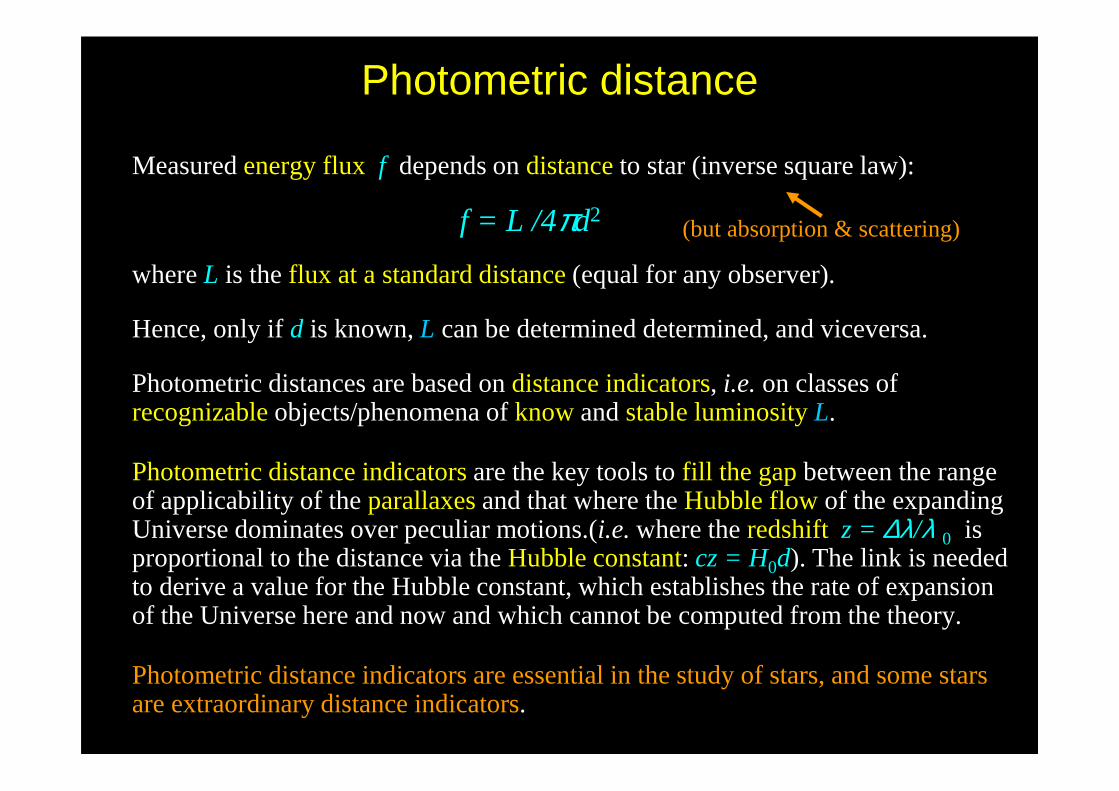
Measured energy flux f depends on distanceto star (inverse square law):
f = L /4πd2
where L is the flux at a standard distance (equal for any observer).
Hence, only if d is known, L can be determined determined, and viceversa.
Photometric distances are based on distance indicators, i.e. on classes of recognizable objects/phenomena of know andstable luminosity L.
Photometric distance indicators are the key tools to fill the gap between the range of applicability of the parallaxesand that where theHubble flow of the expanding Universe dominates over peculiar motions.(i.e. where the redshift z = ∆λ/λ 0 is proportional to the distance via the Hubble constant: cz = H0d). The link is needed to derive a value for the Hubble constant, which establishes the rate of expansion of the Universe here and now and which cannot be computed from the theory.
Photometric distance indicators are essential in the study of stars, and some stars are extraordinary distance indicators.
(but absorption & scattering)
Photometric distance

0 1 2 3 4 5 6 7 80
50
100
100×
∆d/d
(err
ore
%)
log(d[pc])
0 67 670 6700 cz[km/s]
Trigonometric parallaxes
Hipparcos satellite
Hubble law
Distance indicators
to relate the standard meter with the Hubble constant H0
Pleiades
Crab Nebula Galactic Center
Milky Way
M31
Virgo Cluster
Coma Cluster
Proxima Centauri
?base
rad
Rd
α=
radbase 2
rad
d Rα
α∆
∆ =
cos 0mV H d=
peccos pec 1m
VV V V V
V
= − = −
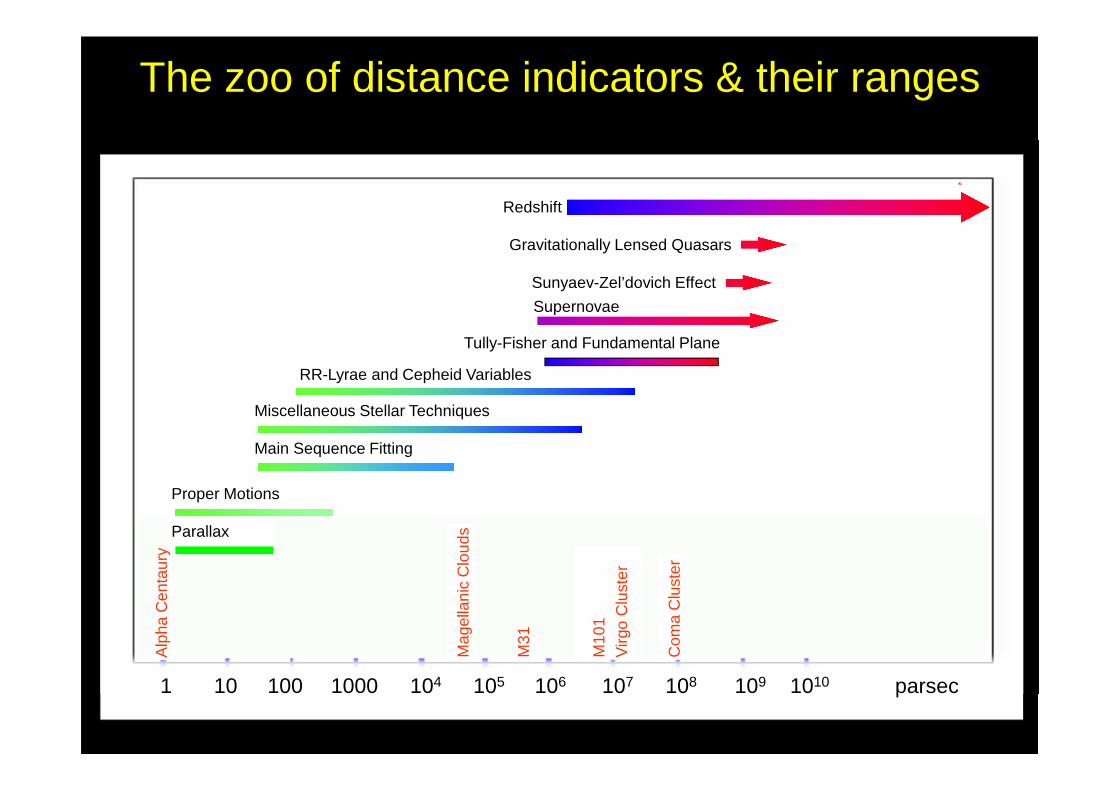
The zoo of distance indicators & their ranges
1 10 100 1000 104 105 106 107 108 109 1010 parsec
Redshift
Supernovae
Tully-Fisher and Fundamental Plane
RR-Lyrae and Cepheid Variables
Miscellaneous Stellar Techniques
Main Sequence Fitting
Proper Motions
Parallax
Gravitationally Lensed Quasars
Sunyaev-Zel’dovich Effect
Alp
ha C
enta
ury
Mag
ella
nic
Clo
uds
M31
Com
a C
lust
er
Virg
o C
lust
erM
101

Typical stars in the Solar neighborhood have velocities ~ 30 km/s.
What is the size of their Doppler shift at 5000 Å ? (Ans.: 0.5 Å)
Steller motions: examples
Mizar
The evolution of the shape of the Big Dipper during 200,000 years
Example of how much stars move (tangentially in this case)
epoch

Absolute magnitudes
2
It is also useful to have a measurement of an
. Since: , you must fix for all stars
intrinsic brightness independent of
the distance
absolute magni
.
The , , is defined to b
4
e the magnitudde
tu
Ld f d
d
M
π=
0
*
*
*
e that a star would have if it were at an . It is easy to show tha10 pc
10 pc5log 5log 5
pc
t:
(
arbitrar
note the
ily fixed
zero poin
distance
ts have cancelled out)
pa
wher [ re
d
dm M
d
d
=
− = − = −
] is the of the star of apparent magnitude .
The value of is kn
actual distance
distance modulus town as the (" " if the magnitudes are corrected for
rueabso
se
rp )
c
.on
ti
m
m M−
Useful to evaluate rapidly the observability of a source.

Example
*
6
5lo
Recall that the deepest exposures ever taken rea
ch
g 5 (@ 1 Mpc) 29.76pc
Calculate the apparent magnitude of the Sun (abs. mag. 4.76) at a distance of 1 Mpc (10 pc).
Dm M m
M
− = − =
→
=
⊙
⊙
lim ( ).
The nearest large galaxy to us is Andromeda (M31), at a distance of about .
Detecting stars like the Sun in other galaxies is there
HST Ultra Deep Fie
fore very difficul
29
0.78 Mpc
t (genera y
ld
ll
m =
impossible for now).
Recap:
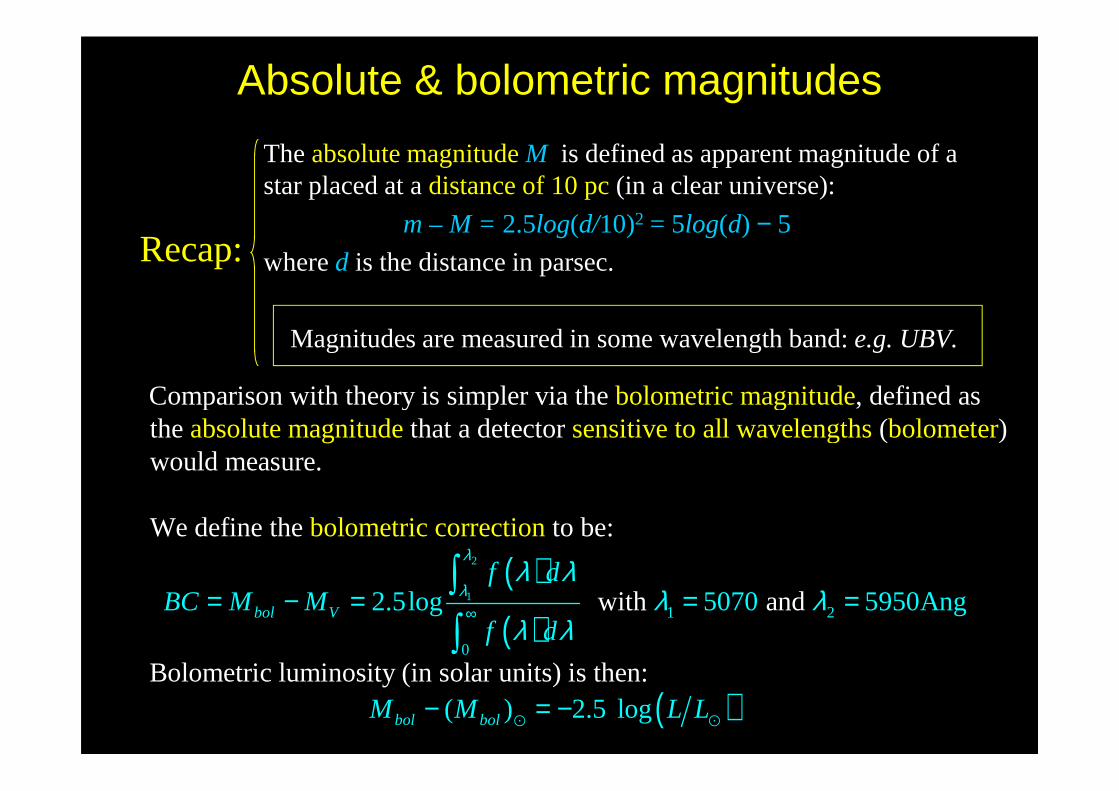
The absolute magnitudeM is defined as apparent magnitude of a star placed at a distance of 10 pc (in a clear universe):
m – M = 2.5log(d/10)2 = 5log(d) − 5
where d is the distance in parsec.
Magnitudes are measured in some wavelength band: e.g.UBV.
Comparison with theory is simpler via the , defined as the tha
bolometric magnitudeabsolute magnitude sensitive to all wt a detector ( )
would measure.
We define th
avelengths bolometer
bolometric ce orrec
( )
( )
( )
2
1
1 2
0
to be:
with and
Bolometric luminosity (in solar units) is then:
2.5log 5070 5950
Ang
( ) 2.5 l
.
tion
og
bol V
bol bol
f dBC M M
f d
M M L L
λ
λλ λ
λ λλ λ
∞= − = = =
− = −
∫
∫
⊙ ⊙
Absolute & bolometric magnitudes
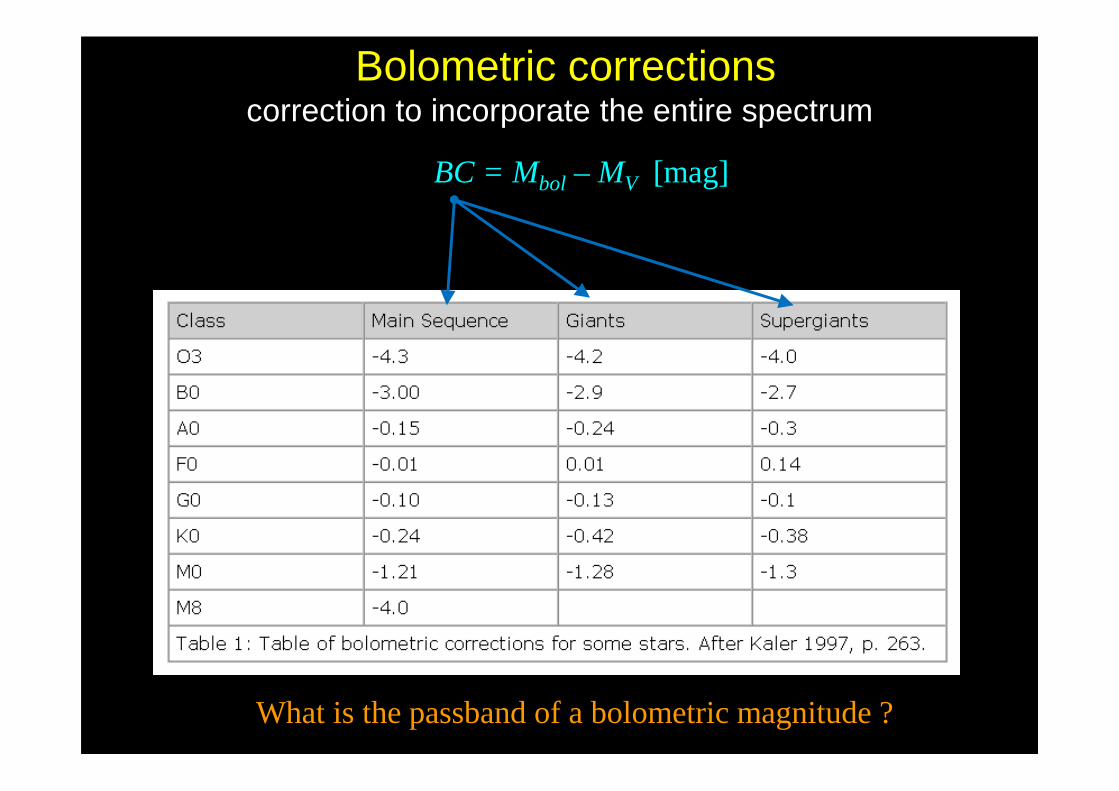
Bolometric correctionscorrection to incorporate the entire spectrum
BC = Mbol – MV [mag]
What is the passband of a bolometric magnitude ?

From Allen’s Astrophysical Quantities (4th edition)
OB
AF GK
M
Bolometric corrections for Main-Sequence stars
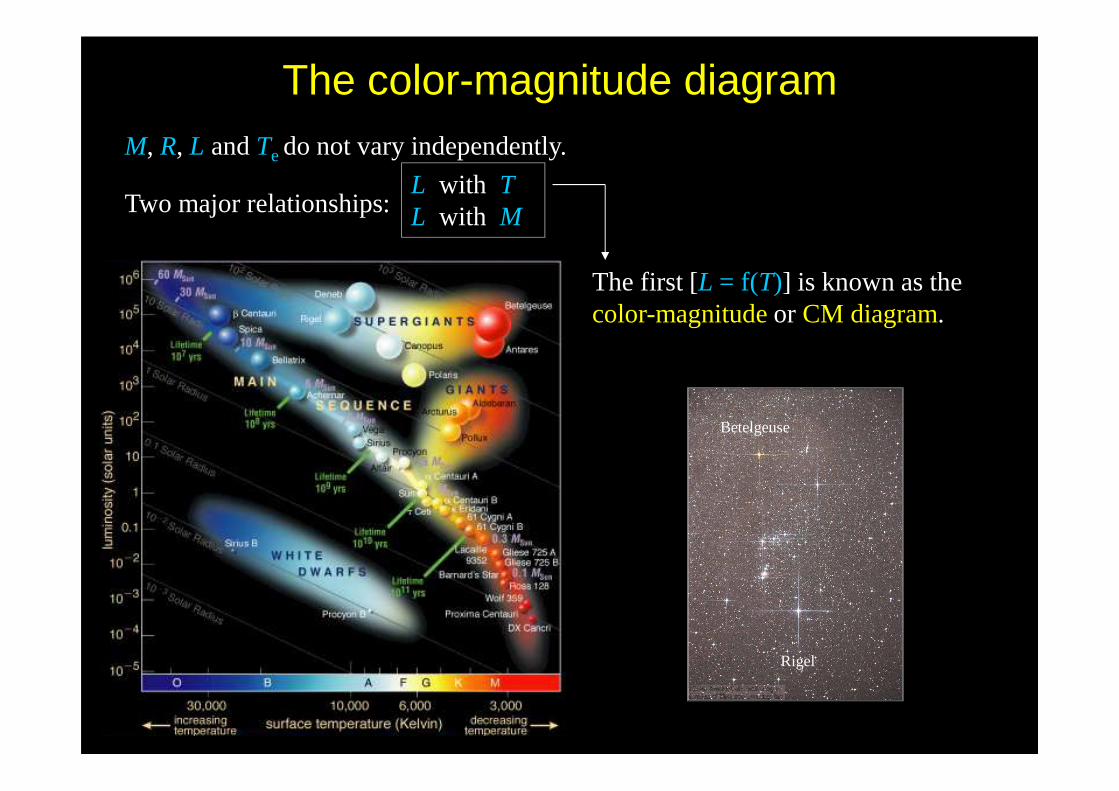
The color-magnitude diagramM, R, L and Te do not vary independently.
Two major relationships:
The first [L = f(T)] is known as the color-magnitude or CM diagram.
L with TL with M
Betelgeuse
Rigel

The Hertzsprung-Russell diagram
Ejnar Hertzsprung (1873-1967)
Henry N. Russell (1877-1957)
Another name of the CM diagram is the ( ) diagram (1914).
It proved to be the key to unlock the secrets
Hertzsprung
of stellar
-Russel
evolut
l H-R
ion.

The CM diagram
2
2
Precise parallax distances allow us to plot a colour-magnitude ( ) diagram for nearby stars.
Colour
c-m
independent of distance, ratio of fluxe
is since it is a s:
4
4
red red red
blue blue blue
f r L L
f r L L
ππ
= =
(y-axis) requires measurement oAbsolute magnitude
flux dista
f & nce.
CMD for Hipparcos with good distances (< 15% errror), that is for nearby stars.

Types of stars
Intrinsically faint stars are more common than luminous ones.
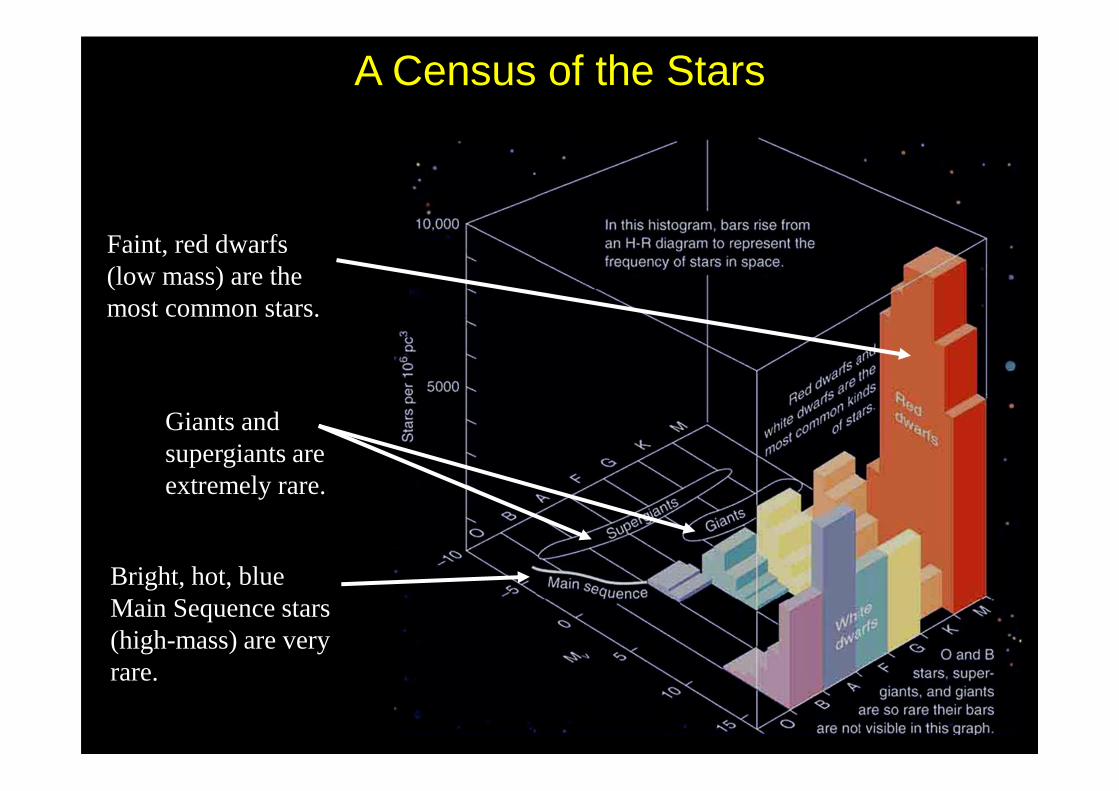
A Census of the Stars
Faint, red dwarfs (low mass) are the most common stars.
Bright, hot, blue Main Sequence stars (high-mass) are very rare.
Giants and supergiants are extremely rare.
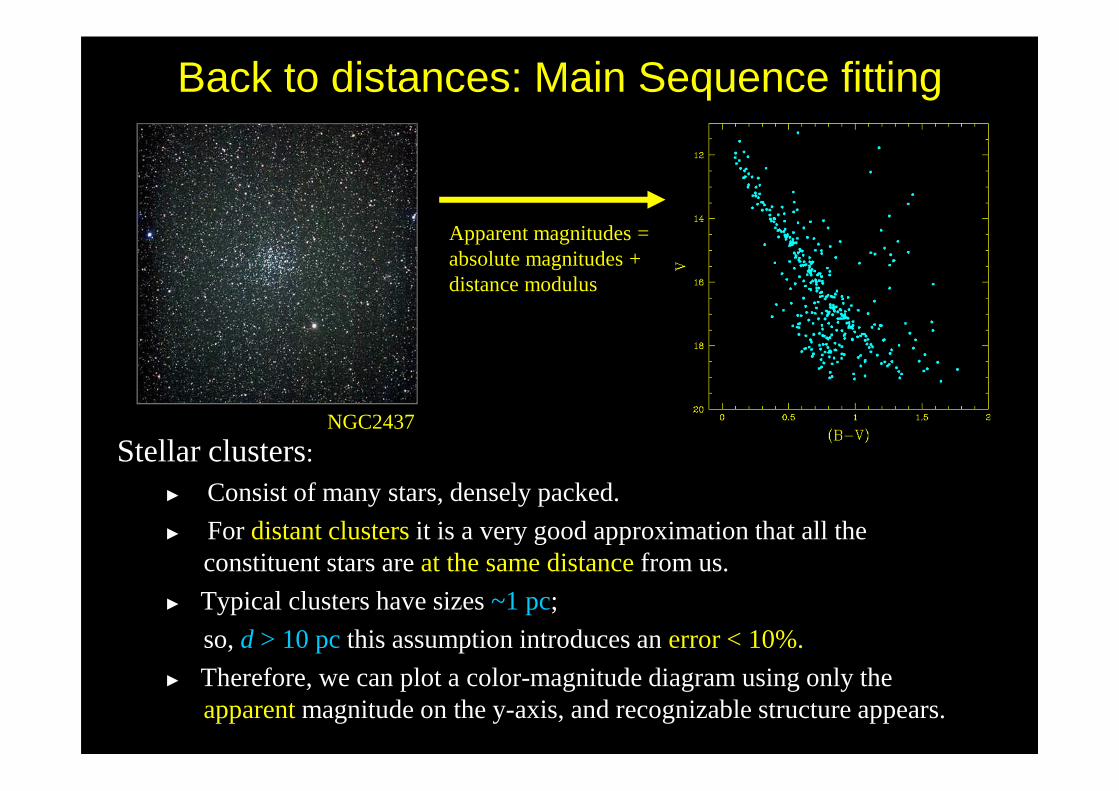
Back to distances: Main Sequence fitting
Stellar clusters: Consist of many stars, densely packed.
For distant clustersit is a very good approximation that all the constituent stars are at the same distancefrom us.
Typical clusters have sizes ~1 pc;
so, d > 10 pcthis assumption introduces an error < 10%.
Therefore, we can plot a color-magnitude diagram using only the apparentmagnitude on the y-axis, and recognizable structure appears.
NGC2437
Apparent magnitudes = absolute magnitudes + distance modulus
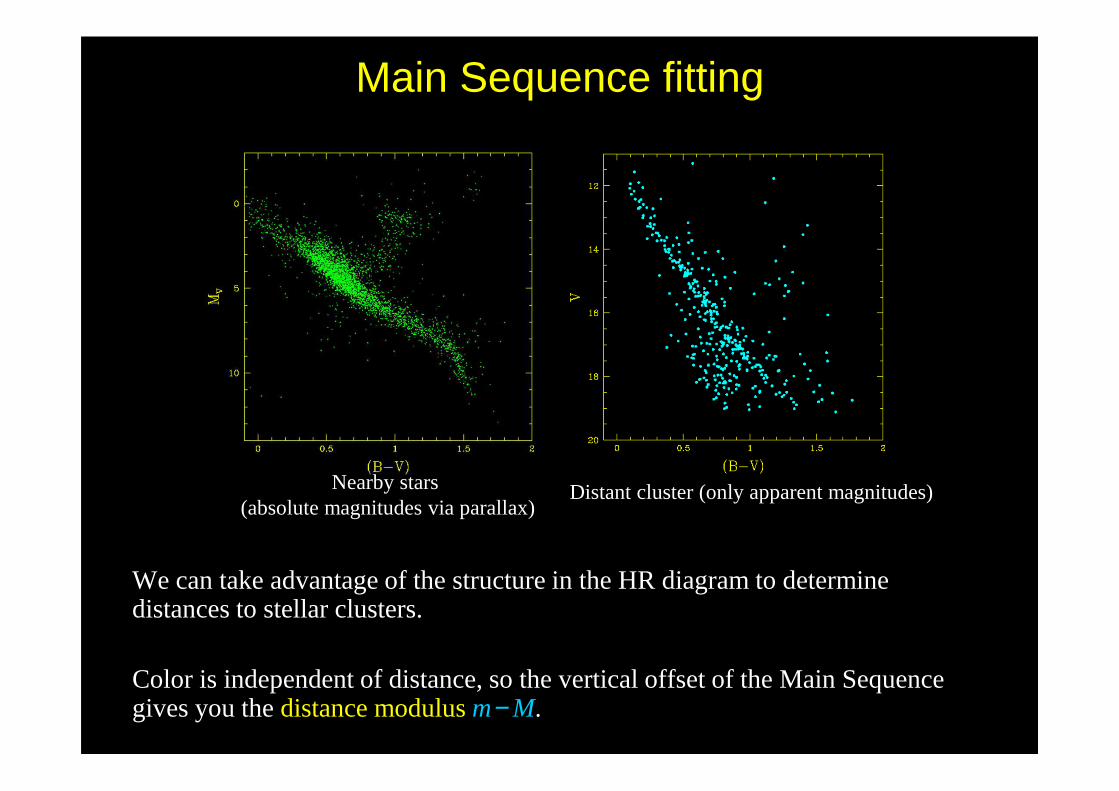
We can take advantage of the structure in the HR diagram to determine distances to stellar clusters.
Color is independent of distance, so the vertical offset of the Main Sequence gives you the distance modulusm− M.
Main Sequence fitting
Nearby stars (absolute magnitudes via parallax)
Distant cluster (only apparent magnitudes)

Main Sequence fitting: NGC 2437
Nearby stars (parallax) Distant cluster (apparent magnitudes)
Thus the distance modulus is: This gives a distance to NGC 2
10.7 5log 5 log 3.14.1.4437 of , close to the acce kp pte
dc 1. value p .8 k c
Vm M V M d d− = − = = − =⇒
At a colour of , the absolute magnitude of the MS is
1.0 mag
. 6.8 magV
B V
M
− =
=
In NGC 2437, at the same colour,
17.
5.V =
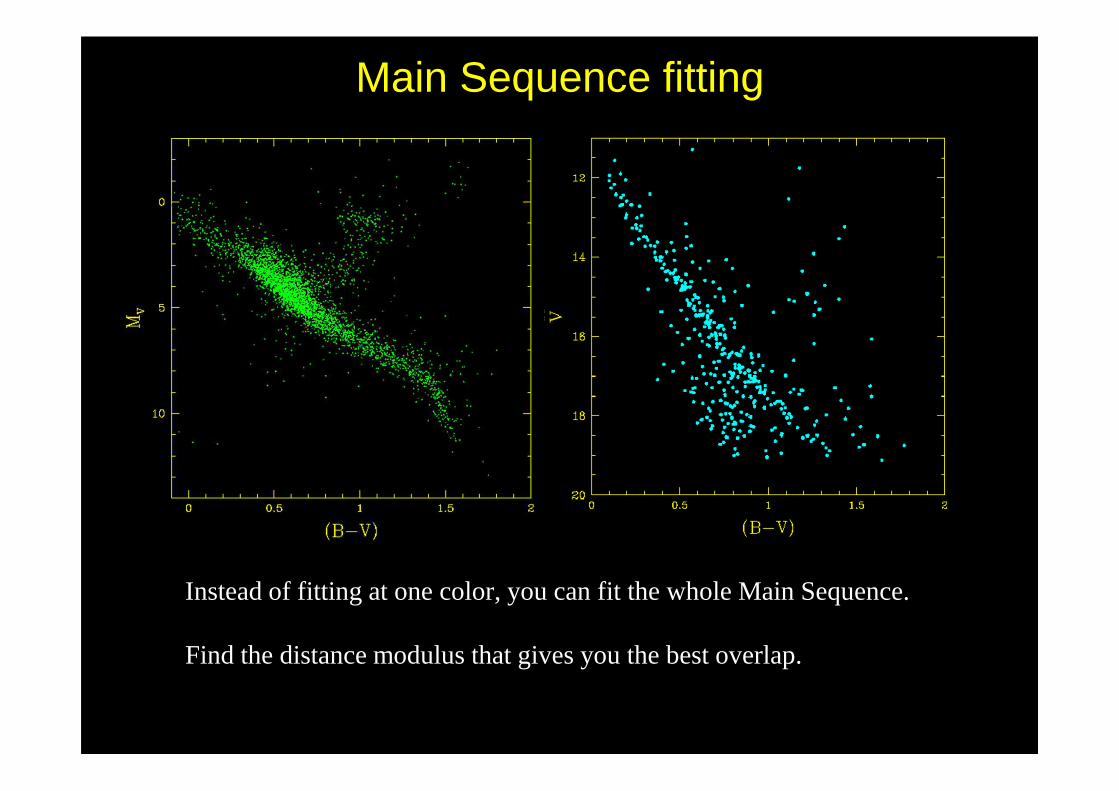
Instead of fitting at one color, you can fit the whole Main Sequence.
Find the distance modulus that gives you the best overlap.
Main Sequence fitting

Hyades cluster
(B−V)
App
aren
t m
agni
tude
V
The Globular Cluster NGC 104 = 47 Tuc
m−
M =
13
.5 m
ag
47 Tuc MS fitted to Hyades’
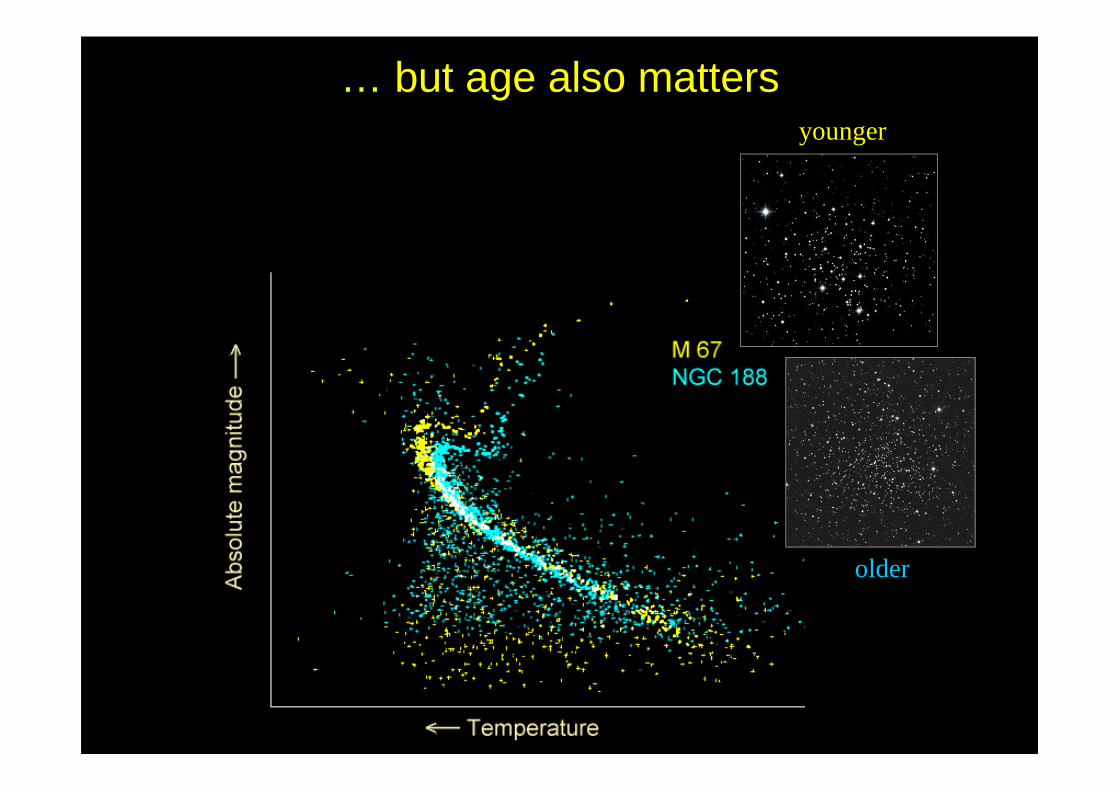
… but age also mattersyounger
older

Variable stars
The images above show the same star field at two different times.
One of the stars in the field has changed brightness relative to the other stars.
Can you see which one?
t1 t2

Variable stars
The images above show the same star field at two different times.
One of the stars in the field has changed brightness relative to the other stars.
Can you see which one?
blinking between t1 & t2

Many stars show fluctuations in their brightness with time.
These variations can be characterized by their light curve– a plot of their magnitude as a function of time.
These variations can be periodic, semi-periodic, or irregular.
Variable stars
RR Lyrae in the GC M3
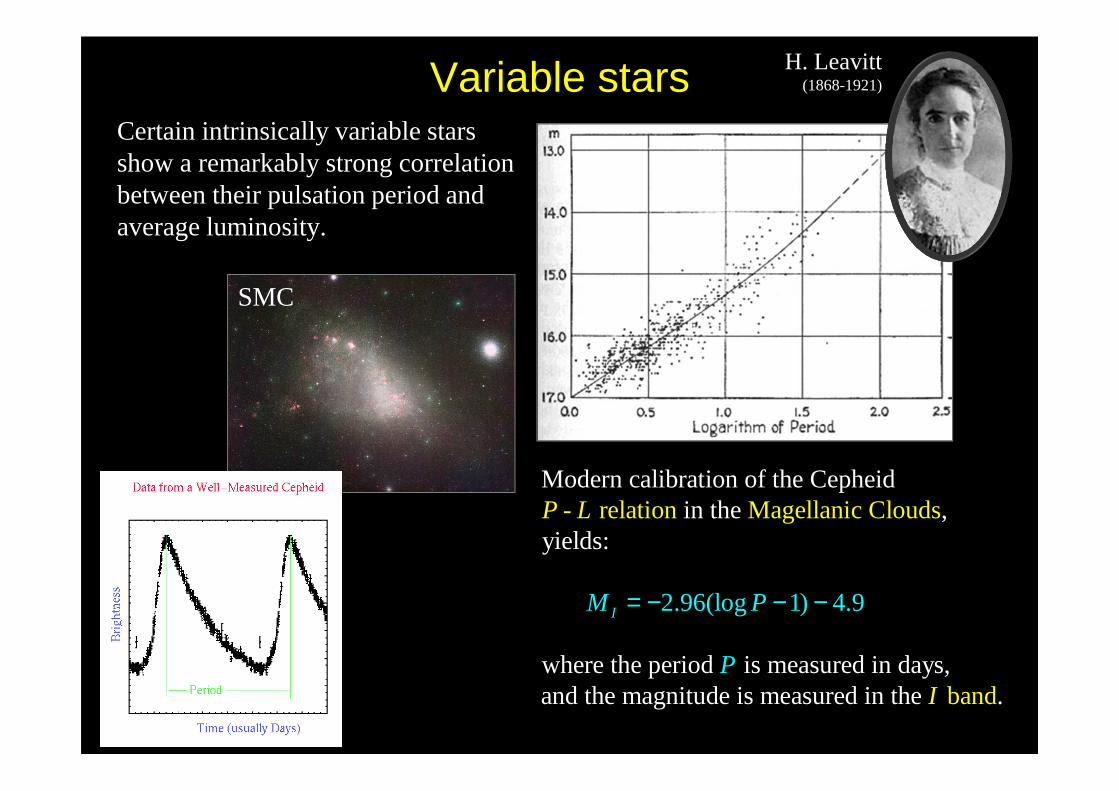
Certain intrinsically variable stars show a remarkably strong correlation between their pulsation period and average luminosity.
2.96(log
Modern calibration of the Cepheid in the ,
yields:
where the period is measured in days, and the magnitude is measured in the
- relation Magellanic C
louds
ba n .
1) 4.9
d
IM P
P
P L
I
= − − −
Variable stars H. Leavitt (1868-1921)
SMC
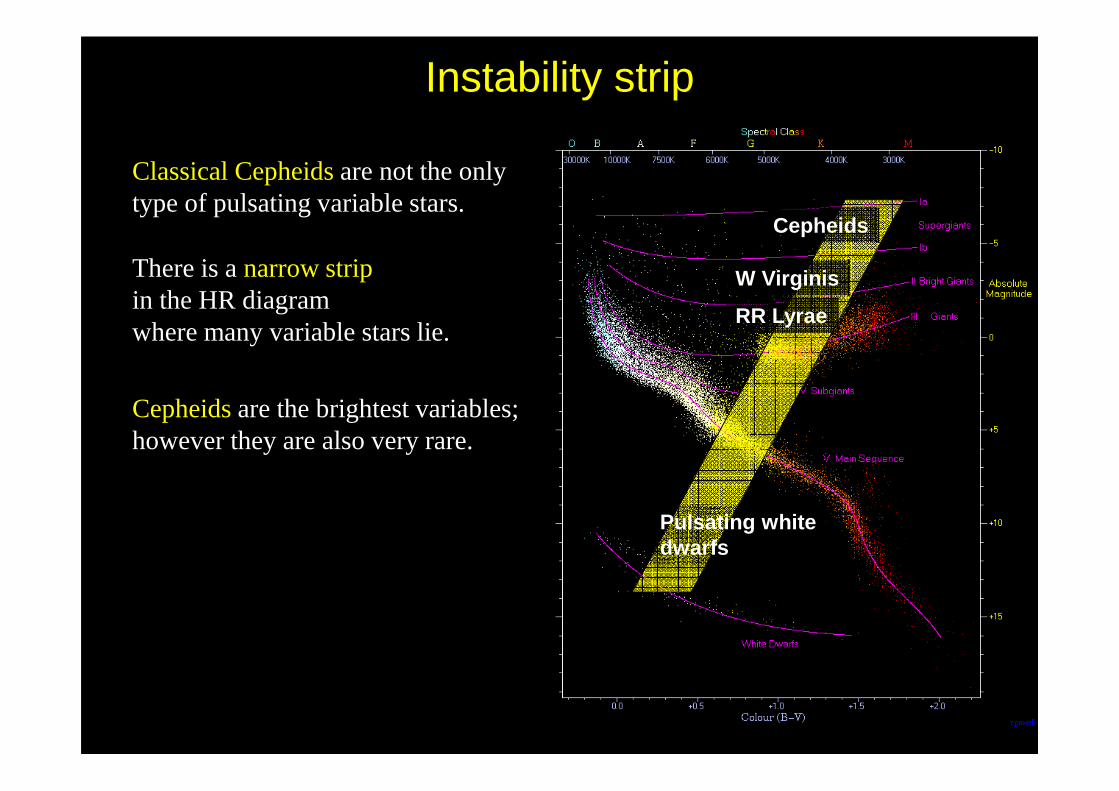
Instability strip
Classical Cepheidsare not the only type of pulsating variable stars.
There is a narrow stripin the HR diagram where many variable stars lie.
Cepheidsare the brightest variables; however they are also very rare.
Cepheids
RR Lyrae
Pulsating whitedwarfs
W Virginis

RR Lyrae starsRR Lyrae stars(absolute magnitudes MV = +0.59 ± 0.33) are much fainter than Cepheids, but have the advantage that:
1. they almost all have the same luminosity and
2. are more common.
They are easily identifiedby their much shorter periods.
Abs
olut
e M
agni
tude
Period (days)
Log (Period)
Schematic representation
RR Lyrae
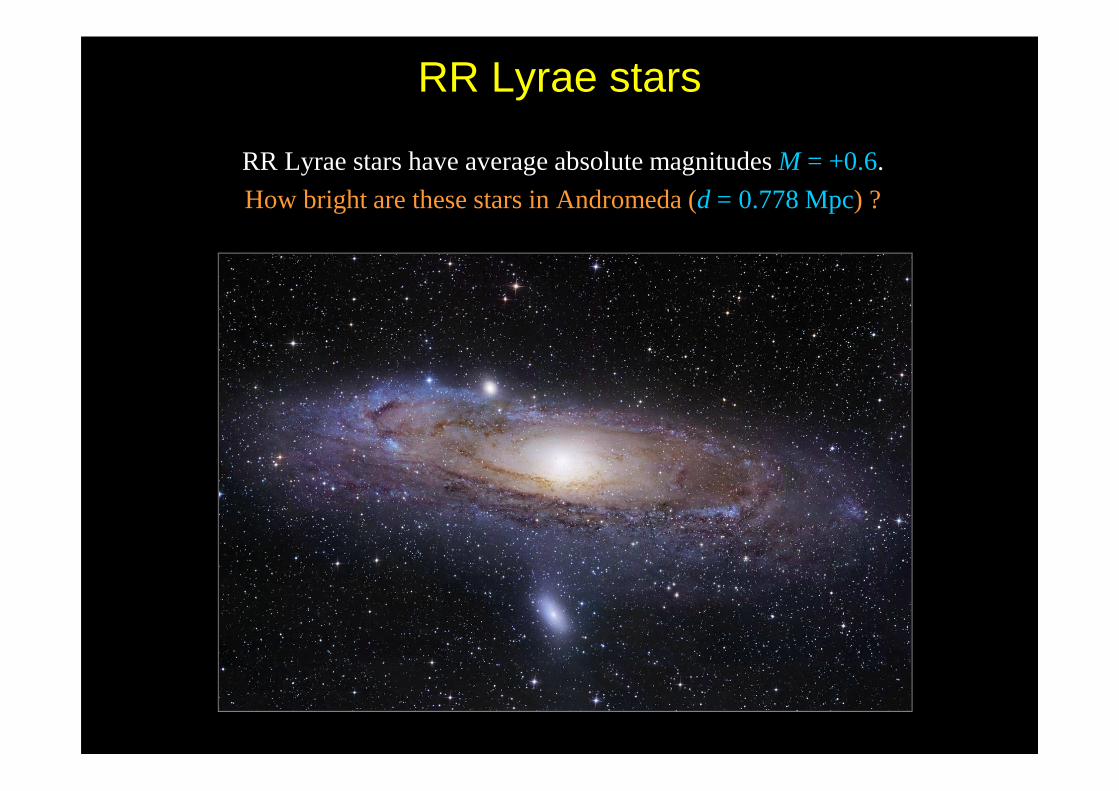
RR Lyrae stars have average absolute magnitudes M = +0.6.
How bright are these stars in Andromeda (d = 0.778 Mpc) ?
RR Lyrae stars
The distance ladder: summary
1. Find parallax distances to the nearest stars.
Dedicated satellites are now providing these precise measurements for thousands of stars.
Plot stellar absolute magnitudes as a function of color.
2. Measure fluxes and colors of stars in distant clusters.
Compare with color-magnitude diagram of nearby stars (step 1) and use Main-Sequence fitting method to compute distances.
Identify any variable stars in these clusters. Calibrate a period-luminosity relation for these variables.
3. Measure the periods of bright variable stars in remote parts of the Galaxy, and even in other galaxies.
Use the period-luminosity relation from step 2 to determine the distance.
Note how an error in step 1 follows through all the subsequent steps!

Useful reading