kurrent technologies ltd. 14 february 2016
TRANSCRIPT

wkcgroup.com
1050MW Coal Fired Power Plant
Hydrodynamic Modelling Report
Kurrent Technologies Ltd.
J3114_03 Rev02
14 February 2016

Disclaimer
WKC Environment Consultancy accepts no responsibility to any parties whatsoever, following the issue of the Document, for any matters arising outside the agreed scope of the work. This Document is issued in confidence to the Client and WKC Environment Consultancy has no responsibility to any third parties to whom this Document may be circulated, in part or in full, and any such parties rely on the contents of the report solely at their own risk.
The copyright on this document is the property of WKC Environment Consultancy. This document is supplied by WKC Environment Consultancy. on the express terms that it is to be treated as confidential and that it may not be copied, used or disclosed to others for any purpose except as authorised in writing by WKC Environment Consultancy.

Report Approval & Revision Record
Project: 1050MW Coal Fired Power Plant
Document Title: Hydrodynamic Modelling Report
Client: Kurrent Technologies Ltd.
Report Number: J3114_03 Rev02
Rev Date Prepared Reviewed Approved
01 14th February 2016 Greg Ashcroft
Senior Consultant
Graeme Hubbert
Principal Associate
Richard Palmer
Partner
02 4th July 2016 Greg Ashcroft
Senior Consultant
Graeme Hubbert
Principal Associate
Richard Palmer
Partner

Kurrent Technologies Ltd. 1050MW Coal Fired Power Plant
Hydrodynamic Modelling Report J3114_03 Rev02
Table of Contents 1 INTRODUCTION ....................................................................................................................................... 1
1.1 PROJECT LOCATION ................................................................................................................................ 1 1.2 STUDY OBJECTIVES ................................................................................................................................ 5 1.3 ASSESSMENT METHOD ............................................................................................................................ 5
1.3.1 Near-Field Design Screening ........................................................................................................ 5 1.3.2 Far-Field Plume Simulation ........................................................................................................... 6
1.4 PROJECT STANDARDS ............................................................................................................................. 6
2 MODELLING SYSTEMS ........................................................................................................................... 8
2.1 3D HYDRODYNAMICS (GEMMS 3D COASTAL OCEAN MODEL) .................................................................. 8 2.2 PLUME DISPERSION ................................................................................................................................ 8
2.2.1 Mixing Processes .......................................................................................................................... 8 2.2.2 Cornell Mixing Zone Expert System (CORMIX) ............................................................................ 9 2.2.3 GEMMS 3D Plume Discharge Model (PLUME3D) ....................................................................... 9
3 MARINE MODELLING METHODOLOGY .............................................................................................. 11
3.1 OVERVIEW ............................................................................................................................................ 11 3.2 HYDRODYNAMIC MODELLING ................................................................................................................. 11
3.2.1 Overview ..................................................................................................................................... 11 3.2.2 About the GCOM3D Hydrodynamic Model ................................................................................. 12 3.2.3 Ocean Model Setup .................................................................................................................... 13 3.2.4 Model Grids and Bathymetry ....................................................................................................... 13 3.2.5 Winds .......................................................................................................................................... 15 3.2.6 GCOM3D Simulations ................................................................................................................. 15 3.2.7 Verification of Tide and Current Predictions ............................................................................... 18
3.3 NEAR FIELD SCREENING ASSESSMENT................................................................................................... 19 3.3.1 Location Screening ..................................................................................................................... 19 3.3.2 Design Screening ........................................................................................................................ 21 3.3.3 Input Parameters ......................................................................................................................... 22
3.4 FAR-FIELD PLUME SIMULATIONS ............................................................................................................ 23 3.4.1 Overview ..................................................................................................................................... 23 3.4.2 About the PLUME3D Model ........................................................................................................ 24
3.5 ASSUMPTIONS AND LIMITATIONS ............................................................................................................ 24
4 RESULTS ................................................................................................................................................ 25
4.1 NEAR-FIELD DESIGN SCREENING ........................................................................................................... 25 4.2 FAR-FIELD SIMULATIONS ....................................................................................................................... 29
4.2.1 Temperature ................................................................................................................................ 29
5 SUMMARY & CONCLUSIONS ............................................................................................................... 33
6 REFERENCES ........................................................................................................................................ 34
APPENDIX A – DESIGN OPTION VISUALISATIONS ................................................................................... 35

Kurrent Technologies Ltd. 1050MW Coal Fired Power Plant
Hydrodynamic Modelling Report J3114_03 Rev02
List of Tables Table 3-1 – Summary of Hydrodynamic Modelling Approach ........................................................ 12
Table 3-2 - Ambient Parameters at Location Options .................................................................... 21
Table 3-3 - Design Screening Options Parameters ....................................................................... 22
Table 3-4 - Cooling Water Effluent Parameters ............................................................................. 23
Table 3-5 – Summary of Ambient Parameters .............................................................................. 23
Table 3-6 – Cooling Water Discharge Simulation .......................................................................... 24
Table 4-1 - Near-Field Design Screening Results Summary ......................................................... 26
Table 4-2 - Far Field Impact Area Summary ................................................................................. 30
List of Figures Figure 1-1 - Project Location ........................................................................................................... 2
Figure 1-2 - General Plant Overlay ................................................................................................. 3
Figure 1-3 – General Plant Layout .................................................................................................. 4
Figure 1-4 – Cooling Water Discharge Location .............................................................................. 5
Figure 3-1 – Modelling Flow Chart ................................................................................................ 12
Figure 3-2 – Interpolated Bathymetric Survey Data ....................................................................... 14
Figure 3-3 - Surface currents (modelled) during the flood tide ....................................................... 16
Figure 3-4 - Surface currents (modelled) during the ebb tide ........................................................ 17
Figure 3-5 - Comparison of GCOM3D Sea Lvel Predictions with Tide Table Data ........................ 18
Figure 3-6 - Intake and Outfall Location Options ........................................................................... 20
Figure 4-1 - Selected Outfall Design - Uni-Directional Diffuser (Ef) (MHT) .................................... 28
Figure 4-2 - Maximum Differential Temperature (95th Percentile) Scenario Ef: Uni-directional Perpendicular Diffuser at Location E ......................................................................... 31
Figure 4-3 - Maximum Differential Temperature (95th Percentile) Scenario Ea: Single Port Pipe at Location E................................................................................................................. 32
Figure 6-1: Diffuser Design visualization - "b" ............................................................................... 36
Figure 6-2: Diffuser Design visualization - "c" ................................................................................ 37
Figure 6-3: Diffuser Design visualization - "d" ............................................................................... 38
Figure 6-4: Diffuser Design visualization - "e" ............................................................................... 39

Kurrent Technologies Ltd. 1050MW Coal Fired Power Plant
Hydrodynamic Modelling Report J3114_03 Rev02
Figure 6-5: Diffuser Design visualization - "f" ................................................................................ 40
Figure 6-6: Diffuser Design visualization - "g" ............................................................................... 41

Kurrent Technologies Ltd. 1050MW Coal Fired Power Plant
Hydrodynamic Modelling Report 1 J3114_03 Rev02
1 Introduction WKC Environment Consultancy (WKC) have been contracted by Kurrent Technologies Ltd. (Kurrent) to conduct a hydrodynamic modelling and thermal plume assessment for the Lamu Coal Fired Power Plant, Kenya, in order to aid in selection of an outfall design and to inform the project Environmental Impact Assessment (EIA).
1.1 Project Location The proposed Lamu Coal Power Plant will be located on the north side of the New Lamu Port area, Manda Bay situated in Lamu County, northern Kenya (Figure 1-1 and Figure 1-2).

Hydrodynamic Modelling Report 2 J3114_03 Rev02
Figure 1-1 - Project Location

Hydrodynamic Modelling Report 3 J3114_03 Rev02
Figure 1-2 - General Plant Overlay
Kurrent Technologies Ltd. 1050MW Coal Fired Power Plant
Hydrodynamic Modelling Report 4 J3114_03 Rev02
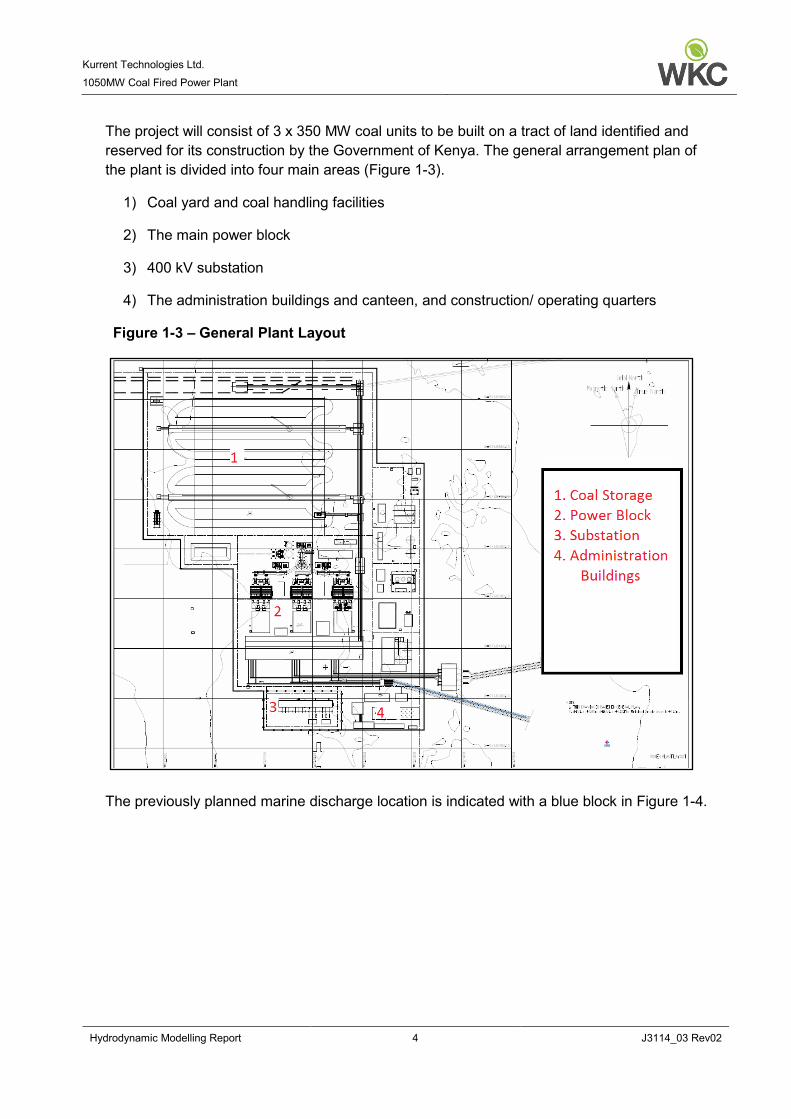
The project will consist of 3 x 350 MW coal units to be built on a tract of land identified and reserved for its construction by the Government of Kenya. The general arrangement plan of the plant is divided into four main areas (Figure 1-3).
1) Coal yard and coal handling facilities
2) The main power block
3) 400 kV substation
4) The administration buildings and canteen, and construction/ operating quarters
Figure 1-3 – General Plant Layout
The previously planned marine discharge location is indicated with a blue block in Figure 1-4.

Kurrent Technologies Ltd. 1050MW Coal Fired Power Plant
Hydrodynamic Modelling Report 5 J3114_03 Rev02
Figure 1-4 – Cooling Water Discharge Location
1.2 Study Objectives The objectives of the hydrodynamic modelling assessment were to model the ‘near-field’ mixing behaviour of multiple outfall designs and locations in order to inform a cost-benefit analysis for the selection of the outfall design.
In addition, the assessment will inform an assessment within the project specific EIA by simulating the ‘far-field’ mixing behaviour of the thermal plume within the ‘far-field’.
1.3 Assessment Method
1.3.1 Near-Field Design Screening
The initial modelling assessments [1] for the Project determined that the originally selected outfall design and location may not be optimal, resulting in exceedances in the International Finance Corporation (IFC) cooling water criteria [3] at distances that would be potentially unacceptable to regulators and financers.
An outfall design screening assessment was therefore carried out on multiple discharge designs and locations in order to inform the selection of an optimal design based on cost and

Kurrent Technologies Ltd. 1050MW Coal Fired Power Plant
Hydrodynamic Modelling Report 6 J3114_03 Rev02
environmental benefits. This screening assessment was carried out utilising the mixing zone model CORMIX to simulate the dilution behaviour of the cooling water effluent in the ‘near-field’.
The ‘near field’ can be defined as the zone where mixing behaviour is influenced by the momentum and buoyancy (influenced by discharge design and effluent characteristics) of the discharge as well as boundary interactions. CORMIX is particularly useful in determining plume behaviour in the near field based on discharge effluent parameters and is therefore considered suitable for a screening assessment of discharge designs.
1.3.2 Far-Field Plume Simulation
The far-field dispersion of the cooling water discharge has been simulated using three sophisticated atmospheric and ocean models:
• The Australian Bureau of Meteorology Global Atmospheric Prediction Model to obtain wind and atmospheric pressure fields over the Project area;
• The GEMMS 3D Coastal Ocean Model (GCOM3D) which predicts the variation horizontally and vertically of the currents in the Project area; and
• The GEMMS 3D Plume Dispersion Model (PLUME3D), which simulates the near-field and far-field dispersion of the discharge.
The major components of the methodology were:
• Setup an accurate bathymetric representation of the study region from digitised chart data, Google Earth images and local bathymetric data;
• Extract 12 months of hourly wind fields from the Australian Bureau of Meteorology Global Atmospheric Prediction Model;
• Establish a hydrodynamic model for the area of interest
• Predict 3D currents with GCOM3D within a summer and winter scenario;
• Investigate the dispersion of the cooling waters (with consideration of thermal change, differential salinity and chlorine content) discharged from the outfall using the GEMMS 3D Plume model (PLUME3D) driven by the currents predicted by GCOM3D.
1.4 Project Standards Kenyan environmental regulations [2] stipulate that effluent discharges into the marine environment must not exceed a temperature change greater than 3°C, however it is not clear whether this is at the point of discharge, an ambient criteria or within a defined mixing zone. As such the IFC General EHS Guidelines for Environmental Wastewater and Ambient Water Quality [3] and the IFC EHS Guidelines for Thermal Power Plants [4] have been adopted.
The IFC General EHS Guidelines state: “Temperature of wastewater prior to discharge does not result in an increase greater than 3°C of ambient temperature at the edge of a scientifically

Kurrent Technologies Ltd. 1050MW Coal Fired Power Plant
Hydrodynamic Modelling Report 7 J3114_03 Rev02
established mixing zone which takes into account ambient water quality, receiving water use and assimilative capacity among other considerations.”
The IFC EHS Guidelines for Thermal Power Plants state: “In general, thermal discharge should be designed to ensure that discharge water temperature does not result in exceeding relevant ambient water quality temperature standards outside a scientifically established mixing zone. The mixing zone is typically defined as the zone where initial dilution of a discharge takes place within which relevant water quality temperature standards are allowed to exceed and takes into account cumulative impact of seasonal variations, ambient water quality, receiving water use, potential receptors and assimilative capacity among other considerations.”
Kurrent Technologies Ltd. 1050MW Coal Fired Power Plant
Hydrodynamic Modelling Report 8 J3114_03 Rev02
2 Modelling Systems
2.1 3D Hydrodynamics (GEMMS 3D Coastal Ocean Model) The GEMMS 3D Coastal Ocean Model (GCOM3D), has a proven record for modelling ocean currents in many locations around the world. GCOM3D calculates water currents in both the horizontal and vertical planes. The model operates on a regular horizontal grid and uses a z-coordinate vertical-layering scheme (there is a varying number of layers, depending on the depth of water, and each layer has a constant thickness). This scheme avoids errors in current predictions at a particular depth caused by averaging of currents over varying depths, as used in sigma co-ordinate and “depth-averaged” model schemes.
2.2 Plume Dispersion
2.2.1 Mixing Processes
The mixing and dilution of effluent waters from a marine outfall can be considered in two distinct phases, near-field and far-field dilution.
• The initial, near-field dilution of the effluent is a function of several parameters including:
• The physical properties of the discharge;
• The momentum flux of the discharge velocity, which induces entrainment of the surrounding ambient fluid;
• The speed (and direction) of the receiving waters; and
• The design of the diffuser.
Far-field mixing and dilution rely on the ambient conditions of the receiving waters (tidal and wind driven currents, wave induced turbulence and thermodynamic gradients) to induce horizontal and vertical mixing.
Some plumes are positively buoyant and will rise to the surface (e.g. oil and cooling water) whilst denser (negatively buoyant) plumes (e.g. brine) will sink to the bottom of the water column. While both plumes will undergo similar near-field mixing processes of entrainment induced by momentum flux, buoyant plumes experience more mixing in the far-field than dense plumes, as buoyant plumes ultimately reside near the surface where the actions of turbulent mixing due to winds (and waves if in the ocean) are more pronounced.
In the far-field, dense plumes tend to move in the lower part of the water column where mixing occurs predominantly due to bed velocities, baroclinic flows and turbulent mixing down from the surface, which are typically less energetic, depending on the depth of the water, than the processes closer to the surface.
Simulation of these processes can be carried out in three ways:

Kurrent Technologies Ltd. 1050MW Coal Fired Power Plant
Hydrodynamic Modelling Report 9 J3114_03 Rev02
• The use of near field dilution algorithms which define the near-field dilution achieved by different discharge/diffuser configurations;
• The use of specific near-field CFD (computational fluid dynamics) sub-models such as the US EPA CORMIX and PLUMES models to define the behaviour of the reject flow in the first few metres from the outlet; or
• Undertake laboratory studies with scaled down models of diffusers to measure initial dilution under a range of receiving water conditions. A relationship can then be determined which can be used in far-field modelling to define the initial dilution.
This project utilised the second option, and utilised CORMIX is assess the near-field behaviour of the plume.
2.2.2 Cornell Mixing Zone Expert System (CORMIX)
The CORMIX model is an approved United States Environmental Protection Agency (US EPA) mixing zone model and primarily used for the assessment of regulatory mixing zones resulting from continuous point source discharges. Mixing behaviour can be assessed from a range of discharge designs within bounded channels (e.g. rivers, estuaries or industrial discharge channels) and unbounded channels (e.g. coastline or lakes). The mixing behaviour is modelled based on discharge characteristics and ambient conditions such as current speed, buoyancy of the effluent, stratification of the ambient fluid, effluent flow rate and port diameter/design. CORMIX is particularly effective at determining near field mixing characteristics based on outfall design and the ambient conditions at the point of discharge.
2.2.3 GEMMS 3D Plume Discharge Model (PLUME3D)
The more advanced 3D model was required in order accurately simulate the behaviour of the cooling water plume when influenced by ambient parameters, such as tides in the far-field.
PLUME3D is a lagrangian random walk far-field plume dispersion model which obtains oceanic conditions from GCOM3D and includes 3D plume dispersion algorithms for modelling the far-field behaviour of a wide variety of discharge materials including sediments, sewerage, thermal discharges, oils and chemicals, accounting for processes such as dispersion and dissolution, under defined release conditions (quantity, rate etc.).
PLUME3D uses predictions from GCOM3D to provide the ocean conditions into which the discharge is released. The lagrangian nature of the model allows the discharge plume to be simulated throughout the water column taking into account the effects of natural processes such as surface waves, horizontal diffusion and dispersion. The model is free from numerical diffusion problems (such as experienced by Eulerian models) because it is not run on a grid.
The plume model can be used stochastically if required, to simulate a large number of random events over time or can be used for specific case studies in a deterministic mode.
PLUME3D can model the behaviour of a variety of constituents within a single release volume given information on the density and other physical and chemical parameters. The model reports mass and concentration levels on the water surface, on shorelines, in the sediments or through the water column. Where multiple constituents are involved, the model can report

Kurrent Technologies Ltd. 1050MW Coal Fired Power Plant
Hydrodynamic Modelling Report 10 J3114_03 Rev02
the distribution of each constituent individually. Horizontal and vertical cross-sections are also available to better illustrate the three dimensional distributions.

Kurrent Technologies Ltd. 1050MW Coal Fired Power Plant
Hydrodynamic Modelling Report 11 J3114_03 Rev02
3 Marine Modelling Methodology
3.1 Overview Discharges from the proposed development have been modelled utilising the GEMMS modelling suite and CORMIX. The marine modelling is broken down into three components as follows:
• Hydrodynamic Modelling – to determine ocean currents and circulation behaviour
• Near-field Design Screening – to aid in the selection of the outfall design
• Thermal Plume Modelling – to determine the specific fate of the thermal plumes
The hydrodynamic model is used to generate ocean tide and 3D current data, a pre-requisite to the subsequent thermal plume modelling. The results of this hydrodynamic modelling have been used to ‘drive’ the thermal plume assessments.
The modelling assessment was broken down into the following components to enable a full and comprehensive assessment to be carried out:
• 3D Hydrodynamic Modelling (GCOM3D)
• Near-Field Plume Dispersion Assessment (CORMIX)
• Far-Field 3D Plume Dispersion Assessment (PLUME3D)
3.2 Hydrodynamic Modelling
3.2.1 Overview
The hydrodynamics of the project area were simulated utilising the GEMMS 3D Coastal Ocean Model (GCOM3D) utilising global tidal predictions, and meteorological data based on the bathymetry of the project area.
An overview of the hydrodynamic modelling approach is presented in Figure 3-1 and Table 3-1 for reference.

Kurrent Technologies Ltd. 1050MW Coal Fired Power Plant
Hydrodynamic Modelling Report 12 J3114_03 Rev02
Figure 3-1 – Modelling Flow Chart
Table 3-1 – Summary of Hydrodynamic Modelling Approach Task Hydrodynamic Modelling
Model GCOM3D
Model Features 3-dimensional Horizontal and vertical planes z-coordinate vertical layering scheme
Meteorological Data The Australian Bureau of Meteorology (ABM), sourced from the European Centre for Medium Range Weather Forecasting (ECMWF)
Model Verification Comparison with water heights and current velocities collected within a site survey carried out in 2003
Resolution Area wide grid (40 m)
3.2.2 About the GCOM3D Hydrodynamic Model
GCOM3D is an advanced, three-dimensional ocean circulation model. GCOM3D determines horizontal and vertical hydrodynamic circulation based on phenomenon such as wind stress, atmospheric pressure, astronomical tides, bottom friction and ocean thermal structure. the
Modelling Ocean Currents
GCOM3D
Establish Meteorological Conditions
ABM global forecast model
Compare model predictions with observations and
refine, if necessary
Plume Simulation
CORMIX / PLUME3D
Derive Tidal Forcing
GEMMS tidal database
Derive Model Grids from
GEMMS bathymetry database

Kurrent Technologies Ltd. 1050MW Coal Fired Power Plant
Hydrodynamic Modelling Report 13 J3114_03 Rev02
system has been validated extensively in many locations around the world and has consistently demonstrated a high level of accuracy.
GCOM3D calculates water currents in both the horizontal and vertical planes and operates on a regular horizontal grid. The model uses a unique z-coordinate vertical-layering scheme, which means that there are a varying number of layers, depending on the depth of water with each layer having a constant thickness. This scheme avoids errors in current predictions at any given depth, an issue that is commonly observed when averaging currents throughout the water column, as used in ‘sigma co-ordinate’ and ‘depth-averaged’ model schemes.
3.2.3 Ocean Model Setup
The 3D Hydrodynamic Model (GCOM3D) was set up with a model domain that extends far enough to the south to connect the river systems with the open ocean in order to correctly simulate the flux of ocean waters upstream on the flood tide and, conversely, the flushing on the ebb tide. With this grid setup the western boundary consisting entirely of land, the northern boundary included the upstream sections of the river systems and the southern and eastern boundaries connected the domain to the open ocean. The open boundary tidal forcing for the southern and eastern boundaries was established from Admiralty Tide Table data, particularly the tidal constituents for the nearby Lamu Port.
3.2.4 Model Grids and Bathymetry
Bathymetry within the project area was obtained from a number of sources in order to accurately portray the physical environment within the modelling domain. Coarse data sources were utilised to define bathymetry and topography (for the purposes of coastline delineation) first and then improved over a number of steps using higher resolution or more up to date data sources. The sources of data utilised, in the order that they were used, are summarised below:
• General Bathymetric Chart of the Oceans (GEBCO) 2014 [5];
• Bathymetric Survey conducted for LAPSSET [6],
• Bathymetric Survey Data (Collected from SEDC) during WKC visit to Nairobi;
• Manual manipulation of bathymetric grid to ensure consistency between data sources.
Interpolated survey data used to generate the bathymetric grid throughout the modelling domain is provided within Figure 3-2.

Kurrent Technologies Ltd. 1050MW Coal Fired Power Plant
Hydrodynamic Modelling Report 14 J3114_03 Rev02
Figure 3-2 – Interpolated Bathymetric Survey Data

Kurrent Technologies Ltd. 1050MW Coal Fired Power Plant
Hydrodynamic Modelling Report 15 J3114_03 Rev02
3.2.5 Winds
Winds were obtained from WKC’s data base of global reanalysed forecast data from the ABM. The ABM routinely operates a suite of Numerical Weather Prediction (NWP) models at a range of spatial and temporal resolutions.
Data from a routinely archived data set of these winds have been used to force the GCOM3D models. For the model grids, the ABM winds are available at a grid resolution of approximately 35km and at every three hours.
3.2.6 GCOM3D Simulations
GCOM3D was modelled for an entire year (2014) in order to ensure that all tidal and seasonal variation could be accounted for within the subsequent plume simulations.
Figure 3-3 and Figure 3-4 show the typical (modelled) circulation within the Lamu Estuary during the flood and ebb tides respectively with O1 representing the approximate location of the outfall (to be discussed later).
The estuary is split into two main channels by Pate Island (seen within the South-East corner of the figures). The western channel, on which the power plant will be constructed is generally deeper. The tidal flows within the estuary are complicated at flood tide by the interaction between the two flood currents interacting with each other to the North-West of Pate Island. However, the flood tide at the project area is dominated by the flood tide from the western channel. Upon tidal reversal, the ebb tide currents are routed down both the eastern and western estuary channel, with particularly strong current anticipated where the eastern channel narrows north of Pate Island.
The overall currents appear to be dominated by the tides rather than the predominant wind direction.

Kurrent Technologies Ltd. 1050MW Coal Fired Power Plant
Hydrodynamic Modelling Report 16 J3114_03 Rev02
Figure 3-3 - Surface currents (modelled) during the flood tide

Kurrent Technologies Ltd. 1050MW Coal Fired Power Plant
Hydrodynamic Modelling Report 17 J3114_03 Rev02
Figure 3-4 - Surface currents (modelled) during the ebb tide

Kurrent Technologies Ltd. 1050MW Coal Fired Power Plant
Hydrodynamic Modelling Report 18 J3114_03 Rev02
3.2.7 Verification of Tide and Current Predictions
No useable measured data was available for the site location; therefore, verification was only possible against the tide table predictions of tide levels at Lamu Port.
For the plume dispersion studies, GCOM3D simulated the sea levels and 3D currents throughout the entire modelling domain for the entire year of 2014. Verification of the accuracy of the sea level predictions is shown in Figure 3-5 which compares GCOM3D predictions of sea levels with data from the Tide Tables for Lamu Port for February 2014.
The results show excellent agreement and indicate that GCOM3D is representing the sea level variations and, by inference, the current flows in the region accurately.
Figure 3-5 - Comparison of GCOM3D Sea Lvel Predictions with Tide Table Data

Kurrent Technologies Ltd. 1050MW Coal Fired Power Plant
Hydrodynamic Modelling Report 19 J3114_03 Rev02
3.3 Near Field Screening Assessment The originally proposed outfall location (location A) and designs either a simple open channel discharge or a submerged single port pipe, was previously assessed to be insufficient to meet the IFC standards [4]. The results indicated that the submerged pipe discharge would be unlikely to meet IFC requirements in the near field and a differential temperature of 3°C may be experienced up to 1.2 km from the outfall position. The open channel discharge was expected to reach a differential temperature of 3°C at approximately 137 m.
Due to the sensitivity of the project area and the requirements to meet a differential of 3°C within a ‘scientifically established mixing zone’, a decision was made to attempt to select a more suitable outfall design and location in order to mitigate impacts to the marine environment from the heated effluent.
The screening assessment for location and design were carried out utilising CORMIX.
3.3.1 Location Screening
The original discharge location was deemed inappropriate due to the shallow depth and minimal currents anticipated. In general, an increased availability of water (i.e. increased depth) and increased ambient energy (i.e. increased current speeds), will increase the dilution of an effluent plume.
A number of locations were screened, including the original discharge location (location A) and additional locations at greater depths. Locations were selected based on the shortest straight line route from the origin of the effluent pipe to the desired depth. The locations screened are summarised within Figure 3-6. Please note that the expected cooling water intake locations is also included for reference purposes.

Kurrent Technologies Ltd. 1050MW Coal Fired Power Plant
Hydrodynamic Modelling Report 20 J3114_03 Rev02
Figure 3-6 - Intake and Outfall Location Options

Kurrent Technologies Ltd. 1050MW Coal Fired Power Plant
Hydrodynamic Modelling Report 21 J3114_03 Rev02
Water depths and current speeds at each of the locations were determined by interrogating the modelling results of the GCOM3D tidal simulations of the Lamu estuary. Simulations within the near field were assessed at water heights and current velocities at mean high tide (MHT) and mean low tide (MLT). Ambient parameters for each of the assessed locations are summarised within Table 3-2.
Table 3-2 - Ambient Parameters at Location Options
Location Ref. Latitude Longitude
Average Depth
(m)
Depth at MHT (m)
Depth at MLT (m)
Current Speed at
MHT (m/s)
Current Speed at
MLT (m/s)
A -2.105363 40.921075 3.5 4.56 2.44 0.12 0.07
B -2.102450 40.924537 7 8.06 5.93 0.11 0.07
C -2.101193 40.925731 10 11.06 8.93 0.09 0.07
D -2.103403 40.923148 4 5.06 2.94 0.12 0.07
E -2.104468 40.922537 5 6.06 3.94 0.12 0.07
3.3.2 Design Screening
A total of four outfall designs (a, b, d, and f) were assessed at locations A, B and C to determine mixing behaviour at variable distances within the plume centreline. The designs assessed were based were based on discussions with Amu Power and SEDC in Nairobi.
A fifth design (c) was to be assessed, namely the ‘Staged Perpendicular Diffuser’. However, it was not possible to assess this design within the near-field due to the instability of the plume, and therefore unreliable nature of dilution predictions. This instability is likely caused by the forced separation of the plume by the variable discharge direction, results can only be reliably predicted once the multiple plumes are re-joined downstream into a single plume.
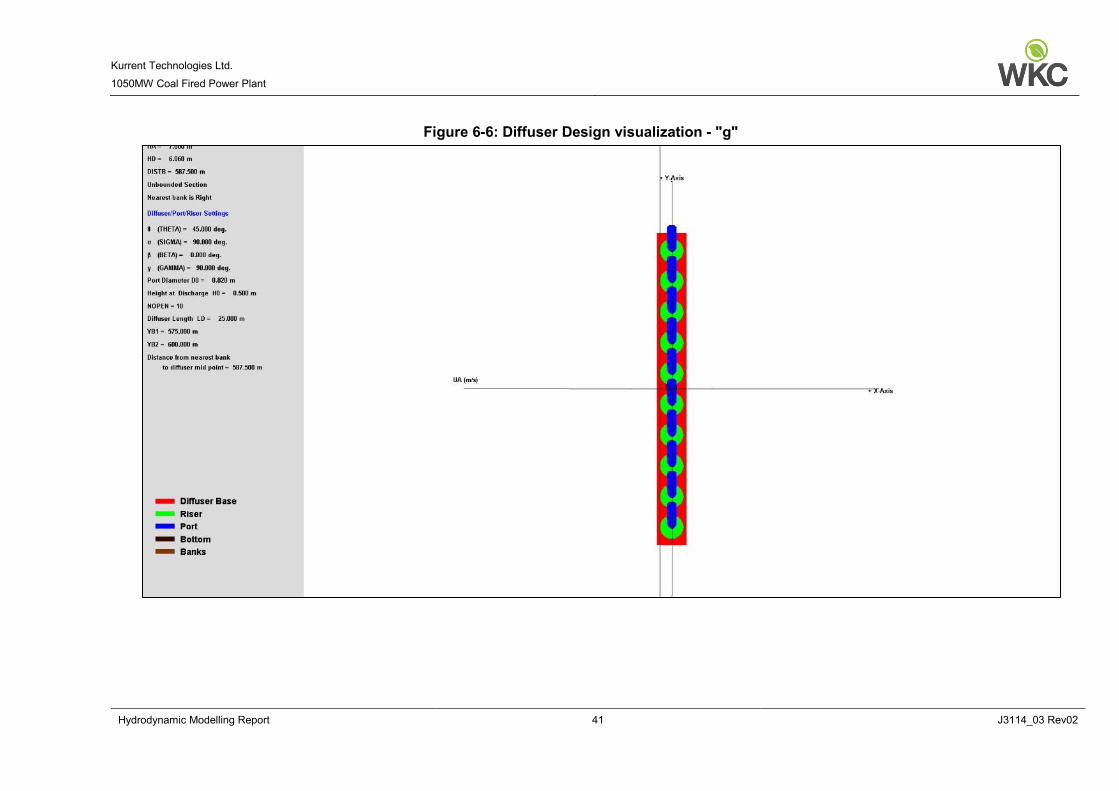
An additional two diffuser designs (f and g) were assessed at an additional two locations (D and E), based on the favourable results of the planned designs within the assessment, and in an attempt to introduce diffuser designs that may be more technically and financially feasible to the Client. The designs were variations to the ‘Uni-directional perpendicular diffuser’ design with reduced lengths and number of ports.
In addition, sensitivity analyses were conducted to determine the optimal discharge velocity by varying port diameter and horizontal discharge angle to maintain plume stability.
A summary of the designs assessed is provided within Table 3-3.

Kurrent Technologies Ltd. 1050MW Coal Fired Power Plant
Hydrodynamic Modelling Report 22 J3114_03 Rev02
Table 3-3 - Design Screening Options Parameters Ref. Description Port
Diameter (m)
Diffuser Length
(m)
Port Number
Horizontal Discharge Angle (°)
a Single Port 4.00 N/A 1 60
b Uni-Directional Perpendicular Diffuser 0.44 100 35 45
c Staged Perpendicular Diffuser 0.44 100 35 45
d Parallel T Diffuser Uni-Directional 0.44 100 35 60
e Parallel T Diffuser Fanned 0.44 100 35 60
f Uni-Directional Perpendicular Diffuser 0.58 50 20 45
g Uni-Directional Perpendicular Diffuser 0.82 25 10 45
Visual representations of the designs, as they are schematised within CORMIX are provided with Appendix A. Please note that the port diameter has been selected to optimise the effluent flow rate.
3.3.3 Input Parameters
Effluent Parameters
The effluent parameters are important to define the differential of the parameter of concern with the ambient concentration in order that an assessment against criteria or potential for change can be carried out. The effluent parameters also define the buoyancy of the effluent, which will determine the plume trajectory and determine how the plume will interact with the ambient environment (i.e. will the plume rise to the surface, sink or remain neutrally buoyant) all of which can significantly affect mixing behaviour.
Effluent parameter data has been provided by Kurrent Technologies Ltd. either in response to WKC’s initial data request or through email correspondence. A summary of the effluent parameters and the source of the data obtained is provided within Table 3-4.

Kurrent Technologies Ltd. 1050MW Coal Fired Power Plant
Hydrodynamic Modelling Report 23 J3114_03 Rev02
Table 3-4 - Cooling Water Effluent Parameters Parameters Units Input
Heat Loss Coefficient W/m2.°C 54
Flow Rate m3/s 35.3
Effluent salinity ppt Ambient
Δ Temperature °C 9
Ambient Parameters
Ambient parameters, such as depth, current velocity, current direction, tidal period etc. were obtained from the outputs of the GCOM3D hydrodynamic model and the bathymetric grid and are time dependent in nature. However, certain parameters were assumed to be static in each scenario.
For reference purposes, a summary of the ambient parameters are provided in Table 3-5.
Table 3-5 – Summary of Ambient Parameters Parameters Units Input
Avg. Wind Speed 1 m/s 3.4
Average Ambient Temp. °C Ambient
Ambient Density Kg/m3 1026.5
Note 1: Wind speed is interpolated onto the modelling grid from the metrological model, however the heat loss coefficient is calculated from average wind speed.
Each of the design and each of the locations was simulated at MHT and MLT. Please note that the remainder of ambient parameters that vary depending on discharge location and tidal conditions, are summarised within Table 3-2.
3.4 Far-Field Plume Simulations
3.4.1 Overview
The far field simulations of the preferred design options were assessed using PLUME3D. PLUME3D is able to interrogate the output data from the near-field assessments in order to accurately represent the the dimensions and dilution of the plume at the point where momentum no longer significantly influences the plume trajectory and behaviour. After this point, PLUME3D is able to accurately simulate the trajectory and dilution of the plume both temporally and spatially, taking into account the constant variation in the ambient environment. PLUME3D is continually ‘driven’ by the results of GCOM3D (i.e. not just a single point in time as with CORMIX) and is able to take into account differences in plume behaviour with variable current direction and speed. PLUME3D was used to simulate the plume for an entire year, in order that a statistical analysis of exceedance can be carried out.

Kurrent Technologies Ltd. 1050MW Coal Fired Power Plant
Hydrodynamic Modelling Report 24 J3114_03 Rev02
3.4.2 About the PLUME3D Model
PLUME3D is a lagrangian random walk far-field plume dispersion model which obtains oceanic conditions from GCOM3D and includes 3D plume dispersion algorithms for modelling the far-field behaviour of a wide variety of discharge materials and types.
An overview of the inputs to the thermal plume modelling are presented in Table 3-6.
Table 3-6 – Cooling Water Discharge Simulation Stage Far-field Thermal Plumes Modelling
Model PLUME3D
Task Pre-requisite GCOM3D Hydrodynamic Modelling
Model Features Lagrangian random walk far-field plume dispersion model
Scenarios Two design scenario were simulated for comparison, including; - Selected design option (Unidirectional Diffuser (f) at location
E. - Submerged Single Port Pipe (a) at location E
No. of Sources 1
Parameters modelled Temperature
3.5 Assumptions and Limitations The modelling assessment has been carried out utilising the most accurate data available at this time, however a number of assumptions/calculations were used to fill data gaps. Where selected methodologies or data gaps limit the assessment these are summarised below:
• Current measurements on site (e.g. ADCP data) have only been collected for a limited time period, therefore verification was conducted against publicly available information on water heights at Lamu Port.
• CORMIX was unable to accurately simulate one of the selected design options (i.e. design ‘c’) therefore this design was removed from the assessment.
• CORMIX was unable to accurately simulate design ‘a’ in shallow environments due to the large effluent volume.

Kurrent Technologies Ltd. 1050MW Coal Fired Power Plant
Hydrodynamic Modelling Report 25 J3114_03 Rev02
4 Results
4.1 Near-Field Design Screening The near-field simulations conducted utilising CORMIX were carried out at a total of 38 individual scenarios, taking into account variable outfall designs, locations and tidal conditions. The assessment aimed to carry out a comparison of differential temperature at variable distances in order to aid in the selection of a more suitable design.
The full results are summarised within Table 4-1. In addition, a full summary of the ‘text file’ outputs of all summaries can be found within Appendix B.

Kurrent Technologies Ltd. 1050MW Coal Fired Power Plant
Hydrodynamic Modelling Report 26 J3114_03 Rev02
Table 4-1 - Near-Field Design Screening Results Summary
1 2 5 10 20 50 100Aa Single Port (a) 4 1 60 MHT 4.56 360 0.12 - - - - - - 4.76 No No near field unstable, unable to accurately predict dilutionAa Single Port (a) 4 1 60 MLT 2.44 360 0.07 - - - - - - - ? ? near field unstable, unable to accurately predict dilutionBa Single Port (a) 2.6 1 45 MHT 8.06 770 0.12 9.00 9.00 9.00 8.20 5.63 2.87 1.41 Yes NoBa Single Port (a) 2.6 1 45 MLT 7.8 770 0.07 9.00 9.00 9.00 8.21 5.64 2.90 1.44 Yes No Depth increased to be at least 3x port diameterCa Single Port (a) 2.6 1 45 MHT 11.06 930 0.12 9.00 9.00 9.00 6.66 3.40 2.04 1.49 Yes NoCa Single Port (a) 2.6 1 45 MLT 8.93 930 0.07 9.00 9.00 9.00 8.22 5.64 2.90 1.37 Yes NoBb Uni-Directional Perpendicular Diffuser (b) 0.44 35 45 MHT 8.06 770 0.11 1.76 1.75 1.71 1.65 1.55 1.46 1.24 Yes YesBb Uni-Directional Perpendicular Diffuser (b) 0.44 35 45 MLT 5.93 770 0.07 1.81 1.80 1.76 1.71 1.71 1.71 1.44 Yes YesCb Uni-Directional Perpendicular Diffuser (b) 0.44 35 45 MHT 11.06 930 0.09 1.66 1.64 1.61 1.55 1.45 1.25 1.06 Yes YesCb Uni-Directional Perpendicular Diffuser (b) 0.44 35 45 MLT 8.93 930 0.07 1.75 1.74 1.70 1.64 1.54 1.39 1.17 Yes YesDb Uni-Directional Perpendicular Diffuser (b) 0.44 35 45 MHT 5.06 590 0.12 1.85 1.85 1.85 1.85 1.85 1.85 1.56 Yes YesDb Uni-Directional Perpendicular Diffuser (b) 0.44 35 45 MLT 2.94 590 0.07 2.42 2.42 2.42 2.42 2.42 2.42 2.03 Yes YesEb Uni-Directional Perpendicular Diffuser (b) 0.44 35 45 MHT 6.06 600 0.12 1.81 1.79 1.75 1.69 1.69 1.69 1.42 Yes YesEb Uni-Directional Perpendicular Diffuser (b) 0.44 35 45 MLT 3.94 600 0.07 2.09 2.09 2.09 2.09 2.09 2.09 1.77 Yes YesBc Staged Perpendicular Diffuser (c) 0.44 35 45 MHT 8.06 770 0.11 - - - - - - - ? ? near field unstable, unable to accurately predict dilutionBc Staged Perpendicular Diffuser (c) 0.44 35 45 MLT 5.93 770 0.07 - - - - - - - ? ? near field unstable, unable to accurately predict dilutionCc Staged Perpendicular Diffuser (c) 0.44 35 45 MHT 11.06 930 0.09 - - - - - - - ? ? near field unstable, unable to accurately predict dilutionCc Staged Perpendicular Diffuser (c) 0.44 35 45 MLT 8.93 930 0.07 - - - - - - - ? ? near field unstable, unable to accurately predict dilutionBd Parallel T Diffuser Uni-Directional (d) 0.44 35 60 MHT 8.06 770 0.11 5.50 4.73 3.71 2.98 2.34 1.63 1.50 Yes YesBd Parallel T Diffuser Uni-Directional (d) 0.44 35 60 MLT 5.93 770 0.07 5.69 4.93 3.91 3.17 2.50 1.76 1.60 Yes YesCd Parallel T Diffuser Uni-Directional (d) 0.44 35 60 MHT 11.06 930 0.09 5.02 4.24 3.25 2.57 1.98 1.36 1.25 Yes YesCd Parallel T Diffuser Uni-Directional (d) 0.44 35 60 MLT 8.93 930 0.07 5.19 4.41 3.41 2.71 2.10 1.45 1.33 Yes YesBe Parallel T Diffuser Fanned (e) 0.44 35 60 MHT 8.06 770 0.11 5.20 4.43 3.42 2.72 2.11 1.46 1.13 Yes YesBe Parallel T Diffuser Fanned (e) 0.44 35 60 MLT 5.93 770 0.07 5.44 4.67 3.65 2.93 2.29 1.60 1.45 Yes YesCe Parallel T Diffuser Fanned (e) 0.44 35 60 MHT 11.06 930 0.09 4.77 3.99 3.02 2.37 1.81 1.24 0.95 Yes YesCe Parallel T Diffuser Fanned (e) 0.44 35 60 MLT 8.93 930 0.07 4.94 4.16 3.17 2.50 1.92 1.32 1.21 Yes YesBf Uni-Directional Perpendicular Diffuser (f) 0.58 20 45 MHT 8.06 770 0.12 2.63 2.59 2.49 2.36 2.15 1.74 1.39 Yes YesBf Uni-Directional Perpendicular Diffuser (f) 0.58 20 45 MLT 5.93 770 0.07 3.02 2.98 2.88 2.73 2.50 2.03 1.61 Yes YesCf Uni-Directional Perpendicular Diffuser (f) 0.58 20 45 MHT 11.06 930 0.09 2.27 2.24 2.15 2.03 1.84 1.48 1.19 Yes YesCf Uni-Directional Perpendicular Diffuser (f) 0.58 20 45 MLT 8.93 930 0.07 2.50 2.47 2.38 2.25 2.04 1.65 1.32 Yes YesDf Uni-Directional Perpendicular Diffuser (f) 0.58 20 45 MHT 5.06 590 0.11 3.24 3.21 3.10 2.94 2.70 2.19 1.74 Yes YesDf Uni-Directional Perpendicular Diffuser (f) 0.58 20 45 MLT 2.94 590 0.07 3.54 3.50 3.41 3.41 3.41 2.86 2.29 Yes YesEf Uni-Directional Perpendicular Diffuser (f) 0.58 20 45 MHT 6.06 600 0.11 2.99 2.95 2.85 2.70 2.47 2.01 1.59 Yes YesEf Uni-Directional Perpendicular Diffuser (f) 0.58 20 45 MLT 3.94 600 0.07 3.37 3.33 3.22 3.07 2.95 2.48 1.97 Yes YesEf 2 Uni-Directional Perpendicular Diffuser (f) 2 0.58 20 45 MHT 6.06 600 0.11 2.99 2.95 2.85 2.70 2.47 2.01 1.60 Yes Yes increased port height above seabed from 0.5 to 1.0 m.Ef 2 Uni-Directional Perpendicular Diffuser (f) 2 0.58 20 45 MLT 3.94 600 0.07 3.37 3.33 3.22 3.07 2.95 2.48 1.97 Yes Yes increased port height above seabed from 0.5 to 1.0 m.Dg Uni-Directional Perpendicular Diffuser (g) 0.82 10 45 MHT 5.06 590 0.11 4.36 4.28 4.07 3.79 3.29 2.44 1.87 Yes YesDg Uni-Directional Perpendicular Diffuser (g) 0.82 10 45 MLT 2.94 590 0.07 5.50 5.42 5.22 4.94 4.38 3.19 2.45 Yes YesEg Uni-Directional Perpendicular Diffuser (g) 0.82 10 45 MHT 6.06 600 0.11 4.03 3.95 3.74 3.47 2.99 2.26 1.72 Yes YesEg Uni-Directional Perpendicular Diffuser (g) 0.82 10 45 MLT 3.94 600 0.07 4.86 4.78 4.57 4.29 3.72 2.79 2.11 Yes Yes
Tidal Conditions
Depth at Discharge
(m)
Temperature (Δ°C) at Distance (m)
Port NumberScenario
Ref. Discharge TypeDiameter
(m)
Discharge Angle
(°) Note
Distance from Shore
(m)
Current Velocity
(m/s)Δ3°C within
100 m?Δ3°C within near-field?

Kurrent Technologies Ltd. 1050MW Coal Fired Power Plant
Hydrodynamic Modelling Report 27 J3114_03 Rev02
The near-field screening assessment concluded that the original design and location are unfavourable due to shallow depth and relatively dominant effluent flow rate. This scenario does not meet the project requirements of Δ3°C within 100 m of the discharge. It was advised that this location be discounted. In addition, the following conclusions were made:
• Single port discharges do not meet the project requirements of Δ3°C within the near-field mixing zone (or area of initial dilution).
• All diffuser designs at all locations meet the project requirement of Δ3°C within the near-field mixing zone (or area of initial dilution).
• In general, the greater the depth of the discharge and the larger the diffuser, the less potential impact on the marine environment due to increased near-field mixing.
Amu Power and SEDC utilised the results of the near-field assessment to weigh the potential environmental benefits against the potential costs, and technical difficulty of designing and constructing the outfall designs at each of the locations. The results of the cost-benefit analysis concluded that scenario ‘Ef’, a uni-directional perpendicular diffuser at an average depth of 5m, was the most favourable.
The approximate design of this outfall (at MHT) is presented within Figure 4-1, where;
HA – Average Depth (schematised to fit CORMIX i.e. depth at discharge + 30%)
HD – Depth at discharge
DISTB – Distance to bank (from diffuser centre point)
THETA – Vertical Angle of ports
SIGMA – Horizontal angle of ports (90 = perpendicular to ambient flow)
BETA – Relative orientation of ports (0 = all ports orientated along diffuser line)
GAMMA – Diffuser alignment (90 = perpendicular to flow)
D0 – Port diameter (of single port)
H0 – Height of port from seabed
NOPEN – No of diffuser ports
LD – Diffuser length
YB1 – distance from shore to nearest diffuser point
YB2 – distance from shore to furthest diffuser point

Kurrent Technologies Ltd. 1050MW Coal Fired Power Plant
Hydrodynamic Modelling Report 28 J3114_03 Rev02
Figure 4-1 - Selected Outfall Design - Uni-Directional Diffuser (Ef) (MHT)

Kurrent Technologies Ltd. 1050MW Coal Fired Power Plant
Hydrodynamic Modelling Report 29 J3114_03 Rev02
Scenario ‘Ef’ was therefore carried forward into the far field simulations.
4.2 Far-Field Simulations The effluent discharged from the Lamu Coal Power Plant cooling water outfall has been simulated for the scenario Ef, and an additional scenario simulating the same location using a submerged single port pipe for comparison (i.e. design and location Ref. Ea). The modelling results were analysed to display the spatial extent of the 95th percentile differential temperature (below which 95% of simulations can be found). The 95th percentile was deemed appropriate to allow for minor exceedance of the IFC requirements during infrequent unfavourable conditions.
4.2.1 Temperature
The thermal plume from the discharged cooling water has been simulated for the selected outfall design and location, with an additional simulation of the simplest discharge arrangement being carried out for comparison.
The simulations were conducted for a full year, and therefore take into account all potential variation in the ambient environment due to extreme seasonal or tidal variation. The results show the regions within which the plume has cooled to 3, 2, 1, 0.5 and 0.2 °C above ambient temperatures for 95% of the time. Please note that the IFC requirements specify that a differential temperature of 3°C should be achieved within a justifiable mixing zone. Due to the sensitivity of the project area, this ‘justifiable’ mixing zone should be as small as possible, and preferably would occur within the ‘near-field’ mixing zone.
Figure 4-1 presents the predicted spatial extent of the 3, 2, 1, 0.5 and 0.2 °C mixing zones for the selected outfall design and location discussed within Section 4.1 (i.e. location option ‘E’ and design option ‘f’).
The thermal plume released from location E, at an average depth of 5 m, generally move with the ambient tidal current once the initial momentum of the discharge (i.e. from the discharge velocity) dissipates. The general movement of the plume will be either north or south along the coastline, dependent on whether the tide is in flood or ebb at that point in time. During tidal reversal (i.e. at slack tide) there is a small rotary motion, however the rotary motion is limited by the presence of land on either side of the estuary.
Although the plume generally moves either north or south with the tidal current, due to the greater current velocities at flood and ebb tide, the effluent experiences greater dilution as the effluent is dispersed further and experiences greater initial mixing due to a greater differential in velocity between the plume and the ambient environment.
The region of greater differential temperature is anticipated to increase upon tidal reversal due to lower current speeds, and the re-entrainment of the thermal plume effectively reducing the differential temperature of the plume and the ambient environment, minimising the effectiveness of dilution. Due to the minor rotary movement of the currents during tidal reversal, these regions of greater temperature differential are expected to the south-west and north-east of the outfall location.

Kurrent Technologies Ltd. 1050MW Coal Fired Power Plant
Hydrodynamic Modelling Report 30 J3114_03 Rev02
The selected discharge design, a uni-directional perpendicular diffuser, is anticipated to meet IFC requirements within the near-field mixing zone, and therefore a significant increase in temperature of greater than 3°C is not anticipated to extend beyond the effluent jet issuing from the diffuser openings. Therefore, the selected outfall design and location are anticipated to comply with the strictest definition of IFC requirements.
For comparison, a simulation was carried out utilising the originally selected design (a submerged open pipe i.e. design option ‘a’) at the same location ‘E’, the results of which are presented within Figure 4-3 The simulations anticipated that a significant region would experience differential temperatures of greater than 3°C for more than 95% of the time, and would therefore be unlikely to satisfy IFC requirements.
A comparison of the areas of exceedance for the selected design option and location (location option ‘E’ design option ‘f’) and the original design selected (design option ‘a) at the same location, for each of the differential temperature assessment criteria are provided within Table 4-2. The predicted areas of differential temperature exceedance have been calculated based on the contours displayed within Figure 4-2 and Figure 4-3. The results show that a significant reduction in impact area is predicted through the implementation of the selected design.
Table 4-2 - Far Field Impact Area Summary
Area of Impact (m2) Percent Reduction
Design Option Open Pipe (a) Uni-dir. Diff. (f)
Diff
eren
tial T
emp.
(°C
) 0.2 1,763,055 1,483,333 16%
0.5 985,039 729,484 26%
1.0 753,634 515,974 32%
2.0 603,862 219,798 64%
3.0 474,243 0 100%

Kurrent Technologies Ltd. 1050MW Coal Fired Power Plant
Hydrodynamic Modelling Report 31 J3114_03 Rev02
Figure 4-2 - Maximum Differential Temperature (95th Percentile) Scenario Ef: Uni-directional Perpendicular Diffuser at Location E

Kurrent Technologies Ltd. 1050MW Coal Fired Power Plant
Hydrodynamic Modelling Report 32 J3114_03 Rev02
Figure 4-3 - Maximum Differential Temperature (95th Percentile) Scenario Ea: Single Port Pipe at Location E

Kurrent Technologies Ltd. 1050MW Coal Fired Power Plant
Hydrodynamic Modelling Report 33 J3114_03 Rev02
5 Summary & Conclusions WKC Environment Consultancy (WKC) have been contracted by Kurrent Technologies Ltd. (Kurrent) to conduct a hydrodynamic modelling and thermal plume assessment for the Lamu Coal Fired Power Plant, Kenya, in order to aid in selection of an outfall design and to inform the project Environmental Impact Assessment (EIA).
The objectives of the hydrodynamic modelling assessment were to model the ‘near-field’ mixing behaviour of multiple outfall designs and locations in order to inform a cost-benefit analysis for the selection of the outfall design. In addition, this hydrodynamic modelling study will inform an assessment within the project specific EIA by simulating the ‘far-field’ mixing behaviour of the thermal plume within the ‘far-field’.
Kenyan environmental regulations stipulate that effluent discharges into the marine environment must not exceed a temperature change greater than 3°C, however it is not clear whether this is at the point of discharge, an ambient criteria or within a defined mixing zone. As such the IFC General EHS Guidelines for Environmental Wastewater and Ambient Water Quality [3] and the IFC EHS Guidelines for Thermal Power Plants [4] have been adopted.
Discharges from the proposed development were modelled utilising the GEMMS modelling suite and CORMIX. Hydrodynamic modelling using GCOM3D was to generate ocean tide and 3D current data, a pre-requisite to the subsequent thermal plume modelling. The results of this hydrodynamic modelling were used to ‘drive’ the thermal plume assessments. The plume modelling assessment was broken down into near-field design screening using CORMIX, and far-field simulations of the selected design using PLUME3D.
The near-field simulations conducted utilising CORMIX were carried out at a total of 38 individual scenarios, taking into account variable outfall designs, locations and tidal conditions. Amu Power and SEDC utilised the results of the near-field assessment to weigh the potential environmental benefits against the potential costs, and technical difficulty of designing and constructing the outfall designs at each of the locations. The results of the cost-benefit analysis concluded that scenario ‘Ef’, a uni-directional perpendicular diffuser at an average depth of 5m, was the most favourable.
The far-field modelling confirmed that the selected discharge design, a uni-directional perpendicular diffuser, is anticipated to meet IFC requirements within the near-field mixing zone, and therefore a significant increase in temperature of greater than 3°C is not anticipated to extend beyond the effluent jet issuing from the diffuser openings (i.e. the far field mixing zone). Therefore, the selected outfall design and location are anticipated to comply with the strictest definition of IFC requirements.

Kurrent Technologies Ltd. 1050MW Coal Fired Power Plant
Hydrodynamic Modelling Report 34 J3114_03 Rev02
6 References [1] WKC, Lamu Coal Power Plant Project, Thermal Discharge Screening, J3092 Rev 02, July
2015
[2] Kenya Legal Notice No. 120, The Environmental Management and Coordination (Water Quality) Regulations, 2006
[3] IFC General EHS Guidelines for Environmental Wastewater and Ambient Water Quality, 2007
[4] IFC EHS Guidelines for Thermal Power Plants, 2008
[5] General Bathymetric Chart of the Oceans, GEBCO 2014 grid – 30 arc-second interval
[6] Study for LAPSSET Corridor FS & Lamu Port MP & DD

Kurrent Technologies Ltd. 1050MW Coal Fired Power Plant
Hydrodynamic Modelling Report 35 J3114_03 Rev02
Appendix A – Design Option Visualisations

Kurrent Technologies Ltd. 1050MW Coal Fired Power Plant
Hydrodynamic Modelling Report 36 J3114_03 Rev02
Figure 6-1: Diffuser Design visualization - "b"

Kurrent Technologies Ltd. 1050MW Coal Fired Power Plant
Hydrodynamic Modelling Report 37 J3114_03 Rev02
Figure 6-2: Diffuser Design visualization - "c"

Kurrent Technologies Ltd. 1050MW Coal Fired Power Plant
Hydrodynamic Modelling Report 38 J3114_03 Rev02
Figure 6-3: Diffuser Design visualization - "d"

Kurrent Technologies Ltd. 1050MW Coal Fired Power Plant
Hydrodynamic Modelling Report 39 J3114_03 Rev02
Figure 6-4: Diffuser Design visualization - "e"

Kurrent Technologies Ltd. 1050MW Coal Fired Power Plant
Hydrodynamic Modelling Report 40 J3114_03 Rev02
Figure 6-5: Diffuser Design visualization - "f"
Kurrent Technologies Ltd. 1050MW Coal Fired Power Plant
Hydrodynamic Modelling Report 41 J3114_03 Rev02
Figure 6-6: Diffuser Design visualization - "g"