kroger shadow anchored strip center -...
TRANSCRIPT
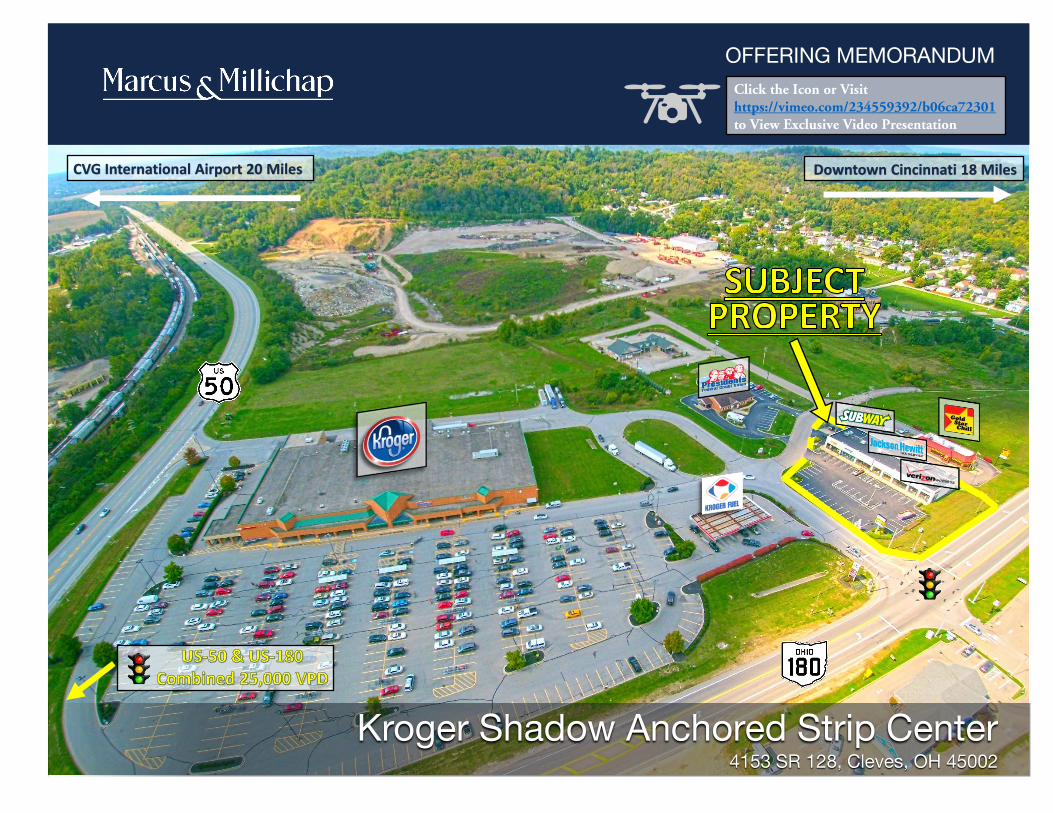
Kroger Shadow Anchored Strip Center4153 SR 128, Cleves, OH 45002
OFFERING MEMORANDUM
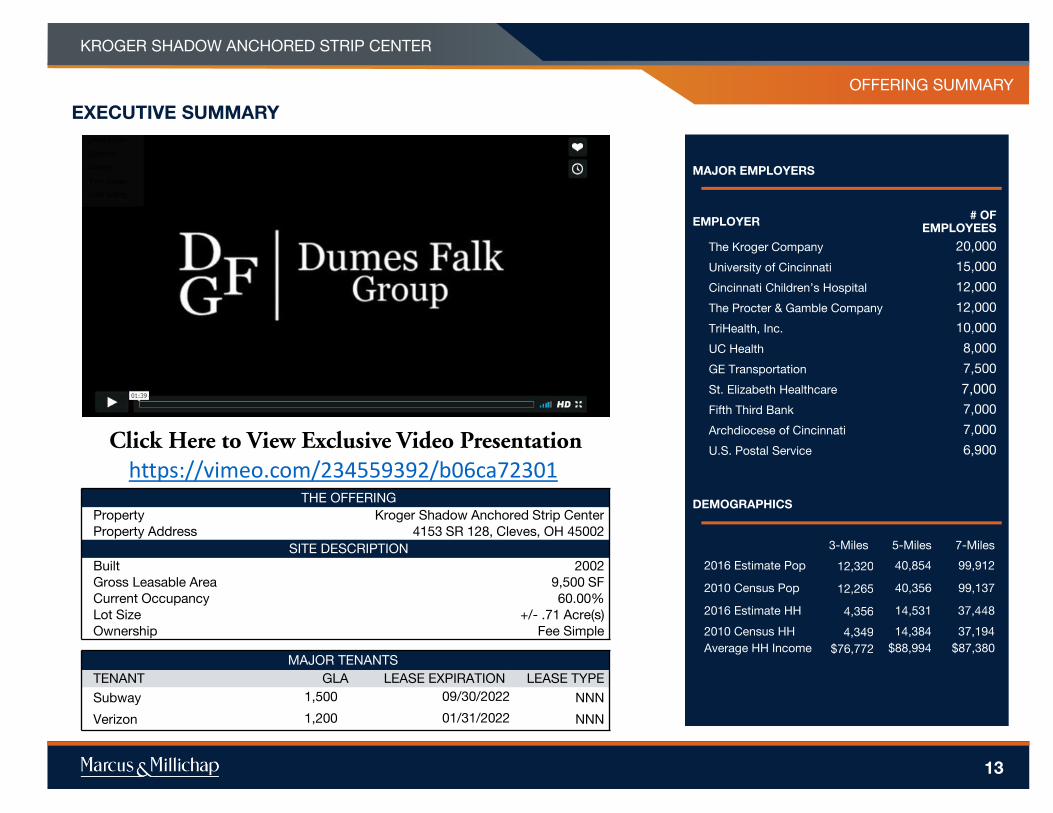
Click the Icon or Visithttps://vimeo.com/234559392/b06ca72301to View Exclusive Video Presentation
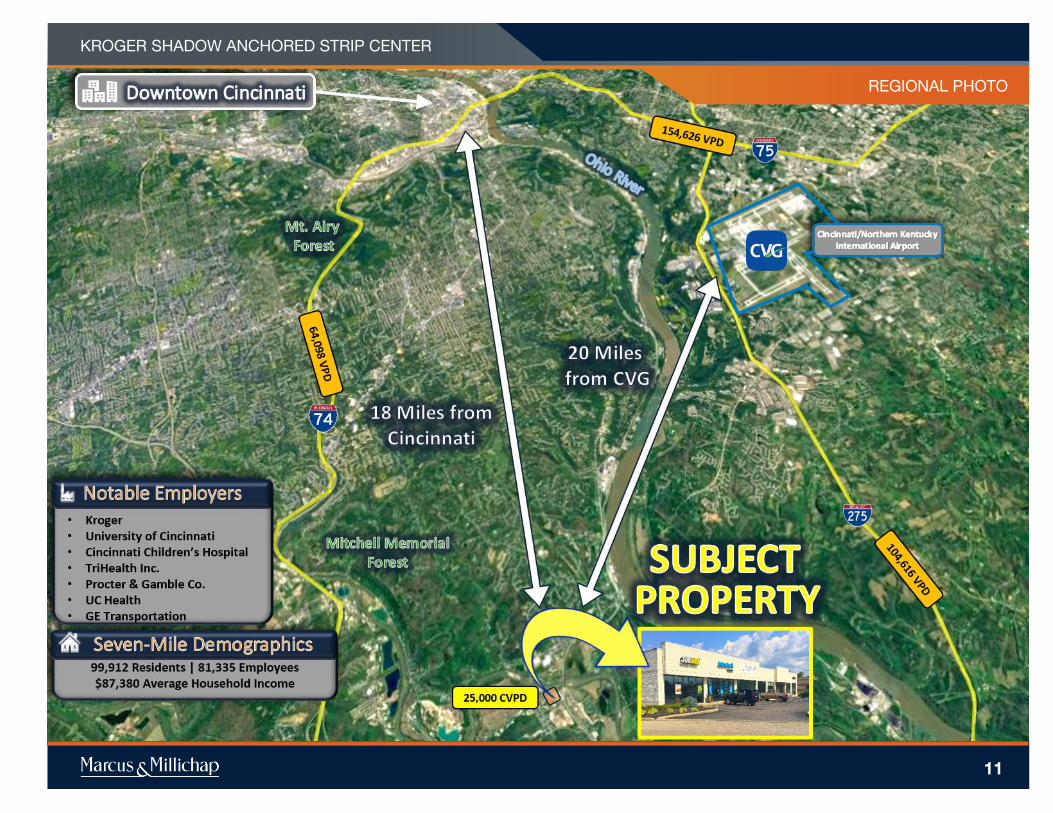
Downtown Cincinnati 18 MilesCVG International Airport 20 Miles
CLEVES KROGER ANCHORED
SHOPPING CENTER
Cleves, OH
ACT ID Y0360226
N O N - E N D O R S E M E N T A N D D I S C L A I M E R N O T I C E
Non-EndorsementsMarcus & Millichap is not affiliated with, sponsored by, or endorsed by any commercial tenant or lessee identified in
this marketing package. The presence of any corporation's logo or name is not intended to indicate or imply affiliation
with, or sponsorship or endorsement by, said corporation of Marcus & Millichap, its affiliates or subsidiaries, or any
agent, product, service, or commercial listing of Marcus & Millichap, and is solely included for the purpose of
providing tenant lessee information about this listing to prospective customers.
ALL PROPERTY SHOWINGS ARE BY APPOINTMENT ONLY.
PLEASE CONSULT YOUR MARCUS & MILLICHAP AGENT FOR MORE DETAILS.
DisclaimerTHIS IS A BROKER PRICE OPINION OR COMPARATIVE MARKET ANALYSIS OF VALUE AND SHOULD NOT BE
CONSIDERED AN APPRAISAL. This information has been secured from sources we believe to be reliable, but we
make no representations or warranties, express or implied, as to the accuracy of the information. References to
square footage or age are approximate. Buyer must verify the information and bears all risk for any inaccuracies.
Marcus & Millichap is a service mark of Marcus & Millichap Real Estate Investment Services, Inc. © 2017 Marcus &
Millichap. All rights reserved.
2
P R E S E N T E D B Y
Joel Dumes
Senior Vice President Investments
Senior Director - National Retail Group
Cincinnati Office
Tel: (513) 878-7720
Fax: (513) 878-7710
Licenses: OH SAL.2003013045, KY
63818
Stan Falk
First Vice President Investments
Director - National Retail Group
Cincinnati Office
Tel: (513) 878-7721
Fax: (513) 878-7710
License: OH SAL.2012001364
TABLE OF CONTENTS
INVESTMENT OVERVIEWSection 1
•
FINANCIAL ANALYSISSection 2
•
MARKET OVERVIEWSection 3
•
KROGER SHADOW ANCHORED STRIP CENTER
5
INVESTMENT
OVERVIEW
KROGER SHADOW ANCHORED STRIP CENTER

#
OFFERING SUMMARY
▪ Kroger Shadow Anchored Strip Center | Cincinnati, OH MSA
▪ 78 Percent of Income from National and Regional Tenants
▪ 3,800-Square Feet or 40 Percent of Realizable Vacancy Upside
▪ Positioned at Signalized Intersection | 25,000 Combined Vehicles Per Day
▪ Over 23 Percent Population Growth with Average Incomes of $89,000 in Five-Miles
▪ 18-Miles from Downtown Cincinnati | 20-Miles from the Cincinnati Airport (CVG)
INVESTMENT HIGHLIGHTS
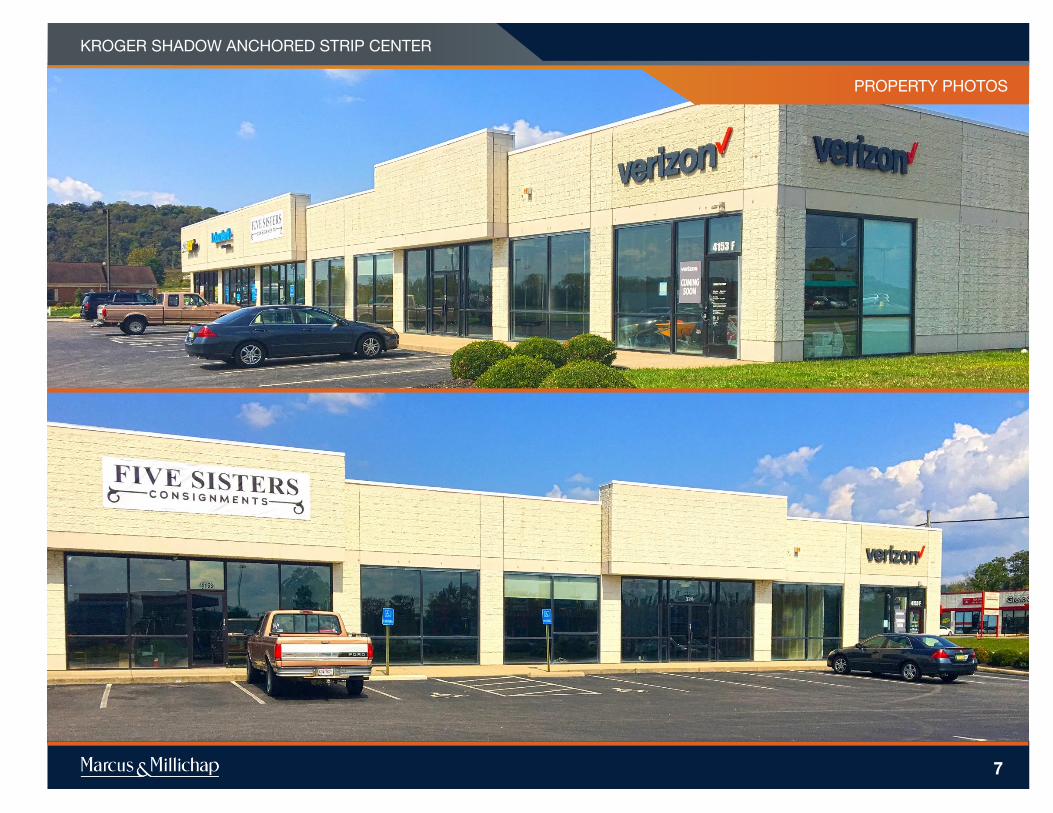
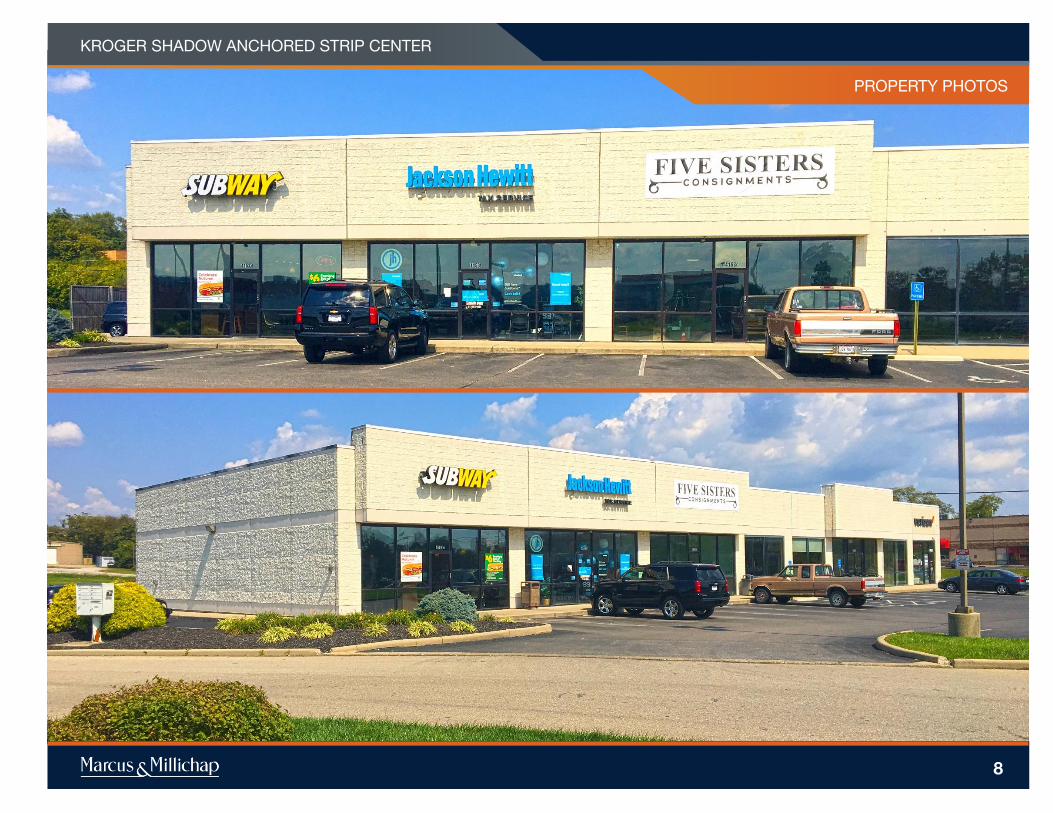
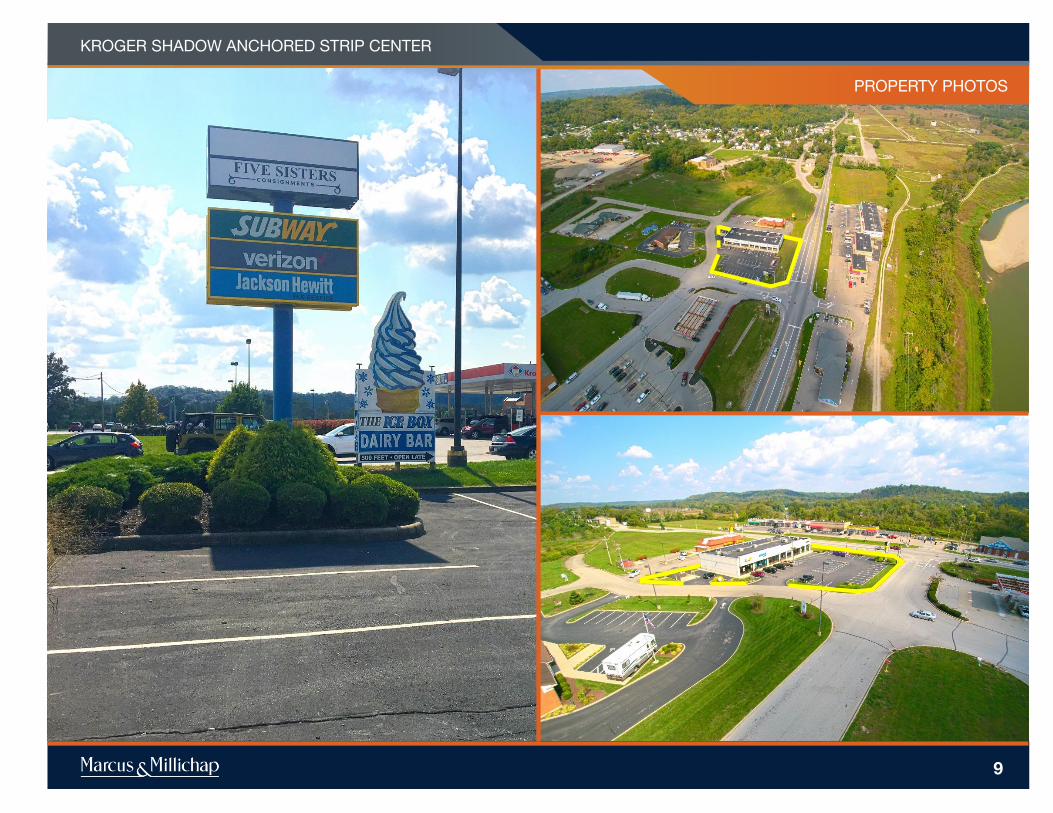
The Dumes Falk Group of Marcus & Millichap is please to bring to market a Kroger shadow anchored strip center comprised of 9,500-square feet
on approximately .71 acres in Cleves, OH – located 18-miles from downtown Cincinnati. The subject property is situated at a signalized
intersection with great signage, visibility and independent turn lanes into the center along OH-128, that combined with US-50, sees nearly 25,000
vehicles per day.
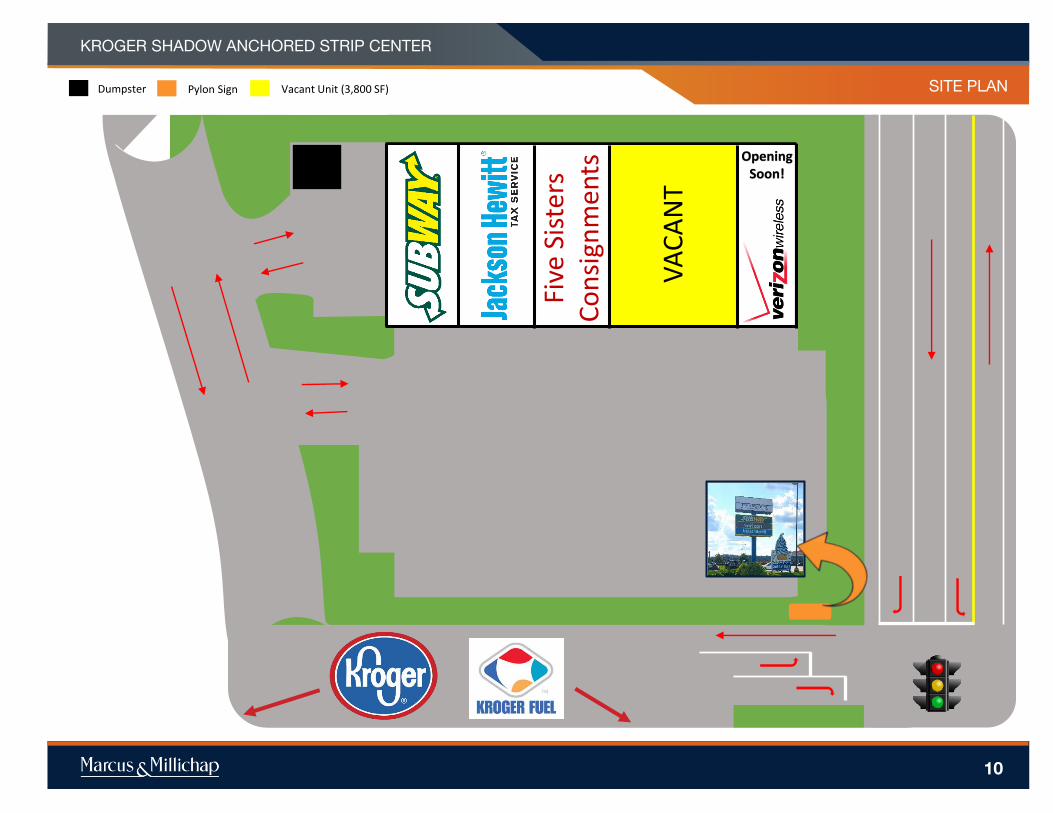
This Kroger shadow anchored strip center is currently 60 percent leased to four tenants with one remaining unit totaling 40 percent or 3,800-
square feet of vacancy upside. Leasing up the last remaining unit at market rates could nearly double the current NOI adding up to $45,000 to the
bottom line. Subway has occupied the center since the building was built in 2002 and occupies nearly 1,500-square feet or 16 percent of the GLA.
Jackson Hewitt joined the center in 2006 and occupies 1,500-square feet alongside Verizon Wireless and Five Sisters Consignments, who both
have recently signed their leases in 2017. This strip center contains a strong mix of nationally and regionally recognized tenants, all of which that
are under triple-net leases. The Kroger supermarket was originally constructed in 2001 and later developed the fuel station in 2004.
The village of Cleves is located on the westside of Cincinnati along the Great Miami River on US-50, less than 18-miles from downtown. Situated
less than two-miles away is Interstate-275, the Cincinnati loop that sees over 100,000 vehicles per day. The population has seen rapid growth of
more than twenty-three percent since 2000 with more than 40,000 residents and average household incomes of $89,000 in five-miles. The seven-
mile radius has seen growth of more than fifteen percent since 2000 with 100,000 residents and average household incomes of $87,300. There
are more than 81,000 employees in the same proximity which makes up the daytime population. Located on the other side of the river
approximately half a mile away from the center is Taylor High School, Taylor Middle School and Three Rivers Elementary School with a combined
enrollment of more than 2,500 students. The center is located less than 20-miles from the Cincinnati/Northern Kentucky International Airport, also
known as CVG.
This offering provides an incoming investor the ability to acquire a value-add Kroger shadow anchored center within a growing Cincinnati
submarket. This center should remain an integral part of the community and will continue to serve as a valued shopping destination for many of
the local residents.
INVESTMENT OVERVIEW
6
KROGER SHADOW ANCHORED STRIP CENTER
PROPERTY PHOTOS
7
KROGER SHADOW ANCHORED STRIP CENTER
PROPERTY PHOTOS
8
KROGER SHADOW ANCHORED STRIP CENTER
PROPERTY PHOTOS
9
KROGER SHADOW ANCHORED STRIP CENTER
Five
Sis
ters
C
on
sign
men
ts
VA
CA
NT
SITE PLAN
10
Dumpster Vacant Unit (3,800 SF) Pylon Sign
KROGER SHADOW ANCHORED STRIP CENTER
Opening Soon!
REGIONAL PHOTO
11
KROGER SHADOW ANCHORED STRIP CENTER
12
FINANCIAL
ANALYSIS
KROGER SHADOW ANCHORED STRIP CENTER
#
EXECUTIVE SUMMARY
OFFERING SUMMARY
13
THE OFFERING
Property Kroger Shadow Anchored Strip Center
Property Address 4153 SR 128, Cleves, OH 45002
SITE DESCRIPTION
Built 2002
Gross Leasable Area 9,500 SF
Current Occupancy 60.00%
Lot Size +/- .71 Acre(s)
Ownership Fee Simple
MAJOR TENANTS
TENANT GLA LEASE EXPIRATION LEASE TYPE
Subway 1,500 09/30/2022 NNN
Verizon 1,200 01/31/2022 NNN
MAJOR EMPLOYERS
EMPLOYER# OF
EMPLOYEES
The Kroger Company 20,000
University of Cincinnati 15,000
Cincinnati Children’s Hospital 12,000
The Procter & Gamble Company 12,000
TriHealth, Inc. 10,000
UC Health 8,000
GE Transportation 7,500
St. Elizabeth Healthcare 7,000
Fifth Third Bank 7,000
Archdiocese of Cincinnati 7,000
U.S. Postal Service 6,900
DEMOGRAPHICS
3-Miles 5-Miles 7-Miles
2016 Estimate Pop 12,320 40,854 99,912
2010 Census Pop 12,265 40,356 99,137
2016 Estimate HH 4,356 14,531 37,448
2010 Census HH 4,349 14,384 37,194
Average HH Income $76,772 $88,994 $87,380
https://vimeo.com/234559392/b06ca72301Click Here to View Exclusive Video Presentation
KROGER SHADOW ANCHORED STRIP CENTER
FINANCIAL ANALYSIS
14
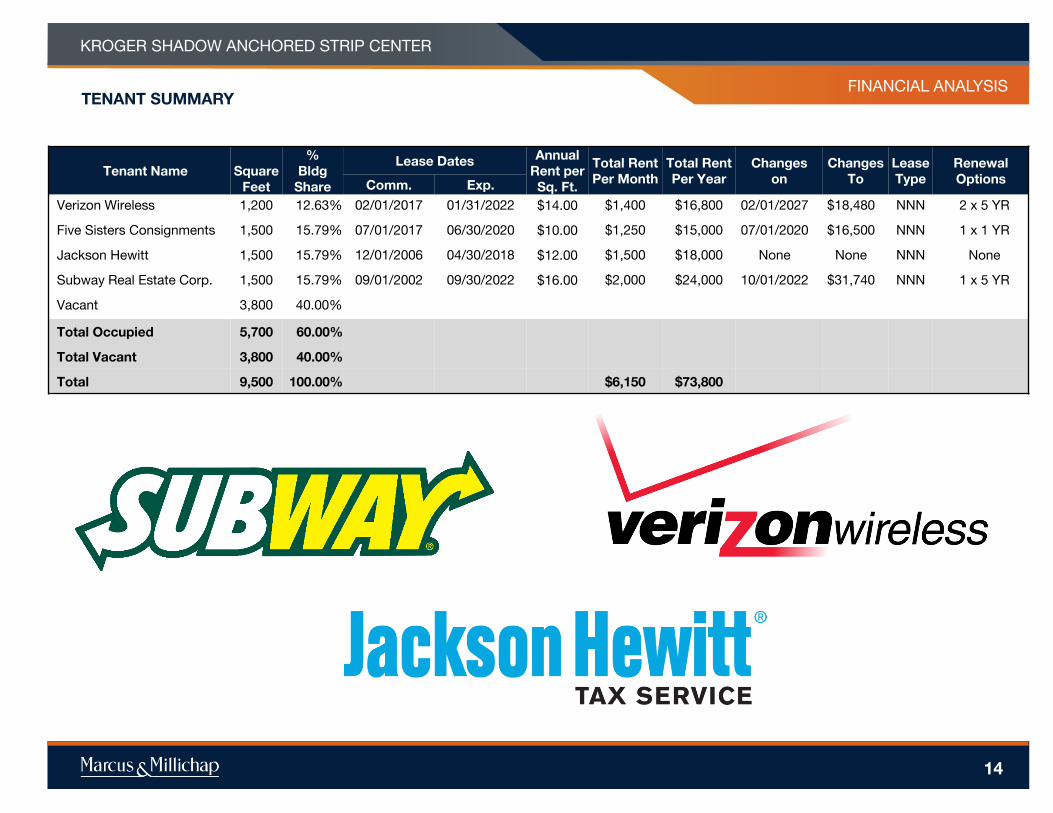
TENANT SUMMARY
Tenant Name Square
Feet
%
Bldg
Share
Lease DatesAnnual
Rent per
Sq. Ft.
Total Rent
Per Month
Total Rent
Per Year
Changes
on
Changes
To
Lease
Type
Renewal
OptionsComm. Exp.
Verizon Wireless 1,200 12.63% 02/01/2017 01/31/2022 $14.00 $1,400 $16,800 02/01/2027 $18,480 NNN 2 x 5 YR
Five Sisters Consignments 1,500 15.79% 07/01/2017 06/30/2020 $10.00 $1,250 $15,000 07/01/2020 $16,500 NNN 1 x 1 YR
Jackson Hewitt 1,500 15.79% 12/01/2006 04/30/2018 $12.00 $1,500 $18,000 None None NNN None
Subway Real Estate Corp. 1,500 15.79% 09/01/2002 09/30/2022 $16.00 $2,000 $24,000 10/01/2022 $31,740 NNN 1 x 5 YR
Vacant 3,800 40.00%
Total Occupied 5,700 60.00%
Total Vacant 3,800 40.00%
Total 9,500 100.00% $6,150 $73,800
KROGER SHADOW ANCHORED STRIP CENTER
TENANT SUMMARY
#
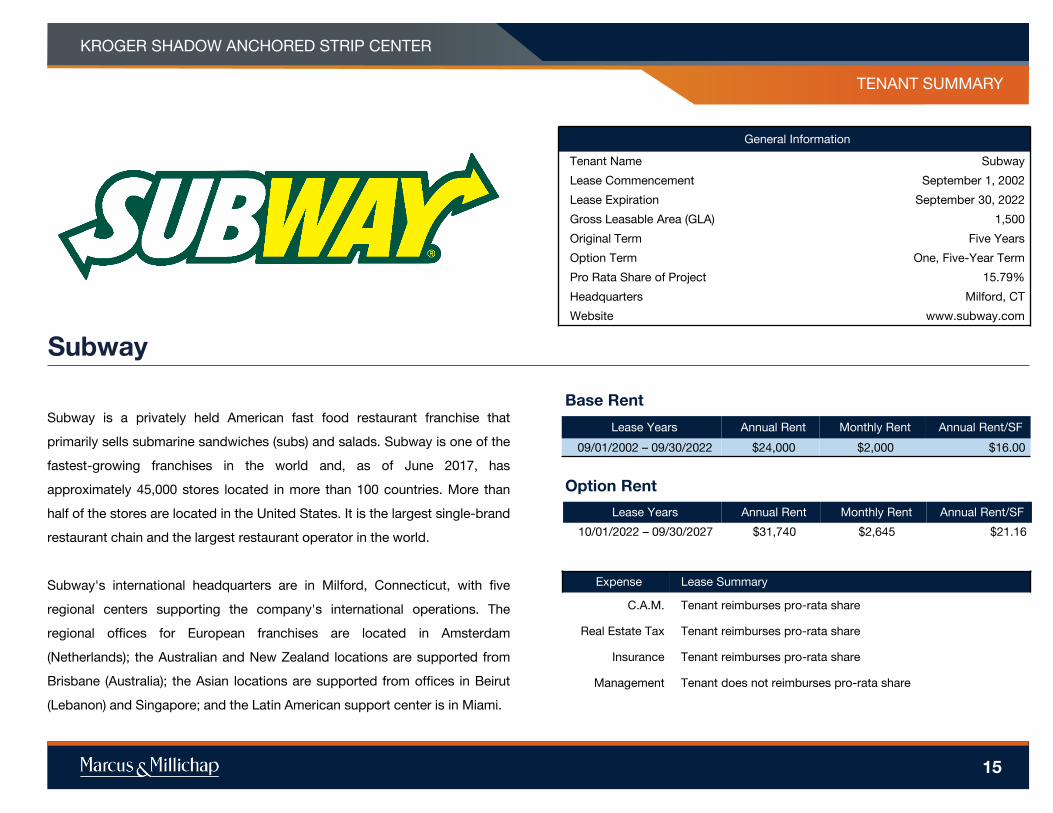
Subway
Subway is a privately held American fast food restaurant franchise that
primarily sells submarine sandwiches (subs) and salads. Subway is one of the
fastest-growing franchises in the world and, as of June 2017, has
approximately 45,000 stores located in more than 100 countries. More than
half of the stores are located in the United States. It is the largest single-brand
restaurant chain and the largest restaurant operator in the world.
Subway's international headquarters are in Milford, Connecticut, with five
regional centers supporting the company's international operations. The
regional offices for European franchises are located in Amsterdam
(Netherlands); the Australian and New Zealand locations are supported from
Brisbane (Australia); the Asian locations are supported from offices in Beirut
(Lebanon) and Singapore; and the Latin American support center is in Miami.
PRICING AND VALUATION MATRIX
PROPERTY NAMEOAKLEY STATION BUILDING
PRICING AND VALUATION MATRIX
PROPERTY NAME
15
TENANT SUMMARY
General Information
Tenant Name Subway
Lease Commencement September 1, 2002
Lease Expiration September 30, 2022
Gross Leasable Area (GLA) 1,500
Original Term Five Years
Option Term One, Five-Year Term
Pro Rata Share of Project 15.79%
Headquarters Milford, CT
Website www.subway.com
Lease Years Annual Rent Monthly Rent Annual Rent/SF
09/01/2002 – 09/30/2022 $24,000 $2,000 $16.00
Lease Years Annual Rent Monthly Rent Annual Rent/SF
10/01/2022 – 09/30/2027 $31,740 $2,645 $21.16
Base Rent
Option Rent
Expense Lease Summary
C.A.M. Tenant reimburses pro-rata share
Real Estate Tax Tenant reimburses pro-rata share
Insurance Tenant reimburses pro-rata share
Management Tenant does not reimburses pro-rata share
KROGER SHADOW ANCHORED STRIP CENTER
TENANT SUMMARY
#
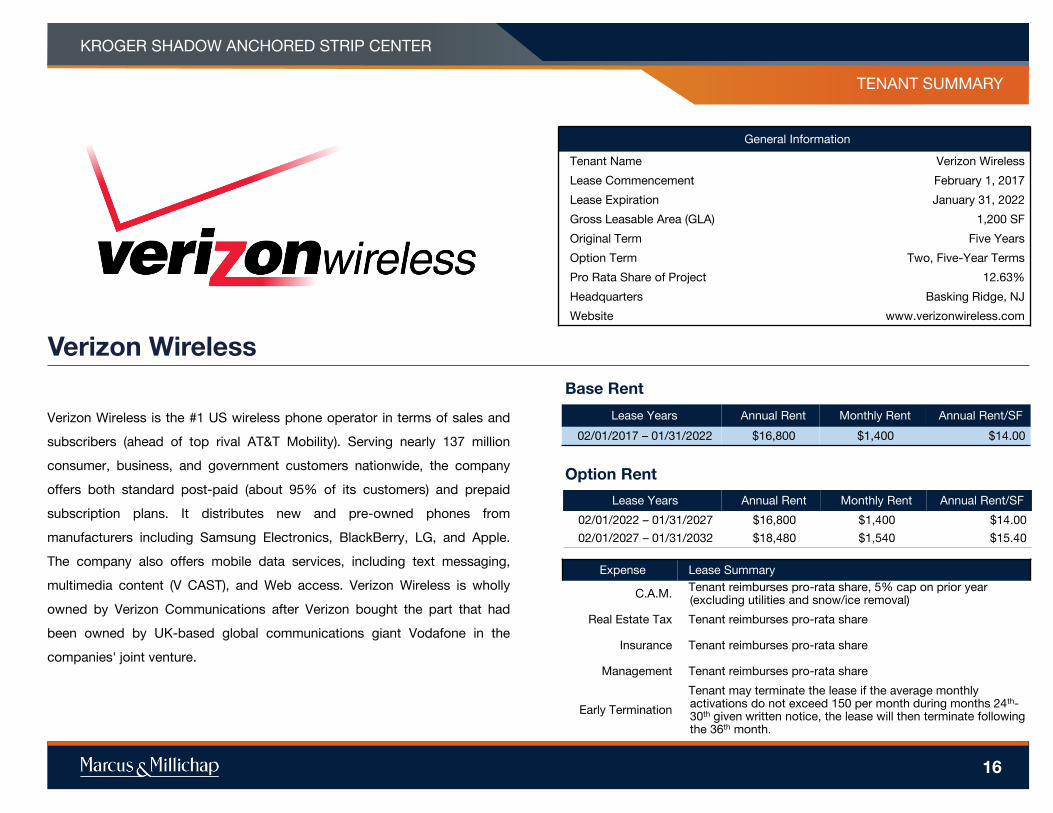
Verizon Wireless
Verizon Wireless is the #1 US wireless phone operator in terms of sales and
subscribers (ahead of top rival AT&T Mobility). Serving nearly 137 million
consumer, business, and government customers nationwide, the company
offers both standard post-paid (about 95% of its customers) and prepaid
subscription plans. It distributes new and pre-owned phones from
manufacturers including Samsung Electronics, BlackBerry, LG, and Apple.
The company also offers mobile data services, including text messaging,
multimedia content (V CAST), and Web access. Verizon Wireless is wholly
owned by Verizon Communications after Verizon bought the part that had
been owned by UK-based global communications giant Vodafone in the
companies' joint venture.
PRICING AND VALUATION MATRIX
PROPERTY NAMEOAKLEY STATION BUILDING
PRICING AND VALUATION MATRIX
PROPERTY NAME
16
TENANT SUMMARY
General Information
Tenant Name Verizon Wireless
Lease Commencement February 1, 2017
Lease Expiration January 31, 2022
Gross Leasable Area (GLA) 1,200 SF
Original Term Five Years
Option Term Two, Five-Year Terms
Pro Rata Share of Project 12.63%
Headquarters Basking Ridge, NJ
Website www.verizonwireless.com
Lease Years Annual Rent Monthly Rent Annual Rent/SF
02/01/2017 – 01/31/2022 $16,800 $1,400 $14.00
Lease Years Annual Rent Monthly Rent Annual Rent/SF
02/01/2022 – 01/31/2027 $16,800 $1,400 $14.00
02/01/2027 – 01/31/2032 $18,480 $1,540 $15.40
Base Rent
Option Rent
Expense Lease Summary
C.A.M.Tenant reimburses pro-rata share, 5% cap on prior year
ff(excluding utilities and snow/ice removal)
Real Estate Tax Tenant reimburses pro-rata share
Insurance Tenant reimburses pro-rata share
Management Tenant reimburses pro-rata share
Early Termination
Tenant may terminate the lease if the average monthly ffactivations do not exceed 150 per month during months 24th-ff30th given written notice, the lease will then terminate following ffthe 36th month.
KROGER SHADOW ANCHORED STRIP CENTER
FINANCIAL ANALYSIS
17
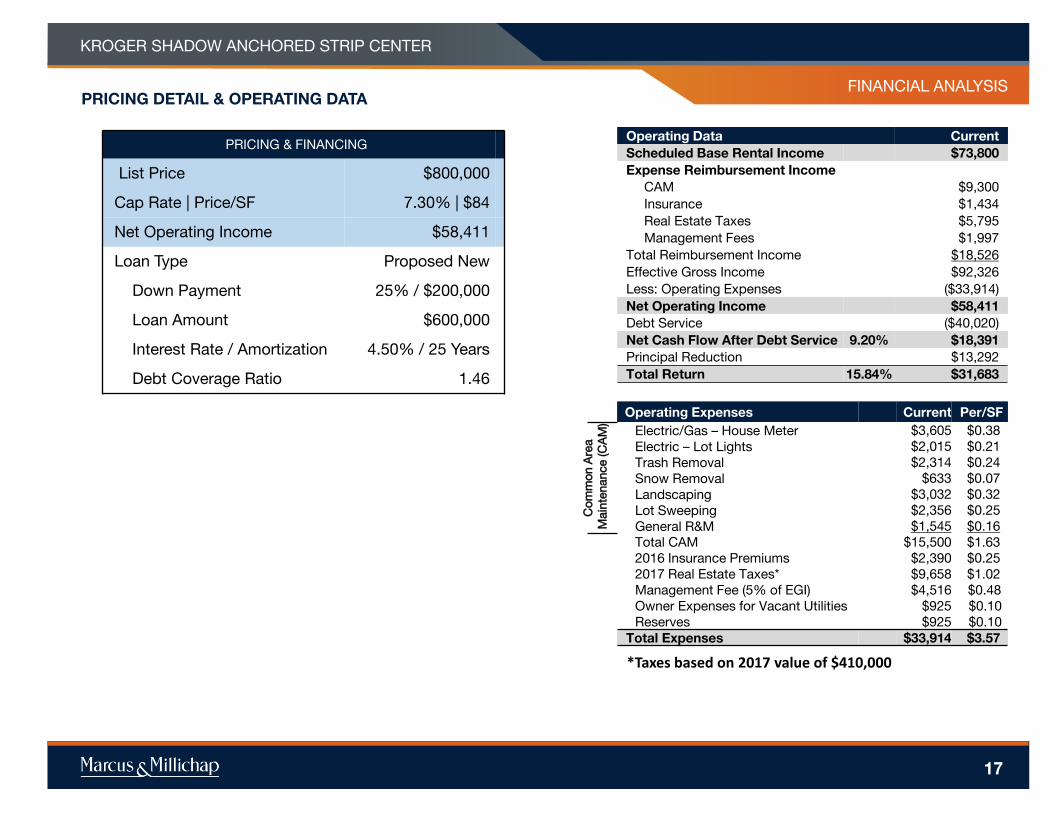
PRICING DETAIL & OPERATING DATA
Operating Data Current
Scheduled Base Rental Income $73,800
Expense Reimbursement Income
CAM $9,300
Insurance $1,434
Real Estate Taxes $5,795
Management Fees $1,997
Total Reimbursement Income $18,526
Effective Gross Income $92,326
Less: Operating Expenses ($33,914)
Net Operating Income $58,411
Debt Service ($40,020)
Net Cash Flow After Debt Service 9.20% $18,391
Principal Reduction $13,292
Total Return 15.84% $31,683
Operating Expenses Current Per/SF
Co
mm
on
Are
a
Main
tenance (C
AM
)
Electric/Gas – House Meter $3,605 $0.38
Electric – Lot Lights $2,015 $0.21
Trash Removal $2,314 $0.24
Snow Removal $633 $0.07
Landscaping $3,032 $0.32
Lot Sweeping $2,356 $0.25
General R&M $1,545 $0.16
Total CAM $15,500 $1.63
2016 Insurance Premiums $2,390 $0.25
2017 Real Estate Taxes* $9,658 $1.02
Management Fee (5% of EGI) $4,516 $0.48
Owner Expenses for Vacant Utilities $925 $0.10
Reserves $925 $0.10
Total Expenses $33,914 $3.57
PRICING & FINANCING
List Price $800,000
Cap Rate | Price/SF 7.30% | $84
Net Operating Income $58,411
Loan Type Proposed New
Down Payment 25% / $200,000
Loan Amount $600,000
Interest Rate / Amortization 4.50% / 25 Years
Debt Coverage Ratio 1.46
KROGER SHADOW ANCHORED STRIP CENTER
*Taxes based on 2017 value of $410,000

18
MARKET
OVERVIEW
KROGER SHADOW ANCHORED STRIP CENTER
8 DEMOGRAPHICS
19
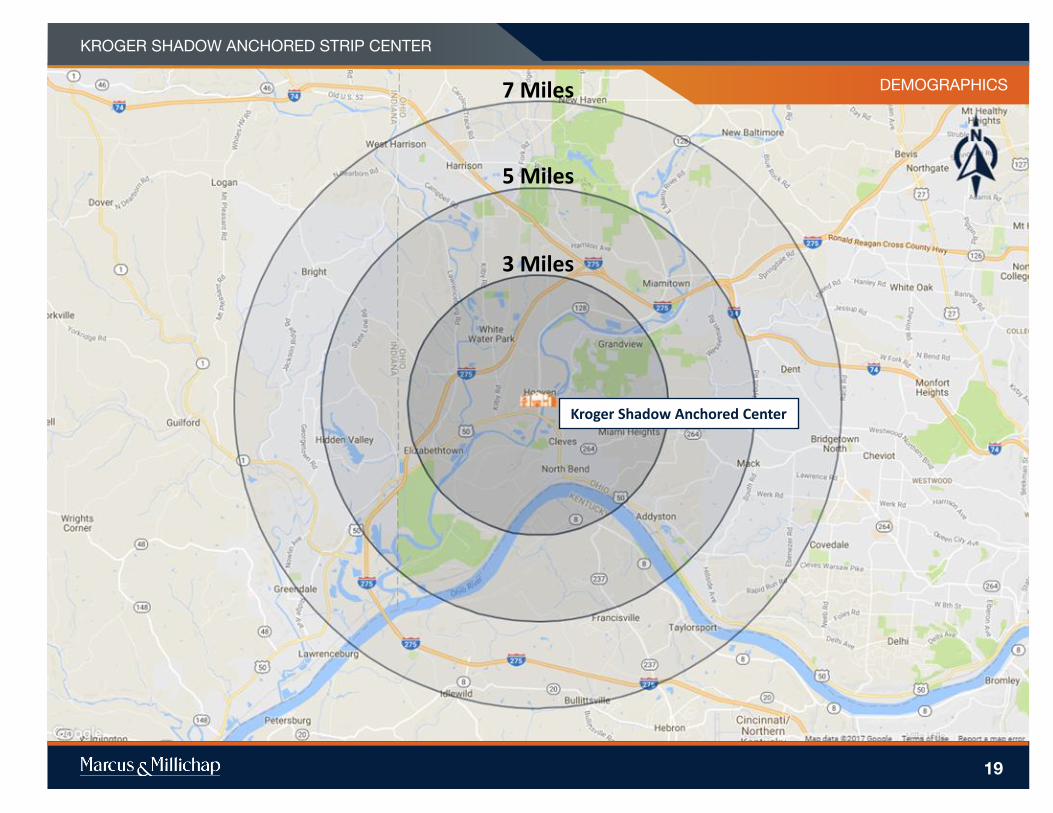
Kroger Shadow Anchored Center
3 Miles
5 Miles
7 Miles
KROGER SHADOW ANCHORED STRIP CENTER

PROPERTY NAME
MARKETING TEAMDEMOGRAPHICS
Source: © 2016 Experian
Created on September 2017
POPULATION 3 Miles 5 Miles 7 Miles
▪ 2021 Projection
Total Population 13,208 44,008 106,142
▪ 2016 Estimate
Total Population 12,320 40,854 99,912
▪ 2010 Census
Total Population 12,265 40,356 99,137
▪ 2000 Census
Total Population 10,312 33,154 86,312
▪ Current Daytime Population
2016 Estimate 10,268 29,583 81,335
HOUSEHOLDS 3 Miles 5 Miles 7 Miles
▪ 2021 Projection
Total Households 4,705 15,722 39,909
▪ 2016 Estimate
Total Households 4,356 14,531 37,448
Average (Mean) Household Size 2.80 2.77 2.67
▪ 2010 Census
Total Households 4,349 14,384 37,194
▪ 2000 Census
Total Households 3,583 11,496 31,404
▪ Occupied Units
2021 Projection 4,705 15,722 39,909
2016 Estimate 4,732 15,571 39,827
HOUSEHOLDS BY INCOME 3 Miles 5 Miles 7 Miles
▪ 2016 Estimate
$150,000 or More 6.62% 8.92% 8.71%
$100,000 - $149,000 16.57% 20.49% 18.96%
$75,000 - $99,999 11.79% 14.84% 15.15%
$50,000 - $74,999 21.44% 19.52% 19.45%
$35,000 - $49,999 13.39% 12.44% 12.40%
Under $35,000 28.54% 21.69% 23.30%
Average Household Income $76,772 $88,994 $87,380
Median Household Income $59,331 $69,937 $67,874
Per Capita Income $27,316 $31,730 $32,790
HOUSEHOLDS BY EXPENDITURE 3 Miles 5 Miles 7 Miles
Total Average Household Retail Expenditure
$67,004 $69,793 $68,765
▪ Consumer Expenditure Top 10 Categories
Housing $16,384 $16,993 $16,796
Transportation $11,668 $12,417 $12,229
Shelter $8,728 $9,013 $8,928
Food $7,952 $8,324 $8,173
Personal Insurance and Pensions $5,864 $6,535 $6,323
Health Care $4,886 $5,128 $5,151
Utilities $4,019 $4,148 $4,095
Entertainment $3,037 $3,204 $3,141
Apparel $2,826 $2,886 $2,748
Cash Contributions $1,838 $2,031 $2,100
POPULATION PROFILE 3 Miles 5 Miles 7 Miles
▪ Population By Age
2016 Estimate Total Population 12,320 40,854 99,912
Under 20 29.07% 28.06% 26.92%
20 to 34 Years 15.28% 15.46% 16.30%
35 to 39 Years 6.18% 6.09% 5.78%
40 to 49 Years 14.37% 14.18% 13.67%
50 to 64 Years 20.65% 22.19% 22.33%
Age 65+ 14.45% 14.02% 15.01%
Median Age 39.60 40.29 40.82
▪ Population 25+ by Education Level
2016 Estimate Population Age 25+ 8,121 27,308 67,637
Elementary (0-8) 3.57% 2.47% 2.17%
Some High School (9-11) 9.18% 7.14% 6.26%
High School Graduate (12) 42.44% 34.17% 33.65%
Some College (13-15) 15.31% 19.37% 20.51%
Associate Degree Only 6.59% 8.33% 8.53%
Bachelors Degree Only 15.72% 19.46% 19.93%
Graduate Degree 6.56% 8.70% 8.58%
20
KROGER SHADOW ANCHORED STRIP CENTER
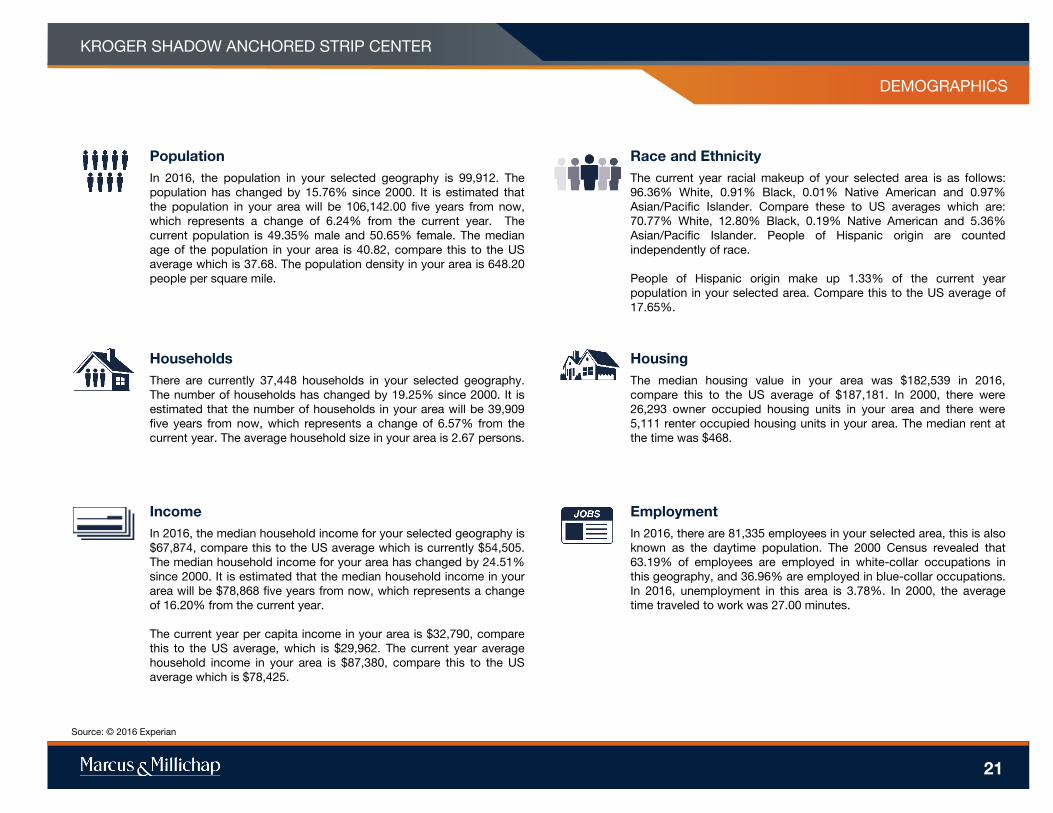
Income
In 2016, the median household income for your selected geography is
$67,874, compare this to the US average which is currently $54,505.
The median household income for your area has changed by 24.51%
since 2000. It is estimated that the median household income in your
area will be $78,868 five years from now, which represents a change
of 16.20% from the current year.
The current year per capita income in your area is $32,790, compare
this to the US average, which is $29,962. The current year average
household income in your area is $87,380, compare this to the US
average which is $78,425.
Population
In 2016, the population in your selected geography is 99,912. The
population has changed by 15.76% since 2000. It is estimated that
the population in your area will be 106,142.00 five years from now,
which represents a change of 6.24% from the current year. The
current population is 49.35% male and 50.65% female. The median
age of the population in your area is 40.82, compare this to the US
average which is 37.68. The population density in your area is 648.20
people per square mile.
Households
There are currently 37,448 households in your selected geography.
The number of households has changed by 19.25% since 2000. It is
estimated that the number of households in your area will be 39,909
five years from now, which represents a change of 6.57% from the
current year. The average household size in your area is 2.67 persons.
Employment
In 2016, there are 81,335 employees in your selected area, this is also
known as the daytime population. The 2000 Census revealed that
63.19% of employees are employed in white-collar occupations in
this geography, and 36.96% are employed in blue-collar occupations.
In 2016, unemployment in this area is 3.78%. In 2000, the average
time traveled to work was 27.00 minutes.
Race and Ethnicity
The current year racial makeup of your selected area is as follows:
96.36% White, 0.91% Black, 0.01% Native American and 0.97%
Asian/Pacific Islander. Compare these to US averages which are:
70.77% White, 12.80% Black, 0.19% Native American and 5.36%
Asian/Pacific Islander. People of Hispanic origin are counted
independently of race.
People of Hispanic origin make up 1.33% of the current year
population in your selected area. Compare this to the US average of
17.65%.
PROPERTY NAME
MARKETING TEAM
Housing
The median housing value in your area was $182,539 in 2016,
compare this to the US average of $187,181. In 2000, there were
26,293 owner occupied housing units in your area and there were
5,111 renter occupied housing units in your area. The median rent at
the time was $468.
Source: © 2016 Experian
DEMOGRAPHICS
21
KROGER SHADOW ANCHORED STRIP CENTER
MARKET OVERVIEW
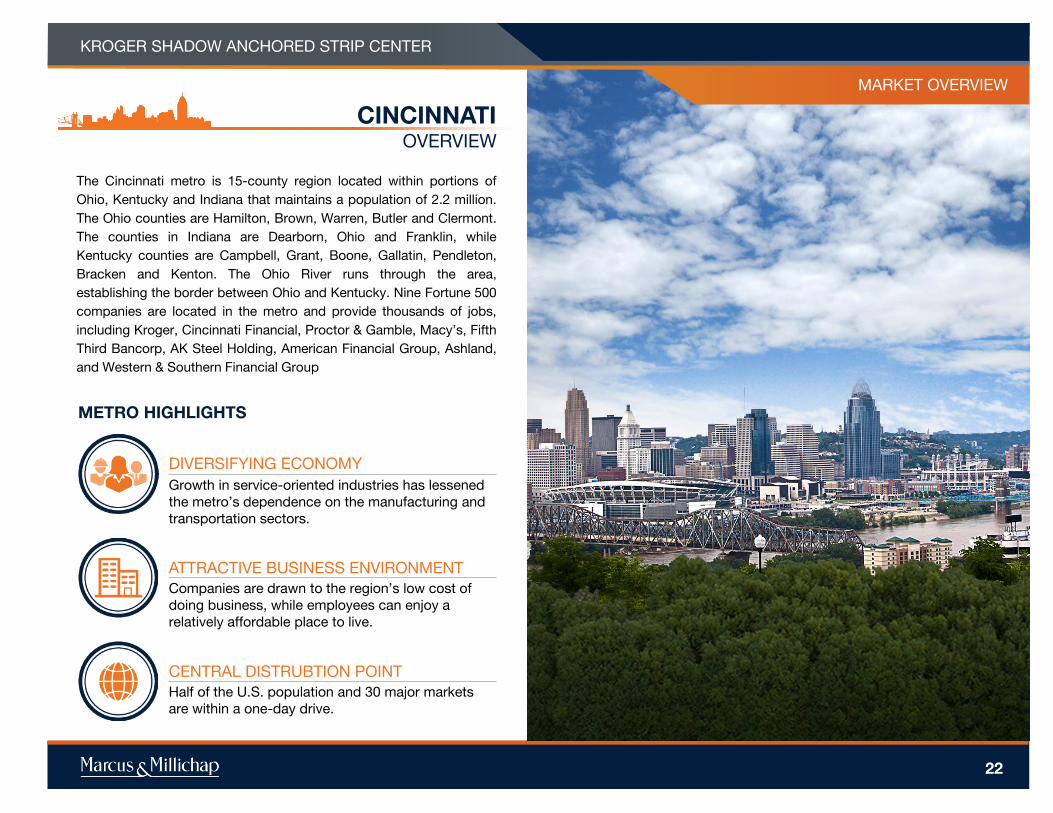
CINCINNATIOVERVIEW
The Cincinnati metro is 15-county region located within portions of
Ohio, Kentucky and Indiana that maintains a population of 2.2 million.
The Ohio counties are Hamilton, Brown, Warren, Butler and Clermont.
The counties in Indiana are Dearborn, Ohio and Franklin, while
Kentucky counties are Campbell, Grant, Boone, Gallatin, Pendleton,
Bracken and Kenton. The Ohio River runs through the area,
establishing the border between Ohio and Kentucky. Nine Fortune 500
companies are located in the metro and provide thousands of jobs,
including Kroger, Cincinnati Financial, Proctor & Gamble, Macy’s, Fifth
Third Bancorp, AK Steel Holding, American Financial Group, Ashland,
and Western & Southern Financial Group
MARKET OVERVIEW
METRO HIGHLIGHTS
DIVERSIFYING ECONOMY
Growth in service-oriented industries has lessened
the metro’s dependence on the manufacturing and
transportation sectors.
ATTRACTIVE BUSINESS ENVIRONMENT
Companies are drawn to the region’s low cost of
doing business, while employees can enjoy a
relatively affordable place to live.
CENTRAL DISTRUBTION POINT
Half of the U.S. population and 30 major markets
are within a one-day drive.
22
KROGER SHADOW ANCHORED STRIP CENTER
MARKET OVERVIEW
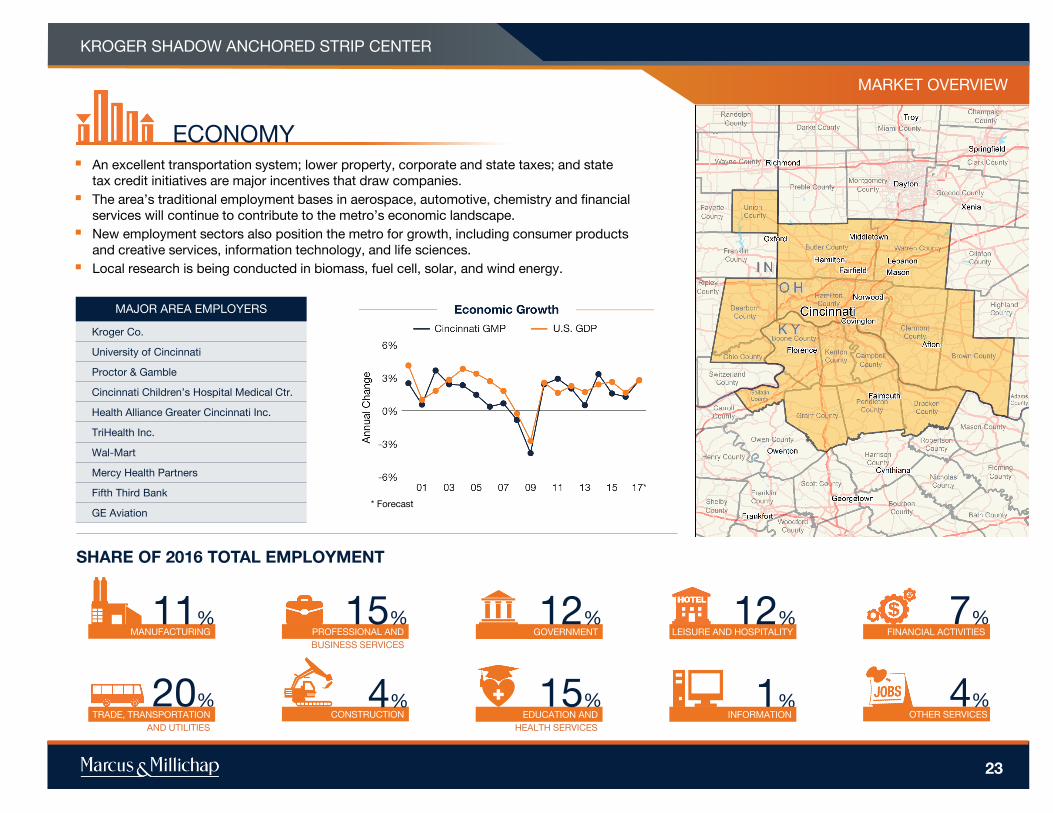
ECONOMY▪ An excellent transportation system; lower property, corporate and state taxes; and state
tax credit initiatives are major incentives that draw companies.
▪ The area’s traditional employment bases in aerospace, automotive, chemistry and financial
services will continue to contribute to the metro’s economic landscape.
▪ New employment sectors also position the metro for growth, including consumer products
and creative services, information technology, and life sciences.
▪ Local research is being conducted in biomass, fuel cell, solar, and wind energy.
SHARE OF 2016 TOTAL EMPLOYMENT
MAJOR AREA EMPLOYERS
Kroger Co.
University of Cincinnati
Proctor & Gamble
Cincinnati Children’s Hospital Medical Ctr.
Health Alliance Greater Cincinnati Inc.
TriHealth Inc.
Wal-Mart
Mercy Health Partners
Fifth Third Bank
GE Aviation* Forecast
MANUFACTURING
11%GOVERNMENT
HEALTH SERVICES
EDUCATION AND
+OTHER SERVICES
4%
LEISURE AND HOSPITALITY FINANCIAL ACTIVITIES
20%
AND UTILITIES
TRADE, TRANSPORTATION CONSTRUCTION
PROFESSIONAL AND
BUSINESS SERVICES
1%INFORMATION
15%
4%
12% 12% 7%
15%
23
KROGER SHADOW ANCHORED STRIP CENTER
MARKET OVERVIEW
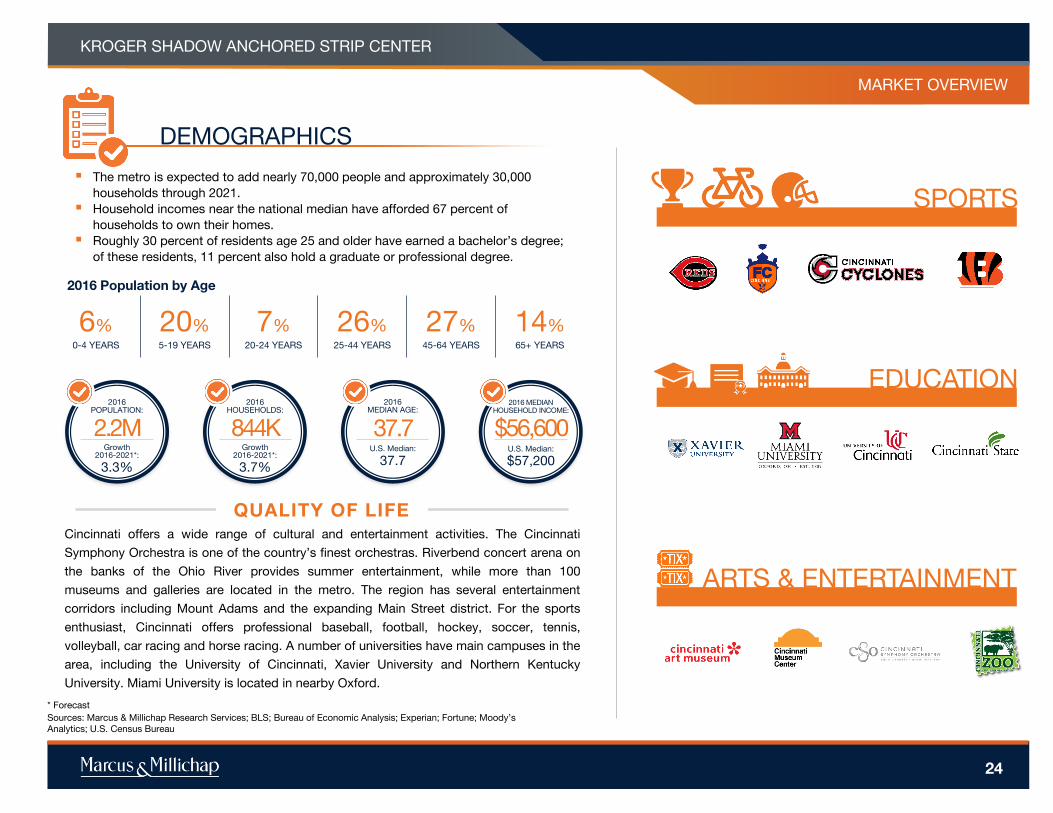
DEMOGRAPHICS
▪ The metro is expected to add nearly 70,000 people and approximately 30,000
households through 2021.
▪ Household incomes near the national median have afforded 67 percent of
households to own their homes.
▪ Roughly 30 percent of residents age 25 and older have earned a bachelor’s degree;
of these residents, 11 percent also hold a graduate or professional degree.
Cincinnati offers a wide range of cultural and entertainment activities. The Cincinnati
Symphony Orchestra is one of the country’s finest orchestras. Riverbend concert arena on
the banks of the Ohio River provides summer entertainment, while more than 100
museums and galleries are located in the metro. The region has several entertainment
corridors including Mount Adams and the expanding Main Street district. For the sports
enthusiast, Cincinnati offers professional baseball, football, hockey, soccer, tennis,
volleyball, car racing and horse racing. A number of universities have main campuses in the
area, including the University of Cincinnati, Xavier University and Northern Kentucky
University. Miami University is located in nearby Oxford.
37.7
2016MEDIAN AGE:
U.S. Median:
37.7
$56,600
2016 MEDIAN HOUSEHOLD INCOME:
U.S. Median:
$57,200
2.2M
2016POPULATION:
Growth2016-2021*:
3.3%
844K
2016HOUSEHOLDS:
3.7%
Growth2016-2021*:
QUALITY OF LIFE
2016 Population by Age
0-4 YEARS
6%5-19 YEARS
20%20-24 YEARS
7%25-44 YEARS
26%45-64 YEARS
27%65+ YEARS
14%
* Forecast
Sources: Marcus & Millichap Research Services; BLS; Bureau of Economic Analysis; Experian; Fortune; Moody’s
Analytics; U.S. Census Bureau
SPORTS
EDUCATION
ARTS & ENTERTAINMENT
24
KROGER SHADOW ANCHORED STRIP CENTER
MARKET OVERVIEW
25
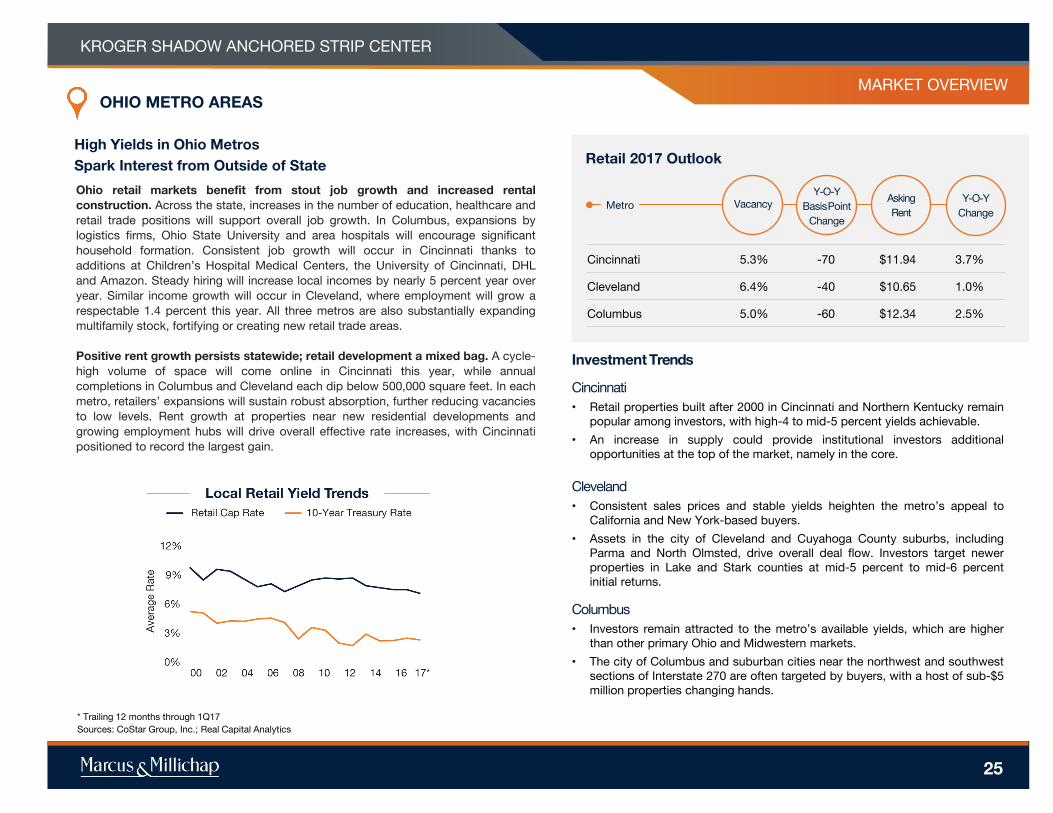
Ohio retail markets benefit from stout job growth and increased rental
construction. Across the state, increases in the number of education, healthcare and
retail trade positions will support overall job growth. In Columbus, expansions by
logistics firms, Ohio State University and area hospitals will encourage significant
household formation. Consistent job growth will occur in Cincinnati thanks to
additions at Children’s Hospital Medical Centers, the University of Cincinnati, DHL
and Amazon. Steady hiring will increase local incomes by nearly 5 percent year over
year. Similar income growth will occur in Cleveland, where employment will grow a
respectable 1.4 percent this year. All three metros are also substantially expanding
multifamily stock, fortifying or creating new retail trade areas.
Positive rent growth persists statewide; retail development a mixed bag. A cycle-
high volume of space will come online in Cincinnati this year, while annual
completions in Columbus and Cleveland each dip below 500,000 square feet. In each
metro, retailers’ expansions will sustain robust absorption, further reducing vacancies
to low levels. Rent growth at properties near new residential developments and
growing employment hubs will drive overall effective rate increases, with Cincinnati
positioned to record the largest gain.
Retail 2017 OutlookHigh Yields in Ohio Metros
Spark Interest from Outside of State
Vacancy
Y-O-Y
BasisPoint
Change
MetroAsking
Rent
Y-O-Y
Change
Cincinnati 5.3% -70 $11.94 3.7%
Cleveland 6.4% -40 $10.65 1.0%
Columbus 5.0% -60 $12.34 2.5%
OHIO METRO AREAS
* Trailing 12 months through 1Q17
Sources: CoStar Group, Inc.; Real Capital Analytics
Investment Trends
Cincinnati
• Retail properties built after 2000 in Cincinnati and Northern Kentucky remain
popular among investors, with high-4 to mid-5 percent yields achievable.
• An increase in supply could provide institutional investors additional
opportunities at the top of the market, namely in the core.
Cleveland
• Consistent sales prices and stable yields heighten the metro’s appeal to
California and New York-based buyers.
• Assets in the city of Cleveland and Cuyahoga County suburbs, including
Parma and North Olmsted, drive overall deal flow. Investors target newer
properties in Lake and Stark counties at mid-5 percent to mid-6 percent
initial returns.
Columbus
• Investors remain attracted to the metro’s available yields, which are higher
than other primary Ohio and Midwestern markets.
• The city of Columbus and suburban cities near the northwest and southwest
sections of Interstate 270 are often targeted by buyers, with a host of sub-$5
million properties changing hands.
KROGER SHADOW ANCHORED STRIP CENTER
MARKET OVERVIEW
26
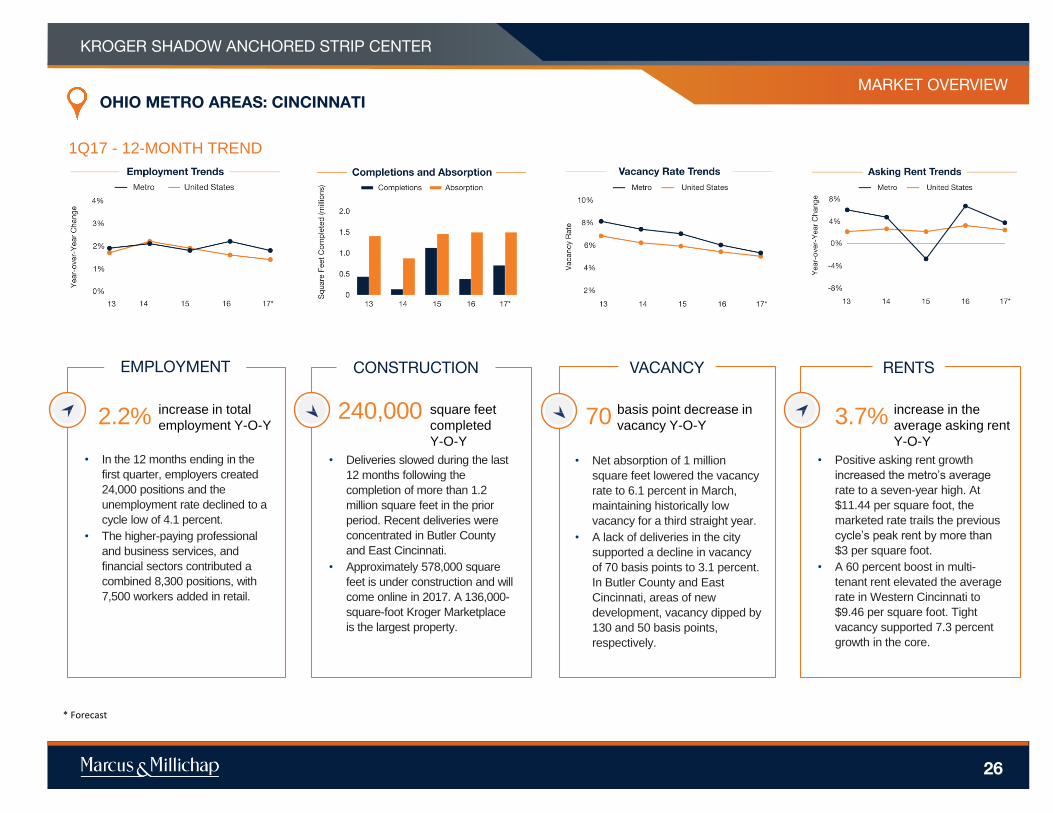
• In the 12 months ending in the
first quarter, employers created
24,000 positions and the
unemployment rate declined to a
cycle low of 4.1 percent.
• The higher-paying professional
and business services, and
financial sectors contributed a
combined 8,300 positions, with
7,500 workers added in retail.
EMPLOYMENT
• Deliveries slowed during the last
12 months following the
completion of more than 1.2
million square feet in the prior
period. Recent deliveries were
concentrated in Butler County
and East Cincinnati.
• Approximately 578,000 square
feet is under construction and will
come online in 2017. A 136,000-
square-foot Kroger Marketplace
is the largest property.
CONSTRUCTION
• Net absorption of 1 million
square feet lowered the vacancy
rate to 6.1 percent in March,
maintaining historically low
vacancy for a third straight year.
• A lack of deliveries in the city
supported a decline in vacancy
of 70 basis points to 3.1 percent.
In Butler County and East
Cincinnati, areas of new
development, vacancy dipped by
130 and 50 basis points,
respectively.
VACANCY
• Positive asking rent growth
increased the metro’s average
rate to a seven-year high. At
$11.44 per square foot, the
marketed rate trails the previous
cycle’s peak rent by more than
$3 per square foot.
• A 60 percent boost in multi-
tenant rent elevated the average
rate in Western Cincinnati to
$9.46 per square foot. Tight
vacancy supported 7.3 percent
growth in the core.
RENTS
OHIO METRO AREAS: CINCINNATI
increase in the
average asking rent
Y-O-Y
3.7%basis point decrease in
vacancy Y-O-Y70square feet
completed
Y-O-Y
240,000increase in total
employment Y-O-Y2.2%
* Forecast
1Q17 - 12-MONTH TREND
KROGER SHADOW ANCHORED STRIP CENTER
MARKET OVERVIEW
27
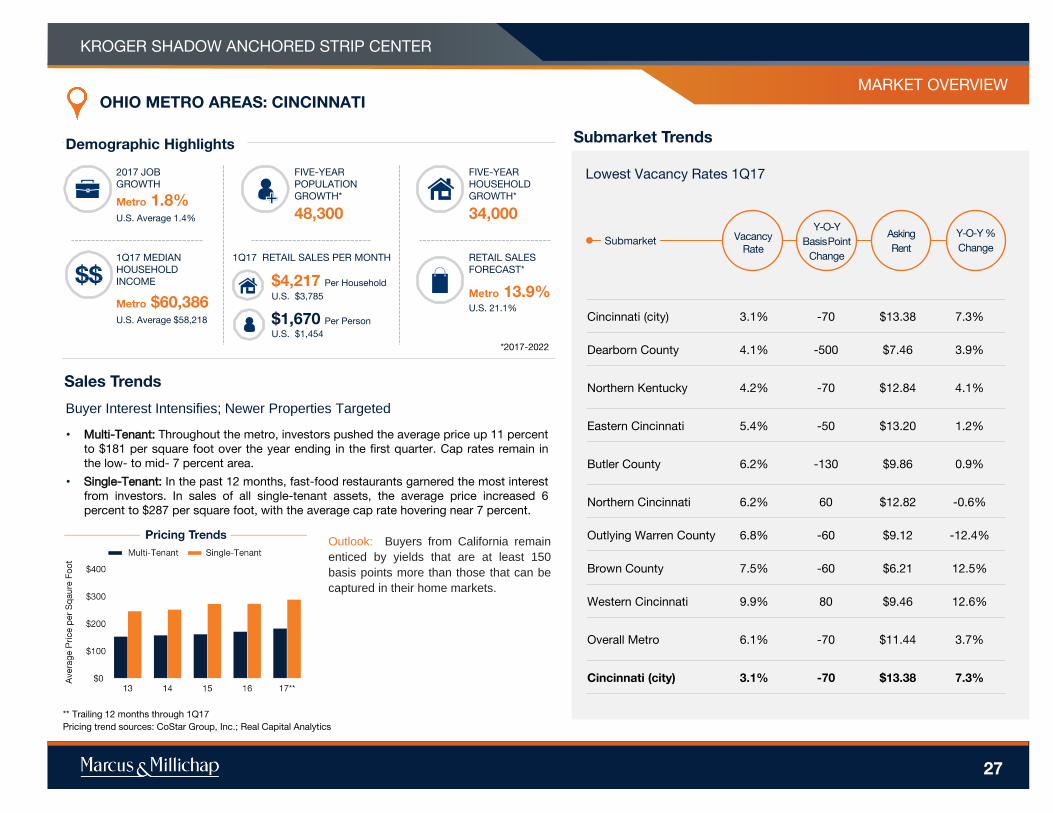
Demographic Highlights
2017 JOB
GROWTH
FIVE-YEAR
POPULATION
GROWTH*
48,300
FIVE-YEAR
HOUSEHOLD
GROWTH*
34,000
1Q17 MEDIAN
HOUSEHOLD
INCOME
RETAIL SALES
FORECAST*
Metro 13.9%U.S. 21.1%
$4,217 Per Household
$1,670 Per Person
1Q17 RETAIL SALES PER MONTH
Buyer Interest Intensifies; Newer Properties Targeted
Outlook: Buyers from California remain
enticed by yields that are at least 150
basis points more than those that can be
captured in their home markets.
Vacancy
Rate
Y-O-Y
BasisPoint
Change
SubmarketAsking
Rent
Y-O-Y %
Change
Cincinnati (city) 3.1% -70 $13.38 7.3%
Dearborn County 4.1% -500 $7.46 3.9%
Northern Kentucky 4.2% -70 $12.84 4.1%
Eastern Cincinnati 5.4% -50 $13.20 1.2%
Butler County 6.2% -130 $9.86 0.9%
Northern Cincinnati 6.2% 60 $12.82 -0.6%
Outlying Warren County 6.8% -60 $9.12 -12.4%
Brown County 7.5% -60 $6.21 12.5%
Western Cincinnati 9.9% 80 $9.46 12.6%
Overall Metro 6.1% -70 $11.44 3.7%
Cincinnati (city) 3.1% -70 $13.38 7.3%
Submarket Trends
Lowest Vacancy Rates 1Q17
Sales Trends
OHIO METRO AREAS: CINCINNATI
• Multi-Tenant: Throughout the metro, investors pushed the average price up 11 percent
to $181 per square foot over the year ending in the first quarter. Cap rates remain in
the low- to mid- 7 percent area.
• Single-Tenant: In the past 12 months, fast-food restaurants garnered the most interest
from investors. In sales of all single-tenant assets, the average price increased 6
percent to $287 per square foot, with the average cap rate hovering near 7 percent.
** Trailing 12 months through 1Q17
Pricing trend sources: CoStar Group, Inc.; Real Capital Analytics
*2017-2022
Metro 1.8%U.S. Average 1.4%
Metro $60,386U.S. Average $58,218
U.S. $3,785
U.S. $1,454
KROGER SHADOW ANCHORED STRIP CENTER
MARKET OVERVIEW
28
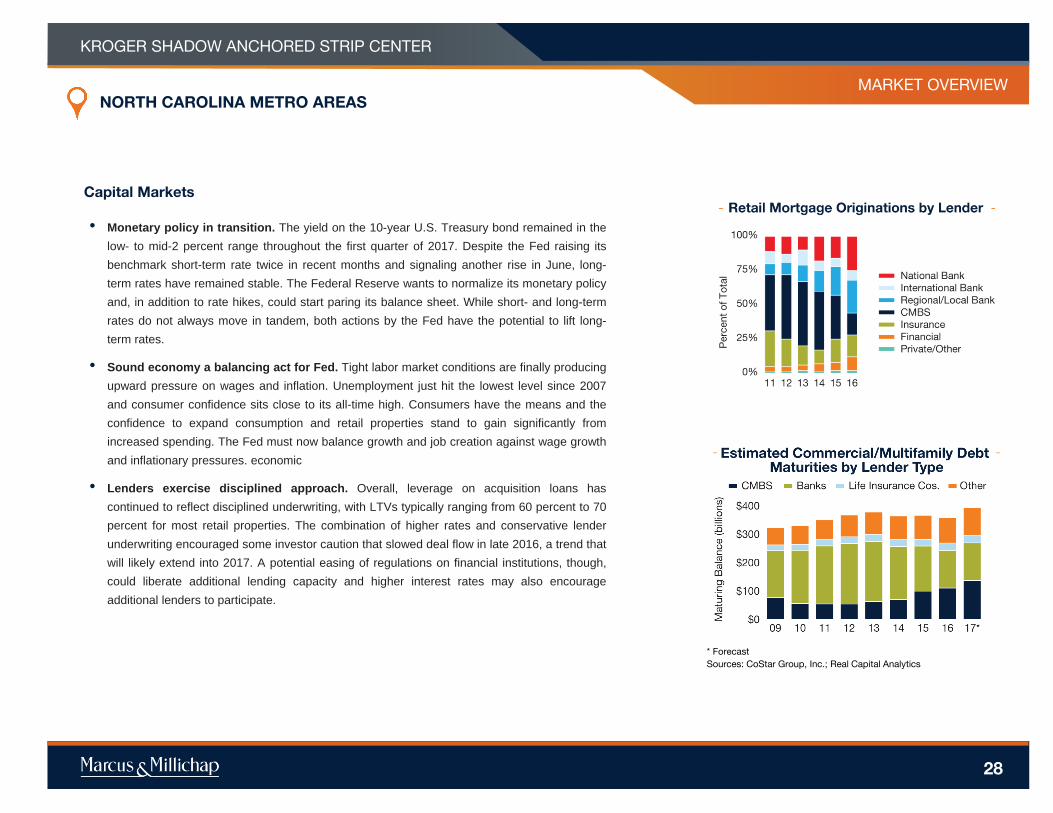
• Monetary policy in transition. The yield on the 10-year U.S. Treasury bond remained in the
low- to mid-2 percent range throughout the first quarter of 2017. Despite the Fed raising its
benchmark short-term rate twice in recent months and signaling another rise in June, long-
term rates have remained stable. The Federal Reserve wants to normalize its monetary policy
and, in addition to rate hikes, could start paring its balance sheet. While short- and long-term
rates do not always move in tandem, both actions by the Fed have the potential to lift long-
term rates.
• Sound economy a balancing act for Fed. Tight labor market conditions are finally producing
upward pressure on wages and inflation. Unemployment just hit the lowest level since 2007
and consumer confidence sits close to its all-time high. Consumers have the means and the
confidence to expand consumption and retail properties stand to gain significantly from
increased spending. The Fed must now balance growth and job creation against wage growth
and inflationary pressures. economic
• Lenders exercise disciplined approach. Overall, leverage on acquisition loans has
continued to reflect disciplined underwriting, with LTVs typically ranging from 60 percent to 70
percent for most retail properties. The combination of higher rates and conservative lender
underwriting encouraged some investor caution that slowed deal flow in late 2016, a trend that
will likely extend into 2017. A potential easing of regulations on financial institutions, though,
could liberate additional lending capacity and higher interest rates may also encourage
additional lenders to participate.
* Forecast
Sources: CoStar Group, Inc.; Real Capital Analytics
NORTH CAROLINA METRO AREAS
Capital Markets
KROGER SHADOW ANCHORED STRIP CENTER
www.MarcusMillichap.com
Joel Dumes
Senior Vice President Investments
Senior Director - National Retail Group
Cincinnati Office
Tel: (513) 878-7720
Fax: (513) 878-7710
Licenses: OH SAL.2003013045, KY 63818
Stan Falk
First Vice President Investments
Director - National Retail Group
Cincinnati Office
Tel: (513) 878-7721
Fax: (513) 878-7710
License: OH SAL.2012001364
P R E S E N T E D B Y