krisztián flautner - [email protected] automatic monitoring for interactive performance and...
Post on 21-Dec-2015
235 views
TRANSCRIPT

Krisztián Flautner - [email protected] Monitoring for Interactive performance and Power Reduction 1
Automatic Monitoring for Interactive Performance and Power Reduction
Krisztián [email protected]

Krisztián Flautner - [email protected] Monitoring for Interactive performance and Power Reduction 2
Overview
• A mechanism for quantifying the user experience.– Metric: response time.– Automatic, no user program modifications required.– Run-time feedback to the kernel.
• Multiprocessing to improve response times.
• Slow down processor to save energy when response times are fast enough.

Krisztián Flautner - [email protected] Monitoring for Interactive performance and Power Reduction 3
Research contributions
• A metric (TLP) and a portable methodology for quantifying the amount of concurrency in a multiprocessor system.
• An automatic technique for detecting execution episodes that directly impact the user-perceived response times of interactive applications.
• Quantifying how much multiprocessing improves the responsiveness of interactive applications.
• An automatic mechanism for setting the optimum performance level of processors that support dynamic voltage scaling.

Krisztián Flautner - [email protected] Monitoring for Interactive performance and Power Reduction 4
Response time
• Faster is not always better.– Fundamental limit to what is perceptible to humans.
• Movies: 20-30 frames per second.• Perceptual causality: 50ms-100ms.• Dragging objects on screen: 200ms.• Non-continuous operation: 1-2sec.
The time it takes for the computer to respond to user initiated events.
The goal is to run fast enough to meet the perception threshold, no point to running any faster.

Krisztián Flautner - [email protected] Monitoring for Interactive performance and Power Reduction 5
Episode classification
• Interactive episodes– When the user is waiting for the computer to respond.
• Periodic episodes– Producer (e.g. MP3 player).– Consumer (e.g. sound daemon).

Krisztián Flautner - [email protected] Monitoring for Interactive performance and Power Reduction 6
A utilization trace
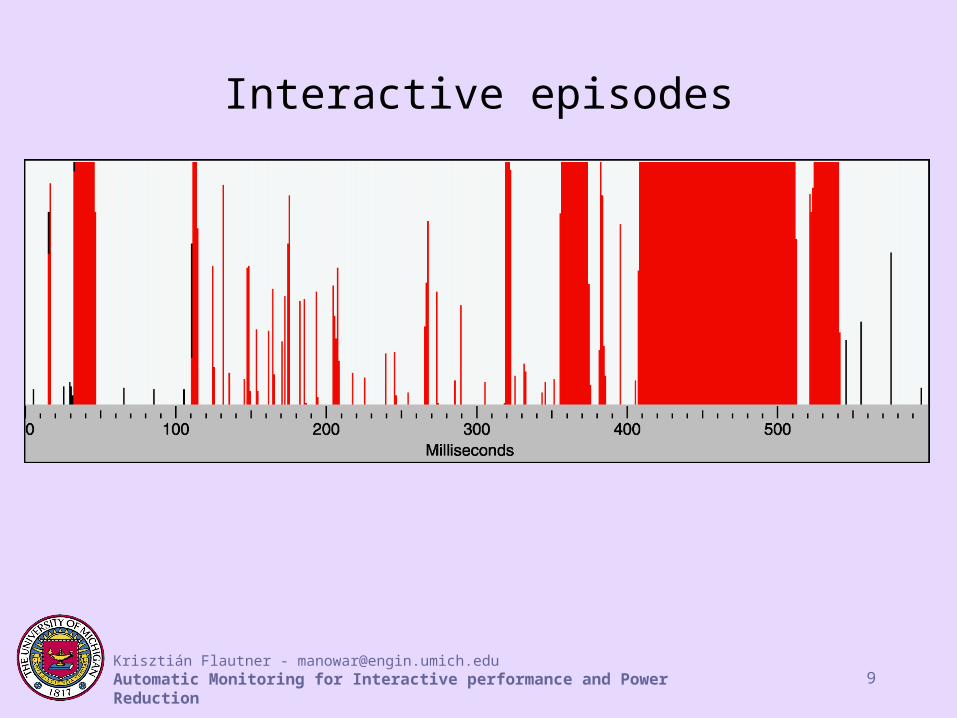
Each horizontal quantum is a millisecond, height corresponds to the utilization in that quantum.

Krisztián Flautner - [email protected] Monitoring for Interactive performance and Power Reduction 7
Episode classification
Interactive (Acrobat Reader), Producer (MP3 playback), and Consumer (esd sound daemon) episodes.

Krisztián Flautner - [email protected] Monitoring for Interactive performance and Power Reduction 8
Mouse movement
X server updates screen every ~10ms. Update takes ~0.25ms.
Krisztián Flautner - [email protected] Monitoring for Interactive performance and Power Reduction 9
Interactive episodes

Krisztián Flautner - [email protected] Monitoring for Interactive performance and Power Reduction 10
Interactive episodes can include idle time
Waiting for data from the network during a run of Netscape. Page rendering starts after 250ms.
Krisztián Flautner - [email protected] Monitoring for Interactive performance and Power Reduction 11
Finding interactive episodes
• One way: mouse click indicates start, long idle time indicates end.
– Not always accurate.
– Not all episodes are initiated by mouse click.
– Latency in finding the ends of episodes.
• Our approach: track inter-task communication.– Accurate.– Finds all interactive episodes.– No latency.– No program modifications required.

Krisztián Flautner - [email protected] Monitoring for Interactive performance and Power Reduction 12
Tracking interactive episodes
• Start of an interactive episode:– X server sends a message to another task.
• During interactive episode:– Keep track of communicating tasks (episode’s task set).
– Compute desired metrics.
• Conditions for ending the episode (applied to tasks in the episode’s task set):– No tasks are executing.
– Data written by the tasks have been consumed.
– No task was preempted the last time it ran.
– No tasks are blocked on I/O.

Krisztián Flautner - [email protected] Monitoring for Interactive performance and Power Reduction 13
Communication between tasksC P U 1C P U 0
89 5
75 7
75 7
75 77 78
7 78
8 89
89 5
75 7
20 88
75 7
R
R
R
W
W
W
W
W
W
W
C P U 1C PU 0
7 57
7 572 09 0
7 57
W
W
W
7 57 W
7 57W
7 57 W
7 57 W
Krisztián Flautner - [email protected] Monitoring for Interactive performance and Power Reduction 14
Does multiprocessing improve interactive performance?
Metrics: Response time, thread-level parallelism (TLP).• Response time: duration of interactive episode.• Machine is idle when all processors are idle.• TLP: machine utilization when machine is not idle.
Results relevant to SMT, CMP processors.
Workloads: interactive desktop applications.
OS: Linux 2.3.99-pre3, Mandrake 7.1, glibc 2.1.3, XFree86 3.3.6.
Hardware: Dell Precision 410 Workstation: dual Pentium II 450Mhz, 512M RAM, Matrox Millennium II AGP 4M.

Krisztián Flautner - [email protected] Monitoring for Interactive performance and Power Reduction 15
Why use TLP?
0%
25%
50%
75%
100%
Benchmarks
Machine Utilization
Idle time
Automatedbenchmark runs
"Realistic"benchmark runs
Machine utilization only quantifies concurrency if there is no idle time during execution.

Krisztián Flautner - [email protected] Monitoring for Interactive performance and Power Reduction 16
Initial results
• Surveyed >50 desktop applications– BeOS, Linux and Windows NT.
• Lots of threads, but limited concurrency.– Multimedia, web: 1.2~1.4.– TLP is workload dependent. Photoshop: 1.23-2.36 TLP.– Java apps similar to Windows apps.
• Lots of idle time (often >80% of execution time).
• 4 processor machine is overkill (for apps other than make –j and parallel MPEG player).
Does TLP translate into improved response times?

Krisztián Flautner - [email protected] Monitoring for Interactive performance and Power Reduction 17
Workloads and TLP results
Benchmark Version DescriptionDual processor Uniprocessor
TLPie TLPrun Idlerun Idlerun
Acroread 4.0 PDF viewer 1.20 1.19 88% 87%
FrameMaker 5.5.6b Document editor 1.35 1.33 93% 93%
Ghostview 3.5.8 PS and PDF viewer 1.42 1.39 84% 84%
GIMP 1.1.22 Image editor 1.26 1.24 88% 84%
Netscape 4.7 Web browser 1.34 1.28 90% 89%
Xemacs 21.1p8 Text editor 1.26 1.21 93% 92%
Average 1.31 1.27 89% 88%

Krisztián Flautner - [email protected] Monitoring for Interactive performance and Power Reduction 18
Methodology
• All benchmarks run by a human– Non-intrusive automation is difficult.
• Repeated runs of the same workload are not identical.– Inexact repeat of mouse movement.– Different amounts of idle times between episodes.– Background activity.
• Average results of seven runs in each configuration.– Mouse clicks used to synchronize traces.– TLP identical, response time variance <3%.

Krisztián Flautner - [email protected] Monitoring for Interactive performance and Power Reduction 19
Response time improvement over uniprocessor
Benchmark TLPie
Response-time (TR) improvement
Acroread 1.20 15%
FrameMaker 1.35 22%
Ghostview 1.42 34%
GIMP 1.26 19%
Netscape 1.34 21%
Average 1.32 22%
Very little idle time (<1%) during interactive episodes.Max. possible response-time improvement is 50% on a dual-processor.TR improvement = 1 - TR(DP) / TR(UP) (expected to be close to 1 – 1 / TLP)

Krisztián Flautner - [email protected] Monitoring for Interactive performance and Power Reduction 20
Background activity: MP3 playback
No MP3 MP3
Avg. TR improvement on dual-processor
22% 29%
TLPie 1.31 1.36
TLPrun 1.27 1.23
Uniprocessor Dual-processor
Avg. TR increase due to MP3 playback
14% 4%
P1 P2

Krisztián Flautner - [email protected] Monitoring for Interactive performance and Power Reduction 21
Time above the perception threshold
0%
20%
40%
60%
80%
100%
50ms 100ms 150ms 200ms 250ms 300ms
Perception threshold
Tim
e
ab
ov
e t
he
pe
rce
pti
on
th
res
ho
ld
Acrobat Reader
FrameMaker
Ghostview
GIMP
Netscape
Time above the perception threshold is given as a percentage of time spent in all interactive episodes. Data is from the uniprocessor runs.
Krisztián Flautner - [email protected] Monitoring for Interactive performance and Power Reduction 22
Characteristics of Interactive Episodes
• Many interactive episodes are already fast enough.
• More will be imperceptible in the near future.– 200ms perception threshold today estimates work
done during 50ms 3 years from now.
• Faster is not necessarily better.– Human perception has finite resolution.
Slow down the processor!

Krisztián Flautner - [email protected] Monitoring for Interactive performance and Power Reduction 23
Why bother?
386386
486 486
Pentium(R)Pentium(R)
MMX
Pentium Pro
(R)
Pentium II (R)
1
10
100
Max
Po
wer
(W
att
s)
?
So
urc
e:
Inte
l
Higher performance = increased power consumption.

Krisztián Flautner - [email protected] Monitoring for Interactive performance and Power Reduction 24
Power Density!
1
10
100
1000
Wat
ts/c
m2
Hot plate
Nuclear Reactor
RocketNozzle Sun’s
Surface?
So
urc
e:
Inte
l

Krisztián Flautner - [email protected] Monitoring for Interactive performance and Power Reduction 25
Dynamic Voltage Scaling
• Voltage is proportional to the frequency.
• Reduce frequency (and corresponding voltage) to match performance demands.
• Since reduced frequency implies increased execution time, energy is proportional to v2.
Power = Capacitance • voltage2 • frequency
Energy ~ voltage2

Krisztián Flautner - [email protected] Monitoring for Interactive performance and Power Reduction 26
Processors supporting DVS
lpARM Intel SA-1100Transmeta
Crusoe 5600Intel XScale
Intel XScale Demo
Min.
8Mhz
1.1V
1.8mW
59Mhz
0.79V
106mW
500Mhz
1.2V
~1W
150Mhz
0.75V
40mW
150Mhz
0.75V
40mW
Max.
100Mhz
3.3V
220mW
251Mhz
1.65V
964mW
700Mhz
1.6V
~2W
800Mhz
1.5V
900mW
1000Mhz
1.75V
1.45W
Process 0.6 0.35 0.18 0.18 0.18
Max/min energy
9 4.4 1.8 4 5.4

Krisztián Flautner - [email protected] Monitoring for Interactive performance and Power Reduction 27
Some recent desktop processors
Intel Pentium IV Intel Pentium IIIAMD Athlon
Model 4MPC 7450
Core 1.4Ghz @ 1.7V500Mhz @ 1.35V
733Mhz @ 1.65V
650Mhz @ 1.75V
1.2Ghz @ 1.75V
533Mhz @ 1.8V
667Mhz @ 1.8V
I/O 400Mhz100Mhz, 133Mhz
3.3V
200Mhz, 266Mhz
1.6V
133Mhz
1.8V-2.5V
Process 0.18 0.18 0.18 0.18
Max. Power
66.3W12W
19.1W
38W
66W
17W
19.1W

Krisztián Flautner - [email protected] Monitoring for Interactive performance and Power Reduction 28
Small performance reduction = big energy savings
20% performance reduction = 32% energy reduction40% performance reduction = 55% energy reduction
0
0.4
0.8
1.2
1.6
2
0 200 400 600 800 1000 1200
Frequency (Mhz)
Vo
ltag
e (V
)
0
0.2
0.4
0.6
0.8
1
En
ergy facto
r
Graph based onIntel XScale data

Krisztián Flautner - [email protected] Monitoring for Interactive performance and Power Reduction 29
The key: performance-setting algorithm
• Use episode detection and classification.– Interactive episodes.– Periodic episodes (producer and consumer).
• Performance-setting on a per episode basis.
• Stretch episodes to their deadlines.– Interactive episode: perception threshold.– Stretch producer to consumer.
No modification of existing programs needed.Works with irregular processor utilization and multiprogramming.

Krisztián Flautner - [email protected] Monitoring for Interactive performance and Power Reduction 30
Producer and consumer episodes
• Example: MP3 playback through esd sound daemon.• Monitor communications to/from sound daemon.• Distance between producer and consumer episodes determines
necessary performance level.
Sound daemon
MP3 player
HW sound device
Krisztián Flautner - [email protected] Monitoring for Interactive performance and Power Reduction 31
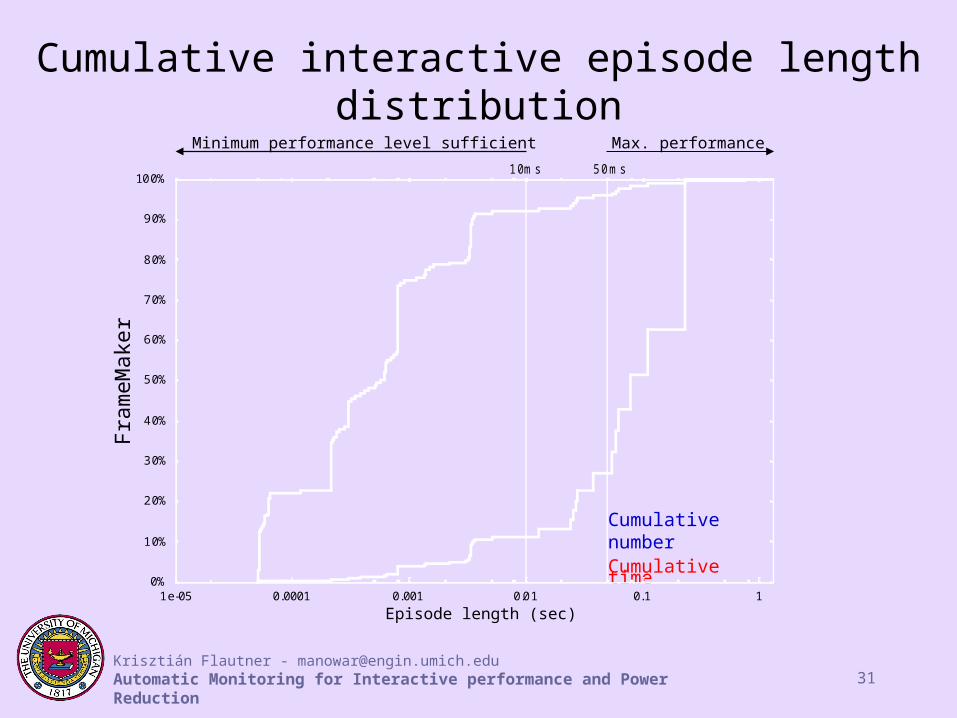
Cumulative interactive episode length distributionF
ram
eMak
er
Episode length (sec)
Cumulative numberCumulative time
0%
10%
20%
30%
40%
50%
60%
70%
80%
90%
100%
1e-05 0.0001 0.001 0.01 0.1 1
50ms10ms
Minimum performance level sufficient Max. performance
Krisztián Flautner - [email protected] Monitoring for Interactive performance and Power Reduction 32
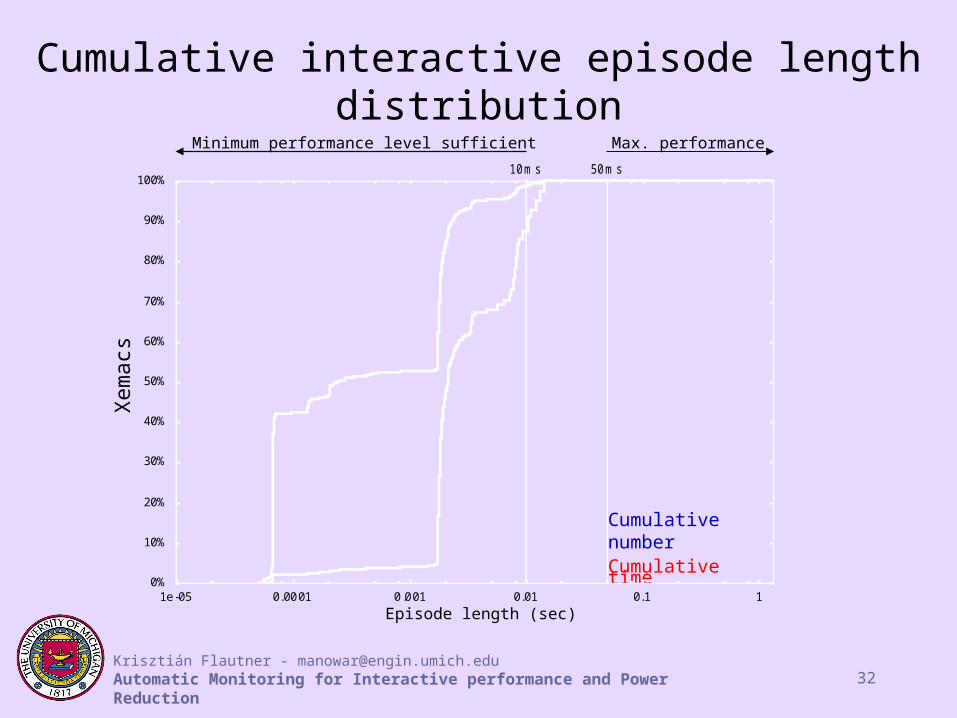
Cumulative interactive episode length distributionX
emac
s
Episode length (sec)
Cumulative numberCumulative time
0%
10%
20%
30%
40%
50%
60%
70%
80%
90%
100%
1e-05 0.0001 0.001 0.01 0.1 1
50ms10ms
Minimum performance level sufficient Max. performance

Krisztián Flautner - [email protected] Monitoring for Interactive performance and Power Reduction 33
Performance-setting strategy for interactive episodes
• Predict the performance factor that would be correct most of the time (not for most events).– Based on past optimal performance factors.
• Limit worst case impact on response time.
• No need to predict episode length.– Performance factors have smaller range.

Krisztián Flautner - [email protected] Monitoring for Interactive performance and Power Reduction 34
Performance-setting for interactive episodes
• Wait 5ms before transition to ignore short episodes• Switch to predicted performance level.
• If episode duration reaches PanicThreshold, switch to maximum performance.
• Estimate full performance episode duration.
• Compute optimum performance level for past episode.
• Compute new prediction based on optimum settings.
At the beginning of the episode
During the episode
At the end of the episode
PanicThreshold = PerceptionThreshold(1 + PerformanceFactor)
Predicted PerformanceFactor is the average of past optimum settings, weighted by the corresponding episode lengths.

Krisztián Flautner - [email protected] Monitoring for Interactive performance and Power Reduction 35
Performance-setting algorithm
• Enter period-sampling mode.
• Switch to maximum performance.
• Establish base performance level.
• Exit period-sampling mode.
Periodic activity detected
• If not in period-sampling mode, apply interactive episode performance-setting policy.
Start of interactive episode
• Update interactive episode statistics.
• Switch to base performance level, if there is periodic activity on the machine.
End of interactive episode

Krisztián Flautner - [email protected] Monitoring for Interactive performance and Power Reduction 36
Advantages
• Automatic.• Impact on response time is quantifiable.
– Performance can be adapted to the user’s preference.
• Works well in the presence of multiprogramming.• Irregular processor utilization is not a problem.• Implementation requires very little state.
– Weighted average: two counters.• Rescale to adapt to temporal variations.
Existing interval-based schemes:• No feedback about service quality.• Only work well if processor utilization is regular.

Krisztián Flautner - [email protected] Monitoring for Interactive performance and Power Reduction 37
Performance-setting during the Acrobat Reader benchmark (200ms p.t.)
0
0.2
0.4
0.6
0.8
1
0 2 4 6 8 10 12 14 16 18104 124
Time (sec)
Pe
rfo
rma
nce
fa
cto
r
Transitions to maximum performance level are due to reaching the PanicThreshold

Krisztián Flautner - [email protected] Monitoring for Interactive performance and Power Reduction 38
Performance-setting during the Acrobat Reader + MP3 benchmark (200ms p.t.)
0
0.2
0.4
0.6
0.8
1
0 5 10 15 20
Time (sec)
Pe
rfo
rma
nce
fa
cto
r
Transitions due to PanicThreshold
Full performance for periodic activity.

Krisztián Flautner - [email protected] Monitoring for Interactive performance and Power Reduction 39
Hardware assumptions
Minimum performance 150Mhz @ 0.75V
Maximum performance 1000Mhz @ 1.75V
PLL resynch time (stalls execution)
0.02ms
Voltage transition time 1ms
Assumptions based on Intel Xscale.
We assume that processor switches to sleep mode when it is not executing an episode.

Krisztián Flautner - [email protected] Monitoring for Interactive performance and Power Reduction 40
Energy factors (no MP3)
0%
20%
40%
60%
80%
100%
50ms 100ms 150ms 200ms 250ms 300ms
Perception threshold
Ene
rgy
fact
or
Acroread FrameMakerGhostview GIMPNetscape Xemacs

Krisztián Flautner - [email protected] Monitoring for Interactive performance and Power Reduction 41
Energy factors with MP3 playback
0%
20%
40%
60%
80%
100%
50ms 100ms 150ms 200ms 250ms 300ms
Perception threshold
Ene
rgy fa
ctor
Acroread FrameMakerGhostview GIMPNetscape Xemacs

Krisztián Flautner - [email protected] Monitoring for Interactive performance and Power Reduction 42
Changes in cumulative episode lengths as the result of performance scaling (Xemacs 50ms p.t. )
0%
10%
20%
30%
40%
50%
60%
70%
80%
90%
100%
1e-05 0.0001 0.001 0.01 0.1 1
50ms10ms
Episode length (sec)
Be
fore
pe
rfo
rma
nc
e s
ca
lin
g Afte
r pe
rform
an
ce
sc
alin
g
Cum
ula
tive
pe
rce
nta
ge o
f tim
e

Krisztián Flautner - [email protected] Monitoring for Interactive performance and Power Reduction 43
Desired improvements
• Processor parameters are good enough.– Faster voltage transitions would help a little.– As peak performance gets higher, lower minimum
performance is desirable.
• More sophisticated prediction algorithms.– Distinguish between episode instances, not just
episode types.

Krisztián Flautner - [email protected] Monitoring for Interactive performance and Power Reduction 44
Conclusions
• Multiprocessing can significantly improve response times.– Measured 15%-38% improvement (out of possible 50%)!
• Many interactive episodes are already fast enough.– More will be fast enough in the near future.– Use Dynamic Voltage Scaling to save energy.
• Episode classification based on inter-task communication.– Fast, accurate, no user program modifications required.
• Performance-setting based on episode classification.– Works well with multiprogramming, irregular processor utilization.– Ensures high quality interactive performance.– Significant energy savings (10%-80%).

Krisztián Flautner - [email protected] Monitoring for Interactive performance and Power Reduction 45
Future work
• Evaluate our algorithms on real hardware.– Processors are slowly becoming available.– Impact on interactive performance.
• An API to specify episodes.– Light-weight: specify hints, not complete information.– Works in concert with existing detection mechanism.
• Apply episode detection to other problems.– Scheduler: can real-time deadlines be detected
automatically?

Krisztián Flautner - [email protected] Monitoring for Interactive performance and Power Reduction 46
fin.
Krisztián Flautner - [email protected] Monitoring for Interactive performance and Power Reduction 47
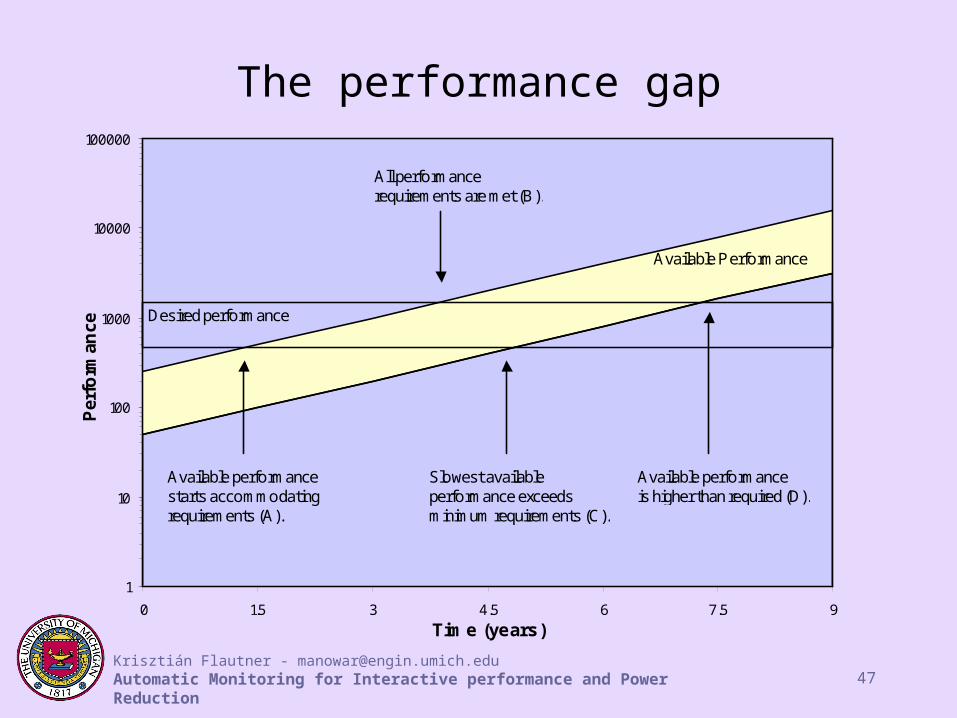
The performance gap
1
10
100
1000
10000
100000
0 1.5 3 4.5 6 7.5 9Time (years)
Per
form
ance
Available performancestarts accommodatingrequirements (A).
Desired performance
Available Performance
All performancerequirements are met (B).
Slowest availableperformance exceedsminimum requirements (C).
Available performanceis higher than required (D).

Krisztián Flautner - [email protected] Monitoring for Interactive performance and Power Reduction 48
Applicability to other environments
Technique exploits information from existing design patterns.
On Linux with X windows:• Communication through sockets, pipes, signals.• Well-known tasks: X server, sound daemon, etc.• Select syscall used for asynchonous I/O.• Use of blocking system calls in dedicated threads.
Other systems:• Adapt to that system’s design patterns and IPC mechanisms.

Krisztián Flautner - [email protected] Monitoring for Interactive performance and Power Reduction 49
Computing the performance factor for interactive episodes
1
PF min
p e rc ep t i o nth re sh o l d
m in i m u m -p e r for m an c eth r es h o ld
P F 1 = P F min
ful l -sp e e d e p is o de d u ra t i o n
p e rc ep t i o n th r es h o ldP F 2 = P F 3 = 1
Pe
rfo
rma
nc
e
Full-speed
fac
tor
episode duration (sec)

Krisztián Flautner - [email protected] Monitoring for Interactive performance and Power Reduction 50
Performance scaling
De
ad
line
Pe
rfor
ma
nce
Pe
rfor
ma
nce
A
B
Time

Krisztián Flautner - [email protected] Monitoring for Interactive performance and Power Reduction 51
Energy-delay (no MP3)
Increase of perceptible interactive episode lengths
Ene
rgy
fact
or

Krisztián Flautner - [email protected] Monitoring for Interactive performance and Power Reduction 52
Energy-delay (MP3)
Increase of perceptible interactive episode lengths
Ene
rgy
fact
or