kraft pulping modeling & control 1 control of batch kraft digesters
Post on 22-Dec-2015
234 views
TRANSCRIPT

1
Kraft PulpingModeling& Control
Control of Batch Kraft Digesters

2
Kraft PulpingModeling& Control
H-factor ControlVroom
• Manipulate time and/or temperature to reach desired kappa endpoint.
• Works well if there are no variations in raw materials or chemicals.
• Manipulate time and/or temperature to reach desired kappa endpoint.
• Works well if there are no variations in raw materials or chemicals.
Kappa orYield
H-factor
15% EA18% EA
20% EA

3
Kraft PulpingModeling& Control
0
5
10
15
20
25
30
0 500 1000 1500 2000 2500
H Factor
Lig
nin
(%
of
Pu
lp)
150°C
160°C
170°C
0
5
10
15
20
25
30
0 500 1000 1500 2000 2500
H Factor
Lig
nin
(%
of
Pu
lp)
150°C
160°C
170°C
H-factor ControlVroom

4
Kraft PulpingModeling& Control
Kappa Batch ControlNoreus et al.
• Control strategy uses empirical model that predicts kappa number from effective alkali concentration of liquor sample at beginning of bulk delignification (~150 ºC).
• Where H is H-factor, EA is effective alkali, K is kappa number, and a are model constants.
• Control strategy uses empirical model that predicts kappa number from effective alkali concentration of liquor sample at beginning of bulk delignification (~150 ºC).
• Where H is H-factor, EA is effective alkali, K is kappa number, and a are model constants.
jn
i
m
j
iij KEAa
H
0 0
1
2000
1500
1000
500
12 14 16 18 20 22 24
K=32
Necessary H-factor for obtaining K = 32 vs. EA concentration in liquor sample
EA
H
5
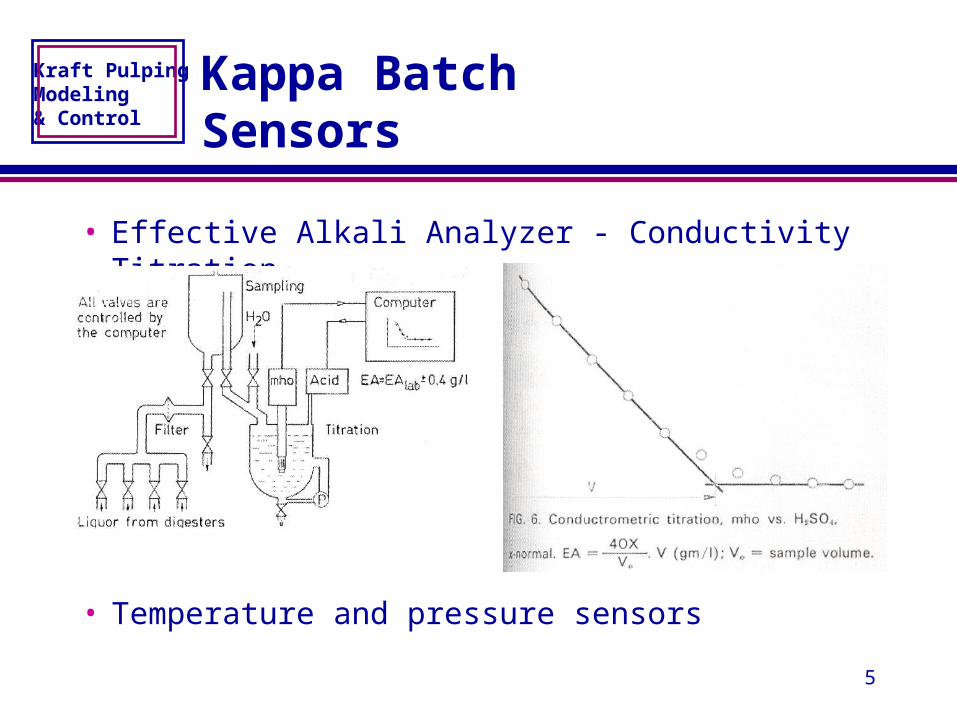
Kraft PulpingModeling& Control
• Effective Alkali Analyzer - Conductivity Titration
• Temperature and pressure sensors
• Effective Alkali Analyzer - Conductivity Titration
• Temperature and pressure sensors
Kappa BatchSensors

6
Kraft PulpingModeling& Control
Kappa BatchLaboratory Tests
• Effective alkali – compared against titration• End of cook kappa to check prediction
• Effective alkali – compared against titration• End of cook kappa to check prediction

7
Kraft PulpingModeling& Control
Kappa BatchDisturbances/Upsets
• Chip Supply» Moisture content, size distribution, chemical content
• Pulping Liquor» White liquor EA and sulfidity
» Black liquor EA and sulfidity
• Digester Temperature Profile» Time to temperature and maximum temperature
• Chip Supply» Moisture content, size distribution, chemical content
• Pulping Liquor» White liquor EA and sulfidity
» Black liquor EA and sulfidity
• Digester Temperature Profile» Time to temperature and maximum temperature

8
Kraft PulpingModeling& Control
Kappa BatchOperations and Objectives
• Operator Setpoint(s)» End of cook kappa number
• Manipulated Variables» Temperature profile
» Cooking time
• Control Objective» Decrease standard deviation in final kappa target.
• Operator Setpoint(s)» End of cook kappa number
• Manipulated Variables» Temperature profile
» Cooking time
• Control Objective» Decrease standard deviation in final kappa target.

9
Kraft PulpingModeling& Control
Kappa BatchMill Results
• Lowered final kappa standard deviation.• Lowered final kappa standard deviation.

10
Kraft PulpingModeling& Control
Kappa BatchControl Benefits
• Bleached Pulp» Lower chemical usage and effluent loading in bleach plant
• Unbleached Pulp» Higher yield
• Bleached Pulp» Lower chemical usage and effluent loading in bleach plant
• Unbleached Pulp» Higher yield
0.00
0.05
0.10
0.15
0.20
0.25
0 10 20 30 40 50 60 70 80
Kappa
Fre
qu
en
cy
Limit Limit
m = 22s = 2.0
m = 25s = 3.5
m = 60s = 2.0
m = 57s = 3.5
Bleached Pulp Unbleached Pulp

11
Kraft PulpingModeling& Control
Batch ControlKerr
• Control strategy uses semi-empirical model that predicts kappa number from effective alkali concentration of liquor sample taken at two points in the bulk delignification phase.
• Where H is H-factor, a2 and b2 are slope and intercept of lignin to EA relationship, a3 and a4 are constants (a3 can incorporate sulfidity and chip properties).
43222 /
ln1
aHaabL
L
b
i
f
L
L

12
Kraft PulpingModeling& Control
Batch ControlKerr

13
Kraft PulpingModeling& Control
Inferential ControlSutinen et al.
• Control techniques use liquor measurements (CLA 2000) for control of final kappa number» EA – conductivity
» Lignin – UV adsorption
» Total dissolved solids – Refractive Index (RI)
• Control techniques use liquor measurements (CLA 2000) for control of final kappa number» EA – conductivity
» Lignin – UV adsorption
» Total dissolved solids – Refractive Index (RI)

14
Kraft PulpingModeling& Control
Inferential ControlSutinen et al.
• Statistical model using Partial Least Squares (PLS) to predict kappa number.» Past batch information used to formulate current control
model.
• Control Strategies» Use PLS model to manipulate cooking time or
temperature to achieve final kappa
• Statistical model using Partial Least Squares (PLS) to predict kappa number.» Past batch information used to formulate current control
model.
• Control Strategies» Use PLS model to manipulate cooking time or
temperature to achieve final kappa

15
Kraft PulpingModeling& Control
Inferential ControlModel Results
• Using model final kappa variation reported to be reduced by 50%.
• Using model final kappa variation reported to be reduced by 50%.

16
Kraft PulpingModeling& Control
Inferential ControlKrishnagopalan et al.
• Statistical model using Partial Least Squares (PLS) to predict kappa number.» Past batch information used to formulate current control model.
• Control Strategies» Direct – Use PLS model to manipulate input vector
» Indirect (adaptive) – Use PLS model to estimate parameters of empirical model for control (e.g., Chari, Vroom)
• Kinetic models developed for lignin, carbohydrates, and viscosity can be used for optimization (e.g., liquor profiling).

17
Kraft PulpingModeling& Control
• Continuous in-situ measurements of liquor EA (conductivity), lignin content (UV), solids content (RI), and sulfide concentration (IC).
• Measurements are also done using near infrared.
• Continuous in-situ measurements of liquor EA (conductivity), lignin content (UV), solids content (RI), and sulfide concentration (IC).
• Measurements are also done using near infrared.
Inferential Batch ControlSensors

18
Kraft PulpingModeling& Control
Inferential Batch ControlOperations and Objectives
• Operator Setpoint(s)» End of cook kappa number
• Manipulated Variables» Midpoint temperature
» Cooking time
• Control Objective» Decrease standard deviation in final kappa target
• Operator Setpoint(s)» End of cook kappa number
• Manipulated Variables» Midpoint temperature
» Cooking time
• Control Objective» Decrease standard deviation in final kappa target

19
Kraft PulpingModeling& Control
Inferential Batch ControlOperations and Objectives
• Model based control adjusts both end time and temperature in optimal fashion.
• Temperature main manipulated variable
• Model based control adjusts both end time and temperature in optimal fashion.
• Temperature main manipulated variable
80
90
100
110
120
130
140
150
160
170
180
0 20 40 60 80 100 120 140 160 180 200
Tim e (m in)
Tem
p (
°C)
80
90
100
110
120
130
140
150
160
170
180
0 20 40 60 80 100 120 140 160 180 200
Tim e (m in)
Tem
p (
°C)

20
Kraft PulpingModeling& Control
Inferential Batch ControlSimulated Results
• Adaptive strategy performs better. Handles non-linearity between manipulated variables and end kappa more efficiently.
• Adaptive strategy performs better. Handles non-linearity between manipulated variables and end kappa more efficiently.