kpi metrics handiguide® - e-janco.com · kpi metrics this section of the book defines the kpi...
TRANSCRIPT


KPI Metrics HandiGuide
© 2020 Copyright Janco Associates, Inc. – ALL RIGHTS RESERVED – www.e-janco.com Page 1
Table of Contents KPI Metrics HandiGuide .............................................................. 6
Introduction ........................................................................... 6 Book Structure ...................................................................... 7
Organizational Responsibilities Internet, Wireless, Electronic Communication, and LANs KPI Metrics Design KPI Metrics KPI Metrics Implementation Data Capture KPI Metrics System Sample Reports
Organizational Responsibilities ................................................. 11 Base Assumptions and Objectives ...................................... 11 Management Process ......................................................... 13 Executive Management ....................................................... 13 General Operations Management ....................................... 13 Individual Managers and Staff Members ............................. 14 Responsibilities ................................................................... 16 Manager, Internet, and IT Resource Group ......................... 17 Manager, Enterprise Operational Group .............................. 17 Steering Committee............................................................. 18 Manager, KPI Metrics .......................................................... 18 Enterprise Managers (Groups, Departments and Divisions) 19 Enterprise Staff Members .................................................... 19 Asset Owners ...................................................................... 19 Support Managers ............................................................... 20 Users .................................................................................. 21 Help Desk ........................................................................... 22 Outside IT Services (Outsourcers) ...................................... 28
Outsourcing KPI Metrics ................................................ 28 Best practices for outsourcing KPI metrics .................... 29 Basic outsourcing metrics .............................................. 31 Responsibilities When Using IT Services ....................... 33 Outside IT Services - Basic Policies .............................. 35
Internet, Wireless (Wi-Fi), Electronic Communication, and LANs37 Electronic Communication Usage Guidelines ...................... 37 Internet ................................................................................ 39 Internet Characteristics ....................................................... 41 Security Concerns ............................................................... 44
Firewalls ........................................................................ 44 Screening Router .......................................................... 45 Dual-Homed Gateway ................................................... 45 Screening Router and Bastion Host ............................... 46 Encryption ..................................................................... 47
Policy and Procedures ........................................................ 48

KPI Metrics HandiGuide
© 2020 Copyright Janco Associates, Inc. – ALL RIGHTS RESERVED – https://www.e-janco.com Page 2
KPI Metrics Process .................................................................. 49 KPI Metrics Design .............................................................. 49 Reporting Audiences ........................................................... 51 Report Groupings ................................................................ 53
Financial ........................................................................ 56 Staffing .......................................................................... 57 Internet - Infrastructure .................................................. 58 Competitive/Comparative .............................................. 59 Productivity .................................................................... 60 System Development .................................................... 61 IT Infrastructure ............................................................. 62 Quality Assurance ......................................................... 63 Help Desk ...................................................................... 64 Computer Operations .................................................... 65 Communications ............................................................ 65 Other - Technology ........................................................ 66 Enterprise/Industry Specific ........................................... 66
KPI Metrics ............................................................................... 68 Report Categories ............................................................... 69 Graphic Data Presentation .................................................. 71 Data Presentation Rules ..................................................... 72 KPI Metrics - IT ................................................................... 74
Financial ........................................................................ 74 Financial (Continued) .................................................... 75 Staffing .......................................................................... 76 Internet - Electronic Infrastructure .................................. 77 Competitive/Comparative .............................................. 78 Productivity .................................................................... 79 System Development .................................................... 80 IT Infrastructure ............................................................. 81 Quality Assurance ......................................................... 82 Help / Service Desk ....................................................... 83 Computer Operations .................................................... 85 Communications ............................................................ 87 Other - Technology ........................................................ 88 Enterprise/Industry Specific ........................................... 89 Enterprise/Industry Specific (cont’d) .............................. 90
KPI Metrics Implementation ...................................................... 94 Metrics Management Loop .................................................. 95 Internet and IT Report Package .......................................... 98 SLA Report Package ......................................................... 100
Data Capture ........................................................................... 101 User Vision of Performance ............................................... 103 Monitors ............................................................................ 103

KPI Metrics HandiGuide
© 2020 Copyright Janco Associates, Inc. – ALL RIGHTS RESERVED – https://www.e-janco.com Page 3
KPI Metrics System ................................................................. 108 Overview ........................................................................... 108 Select KPI Metrics ............................................................. 108 Capture and Record Data for Current Period .................... 109 View Documents ............................................................... 110 Print Reports ..................................................................... 110 System Modifications ........................................................ 111 Technical Naming Conventions ......................................... 111
Sample Report ........................................................................ 113 Report Table of Contents .................................................. 114
Financial ...................................................................... 114 Staffing ........................................................................ 114 Internet - Electronic Infrastructure ................................ 114 Competitive/Comparative ............................................ 114 Productivity .................................................................. 115 System Development .................................................. 115 Reengineering - Office Automation .............................. 115 Quality Assurance ....................................................... 115 Help Desk .................................................................... 115 Computer Operations .................................................. 116 Communications .......................................................... 116 Other ........................................................................... 116 Industry Specific .......................................................... 116
Sample Reports ...................................................................... 117 Key Measures Report ........................................................ 118 Expense Performance Summary ....................................... 120 Expense Variance by Category ......................................... 122 Expense Variance by Cost Center ..................................... 124 Capital Plan Performance ................................................. 126 Project Capital Expenditures ............................................. 128 Billing Allocation ................................................................ 130 System Usage by Customer .............................................. 132 Resource Usage by Customer .......................................... 134 Staff Plan Performance ..................................................... 136 Head Count Summary ....................................................... 138 Staff Turnover Report ........................................................ 140 Protected Classes Summary ............................................. 142 User Penetration Count ..................................................... 144 User Penetration Volume .................................................. 146 E-mail Traffic ..................................................................... 148 Social Networks ................................................................ 150 WEB Statistics ................................................................... 152 Electronic Commerce Sales .............................................. 154 Electronic Commerce Returns ........................................... 156 High Volume Users ........................................................... 158 Low Volume Users ............................................................ 160 Revenue & Capital ............................................................ 162 Expenses & Staffing .......................................................... 164 Competitive Application Matrix .......................................... 166 Technology Penetration Trends ........................................ 168

KPI Metrics HandiGuide
© 2020 Copyright Janco Associates, Inc. – ALL RIGHTS RESERVED – https://www.e-janco.com Page 4
Development Productivity .................................................. 170 Production Support Productivity ........................................ 172 Response Time Report - Report A .................................... 174 Response Time Report - Report B .................................... 176 Service Request Backlog .................................................. 178 Project Status Report ........................................................ 180 Service Request Aging ...................................................... 182 Service Request Closure Priority 1 .................................... 184 Service Request Closure Priority 2 and 3 .......................... 186 Conversion Status ............................................................. 188 Reengineered Service Performance .................................. 190 Work From Home Workers ................................................ 192 Work From Home Productivity ........................................... 194 E-Mail Usage..................................................................... 196 Voice Mail Usage .............................................................. 198 Project Status Report - Reengineering .............................. 200 Test Results by Release ................................................... 202 Release Test Comparison (Special) .................................. 204 Customer Satisfaction ....................................................... 206 Quality Improvement Program ........................................... 208 Work Load Summary ......................................................... 210 Quick Incidents .................................................................. 212 Problem Notification Analysis ............................................ 214 Problem Notification by Priority ......................................... 216 Problem Notification by Category ...................................... 218 Problem Closure Statistics ................................................ 220 Installation Repair Management ........................................ 222 Computer Capacity ........................................................... 224 Combined Computer Work Load ....................................... 226 On-Line Performance Summary ........................................ 228 E-Mail and EDI Traffic ....................................................... 230 Computer Outages ............................................................ 232 Batch Processing Performance ......................................... 234 Billing & Report Distribution Performance .......................... 236 Charge Back Details.......................................................... 238 Network Outages .............................................................. 240 Electronic Commerce ........................................................ 242 Switch Performance Report ............................................... 244 Voice Mail Performance .................................................... 246 Workstation Analysis ......................................................... 248 LAN Analysis ..................................................................... 250 Usage Analysis ................................................................. 252 Distribution ........................................................................ 254 Education .......................................................................... 256 Entertainment .................................................................... 258 Financial Service ............................................................... 260 Government ...................................................................... 262 Hospitality ......................................................................... 264 Insurance .......................................................................... 266 Manufacturing ................................................................... 268 Medical.............................................................................. 270

KPI Metrics HandiGuide
© 2020 Copyright Janco Associates, Inc. – ALL RIGHTS RESERVED – https://www.e-janco.com Page 5
Real Estate ....................................................................... 272 Retail ................................................................................. 274
KPI Metrics for Internet, Customers and Social Networks ....... 278 Internet and Social Networks KPIs .................................... 278 KPIs & Metrics for Customers ........................................... 280 Customer Satisfaction KPIs ............................................... 282
Attached Job Descriptions ....................................................... 283 Chief Digital Officer Chief Experience Officer Digital Brand Manager Manager Metrics Manager KPI Metrics Manager Service Level Reporting Key Performance Indicator Analyst SEO Specialist
Version History ........................................................................ 284

KPI Metrics HandiGuide
© 2020 Copyright Janco Associates, Inc. – ALL RIGHTS RESERVED – https://www.e-janco.com Page 6
KPI Metrics HandiGuide
Introduction
Historical Perspective Over the last few decades, the working world has been inundated with computers, social media, and new technologies. Few people have understood them but everyone has needed them. Since the cost of this technology was and remains high, many attempts have been made to create meaningful measures and metrics. Most have failed in their primary objective -- to show the value and efficiencies of the application of these technologies in the enterprise. This has resulted in a total lack of consistent operational and performance measures. Traditionalists have tried to measure the efficiency of computer equipment, communications equipment, and the processing of data. Management has continued to ask how a percentage of utilization on a computer will impact customer service or the bottom line. Earlier incarnations of metrics were called Critical Success Factors (CSFs). Today the term of Key Performance Indicators (KPIs) is in vogue. Some examples of KPIs and their drivers are:
KPI / Metric Driver
Click-throughs to the web site
Tweets, blogs published - social networking interactions
Customer feedback score Customer outreach calls, meetings, and social media interactions
Days of marketing interactions
Inaction with the web site and social media
Web site conversion rates Time to respond to web site inquiries
Size of the customer contact database
Value-added of web and social media contacts
By monitoring KPIs, you are ensuring that the daily activities necessary to support your company’s goals and ultimate success are being carried out. You may, of course, discover that there is a weak correlation between your company’s KPIs and KPIs. That can be a good thing, as it will prompt you to identify different KPIs, and it could prompt your firm to change the activities it emphasizes. Imagine going to south Florida after a hurricane and seeing all the roofs that blew off. A comment that new building codes are required would be expected but is not adequate. That response did not help when the hurricane was there. The

KPI Metrics HandiGuide
© 2020 Copyright Janco Associates, Inc. – ALL RIGHTS RESERVED – https://www.e-janco.com Page 7
same is true for after the fact reporting of KPI performance. It is management by “rearview mirror”. What we have is a high-cost operation with no generally accepted performance standards for its operation. In the manufacturing world that is like saying that we have a product that has high raw material and labor cost and we do not know on a day-to-day basis how efficiently and effectively the factory is running. Thus the need to measure and have valid metrics is an area of great focus. The need to measure is based on management’s requirement to understand the value received. At the same time, they need to balance the risks. Value can be in traditional financial or social returns of strategic parity between the enterprise and technology, or parity between the enterprise and its competitors through technology. This then is often balanced against risks the technology brings including the risk of failures due to the technology implementation, operation, or existence in the light of the enterprise’s strategic and tactical needs. As with any mature industry and function, the Internet, Information Technology, Information Systems, Communication, and traditional Data Processing (referred to as IT throughout this book) require metrics that are meaningful and manageable. In this book, we present a view of measures and metrics that we have helped many organizations implement over the last several years. What is presented is a collection of measures that we have found to be the best. We have designed our metrics and reports in a way that most non-technologists can understand them -- graphically.
Book Structure The book is divided into several major sections. The first few are an overview of the book and a management summary that can be used by the reader as a guide of what to measure and why. The next sections of the book are a detailed presentation of measures and reports that effectively communicate the value and effort associated with the IT function. The final section provides the reader with examples of the metrics and reports discussed throughout the book.
Organizational Responsibilities Before any design, much less implementation, of metrics can be successful the organizational needs and responsibilities need to be well understood. In this section, we will present one point of view of the organizational responsibilities that need to be defined before a successful process can proceed.
Internet, Wireless, Electronic Communication, and LANs As the use of IT has spread, so has the use of workstation-based forms of information exchange. Such electronic communication may take the form of wireless e-mails handheld devices or notes sent to and received from users (e-mail), notices posted to a central location for all users to read (Internet or Intranet), or software used jointly by each member of a workgroup to organize time and work projects (groupware). This section provides a brief overview of what this technology encompasses.

KPI Metrics HandiGuide
© 2020 Copyright Janco Associates, Inc. – ALL RIGHTS RESERVED – https://www.e-janco.com Page 8
KPI Metrics Design The real measure of any reporting package is how senior management and the customers view its value. One of the first steps in providing the necessary value is to make sure everything that is measured and reported ties IT to traditional business performance statistics and customer service metrics. Presented in this section are metrics that we have classified into the following groups:
Financial Staffing Internet - Electronic Infrastructure Competitive/Comparative Productivity System Development Reengineering - Office Automation1 Quality Assurance Help Desk Computer Operations Communications Other - Technology Enterprise/Industry Specific
For each of these areas, there is a discussion of metrics and how they can be measured. As you can appreciate, this cannot be an all-inclusive list but it should be a definitive statement of what types of metrics can and should be used.
KPI Metrics This section of the book defines the KPI Metrics discussed in the management overview. The metrics are classified by category and report. Actual report examples are presented in the last chapter of the book. This section of the book can be used by the reader to structure his/her own monthly and annual reporting package. Included is a discussion of data presentation techniques and rules to be followed that we have found to be the most effective with management and user groups. Suffice it to say that graphics are the most easily understood and misused tool in most organizations. Using the sample reports presented in this book the reader will be able to cut to the heart of the necessary metrics. As a note of caution, we advise the reader to frequently re-evaluate the value of every metric used. One of the most common faults in place in many reporting systems is the continued gathering of unneeded information. Here is an example of one such case.
1 Since Reengineering and downsizing is so prevalent in industry we have included one set of reengineering metrics that we have helped to implement
in the area of office automation. These can be used as a model for other areas.
KPI Metrics HandiGuide
© 2020 Copyright Janco Associates, Inc. – ALL RIGHTS RESERVED – https://www.e-janco.com Page 9
In the course of an operational improvement project, we discovered a reporting department of 210 people in a large publicly traded corporation. In a review of the reports that the department produced we quickly discovered that they were gathering and controlling information on some very specific operating results. The accuracy of their information was without question excellent. The problem was other reporting systems came up with the same information with nowhere near the overhead associated with obtaining the same information.
Quickly we restructured how the information was collected. We are very proud that we were able to eliminate all but one employee out of the reporting department - a staff reduction of 209 people. The CEO of the company asked us why we had to retain a single individual. We told him it was to produce a particular report that he had requested to have for his monthly operations meeting.
The CEO sat back and said that the information was not worth enough to justify the salary of a single employee.
The bottom line is to always re-evaluate the cost of your reporting systems and metrics versus the benefit received.
KPI Metrics Implementation This section of the book provides the reader with an implementation plan with key rules that should be followed to integrate metrics and Service Level Agreements (SLAs) into his or her enterprise. One of the tenets that we continue to follow is that whatever we measure will change. Therefore, we need to be able to implement new metrics and SLAs quickly and effectively. Another example of this is a company that grew from nothing to a multi-billion-dollar enterprise in less than five years.
As the company started its growth, it was very capital intensive. All the efforts of management were focused on jumping into new markets as they opened and providing the necessary customer service to preclude competitors from investing in the same markets. Within seven years the industry was saturated and the company had to look at how to maximize the revenue that it was getting from its customers.
As you can appreciate, the SLAs and metrics to measure the growth of the business evolved rapidly over ten years. The IT function had to adapt the service it was providing to its changing business. They implemented an excellent metrics program not just for IT but for the entire company based on the concepts discussed here. It is interesting to note that the top information systems executive has remained with this company the entire time. Were the metrics the cause or the effect?

KPI Metrics HandiGuide
© 2020 Copyright Janco Associates, Inc. – ALL RIGHTS RESERVED – https://www.e-janco.com Page 10
Data Capture A discussion of a user’s vision of performance is presented in this section. Included is a discussion of various types of tools that can be used to help accomplish this. Features and functions of how to measure service as perceived by the user are discussed in detail.
KPI Metrics System The KPI Metrics System and how it can be modified is shown here. This can be used as a model for the creation of a system to produce all the metrics and reports discussed in this book.
Sample Reports This section of the book will provide actual examples of the reports. Each of the reports will be depicted as they print using Janco’s Metrics HandiGuide® software.
Appendix The appendix contains supporting materials.

KPI Metrics HandiGuide
© 2020 Copyright Janco Associates, Inc. – ALL RIGHTS RESERVED – https://www.e-janco.com Page 11
Organizational Responsibilities A common concern in many enterprise-wide operational management approaches is needed to maximize value while protecting technological resources (including PCs and work-stations) and assuring their availability to support all enterprise functions. The purpose of this HandiGuide is to provide an enterprise with the tools to effectively and efficiently measure all of the capital and information resources associated with technology. This includes both the operations and development of applications in the enterprise. All elements of the enterprise’s management metric process should be structured to maximize the value of operational results achieved versus a statement of what is being done. This includes:
Assessing the value of the resource; Understanding if the resource is being utilized cost-effectively; Maintaining a balance between needs wants and what is achievable;
and Communicating a balanced report card on the way the technology is
helping achieve the enterprise’s strategic objectives.
Base Assumptions and Objectives There are several base assumptions associated with the operational management of the technology environment which were used in the creation of this HandiGuide:
Integrated management with the enterprise’s business functions of all technology components including operational management is necessary. Each of these components must be considered from a total-system perspective (i.e., the cost-effective use and protection of information must be considered from its origination to its final destruction, to include all processes affecting the information).
Operational management of the IT resources requires extensive policies, responsibility assignments, and procedures to provide the necessary operational framework and infrastructure.
Operational management complies with the intent of prevailing legislation.
Operational management requires documentation, justification, and administrative controls which are cost-effective, prudent, and operationally efficient.
Good operational management requires monitoring the implementation of selected metrics, controls, and procedures. This includes the definition of the functions necessary to ensure compliance with the state.
Operational management guidelines, as presented in this book, should be considered as the minimum standard for
all processing and supporting KPI Metrics activities.

KPI Metrics HandiGuide
© 2020 Copyright Janco Associates, Inc. – ALL RIGHTS RESERVED – https://www.e-janco.com Page 16
Responsibilities The embedding of computers into virtually every enterprise function and process dictates that Internet and IT operations cannot be viewed as a minor technical matter falling under the exclusive purview of the operations management community. On the contrary, the vital functions of the computers and the potential impact upon the enterprise of system shortcomings make Internet and IT (including PDA6, PC, LAN, and Work Station) operations a serious concern of all levels of enterprise management. The objective of an enterprise Internet and IT management process is to achieve an effective and cost-beneficial operating posture for the enterprise’s Internet and IT environment. Attainment of this objective requires a balanced combination of problem recognition, resource allocation, and policy focus to implement an effective program.
Figure 2 - Organizational Responsibilities
6 Personal Digital Assistant.

KPI Metrics HandiGuide
© 2020 Copyright Janco Associates, Inc. – ALL RIGHTS RESERVED – https://www.e-janco.com Page 20
The same Responsibility Matrix applies to Internet Technology. However in many organizations that responsibility is assigned to the various operational groups. In those cases, a “centralized” group often sets policy and standards that the operational groups will follow.
Figure 3 - Responsibility Matrix
Support Managers The Support Manager is the manager responsible for the operating integrity of a system. This manager must be of vice president or general manager level or above. The individual is responsible for requesting appropriate establishment or modification of the access control restrictions8 for an IT resource. This request requires the approval of the owner of that resource.
8 See the Security Manual Template at www.e-janco.com/Security.htm

KPI Metrics HandiGuide
© 2020 Copyright Janco Associates, Inc. – ALL RIGHTS RESERVED – https://www.e-janco.com Page 49
KPI Metrics Process
KPI Metrics Design Many organizations do not have a good mechanism for reporting on the value of the IT function. Typically, the reporting that exists in either of traditional financial accounting measures, which are bogged down in cost distribution, or detail technical data that shows the efficiency of the usage of the computer hardware. Neither of these approaches addresses the value added by technologists. A good KPI Metric and reporting process should meet the needs of several different audiences. This includes senior enterprise management, IT management, internal customers, and external customers. At the same time, it must help the enterprise achieve its business strategy while providing positive and negative feedback to the IT staff.
Figure 14 - Process Overview
In the course of developing a management reporting process for the IT function, these are three issues that need to be understood before idea one is put on paper. First and foremost is to understand what works well for one company, in one industry, may not work well for another company, in the same industry down the street. Corporate culture does play an important part in the process. Therefore, anything that we present here must be applied to an enterprise with its culture in mind.

KPI Metrics HandiGuide
© 2020 Copyright Janco Associates, Inc. – ALL RIGHTS RESERVED – https://www.e-janco.com Page 56
Financial The financial reports are typically reported on a month-to-month basis. For the sake of presentation, we prefer to show thirteen months. In this way, the metric report provides traditional year-to-date information and comparison of the same month this year and last year.
Technology Senior
Management
Technology Operating Group
Management
Enterprise Senior
Management
Enterprise Operating Group
Management
Key Measures Report Yes Yes Yes Yes
Expense Summary Yes Groups Part-Year Optional
Expense Variance by Category Yes Groups Part-Year Optional
Expense Variance by Cost Center
Yes Groups Part-Year Optional
Capital Plan Performance Yes Groups Yes Optional
Project Capital Expenditures Yes Groups Optional Yes
Billing Allocation Yes Groups Yes Yes
System Usage by Customer Yes Groups Yes Optional
Resource Usage by Customer Yes Groups Optional Optional
KPI Metrics HandiGuide
© 2020 Copyright Janco Associates, Inc. – ALL RIGHTS RESERVED – https://www.e-janco.com Page 118
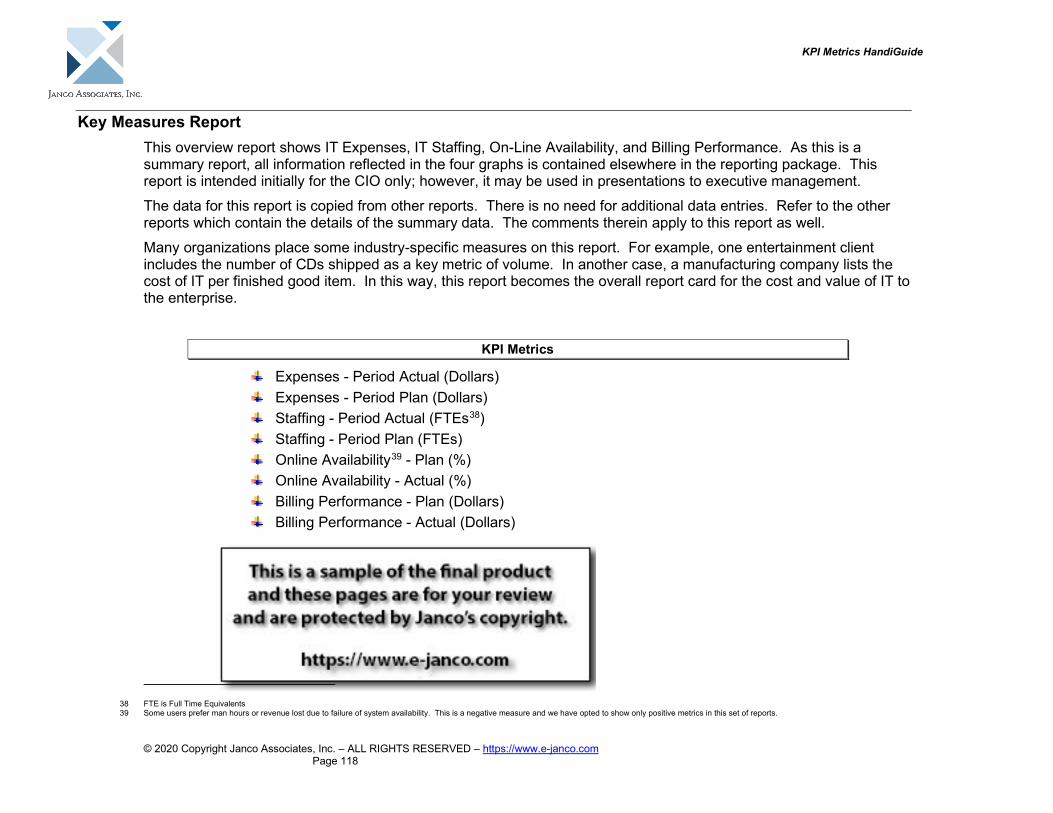
Key Measures Report This overview report shows IT Expenses, IT Staffing, On-Line Availability, and Billing Performance. As this is a summary report, all information reflected in the four graphs is contained elsewhere in the reporting package. This report is intended initially for the CIO only; however, it may be used in presentations to executive management. The data for this report is copied from other reports. There is no need for additional data entries. Refer to the other reports which contain the details of the summary data. The comments therein apply to this report as well. Many organizations place some industry-specific measures on this report. For example, one entertainment client includes the number of CDs shipped as a key metric of volume. In another case, a manufacturing company lists the cost of IT per finished good item. In this way, this report becomes the overall report card for the cost and value of IT to the enterprise.
KPI Metrics
Expenses - Period Actual (Dollars) Expenses - Period Plan (Dollars) Staffing - Period Actual (FTEs38) Staffing - Period Plan (FTEs) Online Availability39 - Plan (%) Online Availability - Actual (%) Billing Performance - Plan (Dollars) Billing Performance - Actual (Dollars)
38 FTE is Full Time Equivalents 39 Some users prefer man hours or revenue lost due to failure of system availability. This is a negative measure and we have opted to show only positive metrics in this set of reports.

KPI Metrics HandiGuide
© 2020 Copyright Janco Associates, Inc. – ALL RIGHTS RESERVED – https://www.e-janco.com Page 119
Key Measures Report
Discussion
This is example discussion text being typed into the discussion box. It should be small enough to fit in the box, but large enough to read. There should be sufficient space between the text and the border.
Expenses
Jan Feb Mar Apr May Jun Jul Aug Sep Oct Nov Dec Jan0
1,000
1,500
2,000
2,500
3,000
3,500
Thou
sand
s
4,000
4,500
5,000
5,500
PlanActual
Staffing
Jan Feb Mar Apr May Jun Jul Aug Sep Oct Nov Dec Jan 50
100
150
200
250
300
350
No.
of E
mpl
oyee
s
400
450
500
550
PlanActual
Billing Performance
Jan Feb Mar Apr May Jun Jul Aug Sep Oct Nov Dec Jan
PlanActual
% B
illed
on
Tim
e
92%
93%
94%
95%
96%
97%
98%
99%
100%
101%
102%On-Line Availability
90%
Perc
ent
92%
91%
93%
94%
95%
96%
97%
98%
99%
100%
Jan Feb Mar Apr May Jun Jul Aug Sep Oct Nov Dec Jan
Actual Plan PlanActual
Prime Shift All Day

KPI Metrics HandiGuide
© 2020 Copyright Janco Associates, Inc. – ALL RIGHTS RESERVED – https://www.e-janco.com Page 278
KPI Metrics for Internet, Customers and Social Networks
Internet and Social Networks KPIs • Average Number of Referrals Per User - A higher number of referrals per user is likely to
lead to more sales, increasing the profitability of each customer. Formula: (Number of Referrals) / (Number of Users) = (Average Number of Referrals per User)
• Bounce Rate - Measures the number of visitors that access a page on a company website and leave before visiting any other pages.
• Click-Through Rate - Monitors how many people click on links in an email. This is a good way to gauge the success of an email campaign and the quality of an email's content.
• Client Attendance - Counts the number of people who attend a client event. It could be measured as a percentage of a specific attendance target or the total client base.
• Contact Volume by Channel - Keeps track of the number of support requests by phone and email. This allows the organization to not only compare which method customers prefer but also to track the number of support requests month-to-month.
• Customer Complaints - Helps companies determine whether innovations are effective in improving the customer experience with their product.
• Direct Traffic - Traffic to a company's website that occurs from visitors typing in the URL directly (i.e. actively seeking it out).
• Indirect Traffic - Measures website traffic that stems from indirect sources, such as clickable email campaigns or referral links
• LinkBack Court - Number of backlinks to a web page or web site
• Number of Reads of Company Blog Articles - Helps companies determine whether visitors are finding their content useful and which content performs better than others.
• The number of Social Media Followers - Indicates the level of customer engagement a brand has.
• The number of Support Requests per Product - Allows a company to determine which products their customers find easier (and harder) to use.
• Open Rate - Tracking the number of opened and unopened emails allows companies to evaluate whether an email campaign strategy is successful or not.
• Rank on Search Engines - Can indicate whether a search engine optimization (SEO) process is effective.
• Rate of Referrals - Can help illustrate customers' level of satisfaction with a product or service. Formula: (Number of Referrals in Period) / (Units of Time in Period) = (Rate of Referrals)
• Redemption Rate -Provides companies with vital consumer behavior information. Formula: (Reward Points Redeemed) / (Reward Points Offered) = (Redemption Rate)
• Repeat Customer Rate - Indicates whether a product or service inspires repeat purchases from customers. Formula: (Customers That Have Purchased More Than Once) / (Unique Customers) = (Repeat Customer Rate)

KPI Metrics HandiGuide
© 2020 Copyright Janco Associates, Inc. – ALL RIGHTS RESERVED – https://www.e-janco.com Page 283
Attached Job Descriptions Attached in their own directory are eight (8) complete job descriptions. Each uses long file names and is in MS Word format
Chief Digital Officer
Chief Experience Officer
Digital Brand Manager
Manager Metrics
Manager KPI Metrics
Manager Service Level Reporting
Key Performance Indicator Analyst
SEO Specialist

KPI Metrics HandiGuide
© 2020 Copyright Janco Associates, Inc. – ALL RIGHTS RESERVED – https://www.e-janco.com Page 284
Version History
Version 6.1 Added KPI metrics for Work From Home (WFH) staff Updated sample KPI Metrics Attached all Job Descriptions as individual files Updated attached Job Descriptions Added New Job Descriptions o Chief Digital Officer o Chief Experience Officer o Digital Brand Manager o Manager Metrics o Manager Service Level Reporting o SEO Specialist
Version 6.0 Updated to reflect the impact of KPI and CSF on metrics for 2020 Updated all sample metric charts Added specific KPI metrics for Internet, social networks, and
customers Added job description for Manager KPI Metrics Added job description for KPI Analyst
Version 5.0 Updated to meet the latest compliance requirements Updated for mobility metrics Added social media metrics Added BYOD metrics Added security and compliance metrics
Version 4.0 Added section on Outsourcing Metrics Updated style sheet Correct minor errata

KPI Metrics HandiGuide
© 2020 Copyright Janco Associates, Inc. – ALL RIGHTS RESERVED – https://www.e-janco.com Page 285
Version 3.1 Sample reports reviewed and modified to comply with ITIL and IT
Service Management Service Management and Help Desk Section Updated to comply with
ITIL and IT Service Management Graphics Updated Glossary Updated
Version 3.0 Sample reports reviewed and modified to comply with Sarbanes-
Oxley Sample reports presented in landscape format