kotak mf booklet1
TRANSCRIPT

FUNDS IN FOCUS
JULY 2018

TH
EPAG
EH
AS
BEEN
LEFT
INTEN
TIO
NALL
YBLA
NK

EQUITY FUNDS: . . . . . . . . . . . . . . . . . . . . . . . . . . . . . . . . . . . . . . . . . . . . . . . . . . . . . . . . . . . . . . . . . . . . 1
HYBRID FUNDS: . . . . . . . . . . . . . . . . . . . . . . . . . . . . . . . . . . . . . . . . . . . . . . . . . . . . . . . . . . . . . . . . . . . 12
THEMATIC FUNDS: . . . . . . . . . . . . . . . . . . . . . . . . . . . . . . . . . . . . . . . . . . . . . . . . . . . . . . . . . . . . . . . . . 17
DEBT FUNDS: . . . . . . . . . . . . . . . . . . . . . . . . . . . . . . . . . . . . . . . . . . . . . . . . . . . . . . . . . . . . . . . . . . . . . 20
Kotak India EQ Contra Fund . . . . . . . . . . . . . . . . . . . . . . . . . . . . . . . . . . . . . . . . . . . . . . . . . . . . . . . . . . 2
Kotak Tax Saver Fund . . . . . . . . . . . . . . . . . . . . . . . . . . . . . . . . . . . . . . . . . . . . . . . . . . . . . . . . . . . . . . . 4
Kotak Standard Multicap Fund . . . . . . . . . . . . . . . . . . . . . . . . . . . . . . . . . . . . . . . . . . . . . . . . . . . . . . . . 6
Kotak Equity Opportunities Fund. . . . . . . . . . . . . . . . . . . . . . . . . . . . . . . . . . . . . . . . . . . . . . . . . . . . . . 8
Kotak Emerging Equity Fund . . . . . . . . . . . . . . . . . . . . . . . . . . . . . . . . . . . . . . . . . . . . . . . . . . . . . . . . 10
Kotak Equity Hybrid Fund . . . . . . . . . . . . . . . . . . . . . . . . . . . . . . . . . . . . . . . . . . . . . . . . . . . . . . . . . . . 13
Kotak Equity Savings Fund . . . . . . . . . . . . . . . . . . . . . . . . . . . . . . . . . . . . . . . . . . . . . . . . . . . . . . . . . . 15
Kotak Infrastructure & Economic Reform Fund . . . . . . . . . . . . . . . . . . . . . . . . . . . . . . . . . . . . . . . . . . 18
Kotak Low Duration Fund . . . . . . . . . . . . . . . . . . . . . . . . . . . . . . . . . . . . . . . . . . . . . . . . . . . . . . . . . . . 21
Kotak Credit Risk Fund . . . . . . . . . . . . . . . . . . . . . . . . . . . . . . . . . . . . . . . . . . . . . . . . . . . . . . . . . . . . . 23
Kotak Medium Term Fund . . . . . . . . . . . . . . . . . . . . . . . . . . . . . . . . . . . . . . . . . . . . . . . . . . . . . . . . . . . 25
Kotak Bond Short Term Fund . . . . . . . . . . . . . . . . . . . . . . . . . . . . . . . . . . . . . . . . . . . . . . . . . . . . . . . . 27
JULY
2018
Classic Equity
Select Focus
Opp
Balance
Income Opp

EQUITY FUNDS

About Kotak India EQ Contra Fund
�
�
�
Kotak Classic Equity is an open - ended equity growth scheme. The investment objective of the scheme is to
generate capital appreciation from a diversified portfolio of equity and equity related securities.
An open-ended diversified equity scheme with a focus on large caps.
Market capitalization bias:(a) Largecap focused with normal allocation between 70%-90% and (b) Midcap
allocation between 10%-30%.
Portfolio Action
• The fund has an overweight position in Media, Metals, Tech and Consumers while it is underweight in Pharma andBFSI.
• The metals call in CY 2016 and the Tech call in CY 2017 have immensely benefitted the fund.
• We continue to be underweight on corporate lenders and PSU banks and that hurts the fund whenever there is a rallyin these stocks.
• Some weight was added to the cement sector in the month of June where we have been almost absent.
Kotak India EQ Contra Fund
Scheme Facts
Structure
Launch Date
Benchmark
Min. Initial Inv.
Additional Inv.
Standard Deviation^
Beta^
Sharpe^
Month end AUM* (as on 31st July )
Monthly Average AUM*
NAV (as on 2018)
2018
31st July
An open ended equity Scheme followingcontrarian investment strategy
496.33 crs
461.91 crs
Direct Dividend 23.6040
Direct Growth 56.2050
Dividend 21.3470
Growth 52.3690
27th July 2005
Nifty 100 TRI
5000
1000 & in multiples of 1
13.30%
0.93
0.49
*Source: MFI Explorer.
^ as on 31st July, 2018. Source: ICRA
`
`
`
`
`
`
`
`
`
MFIExplorer.
Portfolio Turnover
53.73%
Market Cap %$
Load Structure
Large cap 81.28
Midcap 12.20
Small cap 1.13
Cash 5.39
$The given market cap data is on the basis of newSEBI circular on scheme rationalisation whereinStocks are categorised as per given AMFI list.
Source: MFI Explorer. Market definition used ismarket capitalisation of the 100th largest scrip (onthe bases of market capitalisation) is the cutoff todetermine the large cap and midcap segment.
NilEntry Load:
Exit Load:
I) For redemptions / switch outs (including SIP/STP)within 1 year from the date of allotment of units,irrespective of the amount of investment:1%
ii) For redemptions / switch outs (including SIP/STP)after 1 year from the date of allotment of units,irrespective of the amount of investment: NIL
Any exit load charged (net off Service Tax, if any) shallbe credited back to the respective Scheme. Unitsissued on reinvestment of dividends shall not besubject to entry and exit load.
31 July, 2018st
Top 10 Sectors as on 31st July, 2018
Sector % Weight Underweight / Previous Changeoverweight
against (Portfolio % from previousbenchmark Weight) month
Month in portfolioPortfolio Benchmark
(Nifty 100)
Financial Services
Consumer Goods
Information Technology
Automobile
Energy
Cash & Cash Equivalent
Others
Construction
Metals
Pharma
20.17 34.42 -14.25 21.17 -1.00
19.72 13.36 6.37 16.32 3.40
15.90 11.61 4.28 14.22 1.68
10.41 8.96 1.45 12.30 -1.89
8.93 13.49 -4.56 7.91 1.01
5.43 0.00 5.43 7.24 -1.81
4.47 0.00 4.47 5.79 -1.33
4.18 3.26 0.92 4.65 -0.46
3.61 4.00 -0.39 4.14 -0.53
1.98 3.66 -1.69 2.03 -0.05
Equity Market Brief
• GST – landmark reform is now implemented, and over the last few months, the government has introduced further changes to
help the smaller firms navigate GST better. While there might be some near-term issues in implementing, the longer term
benefits are transformative. Most listed players will benefit, as they form the organised part of the economy, especially once
the e-way bill is introduced in totality and the reverse charge mechanism reduces scope of under-invoicing by unorganised
sector.
• After a prolonged period of under-delivery of Corporate Earnings, earnings are starting to improve across a broad spectrum of
sectors. Barring corporate banks and US focused pharma, most other sectors are witnessing improving business momentum.
• India to benefit from such reforms which encourages formalisation of the economy in the medium-to-long-term, significant
flow from physical to financial savings to further provide stability to markets.
• Volatility across global equities have been on the lower side in 2017. Volatility is on the rise recently due to global events - Fed
hiking, crude oil price rally, trade wars like the flare-up between US and China. In India as well, as we approach general
elections, markets are likely to turn more volatile.
• As we approach general elections, it is important to understand that all events create a level of uncertainty. While near-term
uncertainty induces volatility in asset prices, in the long run, wealth creation in equities is a function as how businesses can
profitably grow over their cost of capital sustainably. Given the long-range of reforms introduced, we believe longer-term
prospects of Indian equities is quite encouraging and we would advise investors to benefit from such induced volatility.
• Time in the market more important than timing the market – after a long period of lower volatility, markets volatility may move
up and investors can benefit from this volatility by focusing on disciplined investing and asset allocation.
(Formerly Known As Kotak Classic Equity)
2

Kotak India EQ Contra Fund31 July, 2018st
About Kotak Mutual Fund
Kotak Mahindra Asset Management
Company Limited (KMAMC) is a wholly
owned subsidiary of Kotak Mahindra Bank
Limited (KMBL). KMBL has over two decades
of experience in financial services. KMBL has a
market capitalization of 2490.915 bn as on
31st July, 2018). KMAMC is the Asset
Manager for Kotak Mahindra Mutual Fund
(KMMF). It started operations in December
1998. KMMF offers schemes catering to
investors with varying risk - return profiles and
was the first fund house in the country to
launch a dedicated gilt scheme. KMAMC
manages assets worth 1,29,948.48 cr as on
31st July 2018.
`
`
* The numbers are converted using the Rupee-
USD reference rate published by the Reserve
Bank of India as on the respective dates.
To know more
Call : 1800-222-626 (Toll Free), Mumbai61152100, Delhi 66306900 / 02, Chennai28221333 / 45038171, Kolkata 64509802 /03, Pune 64013395 / 96, Ahmedabad26779888, Bangalore 66128050 / 51,Hyderabad 66178140 / 41.
Visit - assetmanagement.kotak.com
Email - [email protected]
Disclaimer
Kotak Classic Equity
Investment Objective:
Mutual Fund investments are subject to marketrisks, read all scheme related documentscarefully. Scheme Information Document (SID)and Statement of Additional Information (SAI)available on mutualfund.kotak.com
.To generate capital
appreciation from a diversified portfolio of equityand equity related securities.
An open ended equityScheme following contrarian investment strategy
Kotak India EQ Contra Fund* Performance (%) as on 31st July, 2018
Different plans have different expense structure. The performance details provided herein are of regular plan.
^Past performance may or may not be sustained in future.*All payouts during the period have been reinvested in the units of thescheme at the then prevailing NAV. Returns > = 1 year: CAGR (Compounded Annualised Growth Rate). N.A stands for data notavailable. Note: Point to Point (PTP) Returns in INR shows the value of 10,000/- investment made at inception. Source: ICRA MFIExplorer. # Name of Scheme Benchmark. ## Name of Additional Benchmark. Please refer page no. 29 for top 3 and bottom 3schemes managed by Mr.
`
Deepak Gupta.
*TRI – Total Return Index
With effect from 1st February 2018, we are comparing the performances of the funds with the total return variant of the benchmarkinstead of the price return variant.
^^Kotak Classic Equity is renamed as Kotak India EQ Contra Fund with effect from 1st June 2018.
Date SchemeReturns of 10000 in the
Scheme ( ) Benchmark# ( ) Benchmark ## ( )
Nifty 100 Nifty 50 Current Value of Standard Investment
(%) ^ # (%)* ## (%)* Additional
`
` `
Kotak India EQ Contra Fund^^
Since Inception 13.56 14.78 14.40 52,369 60,146 57,637
Last 1 Year 16.56 13.14 14.20 11,656 11,314 11,420
Last 3 Years 12.54 11.88 11.42 14,257 14,010 13,834
Last 5 Years 18.58 17.16 16.03 23,455 22,083 21,038
Scheme Inception date is 27/07/2005. Mr. Deepak Gupta has been managing the fund since 01/01/2017.
TRI TRI
`
This product is suitable for investors who are seeking*:
• Long term capital growth
• Investment in portfolio of predominantly equity &equity related securities
* Investors should consult their financial advisors if in doubtabout whether the product is suitable for them.
Investors understand that their principal willbe at moderately high risk
Riskometer
M
oderately Moderate
Low
Hig
h
Low
High
LOW HIGH
Moderately
Mar-23-18 23.714 4.78
Jul-28-17 23.433 0.70
Jul-15-16 19.692 0.50
Jul-25-14 18.227 1.00
Jan-23-14 19.202 4.30
Jul-31-12 15.413 1.00
Nov-20-15 18.540 0.50
Dividend History
Date CUM DividendNAV
Dividend( per unit)`
Top 10 Companies as on , 201831st July
(Formerly Known As Kotak Classic Equity)
Reliance Industries Ltd. Petroleum Products 5.98%
Infosys Ltd. Software 5.22%
Maruti Suzuki India Limited Auto 4.39%
Hindustan Unilever Ltd. Consumer Non Durables 4.33%
Tata Consultancy Services Ltd. Software 4.31%
Bharat Financial Inclusion Limited Finance 3.98%
ITC Ltd. Consumer Non Durables 3.88%
Titan Company Ltd. Consumer Durables 3.64%
Bajaj Finance Limited Finance 3.56%
Mahindra & Mahindra Ltd. Auto 3.44%
3

About Kotak Tax Saver
�
�
�
�
The investment objective of Kotak Tax Saver is to generate long term capital appreciation from a diversified
portfolio of equity and equity related securities and enable investors to avail the income tax rebate, as
permitted from time to time.
The scheme thus offers a dual benefit of growth and tax savings.
The scheme although open ended, has a three year lock-in.
The portfolio is generally diversified across sectors and market capitalization segments.
Portfolio Action
• The key overweight sectors in the portfolio are – Cement, Capital Goods and Oil&Gas.
• The underweight sectors are – Financials and Auto. We are following stock specific approach in these sectors.
Despite strong volume growth, quarterly earnings for Auto sector was quite disappointing due to margin
pressure.
• Telecom sector continues to see headwinds, wherein the portfolio has no exposure.
• Large cap allocation in the portfolio is about 54%.
Kotak Tax Saver31 July, 2018st
Scheme Facts
Structure
Launch Date
Benchmark
Min. Initial Inv.
Additional Inv.
Standard Deviation^
Beta^
Sharpe^
Month end AUM* (as on 31st July )
NAV (as on 2018)
2018
31st July
An open ended equity linked saving schemewith a statutory lock in of 3 years and taxbenefit
Dividend 19.3930
Dividend Direct 22.7390
Growth 42.6550
Growth Direct 45.8110
23 November 2005
Nifty 500 TRI
500
500 & in multiples of 500
14.64%
0.99
0.27
65.22%
*Source: MFI Explorer.
^ as on 31st July, 2018. Source: ICRA
`
` `
777.09 crs
`
`
749.06 crs
rd
Monthly Average AUM*
Portfolio Turnover
`
`
`
`
MFIExplorer.
Market Cap %$
Load Structure
Large cap 55.29
Midcap 25.62
Small cap 17.26
Cash 1.84$The given mar ket cap data is on the basis of newSEBI circular on scheme rationalisation whereinStocks are categorised as per given AMFI list.
KPAX (internal system). Market definitionused is market capitalisation of the 100th largestscrip (on the bases of market capitalisation) is thecutoff to determine the large cap and midcapsegment.
Source:
NilEntry Load:
Exit Load: Exit Load is not applicable for Kotak TaxSaver Scheme. (applicable for all plans)
Units issued on reinvestment of dividends shall notbe subject to exit load (applicable for all plans)
Top 10 Sectors as on 31st July, 2018
Sector % Weight Underweight / Previous Changeoverweight
against (Portfolio % from previousbenchmark Weight) month
Month in portfolioPortfolio Benchmark
(Nifty 500)
Financial Services
Energy
Consumer Goods
Information Technology
Industrial Manufacturing
Cement & Cement Products
Construction
Metals
Chemicals
Services
28.23 32.26 -4.03 28.28 -0.05
14.82 12.01 2.81 13.60 1.22
11.04 13.49 -2.45 11.20 -0.16
8.20 10.30 -2.10 8.44 -0.25
6.18 2.62 3.56 6.25 -0.07
6.17 2.49 3.68 6.13 0.04
6.05 3.92 2.12 6.23 -0.19
3.72 3.53 0.19 4.08 -0.36
2.56 0.64 1.92 2.58 -0.03
2.49 2.25 0.24 2.69 -0.20
Equity Market Brief
• GST – landmark reform is now implemented, and over the last few months, the government has introduced further changes to
help the smaller firms navigate GST better. While there might be some near-term issues in implementing, the longer term
benefits are transformative. Most listed players will benefit, as they form the organised part of the economy, especially once
the e-way bill is introduced in totality and the reverse charge mechanism reduces scope of under-invoicing by unorganised
sector.
• After a prolonged period of under-delivery of Corporate Earnings, earnings are starting to improve across a broad spectrum of
sectors. Barring corporate banks and US focused pharma, most other sectors are witnessing improving business momentum.
• India to benefit from such reforms which encourages formalisation of the economy in the medium-to-long-term, significant
flow from physical to financial savings to further provide stability to markets.
• Volatility across global equities have been on the lower side in 2017. Volatility is on the rise recently due to global events - Fed
hiking, crude oil price rally, trade wars like the flare-up between US and China. In India as well, as we approach general
elections, markets are likely to turn more volatile.
• As we approach general elections, it is important to understand that all events create a level of uncertainty. While near-term
uncertainty induces volatility in asset prices, in the long run, wealth creation in equities is a function as how businesses can
profitably grow over their cost of capital sustainably. Given the long-range of reforms introduced, we believe longer-term
prospects of Indian equities is quite encouraging and we would advise investors to benefit from such induced volatility.
• Time in the market more important than timing the market – after a long period of lower volatility, markets volatility may move
up and investors can benefit from this volatility by focusing on disciplined investing and asset allocation.
4
Kotak Tax Saver
About Kotak Mutual Fund
Kotak Mahindra Asset Management
Company Limited (KMAMC) is a wholly
owned subsidiary of Kotak Mahindra Bank
Limited (KMBL). KMBL has over two decades
of experience in financial services. KMBL has a
market capitalization of 2490.915 bn as on
31st July, 2018). KMAMC is the Asset
Manager for Kotak Mahindra Mutual Fund
(KMMF). It started operations in December
1998. KMMF offers schemes catering to
investors with varying risk - return profiles and
was the first fund house in the country to
launch a dedicated gilt scheme. KMAMC
manages assets worth 1,29,948.48 cr as on
31st July 2018.
`
`
* The numbers are converted using the Rupee-
USD reference rate published by the Reserve
Bank of India as on the respective dates.
To know more
Call : 1800-222-626 (Toll Free), Mumbai61152100, Delhi 66306900 / 02, Chennai28221333 / 45038171, Kolkata 64509802 /03, Pune 64013395 / 96, Ahmedabad26779888, Bangalore 66128050 / 51,Hyderabad 66178140 / 41.
Visit - assetmanagement.kotak.com
Email - [email protected]
Disclaimer
Kotak Tax Saver
InvestmentObjective:
.To generate long-term capital
appreciation from a diversified portfolio ofequity and equity related securities and enableinvestors to avail the income tax rebate, aspermitted from time to time. The amountinvested in the scheme shall be subject to alock-in of 3 years irrespective of whether theinvestments would be eligible for tax benefitor not. The above does not constitute andadvice or a representation. Investors arerequested to seek professional advice in thisregard. Kotak Mahindra Bank Limited is notliable or responsible for any loss or short fallresulting from the operations of the scheme.
Mutual Fund investments are subject tomarket risks, read all scheme relateddocuments carefully. Scheme InformationDocument (SID) and Statement ofAdditional Information (SAI) available onmutualfund.kotak.com
An open ended equitylinked saving scheme with a statutory lock inof 3 years and tax benefit
Kotak Tax Saver* Performance (%) as on , 201831st July
Different plans have different expense structure. The performance details provided herein are of regular plan.
^Past performance may or may not be sustained in future.*All payouts during the period have been reinvested in the units of thescheme at the then prevailing NAV. Returns > = 1 year: CAGR (Compounded Annualised Growth Rate). N.A stands for data notavailable. Note: Point to Point (PTP) Returns in INR shows the value of 10,000/- investment made at inception. Source: ICRA MFIExplorer. # Name of Scheme Benchmark. ## Name of Additional Benchmark. Please refer page no. 29 for other schemes managed byMr.
`
Harsha Upadhyay.
*TRI – Total Return Index
With effect from 1st February 2018, we are comparing the performances of the funds with the total return variant of the benchmarkinstead of the price return variant.
Date SchemeReturns TRI of 10000 in the
Scheme ( ) Benchmark# ( ) Benchmark ## ( )
Nifty 500 Nifty 50 Current Value of Standard InvestmentTRI
(%) ^ # (%)* ## (%)* Additional
`
` `
Since Inception 12.11 13.52 13.69 42,655 49,988 50,949
Last 1 Year 4.84 11.06 14.20 10,484 11,106 11,420
Last 3 Years 9.52 12.09 11.42 13,140 14,087 13,834
Last 5 Years 20.11 18.46 16.03 25,007 23,334 21,038
Scheme Inception date is 23/11/2005. Mr. Harsha Upadhyaya has been managing the fund since 25/08/2015.
Kotak Tax Saver
`
This product is suitable for investors who are seeking*:
• long term capital growth with a 3 year lock in
• Investment in portfolio of predominantly equity &equity related securities.
* Investors should consult their financial advisors if in doubtabout whether the product is suitable for them.
Investors understand that their principal willbe at moderately high risk
Riskometer
M
oderately Moderate
Low
Hig
h
Low
High
LOW HIGH
Moderately
Jun-28-18 18.444 0.34
Mar-22-16 16.266 0.65
Mar-23-18 18.583 0.38Dec-29-17 20.848 0.40Jun-29-17 22.144 0.40Mar-29-17 19.432 0.75Jan-27-17 18.889 0.72
Jan-21-16 16.113 0.70
Dividend History
Date CUM DividendNAV
Dividend( per unit)`
31 July, 2018st
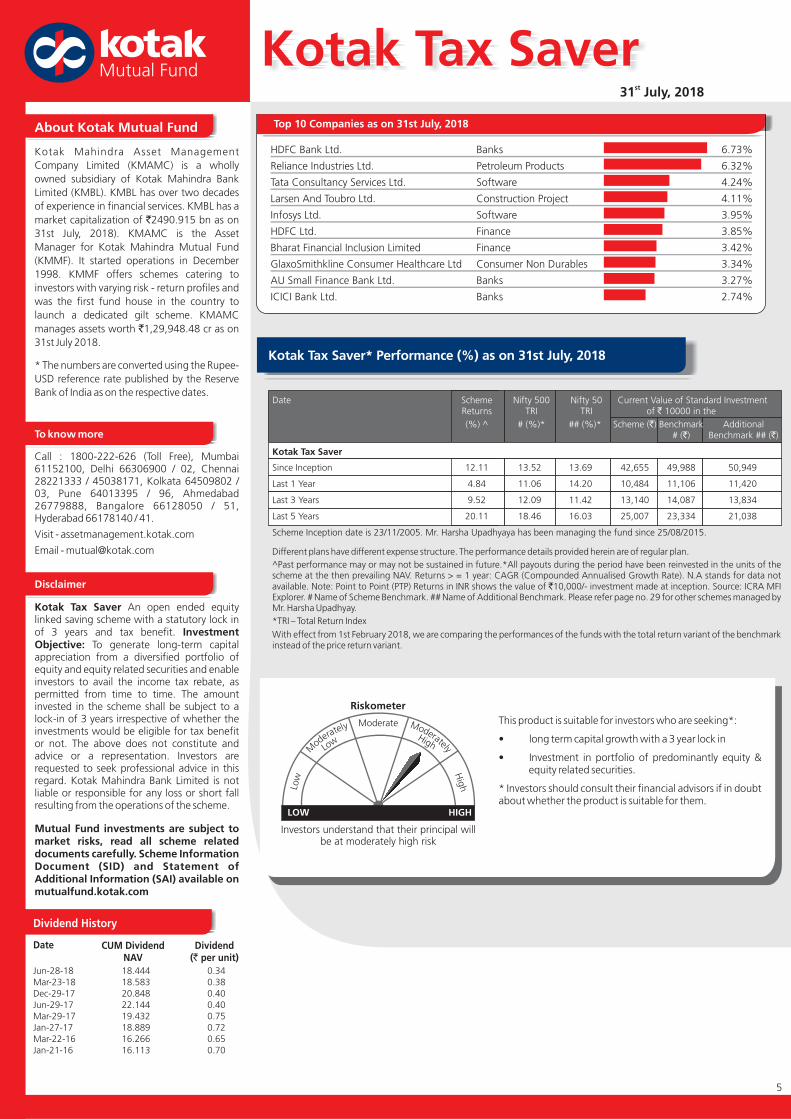
Top 10 Companies as on , 201831st July
HDFC Bank Ltd. Banks 6.73%
Reliance Industries Ltd. Petroleum Products 6.32%
Tata Consultancy Services Ltd. Software 4.24%
Larsen And Toubro Ltd. Construction Project 4.11%
Infosys Ltd. Software 3.95%
HDFC Ltd. Finance 3.85%
Bharat Financial Inclusion Limited Finance 3.42%
GlaxoSmithkline Consumer Healthcare Ltd Consumer Non Durables 3.34%
AU Small Finance Bank Ltd. Banks 3.27%
ICICI Bank Ltd. Banks 2.74%
5

About Kotak Standard Multicap Fund
�
�
�
�
The investment objective of Kotak Standard Multicap Fund scheme is to generate long term capital
appreciation from a portfolio of equity and equity related securities, generally focused on select few sectors.
The scheme endeavors to identify sectors that are likely to do well over the medium term and takes focus
exposures to the same.
There is no restriction on which type of sectors the scheme can take exposure to and the portfolio will be
generally diversified at the stock level across market capitalization.
The scheme is well positioned to capture various themes that are in flavour in a focused manner.
Portfolio Action
• In the backdrop of higher than average market valuations and emerging macro headwinds, now there is barbellapproach in portfolio composition. Portfolio has a good mix of cyclical and defensive bets.
• Domestic businesses with operating leverage continue dominate the portfolio as compared to export/ globalbusinesses due to better earnings trajectory. However, exposure to IT sector has gone up in the recent months.
• The top overweight sectors in the fund are Cement and Financials.
• We believe that Government’s focus on reviving consumption and spending on infrastructure will create positivedemand scenario for our portfolio companies in medium term.
• The key underweight sectors are FMCG and Metals.
• Utilities and Telecom sectors are the major exclusions from the fund.
• Allocation to large cap segment accounts for about 3/4th of the total corpus.
Kotak Standard Multicap Fund
Scheme Facts
Structure
Month end AUM* (as on 31st July )
NAV (as on 31st July 2018)
Launch Date
Benchmark
Min. Initial Inv.
Additional Inv.
Standard Deviation^
Beta^
Sharpe^
2018
Multi Cap Fund - An open ended equityscheme investing across large cap, mid cap,small cap stocks
crs
20,464.13 crs
Direct Dividend 26.4000
Direct Growth 36.7540
Dividend 24.8250
Growth 34.8090
11 September 2009
Nifty 200 TRI
5000 & in multiple of 1 for purchase andfor 0.01 for switches
1000 & in multiples of 1
13.69%
0.95
0.51
27.12%
*Source: MFI Explorer.
^ as on 31st July, 2018. Source: ICRA
`
`
`
` `
`
th
`
21,271.15
`
`
`
`
MFIExplorer.
Monthly Average AUM*
Portfolio Turn over
Market Cap %
Load Structure
$
Large cap 77.24
Midcap 13.54
Small cap 3.54
Cash 5.68$The given market cap data is on the basis of newSEBI circular on scheme rationalisation whereinStocks are categorised as per given AMFI list.
Source: KPAX (internal system). Market definitionused is market capitalisation of the 100th largestscrip (on the bases of market capitalisation) is thecutoff to determine the large cap and midcapsegment.
NilEntry Load:
Exit Load:
I) For redemptions / switch outs (including SIP/STP)within 1 year from the date of allotment of units,irrespective of the amount of investment:1%
ii) For redemptions / switch outs (including SIP/STP)after 1 year from the date of allotment of units,irrespective of the amount of investment: NIL
iii) Any exit load charged (net off Service Tax, if any)shall be credited back to the respective Scheme.(applicable for all plans)
iv) Units issued on reinvestment of dividends shall notbe subject to exit load (applicable for all plans)
Top Sectors as on 31st July, 2018
Sector % Weight Underweight / Previous Changeoverweight
against (Portfolio % from previousbenchmark Weight) month
Month in portfolioPortfolio Benchmark
(Nifty 200)
Financial Services
Energy
Consumer Goods
Automobile
Information Technology
Cement & Cement Products
Cash & Cash Equivalent
Construction
35.34 33.98 1.36 34.34 1.00
12.96 12.90 0.06 12.02 0.95
9.08 13.22 -4.14 9.05 0.03
8.74 8.63 0.11 9.11 -0.37
6.73 10.68 -3.96 7.02 -0.29
5.92 2.53 3.39 5.96 -0.04
5.68 0.00 5.68 6.66 -0.98
4.89 3.55 1.33 5.06 -0.18
31 July, 2018st
• GST – landmark reform is now implemented, and over the last few months, the government has introduced further changes to
help the smaller firms navigate GST better. While there might be some near-term issues in implementing, the longer term
benefits are transformative. Most listed players will benefit, as they form the organised part of the economy, especially once
the e-way bill is introduced in totality and the reverse charge mechanism reduces scope of under-invoicing by unorganised
sector.
• After a prolonged period of under-delivery of Corporate Earnings, earnings are starting to improve across a broad spectrum of
sectors. Barring corporate banks and US focused pharma, most other sectors are witnessing improving business momentum.
• India to benefit from such reforms which encourages formalisation of the economy in the medium-to-long-term, significant
flow from physical to financial savings to further provide stability to markets.
• Volatility across global equities have been on the lower side in 2017. Volatility is on the rise recently due to global events - Fed
hiking, crude oil price rally, trade wars like the flare-up between US and China. In India as well, as we approach general
elections, markets are likely to turn more volatile.
• As we approach general elections, it is important to understand that all events create a level of uncertainty. While near-term
uncertainty induces volatility in asset prices, in the long run, wealth creation in equities is a function as how businesses can
profitably grow over their cost of capital sustainably. Given the long-range of reforms introduced, we believe longer-term
prospects of Indian equities is quite encouraging and we would advise investors to benefit from such induced volatility.
• Time in the market more important than timing the market – after a long period of lower volatility, markets volatility may move
up and investors can benefit from this volatility by focusing on disciplined investing and asset allocation.
Equity Market Brief
(Formerly Known As Kotak Select Focus)
6

About Kotak Mutual Fund
Kotak Mahindra Asset Management
Company Limited (KMAMC) is a wholly
owned subsidiary of Kotak Mahindra Bank
Limited (KMBL). KMBL has over two decades
of experience in financial services. KMBL has a
market capitalization of 2490.915 bn as on
31st July, 2018). KMAMC is the Asset
Manager for Kotak Mahindra Mutual Fund
(KMMF). It started operations in December
1998. KMMF offers schemes catering to
investors with varying risk - return profiles and
was the first fund house in the country to
launch a dedicated gilt scheme. KMAMC
manages assets worth 1,29,948.48 cr as on
31st July 2018.
`
`
* The numbers are converted using the Rupee-
USD reference rate published by the Reserve
Bank of India as on the respective dates.
To know more
Ccall : 1800-222-626 (Toll Free), Mumbai61152100, Delhi 66306900 / 02, Chennai28221333 / 45038171, Kolkata 64509802 /03, Pune 64013395 / 96, Ahmedabad26779888, Bangalore 66128050 / 51,Hyderabad 66178140 / 41.
Visit - assetmanagement.kotak.com
Email - [email protected]
Disclaimer
Kotak Standard Multicap Fund
Investment Objective:. Theinvestment objective of the scheme is togenerate long-term capital appreciation froma portfolio of equity and equity relatedsecurities, generally focused on a few selectedsectors.
Mutual Fund investments are subject tomarket risks, read all scheme relateddocuments carefully. Scheme InformationDocument (SID) and Statement ofAdditional Information (SAI) available onmutualfund.kotak.com
Multi CapFund - An open ended equity schemeinvesting across large cap, mid cap, small capstocks
Kotak Standard Multicap Fund* Performance (%) as on 31st July, 2018
Different plans have different expense structure. The performance details provided herein are of regular plan.
^Past performance may or may not be sustained in future.*All payouts during the period have been reinvested in the units of thescheme at the then prevailing NAV. Returns > = 1 year: CAGR (Compounded Annualised Growth Rate). N.A stands for data notavailable. Note: Point to Point (PTP) Returns in INR shows the value of 10,000/- investment made at inception. Source: ICRA MFIExplorer. # Name of Scheme Benchmark. ## Name of Additional Benchmark. Please refer page no. 29 for other schemes managed byMr. Harsha Upadhyaya.
`
*TRI – Total Return Index
With effect from 1st February 2018, we are comparing the performances of the funds with the total return variant of the benchmarkinstead of the price return variant.
^^Kotak Select Focus Fund is renamed as Kotak Standard Multicap Fund with effect from 25th May 2018.
Date SchemeReturns TRI of 10000 in the
Scheme ( ) Benchmark#( ) Benchmark ## ( )
Nifty 200 Nifty 50 Current Value of Standard Investment
(%) ^ #(%)* ## (%)* Additional
`
` `
Since Inception 15.06 11.86 11.44 34,809 27,087 26,185
Last 1 Year 9.19 12.18 14.20 10,919 11,218 11,420
Last 3 Years 13.09 11.94 11.42 14,468 14,030 13,834
Last 5 Years 22.75 17.78 16.03 27,881 22,679 21,038
Scheme Inception date is 11/09/2009. Mr. Harsha Upadhyaya has been managing the fund since 04/08/2012.
Kotak Standard Multicap Fund^^
TRI
`
This product is suitable for investors who are seeking*:
• Long term capital growth
• Investment in portfolio of predominantly equity &equity related securities generally focussed on a fewselected sectors.
* Investors should consult their financial advisors if in doubtabout whether the product is suitable for them.
Investors understand that their principal willbe at moderately high risk
Riskometer
M
oderately Moderate
Low
Hig
h
Low
High
LOW HIGH
Moderately
Sep-27-17 23.592 1.50
Sep-30-16 21.349 1.25
Sep-26-14 17.791 1.00
Oct-15-10 12.850 1.25
Oct-12-15 19.739 1.00
Dividend History
Date CUM DividendNAV
Dividend( per unit)`
Top 10 Companies as on 31st July, 2018
31 July, 2018st
Kotak Standard Multicap Fund(Formerly Known As Kotak Select Focus)
HDFC Bank Ltd. Banks 7.38%
Reliance Industries Ltd. Petroleum Products 5.58%
Larsen And Toubro Ltd. Construction Project 4.65%
HDFC Ltd. Finance 4.60%
Infosys Ltd. Software 4.17%
ICICI Bank Ltd. Banks 3.58%
State Bank Of India Banks 2.83%
ITC Ltd. Consumer Non Durables 2.73%
RBL Bank Ltd Banks 2.70%
Maruti Suzuki India Limited Auto 2.69%
7

About Kotak Equity Opportunities
�
�
�
Kotak Equity Opportunities looks for opportunities across sectors based on performance and potential of
companies within the sectors.
The fund manager has the flexibility to invest in a mix of large and mid cap stocks from various sectors.
The allocation between large caps & midcaps would broadly depend on the choice of sectors, business
environment & valuations.
Portfolio Action
• The portfolio has seem significant changes in the past few months. In line with revised investment mandate, the
proportion of midcaps in the portfolio has increased. The portfolio has also seen defensive bets (mainly IT sector)
increasing while procyclicals that have operating leverage continue to dominate the portfolio.
• The top overweight sectors are – Industrials and Cement.
• Telecom sector continues to see headwinds, wherein the portfolio has no exposure.
• Key underweight sectors are Auto and Pharma. Despite strong volume growth, quarterly earnings for Auto sector was
quite disappointing due to margin pressure.
• Large, mid and small cap exposures are around 49%, 36% and 11% respectively.
Kotak Equity Opportunities31 July, 2018st
Scheme Facts
Structure
Launch Date
Benchmark
Min. Initial Inv.
Additional Inv.
Standard Deviation^
Beta^
Sharpe^
Month end AUM* (as on 31st July )
NAV (as on 2018)
2018
31st July
Large & Mid Cap Fund- An open ended equityscheme investing in both large cap and midcap stocks
2,559.70 crs
2,485.23 crs
Dividend Direct 28.2860
Growth Direct 125.1850
Dividend 26.3710
Growth 118.0320
9 September 2004
Nifty 200 TRI
5000
1000 & in multiples of 1
14.17%
0.97
0.37
80.61%
*Source: MFI Explorer.
^ as on 31st July, 2018. Source: ICRA
`
`
`
`
`
`
`
`
`
th
MFIExplorer.
Monthly Average AUM*
Portfolio Turn over
Market Cap %$
Load Structure
Large cap 50.54
Midcap 36.01
Small cap 11.14
Cash 2.30
$The given market cap data is on the basis of newSEBI circular on scheme rationalisation whereinStocks are categorised as per given AMFI list.
Source: KPAX (internal system). Market definitionused is market capitalisation of the 100th largestscrip (on the bases of market capitalisation) is thecutoff to determine the large cap and midcapsegment.
NilEntry Load:Exit Load:
I) For redemptions / switch outs (including SIP/STP) within1 year from the date of allotment of units, irrespective ofthe amount of investment:1%
ii) For redemptions / switch outs (including SIP/STP) after1 year from the date of allotment of units, irrespective ofthe amount of investment: NIL
iii) Any exit load charged (net off Service Tax, if any) shallbe credited back to the respective Scheme. (applicablefor all plans)
iv) Units issued on reinvestment of dividends shall not besubject to exit load (applicable for all plans)
Top 10 Sectors as on 31st July, 2018
Sector % Weight Underweight / Previous Changeoverweight
against (Portfolio % from previousbenchmark Weight) month
Month in portfolioPortfolio Benchmark
(Nifty 200)
Financial Services
Energy
Consumer Goods
Information Technology
Industrial Manufacturing
Cement & Cement Products
Construction
Fertilisers & Pesticides
Cash & Cash Equivalent
Automobile
29.58 32.26 -2.68 29.03 0.55
14.48 12.01 2.47 13.15 1.33
12.26 13.49 -1.23 11.43 0.83
8.93 10.30 -1.37 9.06 -0.13
7.05 2.62 4.43 6.79 0.26
6.22 2.49 3.73 5.85 0.37
4.43 3.92 0.51 4.48 -0.05
2.37 0.74 1.63 2.38 -0.01
2.30 0.00 2.30 3.19 -0.89
2.00 8.23 -6.23 3.31 -1.32
Equity Market Brief
• GST – landmark reform is now implemented, and over the last few months, the government has introduced further changes to
help the smaller firms navigate GST better. While there might be some near-term issues in implementing, the longer term
benefits are transformative. Most listed players will benefit, as they form the organised part of the economy, especially once
the e-way bill is introduced in totality and the reverse charge mechanism reduces scope of under-invoicing by unorganised
sector.
• After a prolonged period of under-delivery of Corporate Earnings, earnings are starting to improve across a broad spectrum of
sectors. Barring corporate banks and US focused pharma, most other sectors are witnessing improving business momentum.
• India to benefit from such reforms which encourages formalisation of the economy in the medium-to-long-term, significant
flow from physical to financial savings to further provide stability to markets.
• Volatility across global equities have been on the lower side in 2017. Volatility is on the rise recently due to global events - Fed
hiking, crude oil price rally, trade wars like the flare-up between US and China. In India as well, as we approach general
elections, markets are likely to turn more volatile.
• As we approach general elections, it is important to understand that all events create a level of uncertainty. While near-term
uncertainty induces volatility in asset prices, in the long run, wealth creation in equities is a function as how businesses can
profitably grow over their cost of capital sustainably. Given the long-range of reforms introduced, we believe longer-term
prospects of Indian equities is quite encouraging and we would advise investors to benefit from such induced volatility.
• Time in the market more important than timing the market – after a long period of lower volatility, markets volatility may move
up and investors can benefit from this volatility by focusing on disciplined investing and asset allocation.
(Formerly Known As Kotak Opportunities)
8

Kotak Equity Opportunities
About Kotak Mutual Fund
Kotak Mahindra Asset Management
Company Limited (KMAMC) is a wholly
owned subsidiary of Kotak Mahindra Bank
Limited (KMBL). KMBL has over two decades
of experience in financial services. KMBL has a
market capitalization of 2490.915 bn as on
31st July, 2018). KMAMC is the Asset
Manager for Kotak Mahindra Mutual Fund
(KMMF). It started operations in December
1998. KMMF offers schemes catering to
investors with varying risk - return profiles and
was the first fund house in the country to
launch a dedicated gilt scheme. KMAMC
manages assets worth 1,29,948.48 cr as on
31st July 2018.
`
`
* The numbers are converted using the Rupee-
USD reference rate published by the Reserve
Bank of India as on the respective dates.
To know more
Call : 1800-222-626 (Toll Free), Mumbai61152100, Delhi 66306900 / 02, Chennai28221333 / 45038171, Kolkata 64509802 /03, Pune 64013395 / 96, Ahmedabad26779888, Bangalore 66128050 / 51,Hyderabad 66178140 / 41.
Visit - assetmanagement.kotak.com
Email - [email protected]
Disclaimer
Kotak Equity Opportunities
Investment Objective:.
To generate capitalappreciation from a diversified portfolio ofequity & equity related instruments
Mutual Fund investments are subject tomarket risks, read all scheme relateddocuments carefully. Scheme InformationDocument (SID) and Statement ofAdditional Information (SAI) available onmutualfund.kotak.com
Large & MidCap Fund- An open ended equity schemeinvesting in both large cap and mid cap stocks
May-30-18 26.1190 0.70
Feb-27-18 27.3670 0.83
Nov-28-17 28.7004 0.85
Aug-29-17 27.9190 0.85
May-29-17 27.7480 0.85
Feb-28-17 26.2790 0.50
Nov-22-16 24.2460 0.80
Aug-25-14 21.4110 1.00
Nov-11-11 13.6820 0.50
May-28-10 14.6250 1.00
Sept-8-09 14.7330 1.50
Mar-14-08 16.9750 2.00
Jan-25-08 27.0900 6.00
Sept-28-07 24.2930 3.00
Sept-27-06 17.7450 1.50
Aug-28-15 24.3880 1.60
Dividend History
Date CUM DividendNAV
Dividend( per unit)`
Kotak Equity Opportunities* Performance (%) as on 31st July, 2018
Different plans have different expense structure. The performance details provided herein are of regular plan.
^Past performance may or may not be sustained in future.*All payouts during the period have been reinvested in the units of thescheme at the then prevailing NAV. Returns > = 1 year: CAGR (Compounded Annualised Growth Rate). N.A stands for data notavailable. Note: Point to Point (PTP) Returns in INR shows the value of 10,000/- investment made at inception. Source: ICRA MFIExplorer. # Name of Scheme Benchmark. ## Name of Additional Benchmark. Please refer page no. 29 for other schemes managed byMr. Harsha Upadhyaya.
`
*TRI – Total Return Index
With effect from 1st February 2018, we are comparing the performances of the funds with the total return variant of the benchmarkinstead of the price return variant.
^^Kotak Opportunities is renamed as Kotak Equity Opportunities Fund with effect from 1st June 2018.
With Effect from 1st June 2018, the Benchmark Name is changed to Nifty 200 TRI from Nifty 500 TRI. The above performance isbenchmarked to Nifty 500 TRI.
$
Date SchemeReturns TRI of 10000 in the
Scheme ( ) Benchmark# ( ) Benchmark ## ( )
Nifty 200 Nifty 50 Current Value of Standard Investment
(%) ^ # (%)* ## (%)* Additional
`
` `
Since Inception 19.43 16.30 16.36 118,032 81,530 82,164
Last 1 Year 4.84 12.18 14.20 10,484 11,218 11,420
Last 3 Years 10.99 11.94 11.42 13,675 14,030 13,834
Last 5 Years 19.90 17.78 16.03 24,788 22,679 21,038
Scheme Inception date is 09/09/2004. Mr. Harsha Upadhyaya has been managing the fund since 04/08/2012.
Kotak Equity Opportunities^^
TRI$
`
This product is suitable for investors who are seeking*:
• Long term capital growth
• Investment in portfolio of predominantly equity &equity related securities
* Investors should consult their financial advisors if in doubtabout whether the product is suitable for them.
Investors understand that their principal willbe at moderately high risk
Riskometer
M
oderately Moderate
Low
Hig
h
Low
High
LOW HIGH
Moderately
31 July, 2018st
Top 10 Companies as on , 201831st July
(Formerly Known As Kotak Opportunities)
HDFC Bank Ltd. Banks 6.39%
Reliance Industries Ltd. Petroleum Products 5.33%
Tata Consultancy Services Ltd. Software 4.66%
Bharat Financial Inclusion Limited Finance 4.39%
Infosys Ltd. Software 4.27%
HDFC Ltd. Finance 3.90%
Larsen And Toubro Ltd. Construction Project 3.56%
Gujarat State Petronet Ltd. Gas 2.94%
Thermax Ltd. Industrial Capital Goods 2.75%
The Ramco Cements Ltd Cement 2.43%
9

About Kotak Emerging Equity
�
�
�
The investment objective of Kotak Emerging Equity is to generate long-term capital appreciation from a
portfolio of equity and equity related securities, by investing predominantly in mid and small cap companies.
These companies are either at their nascent or developing stage and are under researched.
Although relatively volatile in the short run, small and mid cap companies have the potential to deliver higher
growth in the long term.
Portfolio Action
• The portfolio continues to be pro-cyclical and tilted towards economic recovery. As a result we continue to be Overweighton sectors such as Financials, cement, Industrial Manufacturing, speciality chemicals & consumer discretionary.
• We believe that this year would be a stock picker’s year. Last year 90%of the BSE 500 stocks gave positive return which isnot going to be repeated in our view. Ground indicators are suggesting strong pick as seen from CV sales, dieselconsumption, bank credit growth, airlines passenger growth, order book of infra/capital good companies, strongcement volumes growth, steel prices rising to 9year high and capacity utilisation at 78%. However would strongearnings lead to better market performance?
• In the medium term, post GST implementation, we anticipate that the organized players would become stronger asunorganized sector would find it tough to do business in the changed environment and cede market share to moreorganized players and portfolio is well positioned in those sectors where there is a large portion of unorganized players.The portfolio is well positioned to ride on this theme from medium term perspective.
• In the IT and pharma sector we continue to have stock specific approach and continue to have UW stance on both thesectors.
• During the month the broader allocation remains largely unchanged with marginal reduction in Industrial manufacturingand marginal increase in financials, auto ancillaries and cement.
• In the new scheme of arrangement, Kotak Emerging would remain as the Midcap fund. The current allocation to midcaps(as defined by SEBI i.e. between 101-250th companies in terms of market cap) is around 65.5% and we have nowcomplied with the new asset allocation.
• We expect Kotak Emerging Equity as a portfolio should deliver 25% and 23% earnings growth in FY19E & FY20E basedon current set of stocks and the portfolio is trading at a P/E 22x and 18.5x for FY19E and FY20E.
Kotak Emerging Equity
Scheme Facts
Structure
Month end AUM* (as on 31st July 2018)
NAV (as on 31st July 2018)
Launch Date
Benchmark
Min. Initial Inv.
Additional Inv.
Standard Deviation^
Beta^
Sharpe^
Mid Cap Fund - An open ended equity schemepredominantly investing in mid cap stocks
Dividend 24.1430
Direct Dividend 27.8940
Growth 39.3450
Direct Growth 41.9040
30th March 2007
Nifty Midcap 100
5000
1000 & in multiples of 1
15.69%
0.87
0.45
41.81%
*Source: MFI Explorer.
^ as on , 2018. Source: ICRA
`
`
` `
3,327.41 crs
`3,201.99 crs
Monthly Average AUM*
Portfolio Turnover
`
`
`
`
MFIExplorer.
31st July
Market Cap %
Load Structure
$
Source: Value Research definition.
Large cap 3.94
Midcap 64.62
Small cap 30.42
Cash 1.02
The given market cap data is on the basis ofnew SEBI circular on scheme rationalisationwherein Stocks are categorised as per givenAMFI list.
$
NilEntry Load:
Exit Load:
I) For redemptions / switch outs (including SIP/STP)within 1 year from the date of allotment of units,irrespective of the amount of investment:1%
ii) For redemptions / switch outs (including SIP/STP)after 1 year from the date of allotment of units,irrespective of the amount of investment: NIL
Any exit load charged (net off Service Tax, if any) shallbe credited back to the respective Scheme. Unitsissued on reinvestment of dividends shall not besubject to entry and exit load.
31 July, 2018st
Top 10 Sectors as on 31st July, 2018
Sector % Weight Underweight / Previous Changeoverweight
against (Portfolio % from previousbenchmark Weight) month
Month in portfolioPortfolio Benchmark
Financial Services
Industrial Manufacturing
Consumer Goods
Pharma
Automobile
Chemicals
Construction
Fertilisers & Pesticides
Cement & Cement Products
Textiles
22.61 19.72 2.89 23.26 -0.65
18.62 10.20 8.43 18.86 -0.24
14.78 14.10 0.67 15.30 -0.52
6.56 8.14 -1.57 6.29 0.27
5.93 7.32 -1.40 6.23 -0.30
5.64 3.35 2.29 5.87 -0.22
4.53 5.66 -1.13 3.79 0.74
3.64 2.11 1.53 3.21 0.43
3.20 2.51 0.68 2.97 0.22
3.13 2.92 0.21 2.64 0.49
Nifty Midcap100 TRI
Equity Market Brief
• GST – landmark reform is now implemented, and over the last few months, the government has introduced further changes tohelp the smaller firms navigate GST better. While there might be some near-term issues in implementing, the longer termbenefits are transformative. Most listed players will benefit, as they form the organised part of the economy, especially oncethe e-way bill is introduced in totality and the reverse charge mechanism reduces scope of under-invoicing by unorganisedsector.
• After a prolonged period of under-delivery of Corporate Earnings, earnings are starting to improve across a broad spectrum ofsectors. Barring corporate banks and US focused pharma, most other sectors are witnessing improving business momentum.
• India to benefit from such reforms which encourages formalisation of the economy in the medium-to-long-term, significantflow from physical to financial savings to further provide stability to markets.
• Volatility across global equities have been on the lower side in 2017. Volatility is on the rise recently due to global events - Fedhiking, crude oil price rally, trade wars like the flare-up between US and China. In India as well, as we approach generalelections, markets are likely to turn more volatile.
• As we approach general elections, it is important to understand that all events create a level of uncertainty. While near-termuncertainty induces volatility in asset prices, in the long run, wealth creation in equities is a function as how businesses canprofitably grow over their cost of capital sustainably. Given the long-range of reforms introduced, we believe longer-termprospects of Indian equities is quite encouraging and we would advise investors to benefit from such induced volatility.
• Time in the market more important than timing the market – after a long period of lower volatility, markets volatility may moveup and investors can benefit from this volatility by focusing on disciplined investing and asset allocation.
10

Kotak Emerging Equity
About Kotak Mutual Fund
Kotak Mahindra Asset Management
Company Limited (KMAMC) is a wholly
owned subsidiary of Kotak Mahindra Bank
Limited (KMBL). KMBL has over two decades
of experience in financial services. KMBL has a
market capitalization of 2490.915 bn as on
31st July, 2018). KMAMC is the Asset
Manager for Kotak Mahindra Mutual Fund
(KMMF). It started operations in December
1998. KMMF offers schemes catering to
investors with varying risk - return profiles and
was the first fund house in the country to
launch a dedicated gilt scheme. KMAMC
manages assets worth 1,29,948.48 cr as on
31st July 2018.
`
`
* The numbers are converted using the Rupee-
USD reference rate published by the Reserve
Bank of India as on the respective dates.
To know more
Call : 1800-222-626 (Toll Free), Mumbai61152100, Delhi 66306900 / 02, Chennai28221333 / 45038171, Kolkata 64509802 /03, Pune 64013395 / 96, Ahmedabad26779888, Bangalore 66128050 / 51,Hyderabad 66178140 / 41.
Visit - assetmanagement.kotak.com
Email - [email protected]
Disclaimer
Kotak Emerging Equity
InvestmentObjective:
.The investment objective of the
scheme is to generate long-term capitalappreciation from a portfolio of equity andequity related securities, by investingpredominantly in mid and small capcompanies.
Mutual Fund investments are subject tomarket risks, read all scheme relateddocuments carefully. Scheme InformationDocument (SID) and Statement ofAdditional Information (SAI) available onmutualfund.kotak.com
Mid Cap Fund - Anopen ended equity scheme predominantlyinvesting in mid cap stocks
Kotak Emerging Equity*Performance (%) as on 31st July 2018,
Different plans have different expense structure. The performance details provided herein are of regular plan.
^Past performance may or may not be sustained in future.*All payouts during the period have been reinvested in the units of thescheme at the then prevailing NAV. Returns > = 1 year: CAGR (Compounded Annualised Growth Rate). N.A stands for data notavailable. Note: Point to Point (PTP) Returns in INR shows the value of 10,000/- investment made at inception. Source: ICRA MFIExplorer. # Name of Scheme Benchmark. ## Name of Additional Benchmark. Please refer page no. 29 for other schemes managed byMr. Pankaj Tibrewal.
`
*TRI – Total Return Index
With effect from 1st February 2018, we are comparing the performances of the funds with the total return variant of the benchmarkinstead of the price return variant.
With Effect from 25th May 2018, the Benchmark is changed to Nifty Midcap 100 TRI.$
31 July, 2018st
Since Inception 12.83 14.22 11.40 39,345 45,201 34,027
Last 1 Year 5.94 3.06 14.20 10,594 10,306 11,420
Last 3 Years 12.88 12.51 11.42 14,387 14,246 13,834
Last 5 Years 29.75 23.83 16.03 36,799 29,127 21,038
Date SchemeReturns TRI of 10000 in the
Scheme ( ) Benchmark# ( ) Benchmark ## ( )
Nifty Nifty 50 Current Value of Standard Investment
(%) ^ ## (%)* Additional
`
`
# (%)* ` `
Midcap
TRI$
100
Scheme Inception date is 30/03/2007. Mr. Pankaj Tibrewal has been managing the fund since 27/05/2010.
Kotak Emerging Equity Fund
This product is suitable for investors who are seeking*:
• Long term capital growth
• Investment in equity & equity related securitiespredominantly in mid & small cap companies
* Investors should consult their financial advisors if in doubtabout whether the product is suitable for them.
Investors understand that their principal willbe at moderately high risk
Riskometer
M
oderately Moderate
Low
Hig
h
Low
High
LOW HIGH
Moderately
Mar-23-18 26.153 2.67
May-26-17 26.010 1.59
Apr-28-15 21.499 2.10
May-02-14 13.073 0.50
May-02-13 11.491 0.50
Apr-29-11 10.573 0.75
May-27-16 21.196 1.30
Dividend History
Date CUM DividendNAV
Dividend( per unit)`
Top 10 Companies as on , 201831st July
Bharat Financial Inclusion Limited Finance 4.02%
RBL Bank Ltd Banks 3.59%
Schaeffler India Ltd Industrial Products 3.29%
The Ramco Cements Ltd Cement 3.20%
Atul Ltd. Chemicals 2.94%
Supreme Industries Limited Industrial Products 2.91%
Finolex Cables Ltd. Industrial Products 2.73%
Solar Industries India Limited Chemicals 2.71%
Shriram City Union Finance Ltd. Finance 2.60%
Thermax Ltd. Industrial Capital Goods 2.57%
11

HYBRID FUNDS
EQUITY DEBT
1313
About Kotak Equity Hybrid
� The investment objective of Kotak Equity Hybrid is to achieve growth by investing in equity and equity related instruments,
balanced with income generation by investing in debt and money market instruments.
The scheme thus provides capital appreciation potential of equities as well as stable returns of debt.�
Portfolio Action
Equity
Debt:
• The portfolio continues to be pro-cyclical and tilted towards economic recovery. As a result we continue to be overweight on sectors
such as cement, capital goods & engineering, auto ancillary, media and consumer discretionary.
• In the IT and pharma sector we continue to have stock specific approach. The fund continues the underweight stance on consumer
staples and IT.
• During the months we marginally increased weightage to financials (private sector banks), capital goods, construction, pharma and
consumer discretionary sector.
• In the short term we believe the GST implementation could be a disruptor for B2C businesses. However from a medium term perspective
post GST implementation, we anticipate that the organized players would become stronger as unorganized sector would find it tough
to do business in the changed environment and cede market share to more organized players and portfolio is well positioned in those
sectors where there is a large portion of unorganized players.
• The current large cap (above 20,000 crs market cap): midcap ratio remains at 66:34 in the fund.
• We expect equity portion of Kotak balance fund to deliver 31% and 26% earnings growth in FY19E & FY20E based on current set of
stocks and the portfolio is trading at a P/E 20x and 16x for FY19E and FY20E.
• As on July 31 2018, ~26.37% of the scheme portfolio comprised of government securities (central as well as state). ~56.86% of the
portfolio was invested in corporate bonds and the balance was held in the form of Money market securities and cash.
• The benchmark gilt started the month at 7.91%-levels and ended the month around 7.77%-levels.
• However, we continue to remain positive about our gilt holdings in the 3-5 year bucket for the coming month(s) due to flat-to-inverted
yield curves.
• During July, we continued to maintain a conservative stance portfolio duration-wise.
• In the near term as we monitor the economic developments closely, the portfolio construct will be such that the loss due to volatility is
minimal.
• We hope to increase the portfolio duration, in due time, so that we can reverse losses caused by higher duration. The emerging situation
demands caution and conservatism. We shall look to better equip ourselves with more information and clarity, rather than just chasing
absolute yields, before making a defined move in terms of portfolio duration.
• Bearing in mind the macro-economic signals highlighted above, we will continue our conservative stance and maintain portfolio
duration in the range of 2.50 - 4.00 for August 2018.
Kotak Equity Hybrid31 July, 2018st
Scheme Facts
Structure
Month end AUM* (as on 31st July )
NAV (as on 2018)
2018
31st July
Launch Date
Benchmark
Min. Initial Inv.
Additional Inv.
Standard Deviation^
Beta^
Sharpe^
An open ended hybrid scheme investingpredominantly in equity and equity relatedinstruments.
1,976.10 crs
2,012.71 crs
25 November 1999
NIFTY 50 Hybrid Composite Debt 70:30Index
5000
1000 & in multiples of 1
10.96%
1.03
0.27
45.44%
*Source: MFI Explorer.
^ as on 31st July, 2018. Source: ICRA MFIExplorer.
`
`
`
Direct Dividend 17.5740
Direct Growth 26.2590
Dividend 16.0850
Growth 24.5170
th
`
`
Monthly Average AUM*
Portfolio Turn over
`
`
`
`
Load Structure
Entry Load:
Exit Load:
Nil
I) For redemptions / switch outs (including SIP/STP)within 1 year from the date of allotment of units,irrespective of the amount of investment:1%
ii) For redemptions / switch outs (including SIP/STP)after 1 year from the date of allotment of units,irrespective of the amount of investment: NIL
iii) Any exit load charged (net off Service Tax, if any)shall be credited back to the respective Scheme.(applicable for all plans)
iv) Units issued on reinvestment of dividends shall notbe subject to exit load (applicable for all plans)
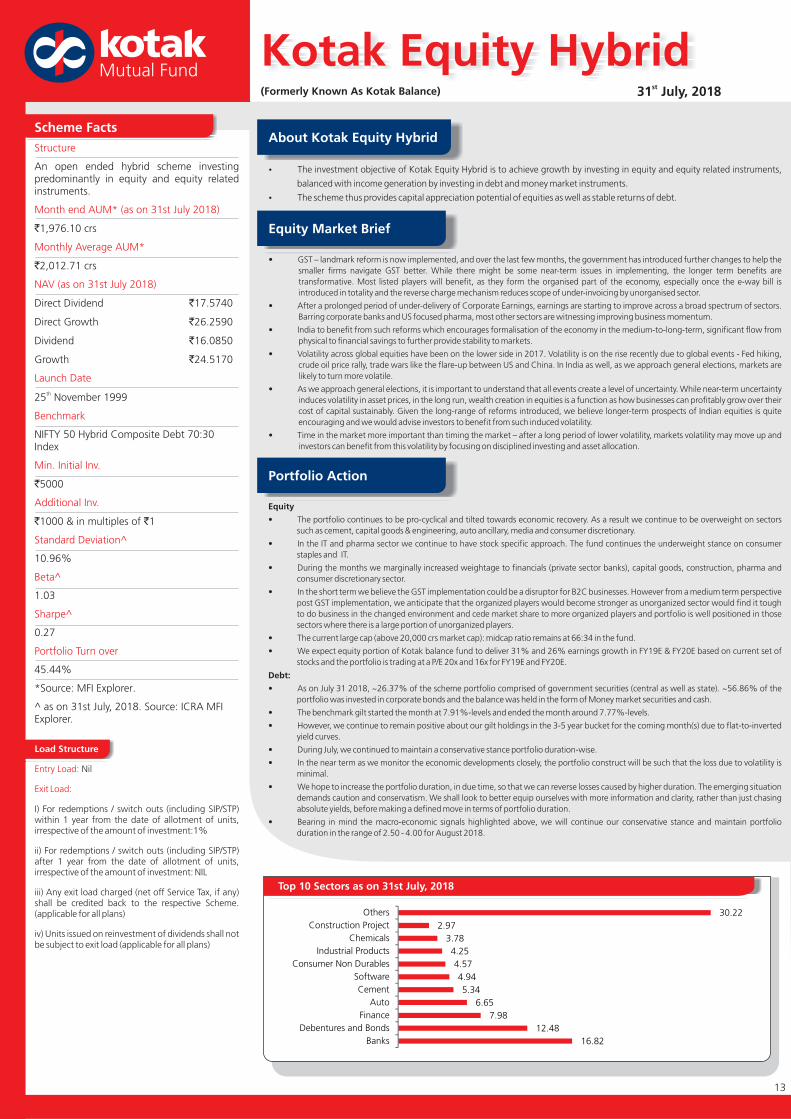
Top 10 Sectors as on 31st July, 2018
Equity Market Brief
• GST – landmark reform is now implemented, and over the last few months, the government has introduced further changes to help the
smaller firms navigate GST better. While there might be some near-term issues in implementing, the longer term benefits are
transformative. Most listed players will benefit, as they form the organised part of the economy, especially once the e-way bill is
introduced in totality and the reverse charge mechanism reduces scope of under-invoicing by unorganised sector.
• After a prolonged period of under-delivery of Corporate Earnings, earnings are starting to improve across a broad spectrum of sectors.
Barring corporate banks and US focused pharma, most other sectors are witnessing improving business momentum.
• India to benefit from such reforms which encourages formalisation of the economy in the medium-to-long-term, significant flow from
physical to financial savings to further provide stability to markets.
• Volatility across global equities have been on the lower side in 2017. Volatility is on the rise recently due to global events - Fed hiking,
crude oil price rally, trade wars like the flare-up between US and China. In India as well, as we approach general elections, markets are
likely to turn more volatile.
• As we approach general elections, it is important to understand that all events create a level of uncertainty. While near-term uncertainty
induces volatility in asset prices, in the long run, wealth creation in equities is a function as how businesses can profitably grow over their
cost of capital sustainably. Given the long-range of reforms introduced, we believe longer-term prospects of Indian equities is quite
encouraging and we would advise investors to benefit from such induced volatility.
• Time in the market more important than timing the market – after a long period of lower volatility, markets volatility may move up and
investors can benefit from this volatility by focusing on disciplined investing and asset allocation.
(Formerly Known As Kotak Balance)
16.82
12.48
7.98
6.65
5.34
4.94
4.57
4.25
3.78
2.97
30.22
Banks
Debentures and Bonds
Finance
Auto
Cement
Software
Consumer Non Durables
Industrial Products
Chemicals
Construction Project
Others
13

1414
Kotak Equity Hybrid31 July, 2018st
About Kotak Mutual Fund
* The numbers are converted using the Rupee-
USD reference rate published by the Reserve
Bank of India as on the respective dates.
Kotak Mahindra Asset Management
Company Limited (KMAMC) is a wholly
owned subsidiary of Kotak Mahindra Bank
Limited (KMBL). KMBL has over two decades
of experience in financial services. KMBL has a
market capitalization of 2490.915 bn as on
31st July, 2018). KMAMC is the Asset
Manager for Kotak Mahindra Mutual Fund
(KMMF). It started operations in December
1998. KMMF offers schemes catering to
investors with varying risk - return profiles and
was the first fund house in the country to
launch a dedicated gilt scheme. KMAMC
manages assets worth 1,29,948.48 cr as on
31st July 2018.
`
`
To know more
Call : 1800-222-626 (Toll Free), Mumbai61152100, Delhi 66306900 / 02, Chennai28221333 / 45038171, Kolkata 64509802 /03, Pune 64013395 / 96, Ahmedabad26779888, Bangalore 66128050 / 51,Hyderabad 66178140 / 41.
Visit - assetmanagement.kotak.com
Email - [email protected]
Disclaimer
Kotak Equity Hybrid
InvestmentObjective:
Mutual Fund investments are subject tomarket risks, read all scheme relateddocuments carefully. Scheme InformationDocument (SID) and Statement ofAdditional Information (SAI) available onmutualfund.kotak.com
To achieve growth by investing inequity & equity related instruments, balancedwith income generation by investing in debt &money market instruments.
An open ended hybridscheme investing predominantly in equity andequity related instruments.
14
Kotak Equity Hybrid* Performance (%) as on , 201831st July
Different plans have different expense structure. The performance details provided herein are of regular plan.
^Past performance may or may not be sustained in future.*All payouts during the period have been reinvested in the units of thescheme at the then prevailing NAV. Returns > = 1 year: CAGR (Compounded Annualised Growth Rate). N.A stands for data notavailable. Note: Point to Point (PTP) Returns in INR shows the value of 10,000/- investment made at inception. Source: ICRA MFIExplorer. # Name of Scheme Benchmark. ## Name of Additional Benchmark.Please refer page no. 29-30 for top 3 and bottom 3schemes managed by & Mr. Abhishek Bisen.
*TRI – Total Return Index
With effect from 1st February 2018, we are comparing the performances of the funds with the total return variant of the benchmarkinstead of the price return variant
*The debt component of the index is TRI since inception. For equity component of the index, as TRI data is not available sinceinception of the scheme, benchmark performance is calculated using composite CAGR of S&P BSE 200 PRI values series is used till31st July 2006 and TRI values is used since 1st Aug 2006.
^^Kotak Balance is renamed as kotak Equity Hybrid with effect from 25th May 2018.
With Effect from 25th May 2018, the Benchmark is changed to Nifty 50 Hybrid Composite Debt 70:30 Index TRI.
`
Pankaj Tibrewal
$
^The existing benchmark “CRISIL Balanced Fund” has been renamed as “CRISIL Hybrid 35+65 - Aggressive Index” as percommunication received from CRISIL.
This product is suitable for investors who are seeking*:
• Long term capital growth
• Investment in equity & equity related securitiesbalanced with income generation by investing indebt & money market instruments
* Investors should consult their financial advisors if in doubtabout whether the product is suitable for them.
Investors understand that their principal willbe at moderately high risk
Riskometer
M
oderately Moderate
Low
Hig
h
Low
High
LOW HIGH
Moderately
Jul-25-18 15.9800 0.12Jun-25-18 15.8710 0.12May-25-18 16.2170 0.12Apr-25-18 16.5120 0.12Mar-26-18 16.2295 0.14Feb-26-18 16.8210 0.14Jan-25-18 17.6320 0.14Dec-26-17 17.4978 0.14Nov-27-17 17.1870 0.14Oct-25-17 16.8647 0.11Sep-25-17 16.4830 0.11Aug-28-17 16.6866 0.11Jul-25-17 17.1274 0.12Jun-27-17 16.7970 0.11May-25-17 16.8061 0.11Apr-25-17 16.9880 0.11Mar-27-17 16.4515 0.11Feb-27-17 16.3220 0.11Jan-25-17 16.0710 0.11Dec-26-16 14.9970 0.10Dec-01-16 15.6912 0.11Oct-25-16 16.4100 0.08Sep-26-16 16.2900 0.08Aug-25-16 16.0150 0.08July-25-16 15.8590 0.08
Dividend History
Date CUM DividendNAV
Dividend( per unit)`
Top 10 Companies as on , 201831st July
Date SchemeReturns
#( ) Benchmark##( )
Nifty50 Nifty50 CurrentValueof Standard Investment
` `
Kotak Equity Hybrid - Dividend (Erstwhile Kotak Balance), *Name of the Benchmark - CRISIL Hybrid 35+65 - Aggressive Index,Scheme Inception date is 25/11/1999. Mr. Pankaj Tibrewal has been managing the fund since 25/08/2015. Mr. Abhishek Bisenhas been managing the fund since 15/04/2008.
Kotak Equity Hybrid^^
HybridComposite TRI of 10000 in the
Debt70:30Index Scheme( ) BenchmarkTRI #(%)^
`
(%)^ ##(%)* Additional`$
Since Inception 14.54 NA 13.40 126,498 NA 104,935
Last 1 Year 3.40 10.42 14.20 10,340 11,042 11,420
Last 3 Years 8.81 10.30 11.42 12,886 13,424 13,834
Last 5 Years 13.81 13.90 16.03 19,105 19,175 21,038
(Formerly Known As Kotak Balance)
United Bank Of India CRISIL AA- 4.90%
HDFC Bank Ltd. Banks 4.62%
Infosys Ltd. Software 2.55%
Bharat Financial Inclusion Limited Finance 2.52%
Shree Cement Ltd. Cement 2.51%
U P Power Corporation Ltd (Guaranteed
By UP State Government ) CRISIL A+(SO) 2.38%
ICICI Bank Ltd. Banks 2.25%
7.17% Central Government SOV 2.19%
State Bank Of India Banks 2.18%
ITC Ltd. Consumer Non Durables 2.10%

About Kotak Equity Savings Fund
�
�
�
�
�
It is an open-ended equity scheme which aims to generate income from cash- futures arbitrage positions and
at the same time allows you to participate in the equity market growth moderately.
-Aims to provide income from arbitrage opportunities in cash & derivatives segment of the equity
market.
- Potential for growth in the long term through moderate exposure in directional equity.
- No aggressive duration or credit risk taken on debt portion. No aggressive mid
cap / small cap exposure taken. This we feel should lower the volatility of the fund.
- The Fund is treated similar to equity funds for tax purposes .*
* Please consult your tax adviser with respect to the specific tax implications.
Benefits of Kotak Equity Savings Fund
Income
Growth Potential
Conservative Approach
Tax efficiency
:
Portfolio Action
Directional Equity:
Arbitrage:
Debt:
• The directional equity was around 27.4%.
• On the directional equity side, we have been running a conservative portfolio with a max exposure in mid cap stocks
being 20-25% at any point in time. Remaining 75-80% of the directional equity continues to be in large cap stocks.
• We have been overweight on sectors like IT and consumers. The major underweight sectors are Cap Goods, Pharma
and BFSI.
• The exposure to consumers and Technology has been increased gradually over the last 12 months. The weight in
Pharma was also increased in the month of June as the stocks were trading at extremely low valuations.
• The arbitrage portion continues to be managed in the same way we manage our arbitrage fund. In months, when
the arbitrage opportunities provide better returns than the debt papers, we deploy more money into arbitrage
trades.
• The benefit is that in months when the arbitrage returns are sub optimal, we can deploy a lower amount in arbitrage
and still maintain the 'equity' taxation status.
• We have done some merger arbitrage trades viz. CMC-TCS and Shasun-Strides in the past. The blended annualized
returns were upwards of 14% in these trades. Recently, we have done merger arbitrage trades in Geometric-HCL
Tech and Cairn-Vedanta which have an expected return potential of more than 16% annualized. Trades like
subscribing to the CPSE ETFs (at 5% discount) and shorting the futures of individual constituents, buying HDFC
warrants and selling HDFC Ltd futures, etc have boosted the arbitrage returns.
• We have been managing the debt portion in a very conservative manner till now.
• The term deposits which are to be placed with the exchange for taking exposure in derivatives generally have a
tenure of 1 year.
• On the debt side, we prefer to play accrual as compared to duration. A bulk of exposure on the debt side is into
papers with a residual maturity (or time to put option) of 2-3 years. A significant portion is also invested into our
own Liquid Fund. The benefit of investing in Liquid is that in case the arbitrage spreads expand, we can easily move
the money from liquid into arbitrage trades without worrying about the levels where the debt yields are quoting at
that point in time.
Kotak Equity Savings Fund
Scheme Facts
Structure
Month end AUM* (as on 31st July )
NAV (as on 31st July 2018)
2018
Launch Date
Benchmark
Min. Initial Inv.
Additional Inv.
Standard Deviation^
Beta^
Sharpe^
An open ended scheme investing in equity,arbitrage and debt
crs
13 October 2014
75% of Nifty 50 Arbitrage Index &25% in Nifty 50 TRI (w.e.f. Nov 01, 2016)
5000
1000 & in multiples of 1
3.50%
0.96
0.52
111.77%
*Source: MFI Explorer.
^as on 31st July, 2018. Source: ICRA
`2,260.08
`
` `
` `
2,216.06 crs
Direct Growth 14.2033
Growth 13.8390
Quarterly Dividend 11.3604
Direct Quarterly Dividend 11.4673
Monthly Dividend 11.4970
Direct Monthly Dividend 11.7671
& in multiples of 1
th
Monthly Average AUM*
Portfolio Turnover
`
`
`
`
`
`
MFIExplorer.
Load Structure
Entry Load:
Exit Load:
Nil
i) For redemption / switch out ofupto 10% of the initial investment amount(limit) purchased or switched in within 1 yearfrom the date of allotment: Nil.
ii) If units redeemed or switched out are inexcess of the limit within 1 year from the dateof allotment: 1%.
iii) If units are redeemed or switched out on orafter 1 year from the date of allotment: Nil.
Any exit load charged (net off Service Tax, ifany) shall be credited back to the respectiveScheme. Units issued on reinvestment ofdividends shall not be subject to entry and exitload.
31 July, 2018st
Equity Market Brief
• GST – landmark reform is now implemented, and over the last few months, the government has introduced further changes to
help the smaller firms navigate GST better. While there might be some near-term issues in implementing, the longer term
benefits are transformative. Most listed players will benefit, as they form the organised part of the economy, especially once
the e-way bill is introduced in totality and the reverse charge mechanism reduces scope of under-invoicing by unorganised
sector.
• After a prolonged period of under-delivery of Corporate Earnings, earnings are starting to improve across a broad spectrum of
sectors. Barring corporate banks and US focused pharma, most other sectors are witnessing improving business momentum.
• India to benefit from such reforms which encourages formalisation of the economy in the medium-to-long-term, significant
flow from physical to financial savings to further provide stability to markets.
• Volatility across global equities have been on the lower side in 2017. Volatility is on the rise recently due to global events - Fed
hiking, crude oil price rally, trade wars like the flare-up between US and China. In India as well, as we approach general
elections, markets are likely to turn more volatile.
Time in the market more important than timing the market – after a long period of lower volatility, markets volatility may move
up and investors can benefit from this volatility by focusing on disciplined investing and asset allocation.
• As we approach general elections, it is important to understand that all events create a level of uncertainty. While near-term
uncertainty induces volatility in asset prices, in the long run, wealth creation in equities is a function as how businesses can
profitably grow over their cost of capital sustainably. Given the long-range of reforms introduced, we believe longer-term
prospects of Indian equities is quite encouraging and we would advise investors to benefit from such induced volatility.
•
15

Kotak Equity Savings Fund31 July, 2018st
About Kotak Mutual Fund
Kotak Mahindra Asset Management
Company Limited (KMAMC) is a wholly
owned subsidiary of Kotak Mahindra Bank
Limited (KMBL). KMBL has over two decades
of experience in financial services. KMBL has a
market capitalization of 2490.915 bn as on
31st July, 2018). KMAMC is the Asset
Manager for Kotak Mahindra Mutual Fund
(KMMF). It started operations in December
1998. KMMF offers schemes catering to
investors with varying risk - return profiles and
was the first fund house in the country to
launch a dedicated gilt scheme. KMAMC
manages assets worth 1,29,948.48 cr as on
31st July 2018.
`
`
* The numbers are converted using the Rupee-
USD reference rate published by the Reserve
Bank of India as on the respective dates.
To know more
Call : 1800-222-626 (Toll Free), Mumbai61152100, Delhi 66306900 / 02, Chennai28221333 / 45038171, Kolkata 64509802 /03, Pune 64013395 / 96, Ahmedabad26779888, Bangalore 66128050 / 51,Hyderabad 66178140 / 41.
Visit - assetmanagement.kotak.com
Email - [email protected]
Disclaimer
Kotak Equity Savings Fund
Investment objective:
Mutual Fund investments are subject tomarket risks, read all scheme relateddocuments carefully. Scheme InformationDocument (SID) and Statement ofAdditional Information (SAI) available onmutualfund.kotak.com
,
. of the scheme isto generate capital appreciation and incomeby predominantly investing in arbitrageopportunities in the cash and derivativessegment of the equity market, and enhancereturns with a moderate exposure in equity &equity related instruments.There is noassurance or guarantee that the investmentobjective of the scheme will be achieved.
An open endedscheme investing in equity, arbitrage anddebt
Jul-12-18 11.4191 0.0441
Jun-12-18 11.3494 0.0361
May-14-18 11.3246 0.0477
Apr-12-18 11.2952 0.0391
Jun-20-18 11.2939 0.1584
Mar-12-18 11.2418 0.0389
Feb-12-18 11.3290 0.0500
Jan-12-18 11.4330 0.0500
Dec-12-17 11.3254 0.0473
Oct-13-17 11.2550 0.0518
Oct-12-17 11.3021 0.0497
Sep-12-17 11.3260 0.0600
Aug-14-17 11.4110 0.0583
Jul-12-17 11.1373 0.0500
Jun-12-17 11.0760 0.0500
Mar-20-18 11.1604 0.1789
Dec-20-17 11.4149 0.1803
Sep-20-17 11.3680 0.1750
Jun-20-17 11.1180 0.1500
Quaterly Dividend Option
Dividend History
Date CUM DividendNAV
Dividend( per unit)`
This product is suitable for investors who are seeking*:
• Income from arbitrage opportunities in the equitymarket & long term capital growth
• Investment predominantly in arbitrage opportunitiesin the cash & derivatives segment of the equitymarket and equity & equity related securities
* Investors should consult their financial advisors if in doubtabout whether the product is suitable for them.Investors understand that their principal will
be at moderately high risk
Riskometer
M
oderately Moderate
Low
Hig
h
Low
High
LOW HIGH
Moderately
Portfolio Detail % of Net assets
Unhedged Position 27.68
Cash Futures Arbitrage 42.37
Debt Instruments* 25.55
Cash and Cash equivalent and Net Current Asset 4.40
Total 100.00
*Debt Instruments includes redeemable preference shares
The scheme has been in existence for less than 5 years
Different plans have different expense structure. The performance details provided herein are of regular plan.
^Past performance may or may not be sustained in future.*All payouts during the period have been reinvested in the units of thescheme at the then prevailing NAV. Returns > = 1 year: CAGR (Compounded Annualised Growth Rate). N.A stands for data notavailable. Note: Point to Point (PTP) Returns in INR shows the value of 10,000/- investment made at inception. Source: ICRA MFIExplorer. # Name of Scheme Benchmark. ## Name of Additional Benchmark.Please refer page no. 29 - 30 for top 3 and bottom 3schemes managed by Mr. Deepak Gupta & Mr. Abhishek Bisen.
`
*TRI – Total Return IndexWith effect from 1st February 2018, we are comparing the performances of the funds with the total return variant of the benchmarkinstead of the price return variant.
Kotak Equity Savings Fund * Performance (%) as on 31st July, 2018
Date SchemeReturns of 10000 in the
Scheme ( ) Benchmark# ( ) Benchmark ## ( )
75%50 TRI
##
Nifty Current Value of Standard Investment
(%) ^ (%)* Additional# (%)*
`
`
` `
Scheme Inception date is 13/10/2014. Mr. Deepak Gupta has been managing the fund since 13/10/2014. Mr. Abhishek Bisenhas been managing the fund since 13/10/2014.
Kotak Equity Savings Fund
Nifty 50Arbitrage Index
25% Nifty 50 TRI
Since Inception 8.93 7.48 11.48 13,839 13,154 15,115
Last 1 Year 8.43 6.66 14.20 10,843 10,666 11,420
Last 3 Years 8.32 6.92 11.42 12,712 12,224 13,834
Finance 17.00
Consumer Non Durables 15.48
Software 14.30
Banks 8.11
Auto 7.91
Sector* % of Weight
*The top 5 sectors pertain to the unhedged equity portion and the figures have been extrapolated to 100%
Tata Consultancy Services Ltd. 8.01
HDFC Bank Ltd. 6.73
Reliance Industries Ltd. 6.52
Bharat Financial Inclusion Limited 5.14
Hindustan Unilever Ltd. 5.10
Maruti Suzuki India Limited 4.29
Bajaj Finance Limited 4.23
Infosys Ltd. 3.68
Mahindra & Mahindra Ltd. 3.28
Titan Company Ltd. 2.74
Stock* % of Weight
*The top 10 stocks pertain to the unhedged equity portion and the figures have been extrapolated to 100%
16

THEMATIC FUND

Kotak Infrastructure & Economic Reform Fund(formerly known as “PineBridge Infrastructure & EconomicReform Fund)
31 July, 2018st
Scheme Facts
Structure
Launch Date
Benchmark
Min. Initial Inv.
Additional Inv.
Standard Deviation^
Beta^
Sharpe^
Month end AUM* (as on 31st July )
NAV (as on 31st July 2018)
2018
An open ended equity scheme followingInfrastructure & Economic Reform theme
crs
crs
Growth Direct 21.8910
Dividend Direct 21.6420
Standard Dividend 18.5450
Standard Growth 20.3550
27 February 2008
India Infrastructure Index - Customised Indexprepared by IISL
1000 & in multiples of 1
16.18%
0.81
0.17
32.87%
*Source: MFI Explorer.
^ as on 31st July, 2018. Source: ICRA
`
`
`
`
455.22
442.75
th
5000 & in multiples of 1`
`
Monthly Average AUM*
Portfolio Turn over
`
`
`
`
MFIExplorer.
Load Structure
Entry Load:
Exit Load:
Nil
I) For redemptions / switch outs (including SIP/STP)within 1 year from the date of allotment of units,irrespective of the amount of investment – 1%;
ii) For redemptions / switch outs (including SIP/STP)after 1 year from the date of allotment of units,irrespective of the amount of investment – NIL;
iii) Any exit load charged (net off Service Tax, if any)shall be credited back to the Scheme;
iv) Units issued on reinvestment of dividends shall notbe subject to entry and exit load. (applicable for allplans)
About Kotak Infrastructure & Economic Reform Fund
�
�
The investment objective of the Scheme is to generate long-term capital appreciation from a diversified portfolio of
predominantly (at least 65%) equity and equity-related securities of companies involved in economic development of
India as a result of potential investments in infrastructure and unfolding economic reforms.
There is no assurance that the investment objective of the Scheme will be achieved.
Portfolio Action
• We believe investment cycle revival in India will be led by spending by government and this has been articulated well inthe government budget, while private developers following public investments with a lag. The current NCLTresolution plan will likely pave the way for private capex to pick up. However, there has been a delay compared to ourexpectations in the resolution of a few large NCLT cases.
• While investment cycle is gradually improving with revival in government capex, housing and private sector capex areyet to see meaningful traction.
• We continue to remain significantly invested in the “flow” of infrastructure theme (i.e. companies that benefit fromspending by various entities towards infrastructure creation) rather than “stock” or asset owners in the portfolio.
• We continue to invest along a range of these sectors to play overall improvement in investment cycle.
• We believe well managed companies in capital goods, cement, logistics, utilities and EPC companies will be largebeneficiaries with developers still reeling under regulatory uncertainties and/or large debt servicing.
• During the month, we reduced our exposure to construction, while increasing weight to cement sector.
Sector Allocation as on 31st July, 2018
Industrial Products 17.04
Gas 12.92
Cement 11.2
Industrial Capital Goods 10.43
Construction Project 8.19
Construction 7.27
Power 4.95
Chemicals 4.68
Auto Ancillaries 3.86
Ferrous Metals 3.82
Others 15.64
Equity Market Brief
• GST – landmark reform is now implemented, and over the last few months, the government has introduced further
changes to help the smaller firms navigate GST better. While there might be some near-term issues in implementing,
the longer term benefits are transformative. Most listed players will benefit, as they form the organised part of the
economy, especially once the e-way bill is introduced in totality and the reverse charge mechanism reduces scope of
under-invoicing by unorganised sector.
• After a prolonged period of under-delivery of Corporate Earnings, earnings are starting to improve across a broad
spectrum of sectors. Barring corporate banks and US focused pharma, most other sectors are witnessing improving
business momentum.
• India to benefit from such reforms which encourages formalisation of the economy in the medium-to-long-term,
significant flow from physical to financial savings to further provide stability to markets.
• Volatility across global equities have been on the lower side in 2017. Volatility is on the rise recently due to global
events - Fed hiking, crude oil price rally, trade wars like the flare-up between US and China. In India as well, as we
approach general elections, markets are likely to turn more volatile.
• As we approach general elections, it is important to understand that all events create a level of uncertainty. While
near-term uncertainty induces volatility in asset prices, in the long run, wealth creation in equities is a function as
how businesses can profitably grow over their cost of capital sustainably. Given the long-range of reforms introduced,
we believe longer-term prospects of Indian equities is quite encouraging and we would advise investors to benefit
from such induced volatility.
• Time in the market more important than timing the market – after a long period of lower volatility, markets volatility
may move up and investors can benefit from this volatility by focusing on disciplined investing and asset allocation.
Sector %
18

19
About Kotak Mutual Fund
Kotak Mahindra Asset Management
Company Limited (KMAMC) is a wholly
owned subsidiary of Kotak Mahindra Bank
Limited (KMBL). KMBL has over two decades
of experience in financial services. KMBL has a
market capitalization of 2490.915 bn as on
31st July, 2018). KMAMC is the Asset
Manager for Kotak Mahindra Mutual Fund
(KMMF). It started operations in December
1998. KMMF offers schemes catering to
investors with varying risk - return profiles and
was the first fund house in the country to
launch a dedicated gilt scheme. KMAMC
manages assets worth 1,29,948.48 cr as on
31st July 2018.
`
`
* The numbers are converted using the
Rupee- USD reference rate published by the
Reserve Bank of India as on the respective
dates.
To know more
Call : 1800-222-626 (Toll Free), Mumbai61152100, Delhi 66306900 / 02, Chennai28221333 / 45038171, Kolkata 64509802 /03, Pune 64013395 / 96, Ahmedabad26779888, Bangalore 66128050 / 51,Hyderabad 66178140 / 41.
Visit - assetmanagement.kotak.com
Email - [email protected]
Disclaimer
Kotak Infrastructure & Economic ReformFund
investment objective:
Mutual Fund investments are subject tomarket risks, read all scheme relateddocuments carefully. Scheme InformationDocument (SID) and Statement ofAdditional Information (SAI) available onmutualfund.kotak.com
investment objective of the Scheme isto generate long-term capital appreciationfrom a diversified portfolio of predominantly(at least 65%) equity and equity-relatedsecurities of companies involved in economicdevelopment of India as a result of potentialinvestments in infrastructure and unfoldingeconomic reforms. There is no assurance thatthe of the Schemewill be achieved.
An open ended equity schemefollowing Infrastructure & Economic Reformtheme.
Kotak Infrastructure & Economic Reform Fund(formerly known as “PineBridge Infrastructure & EconomicReform Fund)
Kotak Infrastructure & Economic Reform FundPerformance (%) as on 31st July, 2018
Date SchemeReturns TRI of 10000 in the
Scheme ( )Benchmark# ( ) Benchmark ## ( )
India Infrastructure Nifty 50 Current Value of Standard Investment
(%) ^ ## (%)* Additional
`
# (%)* ` `
Scheme Inception date is 25/02/2008. Mr. Harish Krishnan has been managing the fund since 01/02/2015.
Kotak Infrastructure & Economic Reform Fund
Index - customised
`index prepared byIISL
$
Since Inception 7.05 0.33 9.08 20,355 10,351 24,762
Last 1 Year -2.38 -5.46 14.20 9,762 9,454 11,420
Last 3 Years 8.08 2.93 11.42 12,626 10,907 13,834
Last 5 Years 22.94 10.52 16.03 28,103 16,493 21,038
This product is suitable for investors who are seeking*:
• Long term capital growth
• Long term capital appreciation by investing in equityand equity related instruments of companiescontributing to infrastructure and economicdevelopment of India
* Investors should consult their financial advisors if in doubtabout whether the product is suitable for them.Investors understand that their principal will
be at high risk
Riskometer
M
oderately Moderate
Low
Hig
h
Low
High
LOW HIGH
Moderately
Feb-28-2018 20.5820 0.63
Feb-23-2017 17.5640 0.50
June-23-2015 15.2601 0.50
Dividend History
Date CUM DividendNAV
Dividend( per unit)`
31 July, 2018st
Top 10 Holdings as on , 201831st July
Different plans have different expense structure. The performance details provided herein are of regular plan.
^Past performance may or may not be sustained in future.*All payouts during the period have been reinvested in the units of the scheme at thethen prevailing NAV. Returns > = 1 year: CAGR (Compounded Annualised Growth Rate). N.A stands for data not available. Note: Point to Point(PTP) Returns in INR shows the value of 10,000/- investment made at inception. Source: ICRA MFI Explorer. # Name of Scheme Benchmark. ##Name of Additional Benchmark. Please refer page no. 29 for other schemes managed by Mr. Harish Krishnan.
*TRI – Total Return Index
With effect from 1st February 2018, we are comparing the performances of the funds with the total return variant of the benchmark instead ofthe price return variant.
With Effect from 25th May 2018, the Benchmark is changed to India Infrastructure Index (Customised Index by IISL)$
Larsen And Toubro Ltd. Construction Project 5.15%
Shree Cement Ltd. Cement 4.49%
Indraprastha Gas Ltd. Gas 4.34%
GAIL (India) Ltd. Gas 3.87%
Solar Industries India Limited Chemicals 3.67%
Ultratech Cement Ltd. Cement 3.64%
Thermax Ltd. Industrial Capital Goods 3.48%
Schaeffler India Ltd Industrial Products 3.18%
Supreme Industries Limited Industrial Products 3.04%
Container Corporation of India Ltd. Transportation 3.00%
19

DEBT FUNDS

Kotak Low Duration Fund(formerly known as “PineBridge India Short Term Fund”)
31 July, 2018st
Scheme Facts
Structure
Month end AUM* (as on 31st July )
NAV (as on 31st July )
Launch Date
Benchmark
Min. Initial Inv.
Additional Inv.
Standard Deviation^
YTM
Portfolio Modified Duration
2018
2018
Average Maturity
An open ended low duration debt schemeinvesting in instruments such that theMacaulay duration of the portfolio is between6 months and 12 months
Growth Direct 2242.6174
Regular Dividend NA
Monthly Dividend Direct 1070.7584
Weekly Dividend Direct 1198.8766
Standard Growth 2167.9310
Standard Monthly Dividend 1021.8636
Standard Weekly Dividend 1014.4393
6th March, 2008
9.20%
0.84 years
*Source: MFI Explorer.
^ as on 31st July, 2018. Source: ValueResearch.
`
` `
` `
4,859.66 crs
`5,079.13 crs
`
`
`
`
`
`
5000 & in multiples of 1
1000 & in multiples of 1
0.72%
1.00 years
Monthly Average AUM*
Nifty Low Duration Debt Index
Load Structure
Entry Load:
Exit Load:
Nil
Nil
Any exit load charged (net off Service Tax, ifany) shall be credited back to the Scheme;
Note - Units issued on reinvestment ofdividends shall not be subject to entry and exitload.
About Kotak Low Duration Plan
�
�
The primary objective of the Scheme is to generate income through investment primarily in low duration debt &
money market securities.
There is no assurance or guarantee that the investment objective of the scheme will be achieved.
Portfolio Action
• Given the above outlook we intend to maintain the average maturity at the higher end of the indicated band.
• The focus is to enhance the portfolio yield while maintaining the liquidity and maturity of the portfolio in theindicated band.
• We intend to maintain the modified duration in the range of 0.60 – 1.00 in August 2018.
Asset Allocation as on , 201831st July
Debentures and Bonds 89.36%
Commercial Paper (CP)/Certificate of Deposits (CD) 7.72%
Net Current Assets 2.55%
CBLO & Term Deposits & Rev.Repo 0.37%
Debt Market Outlook
• Inadequate OMO announcements in the last quarter dashed market hopes for yield corrections. However,
recent correction in crude prices and CPI data beating market estimates triggered a rally in the yields.
• The benchmark 10-yr gilt started the month at 7.91% and ended at 7.77% while hitting an intra-month low
of 7.75%. We expect its levels to remain within 7.70-7.90% unless there are any material changes in oil prices,
inflation, government finances and currency.
• Long term bond yields are likely to remain range bound and will be guided largely by external factors such as
crude prices. We continue to remain bearish on SDL spreads.
• At its bi-monthly monetary policy announcement on Aug 1, 2018, RBI MPC hiked rates by 25 bps while
maintaining a neutral stance. Since the yield curve had already priced in 1 or 2 hikes, the hike did not impact
the markets adversely.
• We are in a range trading market and therefore we will keep trading the same with small exposures from time
to time.
• Going forward, we shall continue to monitor market developments closely and maintain conservative
portfolio durations. Our portfolio construct shall endeavour to minimize losses due to volatility.
Top 10 Companies as on 31st July, 2018
(^) Fully or Party blocked against Interest Rate Swap (IRS)
Particulars 31 Jul 2018
Avg. Maturity (in yrs) 1.00
Duration 0.84
Yield (in %) 9.20 8.98
30 Jun 2018
0.97
0.83
Macaulay Duration 0.91 0.90
U P Power Corporation Ltd (Guaranteed By UP State Government)(^) FITCH IND AA(SO) 8.13%
Bank Of Baroda (^) CARE AA 7.35%
S D Corporation Pvt. Ltd. ( DSRA Guarantee from Shapoorji Pallonji
and Company Private Limited) CARE AA+(SO) 6.75%
Piramal Enterprises Ltd. ICRA AA 5.64%
Manappuram Finance Ltd.(^) ICRA AA- 5.19%
Rent A Device Trust ( ) ICRA AAA(SO) 4.79%
Sarvoday Advisory Services Pvt. Ltd. ( Secured by
Equity shares of JSW Energy Ltd. and JSW Steel Ltd. )
BRICKWORKBWR A(SO) 4.34%
SVL Ltd ( Guaranteed by Shriram Transport Finance ) ICRA AA(SO) 4.16%
Edelweiss Commodities Services Ltd. ( Put options on ECL Finance)(^) ICRA AA 4.11%
Dewan Housing Finance Corporation Ltd. CARE AAA 3.73%
21

About Kotak Mutual Fund
Kotak Mahindra Asset Management
Company Limited (KMAMC) is a wholly
owned subsidiary of Kotak Mahindra Bank
Limited (KMBL). KMBL has over two decades
of experience in financial services. KMBL has a
market capitalization of 2490.915 bn as on
31st July, 2018). KMAMC is the Asset
Manager for Kotak Mahindra Mutual Fund
(KMMF). It started operations in December
1998. KMMF offers schemes catering to
investors with varying risk - return profiles and
was the first fund house in the country to
launch a dedicated gilt scheme. KMAMC
manages assets worth 1,29,948.48 cr as on
31st July 2018.
`
`
* The numbers are converted using the Rupee-
USD reference rate published by the Reserve
Bank of India as on the respective dates.
To know more
Call : 1800-222-626 (Toll Free), Mumbai61152100, Delhi 66306900 / 02, Chennai28221333 / 45038171, Kolkata 64509802 /03, Pune 64013395 / 96, Ahmedabad26779888, Bangalore 66128050 / 51,Hyderabad 66178140 / 41.
Visit - assetmanagement.kotak.com
Email - [email protected]
Disclaimer
Kotak Low Duration Fund
InvestmentObjective:
An open ended lowduration debt scheme investing in instruments suchthat the Macaulay duration of the portfolio isbetween 6 months and 12 months.
The primary objective of the Scheme is togenerate income through investment primarily inlow duration debt & money market securities. Thereis no assurance or guarantee that the investmentobjective of the scheme will be achieved.
Mutual Fund investments are subject to marketrisks, read all scheme related documentscarefully. Scheme Information Document (SID)and Statement of Additional Information (SAI)available on mutualfund.kotak.com
22
Kotak Low Duration Fund* Performance (%) as on 31st July, 2018
Different plans have different expense structure. The performance details provided herein are of regular plan.
^Past performance may or may not be sustained in future. *All payouts during the period have been reinvested in the units of thescheme at the then prevailing NAV. Returns > = 1 year: CAGR (Compounded Annualised Growth Rate). N.A stands for data notavailable. Note: Point to Point (PTP) Returns in INR shows the value of 10,000/- investment made at inception. Source: ICRA MFIExplorer. Classification of schemes in short term & long term is based on the average maturity of the scheme. # Name of SchemeBenchmark. ## Name of Additional Benchmark. Please refer page no. 29 for top 3 and bottom 3 schemes managed by Mr. DeepakAgrawal.
`
We are comparing the performances of the funds with the total return Index.
With Effect from 1st June 2018, the Benchmark is changed to Nifty Low Duration Debt Index from Crisil Liquid Fund.$
Since Inception 7.72 8.53 6.41 21,679 23,446 19,087
Last 1 Year 6.56 6.58 5.69 10,656 10,658 10,569
Last 3 Years 7.95 7.48 6.57 12,582 12,419 12,106
Last 5 Years 8.54 8.43 7.36 15,066 14,995 14,268
Scheme Inception date is 06/03/2008. Mr. Deepak Agrawal has been managing the fund since 01/02/2015.
Rating Profile as on 31st July, 2018
Kotak Low Duration Fund
Current Value of Standard Investmentof 10000 in the`
CRISIL 1 YearT-Bill Index
## (%)
Nifty LowDuration
# (%)Debt Index
$
SchemeReturns(%) ^
Date
Scheme( )`
Benchmark# ( )`
AdditionalBenchmark ## ( )`
Kotak Low Duration Fund(formerly known as )“PineBridge India Short Term Fund”
31 July, 2018st
This product is suitable for investors who are seeking*:
• Regular income over short term
• Income by focusing on low duration securities
* Investors should consult their financial advisors if in doubtabout whether the product is suitable for them.
Investors understand that their principal willbe at moderate risk
Riskometer
M
oderately Moderate
Low
Hig
h
Low
High
LOW HIGH
Moderately
68.52
17.89
10.67
2.55
0.37
A1, AA+, AA+(SO), AA, AA(SO), IND AA(SO),AA-, AA- (SO), BWR AA-(SO)
A1+, A1+(SO), AAA, AAA(SO), IND AAA
A+, A+(SO), A, BWR A(SO)
Net Current Assets
CBLO & Term Deposits & Rev.Repo

Kotak Credit Risk31 July, 2018st
Scheme Facts
Structure
Month end AUM* (as on 31st July )
NAV (as on 31st July 2018)
Benchmark
Min. Initial Inv.
Additional Inv.
Standard Deviation^
YTM
Portfolio Modified Duration
2018
Launch Date
Average Maturity
An open ended debt scheme predominantlyinvesting in AA and below rated corporatebonds (Excluding AA+ rated corporate bonds)
Annual Dividend Direct 15.3373
Monthly Dividend Direct 10.5700
Quarterly Dividend Direct 10.2363
Weekly Dividend Direct 10.4354
Growth Direct 20.4187
Annual Dividend 10.4534
Monthly Dividend 10.3469
Quarterly Dividend 10.8532
Weekly Dividend 10.0113
Growth 19.4035
5000/-
1.31%
9.71%
1.77 years
*Source: MFI Explorer.
^ as on 31st July, 2018. Source: ValueResearch.
`
`
5,286.32 crs
`
` `
5,246.40 crs
`
`
`
`
`
`
`
`
`
`
11 May 2010
1000 & in multiples of 1
2.29 years
th
CRISIL Composite AA Short Term Bond Index
Monthly Average AUM*
Load Structure
Entry Load:Exit Load:
Nil) For redemption / switch out of upto
10% of the initial investment amount (limit)purchased or switched in within 1 year from thedate of allotment: Nil.ii) If units redeemed or switched out are inexcess of the limit within 1 year from the date ofallotment: 1%.iii) If units are redeemed or switched out on orafter 1 year from the date of allotment: Nil.iv) Any exit load charged (net off Service Tax, ifany) shall be credited back to the respectiveScheme. Units issued on reinvestment ofdividends shall not be subject to entry and exitload.
i
About Kotak Credit Risk
�
�
�
�
�
The investment objective of Kotak Credit Risk is to generate income by investing in debt and money market
securities across the yield curve and credit spectrum.
The scheme would also seek to maintain reasonable liquidity within the fund.
The scheme invests in securities offering high accrual by taking on a marginally higher credit risk.
The fund manager may also seek to capitalize on opportunity of potential credit rating upgrades from time to
time.
The scheme is suitable for investors with a time horizon of 15 months plus.
Portfolio Action
• Given the above outlook we intend to maintain the average maturity at the higher end of the indicated band.
• The endeavour is to enhance the portfolio yield by either selling low yielding assets to buy high yielding assetsor by utilising the cash to acquire high yielding assets.
• We intend to maintain the modified duration in the range of 1.40 – 2.25 in August 2018.
Asset Allocation as on 31st July, 2018
Debentures and Bonds 95.69%
Commercial Paper (CP)/Certificate of Deposits (CD) 4.30%
CBLO & Term Deposits & Rev.Repo 0.25%
Net Current Assets -0.24%
Debt Market Outlook
Top 10 Companies as on 31st July, 2018
• Inadequate OMO announcements in the last quarter dashed market hopes for yield corrections. However,recent correction in crude prices and CPI data beating market estimates triggered a rally in the yields.
• The benchmark 10-yr gilt started the month at 7.91% and ended at 7.77% while hitting an intra-month lowof 7.75%. We expect its levels to remain within 7.70-7.90% unless there are any material changes in oil prices,inflation, government finances and currency.
• Long term bond yields are likely to remain range bound and will be guided largely by external factors such ascrude prices. We continue to remain bearish on SDL spreads.
• At its bi-monthly monetary policy announcement on Aug 1, 2018, RBI MPC hiked rates by 25 bps whilemaintaining a neutral stance. Since the yield curve had already priced in 1 or 2 hikes, the hike did not impactthe markets adversely.
• We are in a range trading market and therefore we will keep trading the same with small exposures from timeto time.
• Going forward, we shall continue to monitor market developments closely and maintain conservativeportfolio durations. Our portfolio construct shall endeavour to minimize losses due to volatility.
Particulars 31 Jul 2018
Avg. Maturity (in yrs) 2.29
Duration 1.77 1.66
Yield (in %) 9.71 9.75
30 Jun 2018
3.02
Macaulay Duration 1.91 1.80
U P Power Corporation Ltd ( Guaranteed By UP State Government) CRISIL A+(SO) 8.33%
Karelides Traders Pvt. Ltd. ( backed by unconditional and irrevocable
undertaking by a wholly owned subsidiary of Piramal Enterprises Ltd) ICRA AA-(SO) 6.42%
Andhra Bank CARE A+ 4.72%
Sarvoday Advisory Services Pvt. Ltd. (Secured by Equity
shares of JSW Energy Ltd. and JSW Steel Ltd.)
BRICKWORK
4.00%
Reliance Jio Infocomm Ltd. CRISIL AAA 3.81%
Talwandi Sabo Power Ltd. (Guaranteed by Vedanta Ltd) CRISIL AA(SO) 3.78%
Suhani Trading and Investment Consultants Pvt Ltd (Secured by Equity
shares of Future Ratails Ltd & Future Lifestyle Fashions Ltd.)
BRICKWORK
3.76%
Aasan Corporate Solutions Pvt. Ltd. (Guaranteed by a
Piramal Group Company) ICRA AA-(SO) 3.50%
HPCL Mittal Energy Ltd. ICRA AA 3.17%
Muthoot Finance Ltd. CRISIL AA 2.75%
BWR A(SO)
BWR A+(SO)
23
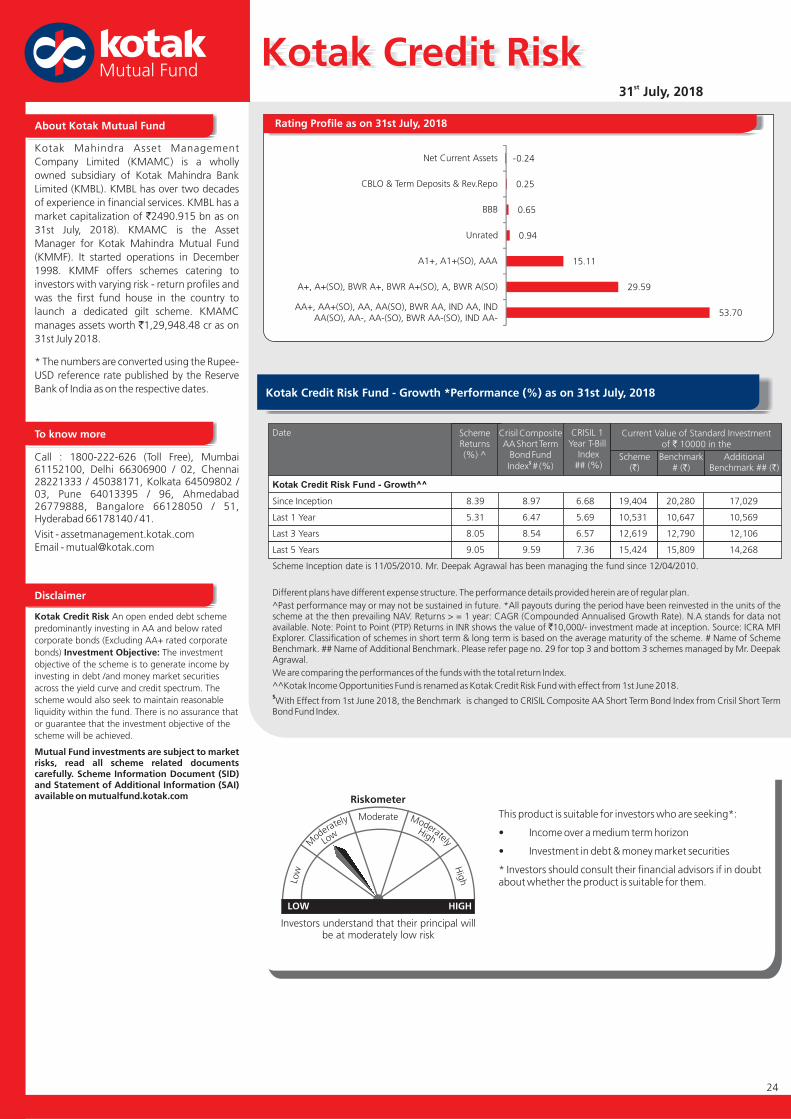
31 July, 2018st
About Kotak Mutual Fund
Kotak Mahindra Asset Management
Company Limited (KMAMC) is a wholly
owned subsidiary of Kotak Mahindra Bank
Limited (KMBL). KMBL has over two decades
of experience in financial services. KMBL has a
market capitalization of 2490.915 bn as on
31st July, 2018). KMAMC is the Asset
Manager for Kotak Mahindra Mutual Fund
(KMMF). It started operations in December
1998. KMMF offers schemes catering to
investors with varying risk - return profiles and
was the first fund house in the country to
launch a dedicated gilt scheme. KMAMC
manages assets worth 1,29,948.48 cr as on
31st July 2018.
`
`
* The numbers are converted using the Rupee-
USD reference rate published by the Reserve
Bank of India as on the respective dates.
To know more
Call : 1800-222-626 (Toll Free), Mumbai61152100, Delhi 66306900 / 02, Chennai28221333 / 45038171, Kolkata 64509802 /03, Pune 64013395 / 96, Ahmedabad26779888, Bangalore 66128050 / 51,Hyderabad 66178140 / 41.
Visit - assetmanagement.kotak.comEmail - [email protected]
Disclaimer
Kotak Credit Risk
Investment Objective:
An open ended debt scheme
predominantly investing in AA and below rated
corporate bonds (Excluding AA+ rated corporate
bonds) The investment
objective of the scheme is to generate income by
investing in debt /and money market securities
across the yield curve and credit spectrum. The
scheme would also seek to maintain reasonable
liquidity within the fund. There is no assurance that
or guarantee that the investment objective of the
scheme will be achieved.
Mutual Fund investments are subject to marketrisks, read all scheme related documentscarefully. Scheme Information Document (SID)and Statement of Additional Information (SAI)available on mutualfund.kotak.com
Kotak Credit Risk Fund - Growth *Performance (%) as on 31st July, 2018
Different plans have different expense structure. The performance details provided herein are of regular plan.
^Past performance may or may not be sustained in future. *All payouts during the period have been reinvested in the units of thescheme at the then prevailing NAV. Returns > = 1 year: CAGR (Compounded Annualised Growth Rate). N.A stands for data notavailable. Note: Point to Point (PTP) Returns in INR shows the value of 10,000/- investment made at inception. Source: ICRA MFIExplorer. Classification of schemes in short term & long term is based on the average maturity of the scheme. # Name of SchemeBenchmark. ## Name of Additional Benchmark. Please refer page no. 29 for top 3 and bottom 3 schemes managed by Mr. DeepakAgrawal.
`
We are comparing the performances of the funds with the total return Index.
^^Kotak Income Opportunities Fund is renamed as Kotak Credit Risk Fund with effect from 1st June 2018.
With Effect from 1st June 2018, the Benchmark is changed to CRISIL Composite AA Short Term Bond Index from Crisil Short TermBond Fund Index.
$
Since Inception 8.39 8.97 6.68 19,404 20,280 17,029
Last 1 Year 5.31 6.47 5.69 10,531 10,647 10,569
Last 3 Years 8.05 8.54 6.57 12,619 12,790 12,106
Last 5 Years 9.05 9.59 7.36 15,424 15,809 14,268
Scheme Inception date is 11/05/2010. Mr. Deepak Agrawal has been managing the fund since 12/04/2010.
Rating Profile as on 31st July, 2018
Kotak Credit Risk Fund - Growth^^
Current Value of Standard Investmentof 10000 in the`
CRISIL 1Year T-Bill
Index## (%)
Crisil CompositeTerm
BondFundIndex # (%)
AAShort
$
SchemeReturns(%) ^
Date
Scheme( )`
Benchmark# ( )`
AdditionalBenchmark ## ( )`
Kotak Credit Risk
This product is suitable for investors who are seeking*:
• Income over a medium term horizon
• Investment in debt & money market securities
* Investors should consult their financial advisors if in doubtabout whether the product is suitable for them.
Investors understand that their principal willbe at moderately low risk
Riskometer
M
oderately Moderate
Low
Hig
h
Low
High
LOW HIGH
Moderately
53.70
29.59
15.11
0.94
0.65
0.25
-0.24
AA+, AA+(SO), AA, AA(SO), BWR AA, IND AA, INDAA(SO), AA-, AA-(SO), BWR AA-(SO), IND AA-
A+, A+(SO), BWR A+, BWR A+(SO), A, BWR A(SO)
A1+, A1+(SO), AAA
Unrated
BBB
CBLO & Term Deposits & Rev.Repo
Net Current Assets
24

Kotak Medium Term Fund31 July, 2018st
Scheme Facts
Structure
Launch Date
Benchmark
Min. Initial Inv.
Additional Inv.
Standard Deviation^
YTM
Portfolio Modified Duration
Month end AUM* (as on 31st July )
NAV (as on 2018)
2018
31st July
Average Maturity
An open ended medium term debt schemeinvesting in instruments such that theMacaulay duration of the portfolio is between3 years and 4 years
Quarterly Dividend 10.7135
Quarterly Dividend Direct 10.7326
Annual Dividend 10.6448
Annual Dividend Direct 15.2182
Growth 14.5814
Growth Direct 15.1814
21st March, 2014
9.60%
2.24 years
*Source: MFI Explorer.
^ as on 31st July, 2018. Source: ValueResearch.
`
` `
` `
crs4,652.56
`4,671.24 crs
`
`
`
`
`
`
5000 & in multiples of 1
1000 & in multiples of 1
1.80%
2.96 years
Monthly Average AUM*
Nifty Medium Duration Index
Load Structure
Entry Load:
Exit Load:
Nil
i) For redemption / switch out ofupto 15% of the initial investment amount(limit) purchased or switched in within 18months from the date of allotment: Nil.
ii) If units redeemed or switched out are inexcess of the limit within 18 months from thedate of allotment: 2%.
iii) If units are redeemed or switched out on orafter 18 months from the date of allotment:Nil.
iv) Any exit load charged (net off Service Tax ifany) shall be credited back to the respectiveScheme. Units issued on reinvestment ofdividends shall not be subject to entry and exitload.
Top 10 Companies as on 31st July, 2018
Asset Allocation as on , 201831st July
Debentures and Bonds 96.12%
Net Current Assets 2.77%
Unrated 0.56%
Government Dated Securities 0.32%
CBLO & Term Deposits & Rev.Repo 0.12%
Commercial Paper (CP)/Certificate of Deposits (CD) 0.11%
About Kotak Medium Term Plan
�
�
�
�
�
Kotak Medium Term Fund, an open-ended debt scheme.
The investment objective of the scheme is to generate regular income and capital appreciation by investing in a
portfolio of medium term debt and money market instruments.
The fund has an average maturity floor of around 3 years and a ceiling of around 7 years.
As a result, the fund occupies a mid-segment space between the long duration and the short duration bonds.
Likewise, the fund's merits also tend to be a balance of the long term and the short term bond funds.
The fund operates largely on a Hold-Till-Maturity (HTM) strategy.
Portfolio Action
• Given the above outlook we intend to maintain the average maturity at the higher end of the indicated band.
• The endeavour is to enhance the portfolio yield by either selling low yield assets or buying high yielding assetsby utilising the cash.
• We intend to maintain a modified duration in the range of 2.00 – 2.40 in August 2018.
Debt Market Outlook
• Inadequate OMO announcements in the last quarter dashed market hopes for yield corrections. However,
recent correction in crude prices and CPI data beating market estimates triggered a rally in the yields.
• The benchmark 10-yr gilt started the month at 7.91% and ended at 7.77% while hitting an intra-month low
of 7.75%. We expect its levels to remain within 7.70-7.90% unless there are any material changes in oil prices,
inflation, government finances and currency.
• Long term bond yields are likely to remain range bound and will be guided largely by external factors such as
crude prices. We continue to remain bearish on SDL spreads.
• At its bi-monthly monetary policy announcement on Aug 1, 2018, RBI MPC hiked rates by 25 bps while
maintaining a neutral stance. Since the yield curve had already priced in 1 or 2 hikes, the hike did not impact
the markets adversely.
• We are in a range trading market and therefore we will keep trading the same with small exposures from time
to time.
• Going forward, we shall continue to monitor market developments closely and maintain conservative
portfolio durations. Our portfolio construct shall endeavour to minimize losses due to volatility.
Particulars 31 Jul 2018
Avg. Maturity (in yrs) 2.96
Duration 2.24
Yield (in %) 9.60
30 Jun 2018
3.17
2.15
9.69
Macaulay Duration 2.44 2.33
Karelides Traders Pvt. Ltd. ( backed by unconditional and irrevocableundertaking by a wholly owned subsidiary of Piramal Enterprises Ltd ) ICRA AA-(SO) 6.64%
Reliance Jio Infocomm Ltd. CRISIL AAA 6.23%
Punjab National Bank FITCH IND A+ 5.64%
Edelweiss Commodities Services Ltd. ( Put options on ECL Finance) ICRA AA 5.20%
U P Power Corporation Ltd ( Guaranteed By UP State Government ) FITCH IND AA(SO) 5.09%
Punjab & Sind Bank ICRA A+ 3.87%
HPCL Mittal Energy Ltd. ICRA AA 3.75%
U P Power Corporation Ltd ( Guaranteed By UP State Government ) CRISIL A+(SO) 3.66%
PNB Housing Finance Ltd. CARE AAA 3.54%
Sikka Ports & Terminals Ltd. ( Mukesh Ambani Group ) CRISIL AAA 3.48%
25

About Kotak Mutual Fund
Kotak Mahindra Asset Management
Company Limited (KMAMC) is a wholly
owned subsidiary of Kotak Mahindra Bank
Limited (KMBL). KMBL has over two decades
of experience in financial services. KMBL has a
market capitalization of 2490.915 bn as on
31st July, 2018). KMAMC is the Asset
Manager for Kotak Mahindra Mutual Fund
(KMMF). It started operations in December
1998. KMMF offers schemes catering to
investors with varying risk - return profiles and
was the first fund house in the country to
launch a dedicated gilt scheme. KMAMC
manages assets worth 1,29,948.48 cr as on
31st July 2018.
`
`
* The numbers are converted using the Rupee-
USD reference rate published by the Reserve
Bank of India as on the respective dates.
To know more
Call : 1800-222-626 (Toll Free), Mumbai61152100, Delhi 66306900 / 02, Chennai28221333 / 45038171, Kolkata 64509802 /03, Pune 64013395 / 96, Ahmedabad26779888, Bangalore 66128050 / 51,Hyderabad 66178140 / 41.
Visit - assetmanagement.kotak.com
Email - [email protected]
Disclaimer
Kotak Medium Term Fund
Investment objective:
An open endedmedium term debt scheme investing ininstruments such that the Macaulay durationof the portfolio is between 3 years and 4 years.
of the scheme is togenerate regular income and capitalappreciation by investing in a portfolio ofmedium term debt and money marketinstruments. There is no assurance orguarantee that the investment objective of thescheme will be achieved.
Mutual Fund investments are subject tomarket risks, read all scheme relateddocuments carefully. Scheme InformationDocument (SID) and Statement ofAdditional Information (SAI) available onmutualfund.kotak.com
Kotak Medium Term Fund *Performance (%) as on 31st July, 2018
Different plans have different expense structure. The performance details provided herein are of regular plan.
^Past performance may or may not be sustained in future. *All payouts during the period have been reinvested in the units of thescheme at the then prevailing NAV. Returns > = 1 year: CAGR (Compounded Annualised Growth Rate). N.A stands for data notavailable. Note: Point to Point (PTP) Returns in INR shows the value of 10,000/- investment made at inception. Source: ICRA MFIExplorer. Classification of schemes in short term & long term is based on the average maturity of the scheme. # Name of SchemeBenchmark. ## Name of Additional Benchmark. Please refer page no. 29 for top 3 and bottom 3 schemes managed by Mr. DeepakAgrawal.
`
We are comparing the performances of the funds with the total return Index.
With Effect from 1st June 2018, the Benchmark is changed to Nifty Medium Duration Index from Crisil Composite Bond FundIndex.
$
Rating Profile as on 31st July, 2018
Kotak Medium Term Fund
Current Value of Standard Investmentof 10000 in the`
CRISIL 10 YRGilt Index## (%)
NiftyMediumDuration
Index # (%)$
SchemeReturns(%) ^
Date
Scheme( )`
Benchmark# ( )`
AdditionalBenchmark ## ( )`
Kotak Medium Term Fund
This product is suitable for investors who are seeking*:
• Income over a medium term investment horizon
• Investment in debt, government securities & moneymarket instruments with a portfolio weightedaverage maturity between 3-7 years
* Investors should consult their financial advisors if in doubtabout whether the product is suitable for them.
Investors understand that their principal willbe at moderate risk
Riskometer
M
oderately Moderate
Low
Hig
h
Low
High
LOW HIGH
Moderately
31 July, 2018st
Since Inception 9.03 8.47 7.68 14,581 14,262 13,814
Last 1 Year 4.69 2.85 -2.90 10,469 10,285 9,710
Last 3 Years 7.99 7.31 6.01 12,598 12,361 11,916
Scheme Inception date is 21/03/2014. Mr. Deepak Agrawal has been managing the fund since 22/06/2015.
The scheme has been in existence for less than 5 years.
49.34
25.62
20.2
2.77
1.63
0.32
0.12
AA+, AA+(SO), AA, AA(SO), BWR AA, IND AA, INDAA(SO), AA-, AA-(SO), BWR AA-(SO), IND AA-
A1+, AAA, AAA(SO), IND AAA, SOV
A+, A+(SO), BWR A+, BWR A+(SO), IND A+
Net Current Assets
Unrated
BBB
CBLO & Term Deposits & Rev.Repo
26

Kotak Bond Short Term31 July, 2018st
Scheme Facts
Structure
Month end AUM* (as on 31st July 2018)
NAV (as on 31st July 2018)
Launch Date
Benchmark
Min. Initial Inv.
Additional Inv.
Standard Deviation^
YTM
Portfolio Modified Duration
Average Maturity
An open ended short term debt schemeinvesting in instruments such that theMacaulay duration of the portfolio is between1 year and 3 years
8,377.39 crs
8,416.65 crs
Dividend 10.1195
Dividend Direct 10.8435
Half Yearly Dividend 11.9969
Half Yearly Dividend Direct 12.1694
Growth 32.8938
Growth Direct 34.2495
2nd May, 2002
(a) Dividend Re-investment & Growth -5000 & above (b) Dividend Payout (Monthly
Dividend) - 50,000& above
1000 & in multiples of 1
1.20%
8.43%
1.74 years
2.04 years
*Source: MFI Explorer.
^ as on 31st July, 2018. Source: ICRA MFIExplorer. Standard Deviation is calculated onAnnualised basis using 3 years history ofmonthly returns.
`
`
`
`
` `
Monthly Average AUM*
`
`
`
`
`
`
Nifty Short Duration Index
Load Structure
Entry Load:
Exit Load:
Nil
Nil
About Kotak Bond Short Term
�
�
The investment objective of Kotak Bond Short Term is to provide reasonable returns and high level of liquidity by
investing in debt and money market instruments of different maturities so as to spread the risk across different
kind of issuers in the debt market.
The scheme is suitable for investors who may generally want to position themselves at the shorter end of the yield
curve with a time horizon of 6 months and more.
Portfolio Action
• As on July 2018 end, the portfolio duration stood at 1.74 years; we have maintained duration of the fund in
the middle of the matrix.
• Currently, ~58% of the portfolio has a residual maturity of less than 2 years. Of the balance, ~22% is invested
in 2–5 years corporate bonds and ~20% is invested majorly in 3-5 yr central and state government securities.
• 100% of the portfolio is invested in government securities and in AAA or equivalent rated securities.
• We intend to run the duration of the fund in the band of 1.5 - 1.9 years in the month of August 2018.
Asset Allocation as on 31st July, 2018
Debentures and Bonds 76.39%
Government Dated Securities 20.29%
Net Current Assets 3.28%
CBLO & Term Deposits & Rev.Repo 0.04%
Debt Market Outlook
• Inadequate OMO announcements in the last quarter dashed market hopes for yield corrections. However,
recent correction in crude prices and CPI data beating market estimates triggered a rally in the yields.
• The benchmark 10-yr gilt started the month at 7.91% and ended at 7.77% while hitting an intra-month low
of 7.75%. We expect its levels to remain within 7.70-7.90% unless there are any material changes in oil prices,
inflation, government finances and currency.
• Long term bond yields are likely to remain range bound and will be guided largely by external factors such as
crude prices. We continue to remain bearish on SDL spreads.
• At its bi-monthly monetary policy announcement on Aug 1, 2018, RBI MPC hiked rates by 25 bps while
maintaining a neutral stance. Since the yield curve had already priced in 1 or 2 hikes, the hike did not impact
the markets adversely.
• We are in a range trading market and therefore we will keep trading the same with small exposures from time
to time.
• Going forward, we shall continue to monitor market developments closely and maintain conservative
portfolio durations. Our portfolio construct shall endeavour to minimize losses due to volatility.
Particulars 31 Jul 2018
Avg. Maturity (in yrs) 2.04
Duration 1.74
Yield (in %) 8.43 8
30 Jun 2018
Macaulay Duration 1.85 1.83
2.03
1.72
.47
27

31 July, 2018st
About Kotak Mutual Fund
Kotak Mahindra Asset Management
Company Limited (KMAMC) is a wholly
owned subsidiary of Kotak Mahindra Bank
Limited (KMBL). KMBL has over two decades
of experience in financial services. KMBL has a
market capitalization of 2490.915 bn as on
31st July, 2018). KMAMC is the Asset
Manager for Kotak Mahindra Mutual Fund
(KMMF). It started operations in December
1998. KMMF offers schemes catering to
investors with varying risk - return profiles and
was the first fund house in the country to
launch a dedicated gilt scheme. KMAMC
manages assets worth 1,29,948.48 cr as on
31st July 2018.
`
`
* The numbers are converted using the Rupee-
USD reference rate published by the Reserve
Bank of India as on the respective dates.
To know more
Call : 1800-222-626 (Toll Free), Mumbai61152100, Delhi 66306900 / 02, Chennai28221333 / 45038171, Kolkata 64509802 /03, Pune 64013395 / 96, Ahmedabad26779888, Bangalore 66128050 / 51,Hyderabad 66178140 / 41.
Visit - assetmanagement.kotak.com
Email - [email protected]
Disclaimer
Kotak Bond Short Term is
Investment Objective:
An open ended short
term debt scheme. The
investment objective of the Scheme is to provide
reasonable returns and high level of liquidity by
investing in debt instruments such as bonds,
debentures and Government securities; and money
market instrume nts such as treasury bills,commercial
papers, certificates of deposit, including repos in
permitted securities of different maturities, so as to
spread the risk across different kinds of issuers in the
debt markets. The Schememay invest in the call
money/termmoney market in terms of RBI guidelines
in this respect. To reduce the risk of the portfolio, the
Scheme may also use various derivative and hedging
products from time to time, in the manner permitted
by SEBI.Subject to the maximum amount permitted
from time to time, the Scheme may invest in offshore
securities in the manner allowed by SEBI/RBI,
provided such investments are in conformity with the
investment objective of the Scheme and the
prevailing guidelines and Regulations.There is no
assurance that the investment objective of the
Scheme will be realised.
Mutual Fund investments are subject to market
risks, read all scheme related documents
carefully. Scheme Information Document (SID)
and Statement of Additional Information (SAI)
available on mutualfund.kotak.com
Kotak Bond Short Term
Kotak Bond Short Term* Performance (%) as on 31st July, 2018
Different plans have different expense structure. The performance details provided herein are of regular plan.
^Past performance may or may not be sustained in future. *All payouts during the period have been reinvested in the units of thescheme at the then prevailing NAV. Returns > = 1 year: CAGR (Compounded Annualised Growth Rate). N.A stands for data notavailable. Note: Point to Point (PTP) Returns in INR shows the value of 10,000/- investment made at inception. Source: ICRA MFIExplorer. Classification of schemes in short term & long term is based on the average maturity of the scheme. # Name of SchemeBenchmark. ## Name of Additional Benchmark. Please refer page no. 29 for top 3 and bottom 3 schemes managed by Mr. DeepakAgrawal.
`
We are comparing the performances of the funds with the total return Index.
With Effect from 1st June 2018, the Benchmark is changed to Nifty Short Duration Index from Crisil Short Term Bond Fund Index.$
Since Inception 7.60 7.81 5.95 32,894 33,963 25,605
Last 1 Year 4.32 5.02 5.69 10,432 10,502 10,569
Last 3 Years 7.07 7.42 6.57 12,277 12,398 12,106
Last 5 Years 8.16 8.56 7.36 14,803 15,082 14,268
Scheme Inception date is 02/05/2002. Mr. Deepak Agrawal has been managing the fund since 11/07/2007.
Kotak Bond Short Term - Growth
Current Value of Standard Investmentof 10000 in the`
CRISIL 1Year
T-Bill Index## (%)
Nifty ShortDuration
Index(%)
$
#
SchemeReturns(%) ^
Date
Scheme( )`
Benchmark# ( )`
AdditionalBenchmark ## ( )`
This product is suitable for investors who are seeking*:
• Income over a medium term horizon
• Investment in debt & money market securities
* Investors should consult their financial advisors if in doubtabout whether the product is suitable for them.
Investors understand that their principal willbe at moderately low risk
Riskometer
M
oderately Moderate
Low
Hig
h
Low
High
LOW HIGH
ModeratelyRating Profile as on 31st July, 2018
Top 10 Companies as on 31st July, 2018
Power Finance Corporation Ltd. CRISIL AAA 10.08%
6.84% Central Government SOV 9.39%
HDFC Ltd. CRISIL AAA 8.79%
Nabha Power Ltd. ( backed by unconditional and
irrevocable guarantee by Larsen & Toubro Ltd ) ICRA AAA 7.61%
LIC Housing Finance Ltd. CRISIL AAA 5.88%
Small Industries Development Bank Of India CARE AAA 4.72%
Kotak Mahindra Prime Ltd. CRISIL AAA 4.37%
Mahindra & Mahindra Financial Services Ltd. FITCH IND AAA 4.37%
Indiabulls Housing Finance Ltd. CARE AAA 3.76%
8.21% State Government SOV 3.08%
96.68
3.28
0.04
AAA, AAA(SO), IND AAA, IND AAA(SO), SOV
Net Current Assets
CBLO & Term Deposits & Rev.Repo
28

Top 3 Funds Managed by Mr. Abhishek Bisen**
Kotak GlobalEmergingMarket Fund -Growth ()^ 15.38 6.21 5.27 16,710 4.84 26/09/07
MSCIEmergingMarket index # () 8.79 8.86 5.21 15,876 4.35
Nifty50 TRI## () 14.20 11.42 16.03 26,138 9.26
Kotak Gold Fund - Growth () ^ 3.24 4.72 -0.81 12,435 3.01 25/03/11
Price of Gold # () 3.02 6.17 0.82 14,075 4.76
CRISIL 10 Year Gilt ## () -2.90 6.01 6.49 15,591 6.22
Kotak DebtHybrid ()^ 2.31 8.19 10.83 29,885 7.75 02/12/03
CRISILHybrid85+15 -Conservative Index# () 3.16 8.33 10.29 31,781 8.20
CRISIL10 YearGilt ## () -2.90 6.01 6.49 21,129 5.23
29
Current Value ofInvestment of
10000 in the`
Other Mr. Pankaj Tibrewal#Funds managed by
Other Funds managed by Mr. Harish Krishnan$
Annexure - Returns(Fund Manager wise)
1 Year 3 Years 5 Years
Scheme Name Absolute Returns (%) CAGR Returns (%) CAGR Returns (%)
Inceptiondate
Since inception
CAGR
Returns(%)
Top 3 Funds Managed by Mr. Deepak Agarwal*
Top 3 Funds Managed by Mr. Deepak Gupta^
Bottom 3 Funds Managed by Mr. Deepak Gupta^^
Bottom 3 Funds Managed by Mr. Deepak Agarwal*
Kotak Smallcap Fund - Growth () ^ 0.93 10.80 25.94 74,690 16.14 24/02/05
NIFTY Smallcap 50 TRI # () -12.09 6.28 23.67 NA NA
Nifty 50 TRI ## () 14.20 11.42 16.03 65,521 15.01
Kotak Bluechip Fund () ^ 9.14 9.24 17.52 316,862 19.28 29/12/98
Nifty 50 TRI # () 14.20 11.42 16.03 171,656 15.61
S&P BSE SENSEX TRI ## () 16.97 11.61 15.80 144,966 14.62
KotakNV20 ETF () ^ 20.22 NA NA 15,928 19.08 01/12/15
Nifty50 Value20 TRI# () 20.79 NA NA 15,237 17.12
Nifty50 TRI ## () 14.20 NA NA 14,804 15.85
Kotak USEquityFund -Growth () ^ 18.53 11.11 NA 16,145 10.94 20/12/13
S&P500 International Total ReturnNet Index# () 24.00 15.07 NA 18,815 14.68
Nifty50 TRI## () 14.20 11.42 NA 19,192 15.18
Kotak SensexETF () ^ 16.63 11.29 15.37 26,787 10.19 06/06/08
S&PBSESENSEX TRI# () 16.97 11.61 15.80 28,020 10.68
Nifty50 TRI## () 14.20 11.42 16.03 27,776 10.58
Kotak World Gold Fund - Growth () ^ -6.47 10.88 -2.72 8,479 -1.61 06/06/08
Financial Times Gold Mines Total - Price # () -2.77 20.24 0.34 8,108 -2.04
Nifty 50 TRI ## () 14.20 11.42 16.03 27,776 10.58
Kotak Asset Allocator Fund - Growth () ^ 3.69 8.71 16.68 77,162 15.73 09/08/04
NIFTY 50 Hybrid Composite Debt 50:50 Index # () 7.86 9.46 12.40 50,727 12.31
S&P BSE SENSEX TRI ## () 16.97 11.61 15.80 84,386 16.48
Kotak PSU Bank ETF () ^ -14.76 -2.23 6.73 13,111 2.56 08/11/07
Nifty PSU Bank TRI # () -14.41 -1.74 7.18 13,080 2.53
Nifty 50 TRI ## () 14.20 11.42 16.03 22,649 7.91
Kotak Money Market Scheme - Growth () ^ 6.96 7.30 8.09 29,118 7.36 14/07/03
NIFTY Money Market Index # () 6.76 7.29 8.25 30,251 7.63
CRISIL 1 Year TBill ## () 5.69 6.57 7.36 23,780 5.92
Kotak Liquid - Regular Plan - Growth () ^ 6.96 7.25 8.06 28,821 7.44 04/11/03
NIFTY Liquid Index # () 6.82 7.06 7.96 28,880 7.46
CRISIL 1 Year TBill ## () 5.69 6.57 7.36 23,404 5.94
Kotak Savings Fund - Growth () ^ 6.49 7.42 8.32 28,420 7.76 13/08/04
NIFTY Ultra Short Duration Debt Index # () 7.21 7.56 8.46 30,035 8.19
CRISIL 1 Year TBill ## () 5.69 6.57 7.36 22,693 6.04
Kotak Corporate Bond Fund - Growth () ^ 6.31 7.77 8.63 23,336 8.11 21/09/07
CRISIL Corporate Bond Fund Index # () 3.26 8.14 9.39 26,508 9.39
CRISIL 1 Year TBill ## () 5.69 6.57 7.36 19,558 6.37
Kotak Banking and PSU Debt Fund - Growth () ^ 4.41 7.46 8.70 39,705 7.29 29/12/98
CRISIL Banking and PSU Debt Index # () 4.96 7.92 9.15 NA NA
CRISIL 1 Year TBill ## () 5.69 6.57 7.36 34,999 6.60
Kotak Dynamic Bond Fund - Growth () ^ 3.46 8.41 8.80 22,507 8.29 26/05/08
NIFTY Composite Debt Index # () 1.40 7.03 8.42 22,002 8.05
CRISIL 1 Year TBill ## () 5.69 6.57 7.36 18,819 6.40

30
Current Value ofInvestment of
10000 in the`
Annexure - Returns(Fund Manager wise)
Scheme Name Absolute Returns (%) CAGR Returns (%) CAGR Returns (%)
Inceptiondate
Since inception
CAGR
Returns
Bottom 3 Funds Managed by Mr. Abhishek Bisen**
1 Year 3 Years 5 Years
Kotak Bond - Growth () ^ -0.70 6.05 7.23 47,697 8.72 25/11/99
NIFTY Medium to Long Duration Debt Index # () 0.70 6.88 8.30 NA NA
CRISIL 10 Year Gilt ## () -2.90 6.01 6.49 NA NA
Kotak Gilt - Investment - Regular - Growth () ^ -0.93 6.95 7.82 58,522 9.43 29/12/98
NIFTY All Duration G-Sec Index # () -0.29 6.45 7.36 NA NA
CRISIL 10 Year Gilt ## () -2.90 6.01 6.49 NA NA
Kotak GoldETF ()^ 2.01 5.03 -0.28 29,581 10.34 27/07/07
Priceof Gold# () 3.02 6.17 0.82 33,641 11.64
CRISIL10 YearGilt ## () -2.90 6.01 6.49 19,636 6.32
#
$
^^
*
**
Mr. Pankaj Tibrewal manages 3 funds of Kotak Mutual fund.
Mr. Harish Krishnan manages 2 funds of Kotak Mutual fund.
Mr. Deepak Gupta manages 13 funds of Kotak Mutual fund.
Mr. Deepak Agrawal manages 10 & All FMPs funds of Kotak Mutual fund.
Mr. Abhishek Bisen manages 9 funds of Kotak Mutual fund.
Kotak Smallcap Fund - Growth (Erstwhile Kotak Midcap), *Name of the Benchmark - Nifty Midcap 100 TRI, Scheme Inception date is 24/02/2005. Mr. Pankaj Tibrewal has been managing
the fund since 21/01/2010.
Kotak NV20 ETF - *Name of the Benchmark Nifty 50 Value 20 TRI, Scheme Inception date is 01/12/2015. Mr. Deepak Gupta has been managing the fund since 08/12/2015.
Kotak US Equity Fund - Growth, *Name of the Benchmark - S&P 500 International Total Return Net Index, Scheme Inception date is 20/12/2013. Mr. Deepak Gupta has been managing the
fund since 01/02/2015.
Kotak Asset Allocator Fund - Growth, *Name of the Benchmark - NIFTY 50 Hybrid Composite Debt 50:50 Index, Scheme Inception date is 09/08/2004. Mr. Deepak Gupta has been
managing the fund since 01/09/2008.
Kotak World Gold Fund - Growth, *Name of the Benchmark - Financial Times Gold Mines Total - Price, Scheme Inception date is 06/06/2008. Mr. Deepak Gupta has been managing the
fund since 01/02/2015.
Kotak PSU Bank ETF, *Name of the Benchmark - Nifty PSU Bank TRI , Scheme Inception date is 08/11/2007. Mr. Deepak Gupta has been managing the fund since 25/02/2011.
Kotak Global Emerging Market Fund - Growth, *Name of the Benchmark - MSCI Emerging Market index, Scheme Inception date is 26/09/2007. Mr. Deepak Gupta has been managing the
fund since 04/04/2011(Dedicated fund manager for overseas investment) and Mr. Abhishek Bisen has been managing the fund since 04/04/2011.
Kotak Gold Fund - Growth, *Name of the Benchmark - Price of Gold, Scheme Inception date is 25/03/2011. Mr. Abhishek Bisen has been managing the fund since 04/03/2011.
Kotak Debt Hybrid - Growth (Erstwhile Kotak Monthly Income Plan), *Name of the Benchmark - CRISIL Hybrid 85+15 - Conservative Index, Scheme Inception date is 02/12/2003. Mr.
Abhishek Bisen has been managing the fund since 01/04/2008. Mr. Devender Singhal has been managing the fund since 25/08/2015.
Kotak Bond - Regular Plan - Growth, *Name of the Benchmark - NIFTY Medium to Long Duration Debt Index, Scheme Inception date is 25/11/1999. Mr. Abhishek Bisen has been
managing the fund since 01/04/2008.
Kotak Gilt - Investment - Regular - Growth, *Name of the Benchmark -NIFTY All Duration G-Sec Index, Scheme Inception date is 29/12/1998. Mr. Abhishek Bisen has been managing the
fund since 15/04/2008.
Different plans have different expense structure. The performance details provided herein are of regular plan
^Past performance may or may not be sustained in future.*All payouts during the period have been reinvested in the units of the scheme at the then prevailing NAV.Returns > = 1 year: CAGR (Compounded Annualised Growth Rate). N.A stands for data not available. Source: ICRA MFI Explorer.
Kotak Bluechip Fund - Dividend (Erstwhile Kotak 50), *Name of the Benchmark - Nifty 50 TRI, Scheme Inception date is 29/12/1998. Mr. Harish Krishnan has been managing the fund since
15/11/2013.
Kotak Money Market Scheme - Growth (Erstwhile Floater - Short Term), *Name of the Benchmark - NIFTY Money Market Index, Scheme Inception date is 14/07/2003. Mr. Deepak Agrawal
has been managing the fund since 01/11/2006.
Kotak Liquid - Regular Plan - Growth, *Name of the Benchmark - NIFTY Liquid Index, Scheme Inception date is 04/11/2003. Mr. Deepak Agrawal has been managing the fund since
01/05/2007.
Kotak Savings Fund - Growth (Erstwhile Kotak Treasury Advantage Fund), *Name of the Benchmark - NIFTY Ultra Short Duration Debt Index, Scheme Inception date is 13/08/2004. Mr.
Deepak Agrawal has been managing the fund since 01/04/2008.
Kotak Corporate Bond Fund - Growth, *Name of the Benchmark - CRISIL Corporate Bond Fund Index, Scheme Inception date is 21/09/2007. Mr. Deepak Agrawal has been managing the
fund since 01/02/2015.
Kotak Banking and PSU Debt Fund - Growth, *Name of the Benchmark - CRISIL Banking and PSU Debt Index, Scheme Inception date is 29/12/1998. Mr. Deepak Agrawal has been
managing the fund since 01/08/2008.
Kotak Dynamic Bond Fund - Growth (Erstwhile Flexi Debt Fund), *Name of the Benchmark - Nifty Composite Debt Index, Scheme Inception date is 26/05/2008. Mr. Deepak Agrawal has
been managing the fund since 25/11/2012.
Kotak Sensex ETF, *Name of the Benchmark - S&P BSE SENSEX TRI, Scheme Inception date is 06/06/2008. Mr. Deepak Gupta has been managing the fund since 25/02/2011.
Kotak Gold ETF, *Name of the Benchmark - Price of Gold, Scheme Inception date is 27/07/2007. Mr. Abhishek Bisen has been managing the fund since 01/08/2008.

TH
EPAG
EH
AS
BEEN
LEFT
INTEN
TIO
NALL
YBLA
NK