korea-world bank high level conference on post-crisis...
TRANSCRIPT

Korea-World Bank High Level Conference on Post-Crisis Growth and Development
June 3, 2010 – June 4, 2010 Busan, Korea
Draft for comments only
Inclusive Finance
Presenter: Peer Stein
Paper presented at the Korea-World Bank High Level Conference on Post-Crisis Growth and Development, co-organized by the Presidential Committee for the G-20 Summit and the World Bank with the support of the Korea Institute for International Economic Policy (KIEP).
The findings, interpretations, and conclusions expressed in this paper are entirely those of the authors. They do not necessarily represent the views of the World Bank Group or those of the Executive Directors of the World Bank or the governments they represent.


1
FINANCIAL INCLUSION: Achievements, Challenges and Way Forward*
sorryNg
World Bank Group
May 21, 2010
[WORKING DRAFT - CONFIDENTIAL]
TOWARDS UNIVERSAL ACCESS: ADDRESSING THE GLOBAL CHALLENGE OF FINANCIAL INCLUSION
Volume I
The Report was prepared by a World Bank Group team coordinated by the IFC Access to Finance Department. The working team which was led by Peer Stein (IFC) included Bikki Randhawa (World Bank) and Nina Bilandzic (World Bank). Asli Demirgüç-Kunt (World Bank) and Margaret Miller (CGAP) provided guidance and technical inputs to the Report.

2
TABLE OF CONTENTS
EXECUTIVE SUMMARY ........................................................................................................... 5
1. INTRODUCTION AND HIGH-LEVEL RECOMMENDATIONS .................................................... 6
1.0 SCOPE OF THE REPORT ........................................................................................................... 6 1.1 THE CHALLENGE IN BRIEF ........................................................................................................ 6 1.2 COLLABORATIVE MODEL AND IMPLEMENTATION PILLARS .............................................................. 7
2. FINANCIAL INCLUSION: DEFINING THE CHALLENGE .......................................................... 10
2.1 DEFINING FINANCIAL INCLUSION AND COUNTING THE UNBANKED ................................................ 10 2.2 FINANCIAL INCLUSION: BENEFITS AND CONSTRAINTS ................................................................. 12 2.3 GLOBAL MANDATES ........................................................................................................... 14
3. FINANCIAL INCLUSION PILLARS ........................................................................................ 16
3.1 POLICY ENVIRONMENT ........................................................................................................ 16 3.2 FINANCIAL INFRASTRUCTURE ................................................................................................ 19 3.3 DELIVERY MECHANISMS AND PRODUCTS ................................................................................ 23 3.4 RESPONSIBLE FINANCE / CUSTOMER FOCUS ............................................................................ 27 3.5 DATA & MEASUREMENT ..................................................................................................... 31
4. THE WAY FORWARD TO THE G-20 KOREA SUMMIT .......................................................... 35
The findings, interpretations, and conclusions expressed in this paper are entirely those of the authors. They do not necessarily represent the views of the International Bank for Reconstruction and Development/World Bank and its affiliated organizations, or those of the Executive Directors of the World Bank or the governments they represent.

3
Boxes and Figures
Box 1 – Current Measurement of the Unbanked 6 Box 2 – Development Banks Kick-Starting Financial Services – The Case of Mexico
18
Box 3 – G-8 Summit : 5x5 Declaration 23 Box 4 – Case Study: M-Pesa (Kenya) 24 Box 5 – Case Study: Mzansi (South Africa) 27 Box 6 – Lack of Financial Capability in Practice 30 Box 7 – Government led Initiatives in Data Collection in India 34 Figure 1 – Labor Force Segment in Emerging Markets 7 Figure 2 – Collaborative Diamond Model for Financial Inclusion – Generation 1.0
8
Figure 3 – Collaborative Diamond Model for Financial Inclusion – Generation 2.0
8
Figure 4 – Reaching the Financial Inclusion Target – Key Pillars 9 Figure 5 – Defining Financial Inclusion 10 Figure 6 – Global Map of the Financially Included 11 Figure 7 – Access and Payment Transactions Gaps 12 Figure 8 – Seven Benefits of Financial Inclusion 13 Figure 9 – Access to Finance and Millennium Development Goals 14 Figure 10 – Recent Examples of Countries Advancing Full Financial Inclusion 15 Figure 11 – Current and Potential Impact of Financial Infrastructure 20 Figure 12 – Remittance Cost Variation across Selected Country Corridors 22 Figure 13 – Supply vs. Gap for Financial Products 24 Figure 14 – Global Trends Shifting the Financial Inclusion Frontier Forward 25 Figure 15 – Three Dimensions of Responsible Finance 28 Figure 16 – Measuring Financial Access : Key Existing Reports 32

4
Abbreviations Alliance for Financial Inclusion “AFI” Automatic Teller Machines “ATMs” Consultative Group to Assist the Poor “CGAP” Development Finance Institutions “DFIs” Financial Inclusion Experts Group “FIEG” Government-to-Person Payments “G2P” Gross Domestic Product “GDP” International Finance Corporation “IFC” International Finance Institutions “IFIs” International Monetary Fund “IMF” Microfinance Institutions “MFIs” Point-of-sale Terminals “POS” Small and Medium Enterprises “SMEs” United Nations “UN” World Bank “WB” World Bank Group “WBG”

5
Executive Summary The global gap in access and use of financial services remains a challenge. Two thirds of the adult population in developing countries or 2.7 billion people lack access to basic formal financial services, such as savings or checking accounts. The largest share of the unbanked live in Sub-Saharan Africa (12% banked) and South Asia (24% banked). East Asia, Middle East and North Africa, Latin America and Eastern Europe and Central Asia are also low-access regions with less than 50% of their population banked. Among the unbanked a large proportion lives on less than $5 dollars a day. The finance gap is equally important for small and medium enterprises (SMEs), which are the main driver of job creation in emerging markets. SMEs are 30% more likely than large firms to rate financing constraints as a major obstacle to growth. Small firms are at the highest disadvantage: only 18% of small enterprises in low-income countries use finance. SMEs represent a key target segment for financial inclusion as they are one of the largest employers in emerging markets (contributing to GDP growth) and they are employing a growing share of women (25-40% worldwide), who rank high among the financially disadvantaged groups. Empirical evidence suggests that improved access to finance is not only pro-growth but also pro-poor, reducing income inequality and poverty. Finance performs two key functions beneficial to households and firms: risk management and inter-temporal consumption smoothing. These functions yield multiple direct and indirect benefits to households and firms, allowing them to take advantage of investment opportunities, smooth their consumption, manage day-to-day resources and insure themselves. Financial inclusion needs to go beyond credit: there is a near to universal need for safe and secure savings and payment products and a high demand for insurance and international remittances. On the national level, several emerging markets have demonstrated commitment and urgency around the universal access to financial services goal. More remains to be done, especially at the global level and in advancing financial inclusion in a responsible fashion, through consumer protection regulations, industry practices, and financial capability training. Financial inclusion needs to leverage all financial services providers. There is much to learn from the microfinance industry as well as from recent innovations to deliver financial services outside of conventional bank branches. Closing the financial services gap will require significant commitment from a wide variety of bank and non-bank financial institutions, including commercial banks, credit unions, savings banks, microfinance institutions, postal banks, and mobile banking operators.
To make progress and build the foundations for sustainable growth, the World Bank Group recommends the G-20 to convene a global partnership with the relevant stakeholders around a common global financial goal. Building on the success of the targets set at the Microcredit Summit (100 million credit-focused target met in 2007), the efforts should focus not only on credit but on a range of financial products: payments, savings, remittances, insurance. The target would step up pressure to close existing data gaps - in particular the SME finance gap and policy related indicators - ensuring the basic elements are in place to measure

6
progress against the target on an annual basis. Key implementation pillars will include: policy environment, financial infrastructure, delivery mechanisms and products, responsible finance, data & measurement and building on progress made by the Financial Inclusion Experts Group. The implementation will require an integrated and concerted effort leveraging four key drivers: (i) the global development community, (ii) the financial services industry, (iii) national governments and (iv) centers for knowledge sharing. The G-20 are in a unique position to convene those forces for economic development, and complement the effort with the creation of a funding mechanism to provide resources needed for the implementation of the financial inclusion agenda.
1. Introduction and High-Level Recommendations
1.0 Scope of the Report The purpose of this report is to highlight key trends, challenges and opportunities for advancing financial inclusion and to propose key policy recommendations for consideration by G-20 policymakers at the global level to benefit a wider range of emerging economies, including many non-G-20 countries. As such, the report serves a broad audience, ranging from policymakers, development finance institutions and the private sector, as well as experts seeking a synopsis of the key sub-topics relevant for financial inclusion and areas of work for advancing progress. This report is organized in three parts. Part 1 recommends broad goals and agenda items to accelerate progress in financial inclusion. Part 2 defines the financial inclusion concept, its importance for economic growth and poverty reduction. Part 3 provides a snapshot of each of the pillars proposed as part of the recommendations. Volume II (the companion report) includes three annexes. Annex 1 takes a closer look at the microfinance industry as a case-in-point for reviewing the successes, innovations and lessons learned, which are critical for the broader discussion on financial inclusion. Annex 2 provides more detail on the SME finance challenge. The third annex includes a thematically categorized reading list.
1.1 The Challenge in Brief Financial inclusion encompasses improving the range, quality and availability of financial services to the underserved and the financially excluded. Almost 70% of the population in emerging markets has no access to formal financial services (see Box 1 for the estimates on the financially excluded). In addition to the majority of the population that lacks access to finance, it
Box 1: Current Measurement of the Unbanked
Source: World Bank Group Team compilation.

7
is important to focus efforts not only on the financially excluded but also on the underserved population and firms in emerging countries. The working poor (living on below $2 a day), which comprise over 60% of the total labor force in emerging markets, represent a key target market segment for expanding financial inclusion (see Figure 1). In addition, as the small and medium enterprises (SMEs) are one of the largest and most common employers of these working poor (see Volume II for evidence), the SME market is a big opportunity for expanding the financial access frontier. Figure 1 Labor Force in Emerging Markets, Total = 2.6 billion
_________________________________________________________________________________ Source: Bill & Melinda Gates Foundation / Oliver Wyman (2006), IFC, World Bank (2010). Total labor force in emerging markets is out of a total emerging markets population of 5.6 billion.
1.2 Collaborative Model and Implementation Pillars The successful global efforts in advancing financial inclusion to date indicate that collaborative action from multiple stakeholders and channels is needed. The targets and efforts to be charted for the “next generation” of financial inclusion have much to leverage and learn from the previous collaborative actions. Figure 2, titled the “Collaborative Diamond Model”1, shows the key stakeholders that were needed to kick-start and provide momentum to advance financial inclusion. The key is that the main incentives and high-level goals among the stakeholders are aligned. The past trends indicate that four major types of players are needed: 1) the industry; 2) global development community (DFIs, IFIs, UN, G-8, G-20); 3) knowledge centers (with Consultative Group to Assist the Poor – a policy and research center dedicated to advancing financial access to the world’s poor - acting as a major player) and 4) national governments.2
Global targets to date and collaborative efforts tied to them involved credit-focused goals. The original goal of the Microcredit Summit when it was launched in 1997 was to reach 100
1 Inspired by Professor Michael Porter’s “Diamond Model” used for the diagnosis and recommendations around the competiveness of nations and industry clusters. 2 Note that the ordering of the stakeholders is not indicative of any priority order.
Employed
Working Poor ( <$2/ day)
Small and Medium Enterprises (SMEs) are one of the biggest employers in
emerging markets
subsistence & agricultural
workers(880M)
urban poor(720M)
employed (formal sector)
1 billion

8
million of the world’s poorest families (with a focus on women) with credit for self-employment and other financial and business services by 2005. Figure 2 Collaborative Diamond Model for Financial Inclusion – Generation 1.0 (1990s – 2010)
_________________________________________________________________________________ Source: World Bank Group Team Analysis. Diamond model inspired by Professor Michael Porter’s “Diamond Model of Competitiveness”. To address the global challenge of financial inclusion a high-level global target is needed. Efforts around this future global target will need to include the same four types of stakeholders, but encompassing a broader and more diverse range of players. Figure 3 outlines the preliminary collaborative model needed for Financial Inclusion 2.0 to take-off. Figure 3 Collaborative Diamond Model for Financial Inclusion – Generation 2.0 (2010 – 2020s)
_________________________________________________________________________________ Source: World Bank Group Team Analysis. Diamond model inspired by Professor Michael Porter’s “Diamond Model of Competitiveness”.

9
Key working pillars need to focus on six themes: policy environment, financial infrastructure, delivery mechanisms and products, responsible finance / consumer focus, data & measurement and building upon the work of the FIEG sub-groups. Figure 4 outlines the preliminary G-20 agenda items for each of the pillars. Part 3 provides a background snapshot of the pillars.
Figure 4 Reaching the Financial Inclusion Target – Key Pillars
______________________________________________________________________________ Source: World Bank Group Team. FIEG = Financial Inclusion Experts Group, announced at the G-20 Leaders Summit in Pittsburgh and composed of two sub-groups: “Access through Innovation” and “SME Finance”. Both groups will be presenting final deliverables at the G-20 Seoul Summit. Expanding the reach of financial access holds significant promise to enhance the livelihood and well-being of the poor and the growth of small and medium enterprises. Concerted efforts and resource commitments will be needed to effectively implement this agenda and integrate it into the broader assistance work across the international development community. A systematic approach with dedicated resources would assist governments in setting an appropriate regulatory and policy framework, help build effective financial infrastructure and work with financial service providers to enhance product diversification and reach as well as build financial capability. Developing financial products that meet the needs of the financially excluded in a timely, cost-effective and responsible manner will require new and innovative approaches.

10
2. Financial Inclusion: Defining the Challenge
2.1 Defining Financial Inclusion and Counting the Unbanked
Financial inclusion encompasses improving the range, quality and availability of financial services to the underserved and the financially excluded. While there is a growing consensus on the importance of financial inclusion, the same consensus does not exist around its definition.3 Financial inclusion can be defined as a “state in which all people of working age have access to a full suite of quality financial services, provided at affordable prices, in a convenient manner, and with dignity for the clients.”4
These products and services can be cost effectively provided by a range of financial service providers. Financial inclusion implies that both unbanked and under-banked households and firms are part of its target market. See Figure 5 for the key dimensions that define financial inclusion, with the particular focus placed on the range of products and delivery channels that goes beyond the early micro-credit only approach.
Figure 5 Defining Financial Inclusion
Source: World Bank Group Team.
Diversified products beyond micro-credit, such as remittances, micro-insurance, savings accounts and other financial instruments are needed to expand financial access. In Portfolios of the Poor, by Collins, Morduch, Rutherford, and Ruthven (2009), the authors show that all 250 of the very poor slum residents they study have some form of debt and savings and none use fewer than four types of instruments (be they formal or informal) throughout the year. The picture is one where poor households are continuously substituting between a variety of formal, semi-formal, and informal financial products based on availability, product features,
3 Accion International, Center for Financial Inclusion, “Financial Inclusion: What’s the Vision?” 4 Ibid.

11
pricing, and other non-price barriers. Moreover, the high turnover of financial assets requires the active use of a broad range of financial services.5
How many people are financial excluded? Almost 70% of the adult population in developing countries or 2.7 billion people lack access to basic financial services, such as savings or checking accounts (based on the 2009 Financial Access report by the World Bank Group).
6
Out of the total unbanked population, the regions with the largest share of unbanked population are Sub-Saharan Africa, with only 12% banked, and South Asia, with 24% banked (see Figure 6).
Figure 6 Global Map of the Financially Included
Source: Map shows percent of adults with a deposit account in regulated financial institutions bank including banks, cooperatives, specialized state financial institutions and MFIs. For data and methodology please see Financial Access 2009 at www.cgap.org/financialindicators. Regional averages show the simple average of country averages of adults banked
The availability of financial access points varies greatly depending on the level of financial sector development in the country and the largest gaps are beyond branches. Emerging economies have three times less branches and ATMs (per 100,000 adults) and as much as twelve times less point-of sale (POS) terminals compared to developed markets (see Figure 7). For
(not weighted by population), based on the data provided for the Financial Access 2009 survey. Not all countries per region are included in the average calculation, as not all provided survey data.
5 Daryl Collins, Jonathan Murdoch, Stuart Rutherford, and Orlanda Ruthven, Portfolios of the Poor: How the World’s Poor Live on $2 a Day, Princeton: Princeton University Press: 2009. Quoted as referenced in Jake Kendall, Nataliya Mylenko and Alejandro Ponce, “Measuring Financial Access around the World”, Financial and Private Sector Development, World Bank: Policy Research Working Paper 5253. 6 Aligned with this estimate, an additional source that builds on datasets compiled from existing cross-country data sources on financial access and socioeconomic and demographic characteristics find that 2.5 billion adults do not use formal financial services to save or borrow: Financial Access Initiative (Aparna Dalal and Jonathan Murdoch) and McKinsey & Company (Alberto Chaia, Tony Goland, Maria Jose Gonzales, Robert Schiff), “Half the World is Unbanked”, October 2009.

12
example, regional averages for Africa and South Asia are well below 10 branches per 100,000 adults as compared to more than 25 in high-income countries.7
When comparing the number of cashless retail payment transactions per capita, the gap is even wider, with developed countries transacting 25 times more per year than emerging countries.
Figure 7 Access and Payment Transactions Gaps
Source: World Bank Group Financial Access Survey 2009 and World Bank Payment Systems Survey 2008
The drive towards full financial access and full-scale banking does not only apply only to individuals, but also to the underserved Small and Medium Enterprise (SME) segment. The need for SMEs to access financial services goes well beyond access to lending. Treasury and cash management, savings, insurance, and transactional products are critical for SMEs to ensure optimal financial management and risk mitigation, and also provide private sector financial institutions with increased incentives to focus on the SME segment. The World Bank Enterprise Surveys and Investment Climate Surveys consistently highlight that SMEs are 30% more likely than large firms to rate financing constraints as a major obstacle to growth. The smaller the firm, the higher this percentage is. For more details on the SME finance gap, see Volume II Annex 2, which is based on the analysis by the G-20 Financial Inclusion Experts Group focused on SME Finance.
2.2 Financial Inclusion: Benefits and Constraints Empirical evidence suggests that improved access to finance is not only pro-growth but also pro-poor, reducing income inequality and poverty.8
7 World Bank Group. Financial Access 2009
Cross-country regressions have shown that economies with better developed financial systems experience faster drops in income inequality and faster reductions in poverty levels. Financial depth can have direct and indirect
8 Beck, Demirguc-Kunt, and Levine 2007, Honohan 2004. Beck, Demirgüç-Kunt, and Honohan. 2008. Finance for All? Policies and Pitfalls in Expanding Access. Washington, D.C.: World Bank.

13
effects on small firms and poor households.9 Greater depth is likely to be associated with greater access for both firms and households, which will make them better able to take advantage of investment opportunities, smooth their consumption, and insure themselves. The numerous benefits of financial inclusion for low-income households and small and micro-enterprises are summarized in the diagram below (see Figure 8). 10
Figure 8 Seven Benefits of Financial Inclusion
Source: Adapted from Accion International, Center for Financial Inclusion, “Mexico’s Prospects for Full Financial Inclusion: A White Paper from the Financial Inclusion 2020 Project”, September 2009
Why are so many people financially excluded when the benefits of financial inclusion are so well recognized? When surveying financial institutions around the world to answer this question, three constraints stand out11
:
1. Geography or physical access – While technology – phone and internet use – has the potential to alleviate this constraint, physical distance still matters.
2. Lack of proper documentation – Financial institutions require one or more documents for identification purposes, but many people in low income countries who live in rural areas and work in the informal sector lack such papers.
3. High prices, minimum account requirements and fees – Many institutions have minimum account requirements and fees that make even opening a simple account out of reach for many potential users. A study on barriers to financial access and use around the world based on surveys from 193 banks in 58 countries highlights interesting country differentials focused
9 Finance for All (2008). Note that financial depth is most often described / measured by the extent of private credit as a percentage of GDP. Financial development is broader, encompassing the development of the entire financial sector. Hence, the two terms are very closely related. 10 For a further discussion specifically related to poor’s management of day-to-day resources (benefit #2), see Daryl Collins, Jonathan Murdoch, Stuart Rutherford, and Orlanda Ruthven, Portfolios of the Poor: How the World’s Poor Live on $2 a Day, based on financial diaries conducted in Bangladesh, India and South Africa. 11 Asli Demirgüç-Kunt. 2010. “Measuring Access to Finance… One Step at a time; http://allaboutfinance.worldbank.org/2010/03/measuring-access-to-financeone-step-at-a-time.html#more.

14
on barriers to financial access.12 For example, to open a checking account in Cameroon, the minimum deposit requirement is over 700 dollars an amount higher than the GDP per capita of that country, while no minimum amounts are required in South Africa or Swaziland. 13
2.3 Global Mandates
Advancing the financial inclusion agenda can help boost progress towards the achievement of the goals, in particular towards poverty reduction, health, education and gender equality (see Figure 9).14
Figure 9 Access to Finance and Millennium Development Goals
Inclusive finance is an important driver for attaining the MDGs, as finance:
Reduces vulnerability to shocks, thus mitigating the risk of falling into Leads to higher income per capita facilitating meeting
poverty
Creates reducing inequalities and broadening opportunities, contributing to many of the MDGs
Source: Claessen and Feijen (2006); MDG icons from http://www.undp.org/mdg/
gender equality
Financial inclusion as a goal in itself is rapidly emerging as a major focus on global and national platforms. The financial inclusion concept has gained increased attention since the United Nations designated 2005 as the International Year of Microcredit and adopted the goal of building inclusive financial systems. HRH Princess Máxima of the Netherlands, UN Secretary-General’s Special Advocate for Inclusive Finance for Development, is appointed to support the cause. More recently, in September 2009, G-20 Leaders in Pittsburgh pledged to “commit to improving access to financial services for the poor”. To advance this goal, the Leaders launched the creation of a Financial Inclusion Experts Group (FIEG) tasked with (1) supporting innovative modes of financial service delivery capable of reaching the poor and (2) scaling up models of small and medium enterprise (SME) financing. Two sub-groups have been formed to lead these two tasks, one on “Access through Innovation” (supported by CGAP and co-chaired by Brazil and Australia) and one on “SME Finance” (supported by IFC and co-chaired by Germany and South Africa). The work of the Access through Innovation Sub-Group will center on analysis of recent experience and lessons learned with branchless banking and similar innovations in financial service delivery to the poor, as well as the identification of general principles and gaps and barriers that might be addressed by relevant standard setting bodies. The objective of the SME Finance initiative is to identify and promote successful models for public financing to maximize the deployment of private sector resources on a sustainable and scalable
12 Beck, Thorsten, Asli Demirguc¸-Kunt, and Maria Soledad Martinez Peria. 2008. “Services for Everyone? Barriers to Bank Access and Use around the World.” World Bank Economic Review doi:10.1093/wber/lhn020. 13 Ibid. 14 Beck, Demirguc-Kunt and Levine (2004), Claessens and Feijen (2006), Littlefield, Morduch and Hashemi (2003)

15
basis, and towards this objective the Sub-Group will (1) conduct a stocktaking exercise and (2) launch an SME Finance Challenge. On the national level, governments are becoming increasingly more pro-active and some are incorporating financial inclusion and the drive to universal access into their national mandate (see Figure 10 for an illustrative map with selected country examples). For example, India has mandated financial inclusion as a national goal and the Reserve Bank of India has intensified a number of measures and endorsed quantitative access targets over the last year to further financial inclusion. The government of Mexico is welcoming and supporting ongoing financial inclusion programs and analytical work to advance the goal of full financial inclusion by 2020. South Africa has mobilized the public and private sector to design products and interventions that serve as the entry-level point to include a larger percentage of the unbanked in formal financial services (e.g. Mzansi accounts with no monthly fee and no minimum balance). Moreover, the United Nations committee on building inclusive financial sectors, set up in 2006, urged central banks and governments to add the goal of universal ‘financial inclusion’ to the two traditional goals of prudential regulation i.e. safety of depositors’ funds and the stability of the financial system.15
Figure 10 Recent Examples of Countries Advancing Full Financial Inclusion
Source: World Bank Group Team Analysis and AFI; Map represents selected examples only, not an exhaustive or best practice list of countries with full / universal financial inclusion initiatives. Note that the South Korea example dates back to the credit card lending boom in 1999-2002.16
15 United Nations, “Building Inclusive Financial Sector for Development”, 2006. India, Mexico and South Africa examples based on public reports and publicly available information (see Reading List in Volume II for exact sources).
16 For a detailed overview of the causes and consequences of the Korean lending boom, see “Credit Card Lending Distress in Korea in 2003”, Taesoo Kang and Guonan Ma, Bank of International Settlements (BIS) Paper No. 46.

16
3. Financial Inclusion Pillars
3.1 Policy Environment
Addressing Market Failures
Given that financial systems in many emerging markets serve only a small part of the population, expanding access remains an important challenge across the world, leaving much for governments to do. However, not all government actions are equally effective and some policies can even be counterproductive. In this section the paper sets out principles for effective government policy on broadening access, drawing on the available evidence and illustrating with examples.17
Financial markets and institutions exist to overcome the effects of information asymmetries and transaction costs that prevent the direct pooling and investment of society’s savings. They mobilize savings and provide payments services that facilitate the exchange of goods and services. In addition, they produce and process information about investors and investment projects to guide the allocation of funds, monitor and govern investments, and help diversify, transform, and manage risk. When they work well they provide opportunities for all market participants to take advantage of the best investments by channeling funds to their most productive uses, hence boosting growth, improving income distribution and reducing poverty. When they do not work well growth opportunities are missed, inequalities persist, and in extreme cases, there can be costly crises.
Since expanding access remains an important challenge even in developed economies, it is not enough to say that the market will provide. Market failures related to information gaps, the need for coordination on collective action, and concentrations of power mean that governments everywhere have an important role to play in building inclusive financial systems.18
However, not all government action is equally effective and some policies can even be counterproductive. Direct government interventions to support access require a careful evaluation which is often missing.
Enabling Policy Actions
Even the most efficient financial system, supported by a strong contractual and information infrastructure, faces limitations. Not all would-be borrowers are creditworthy and there are numerous examples of national welfares that have been damaged by overly relaxed credit policies. Access to formal payment and savings services can approach universality as economies develop, although not everyone will or should qualify for credit. For example the sub-
17 The section is a summary and verbatim from “Access to Financial Services: Measurement, Impact, and Policies”, by Thorsten Beck, Asli Dimirguc-Kunt and Patrick Honohan, The World Bank Research Observer, February 2009. 18 Beck, Thorsten, and Augusto de la Torre. 2007. “The Basic Analytics of Access to Financial Services.” Financial Markets, Institutions and Instruments 16 (2):79–117.

17
prime crisis in the United States graphically illustrates the consequences of encouraging low-income households to borrow beyond their ability to repay, which ended up being a dangerous mix combined with reckless lending practices. An underlying, albeit often long-term, goal is deep institutional reform ensuring security of property rights against expropriation by the state. Prioritizing some institutional reforms over others, however, would help focus reform efforts and produce impact in the short- to medium-term. Recent evidence suggests that, in low-income countries, it is the information infrastructures that matter most, while in high-income countries enforcement of creditor rights is more important. Cross-country variation in financial depth can be explained in low-income countries by the existence of credit information systems but not by the efficiency in contract enforcement, and in the case of high-income countries results are reversed.19
As noted in the financial infrastructure section of this report, credit information systems are key to fostering inclusive financial systems.
But even within the contractual framework there are certain shortcuts to long-term institution building. In relatively underdeveloped institutional environments procedures that enable individual lenders to recover on debt contracts (for example, those related to collateral) are more important in boosting bank lending than those procedures mainly concerned with resolving conflicts between multiple claimants.20
Given that it is potentially easier to build credit registries and reform procedures related to collateral than to make lasting improvements in the enforcement of creditor rights and bankruptcy codes, these are important findings for prioritizing reform efforts. Introducing expedited mechanisms for loan recovery can be helpful, as shown in the example of India where a new mechanism by passing dysfunctional court procedures increased loan recoveries and reduced interest rates for borrowers.
Results can be produced relatively fast by encouraging both improvements in specific infrastructures (particularly in information and debt recovery) and the launch of financial market activities that can allow technology to bring down transaction costs. Some examples of these market activities are as follows: establishing credit registries or issuing individual identification numbers to establish credit histories; reducing costs of registering or repossessing collateral; and introducing specific legislation to underpin modern financial technology, from leasing and factoring to electronic-finance and mobile-finance. These can produce results relatively fast, as the success of m-finance in many Sub-Saharan African countries has shown, most recently M-Pesa in Kenya.21
Encouraging openness and competition is also an essential part of broadening access, as it both encourages incumbent institutions to seek out profitable ways of providing services to the previously excluded segments of the population and increases the speed with which access-improving new technologies are adopted. Foreign banks can play an important role in fostering competition and expanding access.
19 Djankov, Simeon, Caralee McLiesh, and Andrei Shleifer. 2007. “Private Credit in 129 Countries.” Journal of Financial Economics 84 (2): 299–329. 20 For example, bankruptcy codes Haselmann, Rainer F. H., Katharina Pistor, and Vikrant Vig. 2006. “How Law Affects Lending.”Columbia Law and Economics Working Paper 285. Columbia University, N.Y. 21 Porteous, David. 2006. “The Enabling Environment for Mobile Banking in Africa.” Bankable Frontier Associates. http://www.bankablefrontier.com/assets/ee.mobil.banking.report.v3.1.pdf.

18
In this process, providing the private sector with the right incentives is key, hence the importance of good prudential regulations. Competition that helps foster access can also result in reckless or improper expansion if not accompanied by a proper regulatory and supervisory framework. As increasingly complex international regulations such as Basel II are imposed on banks to help minimize the risk of costly bank failures, it is important to ensure that these arrangements do not inadvertently penalize small borrowers by failing to make full allowance for the risk-pooling potential of a portfolio of SME loans. Research suggests that banks making small loans have to set aside larger provisions against the higher expected loan losses from small loans and therefore need to charge higher rates of interest to cover these provisions. A variety of other regulatory measures is needed to support wider access. But some policies that are still widely used do not work. For example interest ceilings often fail to adequately provide consumer protection against abusive lending, as banks replace interest with fees and other charges. Increased transparency formalization, and enforcement of lender responsibility offer a more coherent approach, along with support for the over-indebted. However, delivering all of this can be administratively demanding. The scope for direct government interventions in improving access is more limited than often believed. There is a large body of evidence that suggests interventions to provide credit through government-owned financial institutions have generally not been successful. One of the reasons is that lending decisions are based on the political cycle rather than socio-economic fundamentals, as both cross-country evidence and a carefully executed case study for India show. In non-lending services, the experience of government-owned banks has been more mixed. A handful of governmental financial institutions have moved away from credit and evolved into providers of more complex financial services, entering into public/private partnerships to help overcome coordination failures, firstmover disincentives, and obstacles to risk sharing and distribution.22
22 De la Torre, Augusto, Juan Carlos Gozzi, and Sergio Schmukler. 2006. “Capital Market Development. Whither Latin America?” World Bank, Washington, D.C.
A good success example is Mexico, where government owned banks had a useful catalytic function in “kick-starting” certain financial services (see Box 2). Ultimately, these successful initiatives could have been undertaken by private capital, but the state had a useful role in jump-starting these services. Direct intervention through taxes and subsidies can be
Box 2: Success of Development Banks Kick-Starting Financial Services – The Case of Mexico 1. NAFIN. Electronic brokerage of reverse factoring,
developed by NAFIN, a government development bank, allows many small suppliers to use their receivables from large creditworthy buyers to obtain working capital financing.
2. BANSEFI. Another example is the electronic platform implemented by BANSEFI, another government-owned institution, to help semiformal and informal financial intermediaries reduce their operating costs by centralizing back-office operations.
3. FIRA. A government-owned DFI, turned investment bank, FIRA, has brokered quite complicated structured financial products to realign credit risks with the pattern of information between financial intermediaries and the different participants in the supply chains for several industries, including shrimp and other agrifish products.
Source: World Bank. 2008. “Finance for All: Policies and Pitfalls in
Expanding Access”. World Bank, Washington, DC.

19
effective in certain circumstances, but experience suggests that this intervention is more likely to have significant unintended consequences in finance compared to other sectors. In addition, how best to use postal financial services and develop these large networks for expanding access to financial services is an important question for policy makers to consider. With direct and directed lending programs discredited in recent years, partial credit guarantees have become the direct intervention mechanism of choice for SME credit activists. Some seem to be functioning well, breaking even financially thanks to the incentive structure built into the contract between the guarantor and the intermediary banks. For example, the Chilean scheme has the intermediary banks bidding for the percentage rate of guarantee and they can adjust the premium charged on the basis of each intermediary’s claims record. This has resulted not only in higher lending by beneficiaries, but in a reduction of loan losses.23 However, other partial credit guarantees have been poorly structured, embodying sizable hidden subsidies and benefiting mainly those who do not need the subsidy. The temptation for an activist government to under-price guarantees (especially for long-term loans when this will not be detected for years) does present fiscal hazards similar to those which have undermined so many development banks in the past. In the absence of thorough economic evaluations of most schemes, their net effect in cost-benefit terms remains unclear.24
3.2 Financial Infrastructure Financial infrastructure has the potential to significantly expand access to finance.25 Key elements of financial infrastructure such as credit information systems, enforcement of collateral and functioning payment, remittance and securities settlement systems are vital to facilitating greater access to finance, improving transparency and governance, as well as safeguarding financial stability.26 Recent estimates demonstrate the high impact of financial infrastructure on the current and potential financing volume and reach (see Figure 11).27
Current estimates show that 390 million people in emerging markets are influenced by credit bureaus, over 700 million are affected by remittances, and over 1 billion by payment systems. Future growth, based on expected growth of financial infrastructure where it does not currently exist, and expected increases in the reach of existing financial infrastructure, is likely to increase these figures in some cases by 100 percent or more. For this growth and impact potential to be realized, concerted collaborative effort is needed from the governments, development finance institutions and financial institutions.
23 Cowan, Kevin, Alejandro Drexler, and Alvaro Yan˜ ez. 2008. “The Effect of Partial Credit Guarantees on the Credit Market for Small Businesses.” Mimeo. Central Bank of Chile. 24 Honohan, Patrick. 2008. “Partial Credit Guarantees – Principles and Practice.” Journal of Financial Stability. 25 Estimates of financial infrastructure impact have been developed here based on data from several sources including the Doing Business project at the World Bank, the Global Payment Systems Survey (also World Bank), the Remittance Prices Worldwide Database (World Bank) and the IFC’s lending portfolio. (WB, 2009). 26 Financial infrastructure is therefore part of the “soft (intangible)” infrastructure, the one that consists of “institutions, regulations, social capital, value systems, and other social and economic arrangements”. In contrast, “hard” infrastructure consists of highways, port facilities, airports, telecommunication systems, electricity grids and other public utilities. For more detail, see Lin, Justin Yifu. 2009. “Economic Development and Structural Change”, Mexico City, October 2009. 27 Based on Miller, Margaret, Nataliya Mylenko and Shalini Sankaranarayanan. 2009. “Financial Infrastructure: Building Access Through Transparent and Stable Financial Systems”. Financial Infrastructure Policy and Research Series. Washington, DC: World Bank. For the purposes of easier reference, this source is referred to as “Financial Infrastructure Report (2009)”.

20
Figure 11 Current and Potential Impact of Financial Infrastructure
Source: World Bank Group Financial Infrastructure Report (2009)
Key elements of financial infrastructure need significant development or improvement in many emerging markets. This coincides with a large number of unserved and underserved in these markets. Even in countries that have the basic financial infrastructure, financial service providers such as microfinance institutions (MFIs) and non-bank financial institutions lack access. Thus, it is key to develop inclusive and efficient financial infrastructure in order to alleviate the availability and affordability constraints to financial inclusion.
Credit Information Systems
The primary benefit of credit information systems is the establishment of “reputational collateral” through the payment performance of individual and firm borrowers / financial users.28
Lenders are able to make more informed decisions about creditworthiness, based on borrower’s payment history. Key benefits of credit reporting include:
1. Greater access by individuals to loans and other financial services at banks. Persons who have a credit history can use it to obtain services at financial institutions. Studies show an 89% increase in loan approval rate when positive and negative information is included in the credit report and an 11% increase in the loan approval rate when credit reports capture retail as well as other lenders.29
2. Decrease in the cost and processing time for loans. Credit reports speed up the decision making process and turnaround time for loans, which reduces the transaction cost of making loans. These savings can be passed on to the borrower in the form of lower interest rates.
3. Greater access to financing by SMEs. In studies done covering 5,000 firms in 51 countries, the percentage of firms reporting constraints to financing is lower for firms operating in environments with a credit bureau (27%), compared to firms operating in environments without a credit bureau (49%).30
28 Miller, Margaret, ed. 2003. Credit Reporting Systems and the International Economy, MIT Press. 29 Barron, J. M. and Michael Staten. 2003. “The Value of Comprehensive Credit Reports: Lessons from U.S. Experience.” 30 Love, Inesssa and Nataliya Mylenko. 2003. “Credit reporting and financing constraints.” Policy Research Working Paper Series 3142, World Bank, Washington, DC.
21
Lack of access to credit information systems, for example, exposes microfinance institutions (MFIs) and other financial institutions to the risk of non-performing loans as they are not able to accurately assess a borrower’s repayment capacity, thus increasing the risk of over-indebtedness.31 In mature and competitive financial markets with aggressive lenders, lack of such information on microfinance lending can also have an impact on bank portfolios. A recent study that shows an increase in delinquency rates from an average of 1% in December 2007 to 5.2% in March 2009 for MFIs in Bosnia & Herzegovina (BiH) also reports “strong evidence of significant client overlap (20-40%) with customers borrowing from two to three MFIs/banks at the same time.”32
Access to inclusive credit information systems open to banks and MFIs, as well as other data providers such as non-bank financial institutions and non-traditional providers of data, can help to mitigate these risks of client over-indebtedness and deteriorating portfolios. Public credit registries also play a critical role in prudential regulation, financial sector supervision, and systemic level risk monitoring with respect to regulated financial institutions.
Collateral Registries and Secured Transactions Systems
Collateral registries and secured transaction systems represent another key building block of financial infrastructure that is underdeveloped in emerging markets.33
While in the emerging markets 78 percent of the capital stock of a business enterprise is typically movable assets, such as machinery, equipment or receivables and only 22 percent immovable property, financial institutions are reluctant to accept movable property as collateral. Banks strongly prefer land and real estate as collateral. This requirement constrains access to credit for individuals and for small and medium enterprises. To address this constraint, modernizing secured transactions and collateral registries contributes to financial inclusion by:
(1) Increasing the level of credit: In countries where security interests are perfected and there is a predictable priority system for creditors in cases of loan default, credit to the private sector as a percentage of GDP averages 60 percent compared with only 30 to 32 percent on average for countries without these creditor protections.34
(2) Decreasing the cost of credit: In industrial countries, borrowers with collateral get nine times the level of credit given their cash flow compared to borrowers without collateral. They also benefit from longer repayment periods (11 times longer) and significantly lower interest rates (50 percent lower).
35
31 For a recent article on microfinance credit reporting, see the AccessFinance newsletter (World Bank, Issue No. 31, March 2010), “Know Your Borrower: The Case for Microfinance Credit Reporting”, Shalini Sankaranarayanan.
Payment systems and advancing the 5x5 remittances goal
32 Rankin, Glynis and Narain, Sushma, 2009. “Centre for the Provision of Credit/Financial Advice Bosnia and Herzegovina: Feasibility Study for the Provision of Preventative and Remedial Measures for Indebtedness in Microfinance Clients”, forthcoming. 33 For a comprehensive account of the importance of collateral registries and secured transactions and reform aspects of modernizing these, see “Secured Transactions Systems and Collateral Registries”, World Bank 2010. Available at: http://www.ifc.org/ifcext/fias.nsf/AttachmentsByTitle/PublicationMT_SecuredTransactionsSystems/$FILE/SecuredTransactionsSystems.pdf 34 Safavian, Mehnaz, Heywood Fleisig and Jevgenijs Steinbuks, 2006. “Unlocking Dead Capital: How Reforming Collateral Laws Improves Access to Finance.” Private Sector Development Viewpoint, No. 307, World Bank, March 2006. 35 Chaves, Rodrigo, Nuria de la Pena and Heywood Fleisig, 2004. “Secured Transactions Reform: Early Results from Romania.” CEAL Issues Brief, September 2004.

22
A safe and efficient national retail payment system is a prerequisite for the promotion of financial inclusion. Retail payments systems infrastructure includes legal and regulatory framework and involves cooperation between various participants in the financial system to build system rules, instruments procedures, standards and other aspects to enable the transfer of money between various counterparties safely and efficiently. The first point of entry of the underserved and un-served into the financial sector, retail payment services including remittances heavily rely on domestic and international payment systems to flow from the sender to the recipient. Remittance transfers are cross-border person-to-person payments of relatively low value, representing a lifeline for more than 700 million people in developing countries.36 The World Bank estimates that remittances totaled $420 billion in 2009, of which $317 billion went to developing countries, involving some 192 million migrants or 3 percent of the world population. The money received is an important source of family (and national) income in many emerging markets, representing in some cases a very large percentage of the GDP of the receiving countries. 37
The average cost of sending remittances varies significantly across country corridors. The “Remittance Prices Worldwide (RPW)” data indicates that there is a high variation in the cost of remittances across remittance corridors. Figure 12 represents the average remittance costs for selected corridors (sending to receiving country) and tables for the most and least costly country corridors.
38
There is a significant variation with corridors from same sending country, for example, it costs almost 16% to send money from the United States to Brazil, which is significantly higher than the global average total cost (8.72%) and 7% to send money from United States to India, which is below the global average total cost.
Figure 12 Remittance Cost Variation across Selected Country Corridors
Source: World Bank Remittance Prices Worldwide database (1Q2010): http://remittanceprices.worldbank.org/. Note: The global average total cost is calculated as the average total cost for sending USD200 with all Remittance Service Providers (RSPs) worldwide; non transparent RSPs (i.e. RSPs that do not disclose the exchange rate applied to the transaction) are excluded as well as corridors from Russia, since in these cases
36 Definition of remittance transfers from World Bank / BIS, “General Principles for International Remittance Services” 37 World Bank Migration and Remittances Team, “Migration and Remittance Trends 2009”, November 2009 and World Bank Payment Systems Development Group, “An Analysis of Trends in the Average Cost of Migrant Remittance Services”, Financial and Private Sector Development Policy Note, April 2010. 38 Data publicly available at: http://remittanceprices.worldbank.org/countrycorridors/

23
the exchange rates were not provided and cost would be higher if data were complete. Note for the tables: Cost includes the transaction fee and exchange rate margin. Only those corridors with a sufficient degree of transparency (i.e. all the relevant information was provided by all RSPs) are featured. Thus, for example, other corridors for which part of the information is not available or disclosed might result in practice more costly. Corridor averages are unweighted and do not reflect the market shares of the different firms that compose the average.
There is a unique opportunity for reducing the cost of remittances, resulting in more money for migrants and their families. Recognizing the importance of migrant remittances for the global development agenda, the G-8 announced the formation in February 2009 of a Global Remittances Working Group (GRWG) to facilitate the flow of remittances worldwide. Last year the efforts of the working group were successful in securing the commitment of the G8 Heads of State to reducing the global average cost of transferring remittances by five percentage points in five years (see Box 3). 39 If the cost of sending remittances could be reduced by 5 percentage points relative to the value sent, remittance recipients in emerging markets would receive up to $16 billion dollars more each year than they do now. This added income could then provide remittance recipients with more disposable income resulting in higher rates of consumption, savings, and investment within local economies and higher levels of economic growth. 40
3.3 Delivery Mechanisms and Products
There is a near to universal need for safe and secure savings and payment products as well as a high demand for insurance, credit, and international remittances. The usage of financial services for the excluded or underserved is costly, time-consuming and unreliable. The needs of low-income households for financial services are high, a Bangladesh study estimates that households are transacting about 60% of their annual income through financial instruments (a combination of formal and informal).41
Estimates indicate that there is a large unmet demand for savings, insurance and credit products (see Figure 13). While designing appropriate and effective credit products remains important, the focus of interventions is increasingly expanding to also include additional product types covering savings, payment systems and insurance. This product snapshot section highlights these additional three product types.
39 G8 Leaders Declaration: “Responsible Leadership for a Sustainable Future”. L´Aquila Summit, July 2009 40 World Bank Payment Systems Development Group, “An Analysis of Trends in the Average Cost of Migrant Remittance Services”, Financial and Private Sector Development Policy Note, April 2010. 41 Stuart Rutherford, “Reaching the Poorest, from ADB conference presentation “Expanding the Frontiers of Commercial Microfinance” on March 14, 2005.
Box 3: G-8 Summit (L’Aquila, July 2009) – 5x5 declaration “Given the development impact of remittance flows, we will facilitate a more efficient transfer and improved use of remittances and enhance cooperation between national and international organizations, in order to implement the recommendations of the 2007 Berlin G-8 Conference and of the Global Remittances Working Group established in 2009 and coordinated by the World Bank. We will aim to make financial services more accessible to migrants and to those who receive remittances in the developing world. We will work to achieve in particular the objective of a reduction of the global average costs of transferring remittances from the present 10% to 5% in 5 years through enhanced information, transparency, competition and cooperation with partners generating a significant net increase in income for migrants and their families in the developing world.”

24
Figure 13 Supply vs. Gap for Financial Products
Source: Oliver Wyman Analysis/ Bill & Melinda Gates Foundation; CGAP.
Current market and regulatory trends can facilitate a more efficient and effective design and delivery of financial services products to the unbanked and underserved. The increasing role of technology for the distribution of financial services, greater product diversification beyond the credit-only approach, increasing commercialization, widening range of players investing in financial inclusion and increasing importance of policy environments all help advance progress in improving financial inclusion (see Figure 14). Delivering financial services to the unbanked via mobile banking technology holds significant progress (see Box 4 for an example of mobile money), with an estimated one billion people in emerging markets that have a mobile phone but no bank account and a projection that this segment will reach 1.7 billion by 2012.42
42 CGAP-GSMA. 2009. “Mobile Money: A US$5 billion Market Opportunity – Initial Findings of the CGAP-GSMA Mobile Money Market Sizing Study”. Available at:
Moreover, studies indicate that this segment represents a strong market opportunity with the potential for the delivery of mobile money services to the unbanked customers to generate $5 billion in direct revenues and $2.5 billion in indirect revenues per year to mobile operators. Many product and service innovations that have changed
http://www.gsmworld.com/mmu/mmu_quarterly_update.pdf. and http://www.cgap.org/p/site/c/template.rc/1.26.10806/. The market sizing study is conducted by McKinsey & Company.
Box 4. Case Study: M-Pesa (Kenya) Perhaps the most commonly cited case study of the ability of branchless banking to transform the financial realities of a population is the case of M-Pesa, a mobile money service offered by Safaricom in Kenya. The service is very popular: as of April 2010, 9 million Kenyans (40% of the population) own an M-Pesa account. According to a 2009 CGAP brief, 77% of survey respondents believe that M-Pesa has raised their household income. Indeed, data shows that money is remitted significantly more frequently and at lower cost as compared to traditional options. Furthermore, since M-Pesa’s launch, the number of Kenyans considered financially included has almost doubled. Source: CGAP 2009, FSD Kenya, Bill and Melinda Gates Foundation (March 2010)

25
the way that financial services have been provided to low-income consumers are also to be found in the microfinance industry (for more details, see Volume 2). Figure 14 Global Trends Shifting the Financial Inclusion Frontier Forward
Source: World Bank Group Team.
Savings Products
Compared to credit and insurance products, the supply gap for savings products is the largest. Estimates indicate that the penetration gap in the supply of savings services is as wide as 70% (see Figure 13). As a result, initiatives that promote savings products for low income households have begun gaining traction globally. These initiatives have gained attention in recent years as evidence continues to grow that strong asset-building skills are key to poverty reduction. While not everyone can and should borrow money, everyone can save a small amount of money. The delivery channels for savings products are diverse and multiple, ranging from MFIs to commercial banks to savings and postal banks (see Figure 13). Matched savings accounts, also known as individual development accounts, are an example of a savings product designed for low-income populations. Holders of these accounts receive matched savings contributions, usually at the rate of 1-to-1 or 2-to-1, with the provision that the account must be used towards certain approved purposes. These purposes may include funding a small business, purchasing a home, or to pay for education. Beneficiaries of matched savings accounts are also sometimes required to participate in financial education training. Pilots in Uganda, Peru, and Taiwan have shown promising results. Child savings accounts43
are another new savings product sometimes combined with matched savings accounts. Countries like the United Kingdom, Singapore, and South Korea are experimenting with or implementing child savings accounts.
Payment Systems and Remittances Products
The area of linking money transfers to financial inclusion remains underexplored. Microfinance institutions occupy a unique position in servicing those poor clients receiving
43 http://www.newamerica.net/files/Matched%20Savings%20Issue%20Brief%20FINAL.pdf Child savings accounts teach asset-building from a young age by providing free savings accounts to children at birth, often with the provision that the money cannot be withdrawn until a certain age.

26
remittances from abroad or within-country transfers. How microfinance institutions could reduce transaction costs and increase the economic impact of those transfers is an area for innovation in the short, medium term. Using clients’ remittances histories to evaluate creditworthiness44
or designing client-centric savings’ programs with remittances funds are examples to be further piloted.
Governments are beginning to use government-to-person (G2P) payments in ways that promote financial inclusion. Today, it is estimated that there are roughly as many low income people receiving government social protection transfers (conditional or unconditional cash transfers45) as there are microfinance clients – about 170 million worldwide46
. While traditional government-to-person payments aim solely to supplement income and provide basic poverty alleviation, many governments are experimenting with the disbursement of funds electronically, often through mobile or card-based banking accounts. In many cases, this requires payment recipients to have a bank account, which automatically places the beneficiary in the financial system and opens the door to additional formal financial services. However, it is important to note that obstacles still exist with this model: for example, infrequent usage of the savings account may nullify much of its benefit and make the business case from banks weak. More pilot programs and research on how to link G2P to financial systems is necessary, in order to harness the potential for using transfer payments as a way to achieving financial inclusion.
Microinsurance Products
Microinsurance represents an emerging product frontier as only three percent of the world’s low-income population is covered by any form of formal insurance against life-cycle shocks or calamities that may affect a whole family, community or region. Most people continue to manage risk through informal mechanisms, such as borrowing from friends and family, and through self-insurance, such as investing in assets that can be sold in hard times. There is increasing interest to offer clients access to microinsurance products in partnership with insurance companies. Innovation is taking place in the area of index-based risk transfer products, these financial instruments make payments based on realizations of an underlying index relative to a pre-specified threshold. The underlying index is a transparent and objectively measured random variable. Examples include area average crop yields, area average crop revenues, cumulative rainfall, cumulative temperature, flood levels, sustained wind speeds, and Richter-scale measures47
. The World Bank has launched the Global Microinsurance Benchmark Database to help provide information on the quality of microinsurance expansion in terms of products, market size and financial and operational performance.
An additional product innovation refers to going “back to the basics” and developing simple, no-frills accounts that have the potential to reach a wide share of the unbanked
Low-Cost / No-Frills Accounts
44 http://blogs.worldbank.org/peoplemove/leveraging-remittances-for-microfinance 45 Such programs were first popularized in Latin America and the Caribbean, but have spread to Africa, Asia, and Europe. Although CCTs are still a relatively novel concept, evidence from Mexico’s Oportunidades program suggests that CCTs can increase savings and investment, promote banking, and create more responsible spending habits. 46 http://www.cgap.org/gm/document-1.9.41174/FN58.pdf 47 http://www.microinsurancenetwork.org/newltr/fichier/MiN_Newsletter_20_EN.pdf

27
Box 5. Mzansi Accounts (launched in 2004 in South Africa)
Features: (i) No monthly fees (ii) No minimum balance (iii) One free monthly cash deposit (iv) Maximum account balance of $1,875 beyond which clients must graduate to regular savings accounts ___________________________________________
Results: (i) More than 6 million Mzansi accounts (by December 2008), significant number out of a total of 32 million adult population. Two thirds of the Mzansi account holders were unbanked. (ii) At least one in ten South Africans has a Mzansi account (iii) One in six banked people are active Mzansi clients (iv) Contributed to increased banked population from 46% (2004) to 64% (2008) Source: Bankable Frontier Associates and FinMark Trust (2009)
segment of the population. Many countries are encouring and have rolled out such financial products and services in order to expand the usage of formal financial services (for example: South Africa, Mexico, Brazil, Malaysia). However, financial inclusion products and policies targeting a single barrier to access, such as fees, will succeed only if that barrier was a binding constraint in the first place. Basic accounts may not prove effective if distance and a lack of financial capability deter their uptake and use. The behavior of the banks is another common theme: many policies mandating that banks behave in a way seen as unprofitable will fail. To achieve financial inclusion, political mandates to banks should be aligned with incentives.48
One example of a basic no-frills account is the Mzansi account in South Africa. The Mzansi account decisively moved the needle of usage to formal financial services in South Africa. Mzansi is an entry-level bank account, based on a magnetic stripe debit card platform, developed by the South African banking industry and launched collaboratively by the four largest commercial banks together with the state-owned Postbank in October 2004.49
The Mzansi account was set up as a simple account with minimum and low-fee requirements and since its introduction has achieved a wide reach (6 million account holders) and contributed towards decreasing the financial access gap (see Box 5 for key features and key results). While not all Mzansi account holders are new to the banking system and not all newly banked are Mzansi account holders, the percentage of adults banked in South Africa increased from 46% in 2004 to 64% in 2008. Of the increase, Mzansi first time banked contributed close to half: 8.2% of the 18% increase.
3.4 Responsible Finance / Customer Focus Responsible finance is addressed by advancing three areas: financial consumer protection regulation, industry self-regulation and financial capability. Responsible finance practices are defined as those promoting more transparent, inclusive and equitable provision of financial products and services. Achieving these practices requires action by three key stakeholders (see Figure 15): the financial services industry (through industry self-regulation including codes of conduct and standards50
48 World Bank Group. 2009. Financial Access 2009.
), governments (through consumer protection policies, regulation and
49 Bankable Frontier Associates and FinMark Trust (2009). 50 For an example of principles developed in the past in another industry, see “Equator Principles” for managing social and environmental issues in project financing. Information available at: http://www.equator-principles.com/
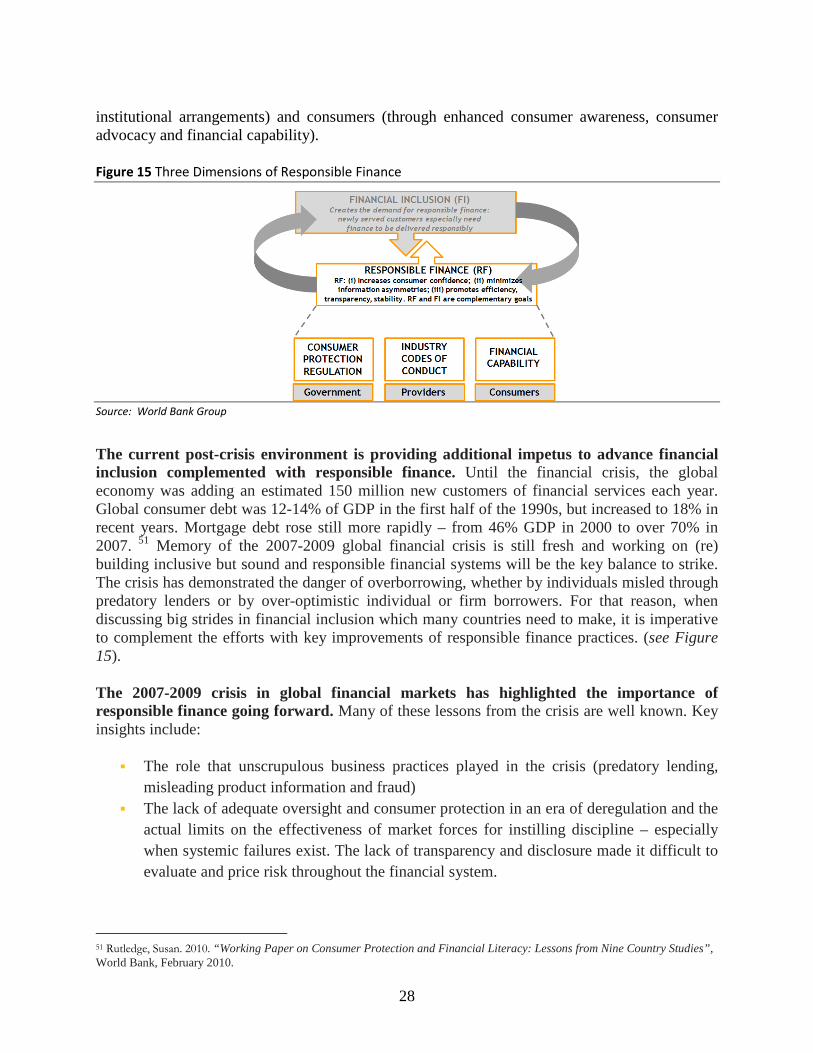
28
institutional arrangements) and consumers (through enhanced consumer awareness, consumer advocacy and financial capability). Figure 15 Three Dimensions of Responsible Finance
Source: World Bank Group
The current post-crisis environment is providing additional impetus to advance financial inclusion complemented with responsible finance. Until the financial crisis, the global economy was adding an estimated 150 million new customers of financial services each year. Global consumer debt was 12-14% of GDP in the first half of the 1990s, but increased to 18% in recent years. Mortgage debt rose still more rapidly – from 46% GDP in 2000 to over 70% in 2007. 51
Memory of the 2007-2009 global financial crisis is still fresh and working on (re) building inclusive but sound and responsible financial systems will be the key balance to strike. The crisis has demonstrated the danger of overborrowing, whether by individuals misled through predatory lenders or by over-optimistic individual or firm borrowers. For that reason, when discussing big strides in financial inclusion which many countries need to make, it is imperative to complement the efforts with key improvements of responsible finance practices. (see Figure 15).
The 2007-2009 crisis in global financial markets has highlighted the importance of responsible finance going forward. Many of these lessons from the crisis are well known. Key insights include:
The role that unscrupulous business practices played in the crisis (predatory lending, misleading product information and fraud)
The lack of adequate oversight and consumer protection in an era of deregulation and the actual limits on the effectiveness of market forces for instilling discipline – especially when systemic failures exist. The lack of transparency and disclosure made it difficult to evaluate and price risk throughout the financial system.
51 Rutledge, Susan. 2010. “Working Paper on Consumer Protection and Financial Literacy: Lessons from Nine Country Studies”, World Bank, February 2010.

29
The limited level of financial capability in the population, even among relatively educated and “sophisticated” financial consumers. When consumers did not understand credit terms, they too often became over-leveraged (over-indebted).
There are other causes of the current crisis including compensation schemes, misaligned incentives, explosion of new financial products followed by defective ratings, and macroeconomic policy. Still, the fact that consumers became unwitting participants through their credit and investment decisions contributed to the spread and scale of the crisis. The crisis demonstrates the importance of responsible lending specifically in mortgage finance, along with adequate risk management and funding instruments but consumer protection as well. The subprime debacle in the US shows that extending access can be extremely harmful to both borrowers and lenders if not done in a sound and responsible way. The key ingredient for the crisis was to lure households to borrow against their own interest by (i) lending against the hypothetical and ever-increasing value of housing assets irrespective of borrowers’ capacity to repay, (ii) originating these loans without incentives to well manage credit risks and (iii) financing this activity through complex risky structured finance. The crisis led to a lasting mistrust among bond investors (mortgage portfolios not being perceived a safe collateral any longer). Efforts to cater to underserved categories must rely on sounder principles such as borrowers’ capacity to repay, Know your Customer rule, proper risk management tools, tighter regulations, and robust funding mechanisms. A growing number of economies including middle income countries are expressing urgent needs in that direction. The financial crisis has also served as an advance warning to potential microfinance markets that are overheating.52 Several dynamic microfinance markets (Bosnia and Hercegovina, Nicaragua, India, Morocco, Pakistan) are showing symptoms of stress, demonstrated by deteriorating portfolio quality, increasing loan delinquencies and perceived or real over-indebtedness of clients. These symptoms are largely the result of inherent vulnerabilities in the market, such as concentrated market competition and multiple borrowing, overstretched MFI systems and controls and an erosion of MFI credit discipline. To address these rising concerns, local and global initiatives (e.g. SMART campaign) are focusing on responsible microfinance.53
Consumer protection regulations and laws are necessary to level the playing field between consumers and financial services providers, minimizing the market failures that can arise from the frequent imbalance of power, information and resources between the two parties. The government has a leading role to play in ensuring that appropriate consumer protection regulation is tailored to promote the financial access and financial sector development of the country. Consumer protection regulation is closely associated with prudential regulation. Policy objectives on these two fronts should therefore be aligned. Consumer protection implies that consumers should be provided with: transparency (disclosure of full, simple and comparable information), choice (fair, non-coercive and reasonable marketing and selling practices, fair
52 For more detail on the impact of the financial crisis on microfinance, see Section 4.3. 53 For more information on the microfinance crisis in these markets, see CGAP Focus Note, “Growth and Vulnerabilities in Microfinance”, February 2010.

30
collections), redress (inexpensive and speedy mechanisms to address complaints and resolve disputes) and privacy (control over collection of and access to personal information).54
Financial capability is the combination of knowledge, understanding, skills, attitudes and especially behaviors which people need in order to make sound personal finance decisions, suited to their social and financial circumstances.55 The need for building financial capability is especially high in nascent low-access markets (see Box 6 for FinScope survey headline statistics in selected countries). The key objective of financial capability programs is to raise financial awareness and improve financial behaviors of consumers so that they can make the best informed financial decisions, given their economic and social circumstances. There can be multiple channels for delivering financial capability programs – financial institutions themselves, education system (e.g. financial education in school curricula), regulatory and supervisory agencies (central banks, banking or financial regulators, consumer protection agencies), the media (newspapers, radio, television, internet), social marketing (road shows, street theatre, entrainment), non-governmental organizations (consumer associations, debt counseling centers) and others.56
To advance responsible finance practices, financial institutions should be driven by: a) do no harm (protective element) and b) do good (ensuring and proving that their finance is pro-growth and pro-poor). Providers also stand to benefit from responsible finance practices. The “do no harm” element rests on principles of transparency, disclosure and improved risk management practices that protect the customer and the financial institution. The “do good” element refers to the pro-active approach by the industry or financial institutions to support the positive impact of their financial operations on individuals, communities and countries in which they operate. To substantiate the “do good” element, private banks should develop and operationalize indicators and measures that evidence and motivate the positive impact of their businesses. While responsible finance initiatives for the microfinance sector have been defined and some are already in endorsement stage (e.g. SMART Campaign which promotes Client Protection Principles57
54 World Bank, Finance and Private Sector Department of the Europe and Central Asia Region, “Good Practices for Consumer Protection and Financial Literacy in Europe and Central Asia: A Diagnostic Tool”, December 2009, Susan Rutledge, “Working Paper on Consumer Protection and Financial Literacy: Lessons from Nine Country Studies”, World Bank, February 2010 and CGAP Consumer Protection Diagnostics.
, with about 1000 signatories and already in implementation stage and Social
55 CGAP Focus Note on Financial Capability (2010) – forthcoming. 56 Ibid and GTZ presentation: “Financial Capability: Empowering Stakeholders and Facilitating Behavioral Change Through Various Channels” and CGAP Draft Focus Note: “Improving the Financial Capability of Poor People Through Financial Education and Financial Literacy Programmes”(forthcoming), discussed in Accra, Ghana at the MFW4A Conference, September 2009. 57 For a full list of campaign endorsers, see: http://www.smartcampaign.org/about-the-campaign/campaign-endorsers
Box 6 LACK OF FINANCIAL CAPABILITY IN PRACTICE
Selected Headline Statistics Pakistan - Only 3% of adults understand what is meant by mobile
banking and mobile phone banking - 71% of adults think they can easily live their life without a bank account
Mozambique 5% of adults have insurance projects - more than half the adult population (50.2%) claim never to have heard of insurance or insurance products.
Tanzania Only 26% of people interviewed had heard of interest on savings accounts, however, none understood how this worked.
Source: FinScope

31
Performance Task Force58
3.5 Data & Measurement
), responsible finance more broadly applied to mainstream private banking sector is still being shaped at the multilateral and global level.
Financial inclusion data is critical in supporting evidence-based policymaking, helping inform the prioritization of efforts and tracking progress of the proposed targets. Without standardized, comparable and regularly updated data at the global and national level, progress tracking and target setting is sub-optimal and lacking direction. Thus, data and measurement is a key and indispensable area of work that requires (1) defining measurable financial inclusion dimensions and (2) improving current and developing existing data collection efforts and indicators towards the goal of establishing an international financial inclusion data platform.59
Financial inclusion data is at an early development stage and therefore it is critical now to ensure that the needed indicators are covered and that the key data are collected and published annually to support progress tracking. Measuring and benchmarking financial access and policy or barriers around financial access is based on three sources: (1) regulators of financial services (supply side); (2) financial institutions (supply side) and (3) surveys of users – individuals or households (demand side). Figure 16 outlines the key existing data reports covering financial inclusion indicators. As of now, there is one existing survey that collects global, comprehensive key financial access data on an annual basis (World Bank Group’s Financial Access). The other reports are focused on a specific dimension financial access. While the supply-side data from financial institutions or regulators tends to be more cost-effective, it lacks the power to reveal information about the client experience and the needs of non-consumers that demand-side surveys can reveal. Thus, comprehensive, standardized demand side data at the global level is also needed. 60
58 http://www.sptf.info/ 59 At the Alliance for Financial Inclusion Annual 2009 Forum, the Bank of Thailand proposed to spearhead the effort of translating pressing policy questions into survey designs and working together with policymakers from multiple countries, to pave the way for an international financial inclusion data platform (Alliance for Financial Inclusion First Annual Global Policy Forum, 14-16 September 2009, Nairobi, Kenya). 60 Alliance for Financial Inclusion, “Financial inclusion measurement for regulators: survey design and implementation”, February 2009.

32
Figure 16 Measuring Financial Access – Key Existing Reports
Source: World Bank Group Team.
On the supply side, the World Bank Group has published the Financial Access 2009 Report based on the results of a regulator survey61. Building on earlier World Bank research, this initiative set out to collect core statistics on access to financial services and review policies supporting broader financial access.62
Financial Access 2009 was the first in a series of annual reports, publishing statistics on the number and value of deposit accounts and loans and retail locations in 139 countries. The report also collected information on several broad policy topics including provision of financial services through postal networks, the use of bank agents, regulations related to opening accounts, branch regulations, credit regulations and transparency and consumer protection. The Financial Access 2010 survey is under way with the report expected in the fall of 2010. This year’s survey asks for information on SME finance in addition to updating the 2009 information.
The International Monetary Fund (IMF) has announced the collection of aggregate data on financial access through a forthcoming Financial Access Survey. It is envisioned that the data will help identify knowledge gaps and priorities for policies on broadening financial access, and enable authorities to monitor the effectiveness of policies over time. The IMF data project is
61 World Bank Group. “Financial Access 2009”, Jake Kendall, Nataliya Mylenko, and Alejandro Ponce. 2010 “Measuring Financial Access around the World.” World Bank Policy Research Working Paper. 62 Earlier World Bank Group research refers to: Beck, Thorsten, Asli Demirgüç-Kunt and Maria Soledad Martinez Peria. 2007. “Reaching Out: Access to and Use of Banking Services across Countries.” Journal of Financial Economics 85(1): 234-66 and Beck, Thorsten, Asli Demirgüç-Kunt and Maria Soledad Martinez Peria. 2008. “Banking Services for Everyone? Barriers to Bank Access and Use Around the World”. World Bank Policy Research Paper 4079. Washington DC: World Bank, which inspired: Banking the Poor: Measuring Banking Access in 54 Economies. 2008. Washington D.C.: World Bank.

33
also designed to promote research and analysis to better understand the determinants and implications of financial access and usage. This data project is supported by Princess Máxima of the Netherlands, UN Secretary-General’s Special Advocate for Inclusive Finance for Development, with Netherlands providing funding for the first project year. 63
Supply-side financial infrastructure indicators provide additional insight into discrete aspects of the enabling environment for financial access. The 2010 Doing Business report released in September 2009 covers 183 economies, the largest share of the globe since the report was first published in 2004. Among the 10 indicators covered by the report, the “Getting Credit” indicator is the most relevant one for informing progress on reforms that support the development of credit information sharing systems and collateral registries / secured transactions. The Getting Credit ranking is composed of two measures: measure of the legal rights of borrowers and lenders (the legal rights index) and measure of the scope and quality of credit information systems (the depth of credit information index). Additional financial infrastructure indicators are covered by the Global Payment Systems Survey and Global Remittance Price Database. To facilitate progress tracking for the 5x5 goal, the World Bank launched the “Remittance Prices Worldwide (RPW)” database in 2008.64 The database, available online, covers 178 country corridors worldwide originating from 24 major remittance sending countries to 85 receiving countries, representing around 60% of total remittances to emerging economies. The objectives of this database are to implement the General Principle 1 (from the General Principles for International Remittance Services issued by the Committee on Payment and Settlement Systems) on transparency and consumer protection65
and provide a global benchmark to assess remittance price trends. These narrowly focused indicators are especially useful as they are able to inform specific reforms needed to create a better enabling environment for financial access. However, they only highlight a part of the puzzle and more of these specific indicators which easily link to reforms, are needed.
On the demand side, household and specialized surveys fill in the gaps on usage as well as provide rich demographic analysis. Household surveys such as the Living Standards Measurement Survey (LSMS) and specialized surveys such as World Bank Access to Finance surveys, FinScope’s FinAccess Surveys and Enterprise Surveys are other sources to enrich the analysis. By allowing for sex-disaggregated analysis, such recent surveys have also highlighted women’s significantly lower access levels in countries such as South Africa, Pakistan and Tajikistan. In addition to gender related aspects of financial inclusion, household surveys can also provide rich data on geographical aspects of financial inclusion for example the rural/urban divide. The forthcoming global household survey spearheaded by the World Bank Group with the support of the Bill & Melinda Gates Foundation will provide a measure of use of different financial services around the world. The regulators have a role to play in facilitating data collection efforts to inform policy-making and track progress. Supervisors concerned with financial stability often collect data on 63 Announced in October 2009: http://www.imf.org/external/np/sec/pr/2009/pr09351.htm. Initial funding for the project is provided by the government of the Netherlands. 64 Available at http://remittanceprices.worldbank.org 65 General Principle 1: “The market for remittance services should be transparent and have adequate consumer protection”. More at http://go.worldbank.org/7AV5X0MGZ0

34
financial depth based on aggregate value of deposits and loans as well as large loans. By collecting data by account holders from financial institutions who have/can have such data on their clients, supervisors can help facilitate this. It is, however, significant that fewer than 70 percent of the sample countries collect information on the number of bank deposits and a mere 30 percent on regulated non bank deposit accounts. Data on loans are even more limited.66
There are multiple avenues to support data collection efforts. For example, to advance its mission of increasing lending opportunities to women, the government of India encouraged measurement and reporting to track and advance this goal which contributed to positive results (see Box 7). The Bank of Thailand recently made a clear case that it is in the regulators’ and policymakers’ interest to monitor policy progress over time and express demand for data. The Central Bank of Kenya was highly involved in the design and implementation of its national financial surveys. In turn, this involvement emboldened the policymakers to use the data from the FinAccess survey conducted by FinScope to make a key decision about how heavily to regulate the relatively new mobile payment system offered by M-Pesa.67
Similarly, encouraging other stakeholders to make an investment in the study may promote wider usage.
66 World Bank Group. Financial Access 2009. 67 Alliance for Financial Inclusion, “Financial inclusion measurement for regulators: survey design and implementation”, February 2009.
Box 7: Government led initiatives in data collection in India Following an Indian Government directive and action plan to increase access to bank loans for women, the Reserve Bank of India (RBI) in 2000 asked public sector banks to disaggregate and report the percentage of credit to women within their total lending. The Government’s action plan set a target of increasing such loans from their 2001 level of 2.4 percent to 5 percent of total lending. This data is reported in RBI’s Trends and Progress Report annually. The aggregate net bank credit to women has since increased to 6.3% in 2009 with 25 banks reaching the target. Though the full impact of the policy requires further analysis, tracking the data has increased awareness of women’s low access levels. Source: Trends and Progress of Banking in India 2009: http://rbidocs.rbi.org.in/rdocs/Publications/PDFs/RTP0809PRD_Full.pdf

35
4. The Way Forward to the G-20 Korea Summit
Advancing progress in financial inclusion will require significantly improving the current state of 70% of the adult population in emerging markets being financially excluded. The global effort in financial inclusion will be driven by setting global targets, focused not only on credit, as credit is just part of the needed portfolio of financial services and products, but on a range of financial products and instruments including payments, remittances, savings and insurance. Global goals will trigger an important area of work in this space which is focused on data and measurement. This focus on data will also include the SME finance space, as data and measurement of the SME finance gap needs improvement and standardization in order to track progress. Currently, the World Bank Group’s Financial Access report collects global comprehensive financial access data on an annual basis. The forthcoming IMF report on financial access, also focused on the supply-side, will provide policymakers with additional annual data to track progress. The forthcoming global household survey conducted by the World Bank Group and supported by the Bill & Melinda Gates Foundation will be valuable in informing the demand-side of the financial inclusion equation. As the supply-side data sources are in an early development stage and the global demand-side data is forthcoming, they need to be supported and improved on an ongoing basis. To make progress and build the foundations for sustainable growth, the World Bank Group recommends the G-20 to convene a global partnership with the relevant stakeholders around a common global financial goal. The efforts should focus not only on credit but on a range of financial products: payments, savings, remittances, insurance. The target would step up pressure to close existing data gaps - in particular the SME finance gap and policy related indicators - ensuring the basic elements are in place to measure progress against the target on an annual basis. Key implementation pillars will include: policy environment, financial infrastructure, delivery mechanisms and products, responsible finance, data & measurement and building on progress made by the Financial Inclusion Experts Group. The implementation will require an integrated and concerted effort leveraging four key drivers: (i) the global development community, (ii) the financial services industry, (iii) national governments and (iv) centers for knowledge sharing. The G-20 are in a unique position to convene those forces for economic development, and complement the effort with the creation of a funding mechanism to provide resources needed for the implementation of the financial inclusion agenda.