korea / automobiles & components hanon systems 018880 · pdf filehanon systems 018880 ks...
TRANSCRIPT

Hanon Systems 018880 KS BNP PARIBAS H James Yoon
11 DECEMBER 2015 KOREA / AUTOMOBILES & COMPONENTS
HANON SYSTEMS 018880 KS
HOW WE DIFFER FROM CONSENSUS MARKET RECS
TARGET PRICE (%) 29.0 POSITIVE 6
EPS 2015 (%) 5.3 NEUTRAL 5
EPS 2016 (%) 4.6 NEGATIVE 1
Heating up KEY STOCK DATA
Sources: FactSet estimates; BNP Paribas estimates
Initiate coverage at BUY; 22% potential upside to KRW60,000 TP We initiate coverage on Hanon with a BUY rating and KRW60,000 TP, which equates to a 2016E P/B of 3.2x (more than 2SD above the nine-year historical mean). Our TP is based on the average of ROIC and ROE-derived fair values and reflects exposure to NEVs, its industry-leading dividend payout and potential upside for inorganic growth.
Capitalising on tighter fuel economies and emissions standards Hanon is leveraging traditional climate control technology to provide non-conventional thermal management and emissions solutions, which can increase fuel economies by reducing energy consumption and improve emissions standards in both traditional and new energy powertrains to meet tightening global regulations.
Execution of revenue and EPS growth strategy key to success New management targets a five-year sales revenue CAGR of 6% to KRW7.3t by 2020. We forecast a 120bp y-y jump in OPM to 7.2% in 2016, stemming from initial efforts to raise operational efficiencies, and to 8% through expansion of non-conventional parts supply and customer diversification by 2020.
Positive commitment to shareholder-friendly initiatives New management’s commitment to shareholder-friendly initiatives is clear, based on its action plan to increase liquidity with a 1:5 share split, maintain steady dividends with an industry-leading payout of c45%, and implement a stock option plan for senior management.
Historical P/BV
Sources: Bloomberg; BNP Paribas
H James Yoon [email protected] +822 2125 0533
Our research is available on Thomson One, Bloomberg, TheMarkets.com, FactSet and on http://eqresearch.bnpparibas.com/index. Please contact your salesperson for authorisation. Please see the important notice on the back page.
PREPARED AND PUBLISHED BY NON-US BROKER-DEALER(S): BNP PARIBAS SECURITIES KOREA CO LTD. THIS MATERIAL HAS BEEN APPROVED FOR U.S DISTRIBUTION. ANALYST
CERTIFICATION AND IMPORTANT DISCLOSURES CAN BE FOUND AT APPENDIX ON PAGE 22
BUY TARGET PRICE KRW60,000
UP/DOWNSIDE +22.2%
CLOSE KRW49,100
2014A 2015E 2016E 2017E
Revenue 5,455 5,537 5,814 6,153
Rec. net profit 278 251 314 347
Recurring EPS (KRW) 2,601 2,352 2,943 3,253
EPS growth (%) (6.9) (9.6) 25.1 10.6
Recurring P/E (x) 18.9 20.9 16.7 15.1
Dividend yield (%) 2.0 2.0 2.4 3.1
EV/EBITDA (x) 9.9 10.1 8.5 7.8
Price/book (x) 3.2 2.9 2.6 2.3
Net debt/Equity (%) 1.2 (0.6) (6.8) (7.9)
ROE (%) 17.8 14.6 16.4 16.2
Share price performance 1 Month 3 Month 12 Month
Absolute (%) 2.9 38.3 6.7
Relative to country (%) 5.5 31.9 9.1
Next Results
Mkt cap (USD m) 4,436
3m avg daily turnover (USD m) 6.4
Free float (%) 30
Major shareholder Hahn&Co. Auto Holdings LLC (51%)
12m high/low (KRW) 50,700/33,000
3m historic vol. (%) 51.2
ADR ticker -
ADR closing price (USD) -
Issued shares (m) 107
YE Dec (KRW b)
February 2016
(35)(30)(25)(20)(15)(10)(5)051015
32,00034,00036,00038,00040,00042,00044,00046,00048,00050,00052,000
Dec-14 Mar-15 Jun-15 Sep-15 Dec-15
Hanon Systems Rel to MSCI Korea(KRW) (%)
0.00.51.01.52.02.53.03.5
2007 2008 2009 2010 2011 2012 2013 2014 2015
(x)
+2 SD
+1 SDAvg
-1 SD-2 SD

Hanon Systems 018880 KS H James Yoon
Investment thesis We believe Hanon is a beneficiary of tightening global fuel efficiency and emissions regulations as it leverages traditional climate control technology to provide non-conventional thermal and emissions solutions, which can increase fuel economies by reducing energy consumption and improve emissions standards in both traditional and new energy powertrains.
New management plans to diversify the global customer base focused on new growth and technology-focused customers, while maintaining its current dominance with Hyundai Motor Group (HMG) and Ford, while at the same time implementing internal cost reduction efforts to raise operational profitability.
Exposure to expected expansion of NEVs (new energy vehicles) and shareholder-friendly initiatives warrant a valuation premium against global peers, in our view. BUY.
Catalyst We see the main event catalyst as the opportunity for further inorganic growth through acquisition of overseas suppliers with specific non-conventional technology and/or access to new customers. The potential earnings catalyst is OPM expansion in the immediate term through implementation of various operational efficiency enhancements in 2016.
Risk to our call Key downside risks to our view are: 1) lower than expected orders from new customers, which would hinder future growth expectations; and 2) inability to improve operational efficiencies of its global production network, which would limit expected profit margin expansion.
Company background Key assumptions
Revenues 2014 2015E 2016E 2017E
HMG (KRW b) 2,392 2,337 2,408 2,461
Ford (KRW b) 1,142 1,179 1,167 1,169
Others (KRW b) 1,920 2,021 2,238 2,523
HMG – as of total (%) 44 42 41 40
Ford– as of total (%) 21 21 20 19
Others – as of total (%) 35 37 39 41
Sources: Hanon Systems; BNP Paribas estimates
Principal activities (revenue, 2014) Earnings sensitivity
Bear-2 Bear-1 Base Bull-1 Bull-2
Change in USD/KRW -5% -1% - 1% 5%
USD/KRW (avg) 1,154 1,203 1,215 1,227 1,276
2016E OP (KRW b) 384 413 421 428 457
Change (%) (8.7) (1.7) 1.7 8.7
Source: Hanon Systems Sources: Hanon Systems; BNP Paribas estimates
Key executives
Age Joined Title
Yeo-Eul Yoon 59 2015 Chairman
In-Young Lee 58 2015 President/CEO/Rep Director
Moon-Ho Choi 48 2013 Senior Managing Director
Beom-Jun Kim 50 2015 CFO/Executive Director
Kwang-Taek Hong 49 2013 CTO/Vice President
www.hanonsystems.com
We estimate non-HMG revenue will account for 59% of the total in 2016.
A 1% change in the USD/KRW rate would result in a 1.7% change in operating profit, keeping all other factors constant.
A 5% change in the USD/KRW rate would result in a 8.7% change in operating profit, keeping all other factors constant.
Hanon Systems manufactures a variety of automotive climate control and thermal management equipment and systems. The Company's products include air conditioners, heaters, cooling modules, compressors, radiators, fans, evaporators, and condensers.
Air conditioner - 69.5%
Compressor - 21.1%
Radiator - 7.1%
Module - 2.3%
2 BNP PARIBAS 11 DECEMBER 2015
Hanon Systems 018880 KS H James Yoon
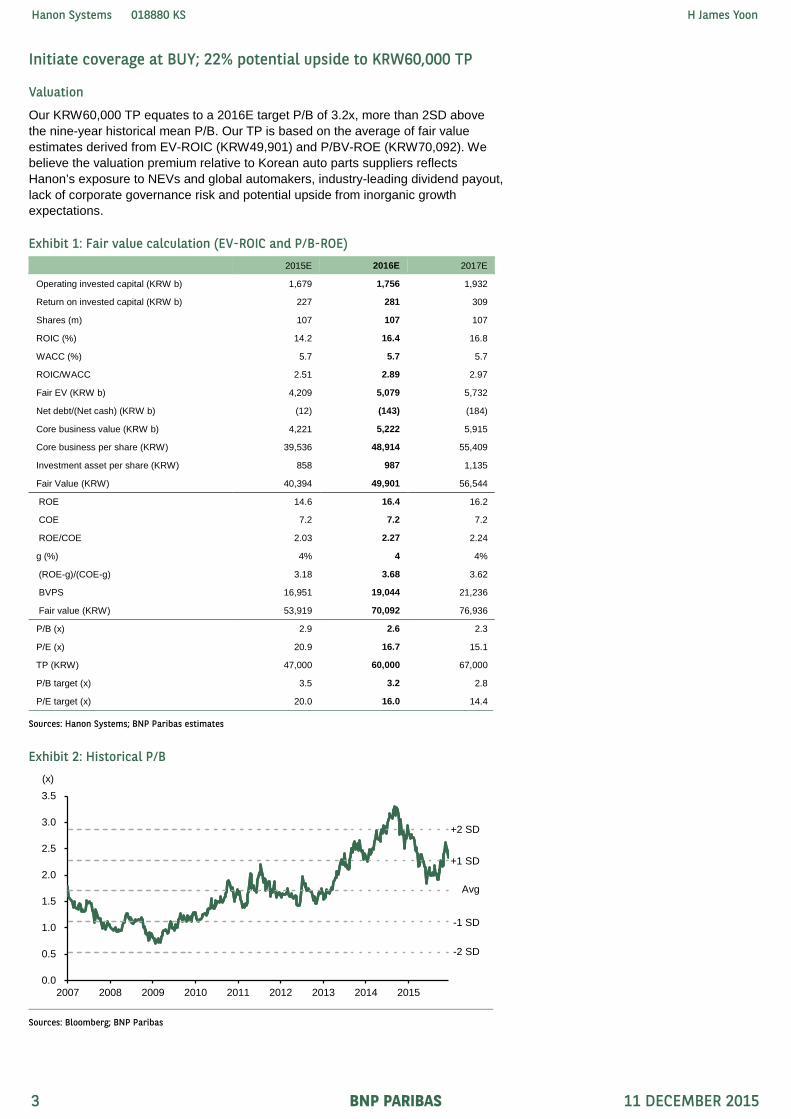
Initiate coverage at BUY; 22% potential upside to KRW60,000 TP
Valuation
Our KRW60,000 TP equates to a 2016E target P/B of 3.2x, more than 2SD above the nine-year historical mean P/B. Our TP is based on the average of fair value estimates derived from EV-ROIC (KRW49,901) and P/BV-ROE (KRW70,092). We believe the valuation premium relative to Korean auto parts suppliers reflects Hanon’s exposure to NEVs and global automakers, industry-leading dividend payout, lack of corporate governance risk and potential upside from inorganic growth expectations.
Exhibit 1: Fair value calculation (EV-ROIC and P/B-ROE) 2015E 2016E 2017E
Operating invested capital (KRW b) 1,679 1,756 1,932
Return on invested capital (KRW b) 227 281 309
Shares (m) 107 107 107
ROIC (%) 14.2 16.4 16.8
WACC (%) 5.7 5.7 5.7
ROIC/WACC 2.51 2.89 2.97
Fair EV (KRW b) 4,209 5,079 5,732
Net debt/(Net cash) (KRW b) (12) (143) (184)
Core business value (KRW b) 4,221 5,222 5,915
Core business per share (KRW) 39,536 48,914 55,409
Investment asset per share (KRW) 858 987 1,135
Fair Value (KRW) 40,394 49,901 56,544
ROE 14.6 16.4 16.2
COE 7.2 7.2 7.2
ROE/COE 2.03 2.27 2.24
g (%) 4% 4 4%
(ROE-g)/(COE-g) 3.18 3.68 3.62
BVPS 16,951 19,044 21,236
Fair value (KRW) 53,919 70,092 76,936
P/B (x) 2.9 2.6 2.3
P/E (x) 20.9 16.7 15.1
TP (KRW) 47,000 60,000 67,000
P/B target (x) 3.5 3.2 2.8
P/E target (x) 20.0 16.0 14.4
Sources: Hanon Systems; BNP Paribas estimates
Exhibit 2: Historical P/B
Sources: Bloomberg; BNP Paribas
0.0
0.5
1.0
1.5
2.0
2.5
3.0
3.5
2007 2008 2009 2010 2011 2012 2013 2014 2015
(x)
+2 SD
+1 SD
Avg
-1 SD
-2 SD
3 BNP PARIBAS 11 DECEMBER 2015

Hanon Systems 018880 KS H James Yoon
Standing out from the crowd
Hanon’s valuations seem to be more in line with those in the Korean EV supply chain, and are also well within the range of top global auto parts peers. We believe this is due to the market’s view of Hanon as a leading global auto parts supplier with strong potential to benefit from the evolution of NEVs.
While the company does not provide any breakdown of operating profitability between conventional and non-conventional parts, the c10% portion of sales revenue from non-conventional parts and our expectation that this will expand to 20% by 2020 suggests a strong contribution, in our view. We believe Hanon enjoys an early mover advantage in non-conventional parts, which are based on quoted market prices with attractive margins, not simple cost-plus prices with volume discounts built in. While Hanon may offer cost-competitive conventional products to its existing customer base, as well as to new mass brands, the company is offering high value-added non-conventional parts and systems to its technology-driven and existing customers, which warrant better profitability.
A key distinction between Hanon and its domestic peers is the lack of Korean “chaebol” risk as it is not part of a large conglomerate. In many cases, affiliates of large groups can be more susceptible to corporate governance risk. The new top management team of Hanon is a select group of auto industry and marketing professionals with many years of experience at various global automakers and parts suppliers, including Hanon itself. Hanon has one of the strongest growth profiles among covered peers with a three-year EPS CAGR of 15% through 2018E, following our expectation of 25% y-y EPS growth in 2016. This is based on expected structural improvements both within the company’s operating base and externally through growth of its non-conventional product lines.
In terms of shareholder returns, our forecast for Hanon’s 2016 dividend payout of 41% is the highest among both auto parts makers and the EV supply chain, based on Bloomberg consensus estimates for peers. ROE is near the high-end of auto parts suppliers as well. We expect the dividend payout to rise to 50% by 2018. Regarding the small free float of 30%, the stock split scheduled for 1Q16 should help to increase liquidity. While no new M&A has been confirmed at this time, new management has stated its willingness to grow inorganically, as well as to acquire smaller competitors in order to gain new technologies (such as the 2014 acquisition of the thermal and emissions business of Cooper-Standard), or widen its customer footprint. We believe any M&A news may act as a positive catalyst for the shares.
Key risks
Key downside risks to our view and target price are the following:
1 Inability to match our revenue and earnings projections due to lower than expected new customer contract wins. Although c60% of new contract wins during 2013-15 have come from new customers (ie non-Ford and Hyundai Motor Group), penetration into new OEMs and their products takes time. Management’s confidence in growth targets will need to be backed up with new business wins. In particular, the China penetration strategy may be a gauge of Hanon’s progress.
2 Inability to achieve operating margin expansion due to lower than expected cost reductions and improvement in operational efficiencies for its global production network. Hanon operates four technical centers globally (Korea, Germany, Czech Republic and US) and 29 manufacturing facilities. Given the vast footprint, management’s objectives to improve procurement supply-chain management, optimise labour and overhead costs, implement design cost innovations and instil best practises at inefficient production centers is a major task with significant upside potential to profitability, but also considerable execution risk.
4 BNP PARIBAS 11 DECEMBER 2015

Hanon Systems 018880 KS H James Yoon
Exhibit 3: Global Auto Parts – valuation comparison
Local CCY (FY16E, F3/17E) BBG code Rec Price Target price Upside/ downside P/E P/BV EV/EBITDA Pay-out ratio Div. yield ROE
(LC) (LC) (%) (x) (x) (x) (%) (%) (%)
Korea Hanon Systems 018880 KS BUY 49,100 60,000 22.2 16.7 2.6 8.6 40.8 2.4 16.4
Hyundai Mobis 012330 KS BUY 234,500 270,000 15.1 6.0 0.8 5.6 12.8 2.1 13.3
Hyundai Wia 011210 KS BUY 112,500 170,000 51.1 5.8 0.8 5.1 4.9 0.8 14.9
Mando 204320 KS BUY 175,000 176,000 0.6 8.3 1.2 5.5 25.0 3.0 15.4
Average 9.2 1.3 6.2 20.9 2.1 15.0
US Johnson Controls JCI US n/a 41.0 n/a n/a 10.9 2.3 7.9 30.3 2.8 20.6
Delphi DLPH US n/a 84.4 n/a n/a 13.5 7.2 9.4 17.7 1.3 n/a
Magna MGA US n/a 42.9 n/a n/a 8.2 1.6 5.3 18.7 2.3 23.8
Borg Warner BWA US n/a 41.1 n/a n/a 12.2 2.4 7.2 16.2 1.3 20.0
Autoliv ALV US n/a 125.6 n/a n/a 17.2 2.9 8.7 33.8 2.0 17.3
Average 12.4 3.3 7.7 23.3 1.9 20.4
Europe Continental CON GY n/a 218 n/a n/a 13.9 2.9 6.9 28.5 2.0 22.0
Valeo FR FP n/a 135 n/a n/a 13.4 2.7 5.7 30.4 2.3 21.5
Average 13.7 2.8 6.3 29.5 2.2 21.7
Japan Denso Corp 6902 JP HOLD 5,792 5,500 (5.0) 16.4 1.3 6.7 33.9 2.1 16.4
Aisin Seiki 7259 JP REDUCE 5,180 3,600 (30.5) 15.8 1.2 3.6 32.0 2.0 16.4
Mitsubishi Electric 6503 JP n/a 1,320 n/a n/a 12.2 1.3 5.5 27.8 2.3 11.4
Sumitomo Electric 5802 JP n/a 1,673 n/a n/a 11.6 0.9 5.3 28.0 2.4 7.8
Toyota Boshoku 3116 JP n/a 2,533 n/a n/a 14.2 1.8 5.3 19.5 1.4 12.8
Average 14.0 1.3 5.3 28.3 2.0 13.0
ROW Motherson Sumi MSS IN n/a 270 n/a n/a 19.6 6.5 5.3 33.9 1.7 36.8
Average 19.6 6.5 5.3 33.9 1.7 36.8
Global Average 12.7 2.4 6.3 25.5 2.0 17.9
Priced at close of business 11 Dec 2015 Sources: Bloomberg; BNP Paribas estimates for covered stocks
Exhibit 4: Korea EV Supply Chain– valuation comparison (KRW) BBG code Rec Price Target price Upside/ downside P/E P/BV EV/EBITDA Pay-out ratio Div. yield ROE
(LC) (LC) (%) (x) (x) (x) (%) (%) (%)
Battery Samsung SDI 006400 KS BUY 128,500 142,000 10.5 22.9 0.7 10.8 17.8 0.8 3.1
LG Chem 051910 KS BUY 326,500 350,000 7.2 15.6 1.7 6.1 19.1 1.3 11.2
SK Innovation 096770 KS BUY 127,500 160,000 25.5 8.4 0.7 6.6 25.0 3.1 8.3
Average
15.6 1.0 7.8 20.6 1.7 7.6
IT-Auto Parts
LG Innotek 011070 KS HOLD 97,900 83,000 (15.2) 16.9 1.2 4.5 4.3 0.3 7.3
LG Electronics 066570 KS HOLD 49,300 48,000 (2.6) 17.0 0.6 3.9 14.0 0.8 3.7
Average 17.0 0.9 4.2 9.2 0.5 5.5
Battery Material
POSCO Chemtech 003670 KS n/a 13,150 n/a n/a 9.8 1.3 5.3 13.0 1.3 14.2
Soulbrain 036830 KS n/a 36,550 n/a n/a 7.3 1.1 3.6 10.4 1.4 15.5
Ecopro 086520 KS n/a 13,150 n/a n/a 25.7 3.0 n/a n/a n/a 10.6
Average
14.3 1.8 4.5 11.7 1.4 13.5
EV Average
15.5 1.3 5.8 14.8 1.3 9.2
Priced at close of business 11 Dec 2015 Sources: Bloomberg; BNP Paribas estimates for covered stocks
5 BNP PARIBAS 11 DECEMBER 2015

Hanon Systems 018880 KS H James Yoon
Capitalising on tighter fuel economies and emissions standards
Hanon Systems is leveraging traditional climate control technology to provide thermal management and emissions solutions, which can increase fuel economies by reducing energy consumption and improve emissions in both traditional and new energy powertrains to meet tightening global regulations. Powertrain management, weight reduction, aerodynamics and other equipment improvements can all help to raise vehicle efficiencies, but these come at an added cost to OEMs, which in turn reflects revenue opportunities for auto parts suppliers like Hanon.
Management forecasts the traditional climate control market to grow at a five-year CAGR of 4% through 2020 to reach KRW47.3t (KRW39.7t in 2015) in sales. As such, this should remain the bread and butter of the company’s sales revenue mix. Conventional parts currently account for c90% of total revenues. Maintaining market shares with core customers is crucial to the growth of Hanon’s climate control business, as is expanding the foot print to mass-brand growth customers and introduction of next generation climate control products.
Meanwhile, the burgeoning thermal management and emissions parts and systems market is expected by management to see a five-year CAGR of 16% through 2020 to reach KRW13.9t (KRW6.5t in 2015) in sales as the auto industry as a whole takes various strategies to improve fuel economies and reduce emissions. Management targets the sales revenue contribution of non-conventional parts to expand to 20% by 2020, from the current c10%. Hanon’s technology customers are already leading the industry as early adopters of thermal and emissions solutions in cutting edge EVs such as the BMW i8 and i3 and the Tesla Model S and Model X.
Despite the recent market focus on zero emission BEVs (battery electric vehicles) as the end game in meeting toughening global fuel emission standards, there are various intermediate technologies that can provide a means to reaching the same end. So-called micro/mild hybrids, which utilise such technologies as ISG (idle stop-and-go) technology, HEVs (hybrid electric vehicles) and PHEVs (plug-in hybrid electric vehicles) are all viable examples of new energy powertrains through which automakers can improve emissions and fuel economies. Down-sized traditional gasoline engines equipped with turbochargers, and even recently tainted clean diesel technology, represent efforts to optimise traditional ICEs (internal combustion engines). GDI (gasoline direct injection) has also been used to increase fuel efficiencies in recent years.
BNP Paribas estimates the number of NEVs (new energy vehicles) on the road will rise from 2.6% of global passenger vehicles last year, to 12.6% in 2020, and 27.8% in 2025. HEVs are likely to remain the dominant form, at two-thirds of NEVs in 2020 and one-half in 2025. FCEVs (fuel-cell electric vehicle) are likely to account for 4-5%
Exhibit 5: Strict regulations lead to changes in the technology landscape
Source: Hanon Systems
Traditional Climate Products
Strict Fuel Flexibilitiy and Emissions Regulation
Thermal & Emission Systems
Charge Air Cooler
Electronic Coolant Pump and Valve
Electronic Throttle Body
Exhaust Gas Recirculation (EGR)
Electronic Watergate Actuator
6 BNP PARIBAS 11 DECEMBER 2015

Hanon Systems 018880 KS H James Yoon
of all NEVs and 1.3% of the entire market in 2025. Note, however, that even 10 years from now we assume traditional ICEs should still account for 72% of total auto sales. We attribute this to considerable room to improve the emissions performance of ICEs and slower adoption rates of costly electrified solutions in EM, which account for more than half of the global market.
Hanon provides new technology parts and systems solutions for all types of vehicle powertrains. For example, powertrain cooling is used to preventing overheating of the ICE by circulating coolant to remove heat from the engine and expelling it to outside or to the cabin to provide heating for the passengers. Another example is the cold storage evaporator, which is an HVAC (heating, ventilating, air conditioning) heat exchanger targeted for micro hybrid (ISG) and mild hybrid electric vehicle applications. Hanon’s cold storage evaporate enables the climate control system to maintain passenger comfort while the vehicle's engine is turned off by adding a phase change material (PCM) inside the evaporator core.
A third example is the electric wastegate actuator used in turbochargers, which help to reduce fuel consumption but enable more torque with smaller engines. This was gained from the acquisition of the thermal and emissions business of Coopers-Standard. A fourth example is the heat pump system, which can help extend the driving range of EVs as it uses minimal energy to control the temperature of the car. This is a thermal management solution for heating BEV, HEV and ICEs through a heat pump, PTC (positive temperature coefficient) heater and electric heater where there is insufficient waste heat for cabin heating or when there is a need to reduce electrical load. Redirection of refrigerant via valves enables cooling of the vehicle using common system components.
Exhibit 6: Global CO2 targets, grams/km Exhibit 7: Diesel engine NOx emission standards
Sources: ICCT; EU; ACEA; JAMA; EPA estimates Sources: JAMA; ICCT; ACEA estimates
Exhibit 8: NEVs as % of light-vehicle sales
Sources: industry associations; IEA; LMC; BNP Paribas estimates
90
110
130
150
170
190
210
2010
2011
2012
2013
2014
2015
2016
2017
2018
2019
2020
(grams/km) EU JapanUS (cars) China
0
50
100
150
200
250
300
2005
2006
2007
2008
2009
2010
2011
2012
2013
2014
2015
2016
2017
2018
2019
2020
(mg/km) EU US Japan
0
5
10
15
20
25
30
2007 2008 2009 2010 2011 2012 2013 2014 2015 2016 2017 2018 2019 2020 2021 2022 2023 2024 2025
(%) HEVs PHEVs BEVs FCEVs All NEVs
7 BNP PARIBAS 11 DECEMBER 2015

Hanon Systems 018880 KS H James Yoon
In a recent BNP Paribas report [Trying to win a negative sum game, 13 October 2015], Japan Autos analyst Clive Wiggins estimated that compliance with tighter regulations, such as the step up from Euro 5 to Euro 6 standards for NOx emissions, has added EUR600/unit to the cost of diesel-powered cars over the past five years. EGR (Exhaust Gas Recirculation) is an example of a key component with which most diesels are equipped. EGR recirculates cooled exhaust gas to the combustion chamber to reduce oxygen supply and hence the peak combustion temperature. This lowers the amount of NOx produced, but raises CO2 emissions. While industry expectations for the “death of diesel” have become commonplace, ironically the market demand for equipment such as EGRs should increase as diesel regulations become stricter as EGRs, which can lead to fuel savings of c3-5%.
The exhibit below shows Hanon’s portfolio of products and modules used to reduce CO2 and NOx emissions. Two main systems are the exhaust heat recovery system and the EGR module, which both recirculate gas and heat from exhaust within the powertrain to improve powertrain efficiencies and reduce emissions.
The exhibit below shows Hanon’s direct and indirect refrigerant cooling systems, which can be used in HEVs, PHEVs and BEVs to regulate the temperature of the battery module. As electric motors become hot, magnets within the motor lose effectiveness and strength. Likewise, as lithium ion batteries overheat, the conductivity of the electrolyte decreases and hinders the movement of ions, which charge and discharge the battery. Thus thermal management systems are needed.
Exhibit 9: Regulations drive thermal innovation
Source: Hanon Systems
Exhibit 10: Refrigerant direct cooling and refrigerant indirect cooling
Source: Hanon Systems
EPA Off-Cycle Credit
CO₂ (2015 - 2025) Average
EGR (Exhaust Gas Recirculation)
NOx (2015 - 2025) Average
EU : 48%
2015: 130g/km2025: 68g/km
US : 37%
2016: 140g/km2025: 89g/km
EU : 50%
2015: 0.08g/km2025: 0.04g/km
US : 70%
2015: 0.08g/km2025: 0.02g/mi
Active Air Flap
Self-Controlled Auto Transmission Fluid Warmer
Exhaust Heat Recovery System
Wavy Fin Type EGR Cooler
EGR Module
Plastic Housing EGR Cooler
EGR / EHRS / Oil Cooler
Condenser
Evaporator
ThermalExpansion Valve
Compressor
Battery Contact Cooler
Battery Module
Refrigerant Direct Cooling
Condenser
Evaporator
ThermalExpansion Valve
Compressor
Battery Module
Refrigerant Indirect Cooling
Chiller
InductionHeater Pump
8 BNP PARIBAS 11 DECEMBER 2015

Hanon Systems 018880 KS H James Yoon
New management to execute revenue and earnings growth strategy
New management targets a sales revenue CAGR of 6% to KRW7.3t by 2020. Hanon plans to diversify the customer base toward what it terms “technology” and “growth” customer groups, while maintaining dominance in its “core” customers – Hyundai Motor Group (HMG) and Ford. Core customers are anchor customers with strong relationships, affordable technology and cost competitiveness. Hanon forecasts a 10-year sales revenue CAGR of 3% for its core customer base to KRW5.2t in 2025, from KRW3.8t in 2015, but a lower revenue contribution of 50%, from 71%. Growth should be fuelled by new model launches and expansion of customer product line-up to include more NEVs. For example, HMG plans to expand its NEV line-up to 22 models from the current 11 models by 2020.
Technology customers such as BMW and Tesla are early adopters of technology requiring advanced co-developed projects and differentiated products, which then cascade down to core customers. Hanon targets a 10-year sales revenue CAGR for technology customers of 16% to KRW1.2t in 2025, from KRW0.3t in 2015, to raise their contribution to 12% from 5%. Growth should stem from increasing supply to high-end hybrid and BEV models. Finally, ‘growth’ customers are large-scale mass brands such as GM and VW, requiring cost competitiveness and significant volumes to justify lower margins. Hanon targets a 10-year sales revenue CAGR of 11% for this segment to KRW3.9t in 2025, from KRW1.3t in 2015, to raise its contribution to 38% from 24%. Supply of both conventional and non-conventional parts and systems in order to improve efficiencies of traditional ICE powertrain models should remain the focus of this large category of customers.
Exhibit 11: Revenue breakdown by customer Exhibit 12: Sales % from non-HMG – Korea Auto Parts
Sources: Company data; BNP Paribas estimates Sources: Company data; BNP Paribas estimates
Exhibit 13: Strategic customer portfolio – Hanon Systems Exhibit 14: Customer diversification target – Hanon Systems
Source: Company data Source: Hanon Systems
0
1,000
2,000
3,000
4,000
5,000
6,000
7,000
2013 2014 2015E 2016E 2017E
(KRW b) Hyundai Motor Hyundai Mobis Ford Others
0
10
20
30
40
50
60
70
Hanon Systems Mando Wia Mobis
(%) 2013 2016E
Core: Anchor customers with strong relationship, affordable technology, cost competitiveness
Technology: Early adopters requiring advanced co-developed projects and differentiated products, which cascade down to Core customers
Growth: Large-scale mass brands requiring cost competitiveness and huge volumes to justify lower margins
Core50%
Technology12%
Growth38%
2025E
Core71%
Technology5%
Growth24%
2015E
9 BNP PARIBAS 11 DECEMBER 2015

Hanon Systems 018880 KS H James Yoon
We forecast a 120bp y-y jump in OPM to 7.2% in 2016, stemming from initial efforts to raise operational efficiencies, and then to 8% by 2020E, through expansion of non-conventional parts supply to c20% of total sales revenue and customer diversification to increase operational leverage. We believe the market will judge new management by the success of its initial execution of cost reduction and efficiency improvement initiatives, which should be reflected in the raising of profit margins within the next few quarters.
While our 2016 forecast calls for a KRW70b increase in operating profit, we believe achievable cost reductions may actually be greater, as management will likely pass on some of the benefits to obtain business wins from new customers. We believe the streamlining of the company’s procurement supply-chain management offers the best opportunity for cost savings, followed by rationalisation of labour and overhead costs.
Since the acquisition of Visteon assets in 2013, there has not been much in the way of visible operational synergies, as the previous regional-based management structure hindered operational synergies post-acquisition. The 2015 results have been down YTD, with a 170bp drop in gross margin to 14.9% as of 9M15 due to the aging product mix of HMG, which translates to lower margins for Hanon, sluggish European business due to underperforming regional plants and EUR currency weakness, and forex hedging losses due to KRW depreciation against USD.
The focus of management in the immediate term is to increase efficiencies by optimising the cost structure, consolidating procurement and implementing standard best practises for manufacturing processes. Such cost reduction efforts are to be accomplished through reorganisation along global functional lines from the previous inefficient local country-based focus, set up of a consolidated IT management system, emphasis on design-cost innovation, raising productivity of underperforming assets, etc.
Management plans to actively expand China sales revenue, which currently stands at cKRW1t, or c19% of total revenues, with 11 plants across the country. Major Chinese OEMs need to partner with qualified global suppliers in order to improve quality, raise fuel economies and reduce emissions. In particular, the race toward lengthening the product line-up of NEVs requires access to various products and technologies, such as heat pump systems, battery coolers, electronic coolant pumps and valves, induction heaters and high voltage electric compressors and air heaters.
Hanon’s China business with local OEMs accounts for only c10% of the company’s China revenues at this time. Some of this legacy business stems from the acquisition of Visteon assets. Hanon says it is engaged in discussions with three of the top five local OEMs and plans to capture business with the remaining two brands. In addition to its wholly-owned China facilities, which house proprietary technology, the company plans to set up new joint ventures with various brands in order to increase
Exhibit 15: OPM trend Exhibit 16: OPM trend by region
Sources: Hanon Systems; BNP Paribas estimates Sources: Hanon Systems; BNP Paribas estimates
0
1
2
3
4
5
6
7
8
4,600
4,800
5,000
5,200
5,400
5,600
5,800
6,000
6,200
6,400
2013 2014 2015E 2016E 2017E
(%)(KRW b) Sales (LHS) OPM (RHS)
0
2
4
6
8
10
12
14
2013 2014 2015E 2016E 2017E
(%) Korea Europe ChinaN America Others
10 BNP PARIBAS 11 DECEMBER 2015

Hanon Systems 018880 KS H James Yoon
penetration. As management is aware of the likelihood of some technology leakage through joint venture structures, control of the production process and proprietary technology will remain a key focus.
We believe inorganic growth will continue to enhance enterprise value through acquisition of new technologies, increased penetration into existing customers, while also facilitating diversification of the customer base and widening the product portfolio. The acquisition of Visteon assets for around KRW422b in 2013 is a prime example of Hanon growing the customer base and gaining scale economies. The acquisition of the thermal and emissions business of Coopers-Standard for around KRW47b in 2014 reflects the access to new products and technology, which complement the company’s existing strengths in traditional climate control and system-based solutions. This acquisition should help to drive the contribution of non-conventional parts sales toward management’s target of 20% by 2020.
Hanon maintains a healthy balance sheet in 2015, with not much change from 2014 net gearing of close to 0% and EBITDA/debt of 1.3x. Free cash flow to equity has averaged KRW104b during the past four-year period, along with sustained average annual capex of KRW185b over the same period. R&D expenses of 3.3% of sales in 2014 have risen to 4% in 2015 YTD. However, we expect Hanon’s net cash position to grow to KRW270b by 2018, to enable funding for potential acquisitions.
Exhibit 17: Revenue expansion through M&A
Sources: Hanon Systems; BNP Paribas estimates
Exhibit 18: Free cash flow breakdown Exhibit 19: Net cash trend
Sources: Hanon Systems; BNP Paribas estimates Sources: Hanon Systems; BNP Paribas estimates
0
5
10
15
20
25
30
35
40
45
0
1,000
2,000
3,000
4,000
5,000
6,000
7,000
2011 2012 2013 2014 2015E 2016E
(y-y %)(KRW b) Hanon Systems (LHS) Visteon (LHS)Cooper Standard (LHS) Revenue growth (RHS)
0
50
100
150
200
250
(600)
(400)
(200)
0
200
400
600
800
2014 2015E 2016E 2017E 2018E
(KRW b)(KRW b)
Depreciation Pre-tax profitCAPEX Net working capital changeOther Free Cash Flow (RHS)
(50)
0
50
100
150
200
250
300
2014 2015E 2016E 2017E 2018E
(KRW b)
11 BNP PARIBAS 11 DECEMBER 2015

Hanon Systems 018880 KS H James Yoon
Positive commitment to shareholder-friendly initiatives
New management set forth three shareholder-friendly initiatives to be set in motion in 2016. The first is to increase liquidity of the existing 30% free float through a 1:5 stock split in 1Q16. This will increase the number of outstanding shares to 533.8m from the current 106.8m. The second is the implementation of a stock-option plan for senior management in order to align its objectives directly in line with those of minority shareholders. The third initiative is to pay quarterly dividends in order to regulate returns to investors throughout the year.
The CFO guides for a steady dividend per share in 2015, similar in amount to the KRW970/share paid to shareholders in 2014, regardless of the company’s earnings this year. During the past four-year period, Hanon’s dividend payout ratio has averaged 33%. While no formal dividend policy based on cash flow or payout of profits has been established by the new management, the CFO guides the stability of absolute dividends to be the main focus for the time being. Based on our 2015 earnings forecast, we estimate dividend per share of KRW970 to equate to a payout ratio of 40%. Subsequently, we expect the dividend payout to rise by 25% per annum during our forecast period, to lead to a payout ratio of 50% in 2018E.
The past dividend history of Hanon places it at the top among global and domestic peers in terms of payout ratio to shareholders. For the most part, the global auto industry offers a dividend payout in the broad range of 20-30%, with higher levels only in rare instances. As such, we believe shareholder returns are one reason why Hanon shares should trade at a premium to peers. We believe expectations for a further increase in payout are justified as this would reflect alignment of a common objective for management, owners, as well as minority shareholders.
Exhibit 20: Timeline for Hanon Systems’ stock split
From To
Board of Directors' resolution 11/5/2015
Shareholders’ meeting 12/22/2015
Tendering of existing shares 12/23/2015 1/25/2016
Suspension of trading 1/22/2016 2/15/2016
Listing of new shares 2/16/2016
Source: FSS
Exhibit 21: Dividend pay-out ratio – Korea Auto Parts Exhibit 22: Dividend and yield trend – Hanon Systems
Sources: Hanon Systems; BNP Paribas estimates Sources: Hanon Systems; BNP Paribas estimates
0
10
20
30
40
50
Hanon Systems Mando Wia Mobis
(%) 2013 2014 2015E 2016E
0.0
0.5
1.0
1.5
2.0
2.5
3.0
3.5
4.0
0
400
800
1,200
1,600
2,000
2014 2015E 2016E 2017E 2018E
(%)(KRW) DPS (LHS) Dividend yield (RHS)
12 BNP PARIBAS 11 DECEMBER 2015

Hanon Systems 018880 KS H James Yoon
Key charts
Product line-up
Exhibit 23: Hanon System’s main products
Climate Control ICE Thermal Management System EV Thermal Management System
HVAC Compressor Cooling Module TF Coolant heater Heat Pump System
Fluid Transport Controller Charge Air Cooler EGR System HV BLDC Cooling Fan Motor
Battery Thermal Management
Ionizer Cooling Module Cold Storage Evaporator Transmission Thermal Management Turbo Blower COD Heater
Source: Hanon Systems
Exhibit 24: Hanon System’s main products (continued)
Source: Hanon Systems
Exhaust Heat Recovery
Battery Thermal Management
Heat PumpSystem
Thin Film HeaterExhaust GasRecirculation
Air ChargeAir Cooler
Water ChargeAir Cooler
Coolant Heater
Centrifugal AirCompressor
High voltage Positive Temperature Coefficient Heater
13 BNP PARIBAS 11 DECEMBER 2015

Hanon Systems 018880 KS H James Yoon
Exhibit 25: Hanon Systems – new technology product
Name Description
Efficient
Water Cooled Condenser
Hanon Systems’ water-cooled condenser is a new concept in vehicle air conditioning and can be included in a heat pump system. It transfers heat from the refrigerant circulating in the system to coolant as an intermediate medium
VS Compressor
A variable swashplate compressor is a pump that can vary its duty cycle and change the amount of refrigerant displaced, which improves power consumption compared to a fixed displacement compressor
RS Compressor
A rotary suction compressor is a pump with a fixed displacement swashplate that draws refrigerant through the centre shaft to deliver better fuel economy by creating less suction loss compared to a traditional suction valve
Cold Storage Evaporator
A cold storage evaporator is an HVAC heat exchanger targeted for micro hybrid (stop-start) and mild hybrid electric vehicle applications. Hanon Systems’ cold storage evaporate enables an A/C system to maintain passenger comfort while the vehicle's engine is turned off by adding a phase change material (PCM) inside the evaporator core
Comfort
High Efficiency Blower
A high efficiency blower scroll re-conceptualized HVAC wheel and scroll geometry to improve power consumption. Hanon Systems has leveraged its expertise in fluid and thermal dynamics to create new shapes and flow patterns to optimize HVAC efficiency
UV LED and Photo catalyst Module
An ultraviolet (UV) light emitting diode (LED) and photocatalyst are electronic devices that generate radicals that attach to and eliminate odour causing substances. Hanon Systems has added this UV LED and Photocatalyst technology to an HVAC module to remove odour causing gases and microorganisms that can grow on an evaporator
CO₂ Sensor
A CO₂ sensor monitors the levels of carbon dioxide in a vehicle cabin. When Hanon Systems’ CO₂ sensor detects level that exceed the threshold, the sensor signals the HVAC to introduce fresh air
Fragrance Module
A fragrance dispenser diffuses a pleasant aroma in the cabin when running the ventilation system. Hanon Systems’ fragrance module offers vehicle occupants a choice of two scents with a toggle witch to turn the system on and off
Eco-Friendly
Fuel Cell Brushless DC Motor
A fuel cell stack, which provides electric power to operate a fuel cell vehicle, generates more heat and needs more cooling power than an internal combustion engine. A cooling module with high power BLDC motors is needed to reduce the temperature of a fuel cell stack, allowing operation in optimal thermal conditions
Fuel Cell Centrifugal Air Compressor
A centrifugal air compressor is a turbine that forces high pressure oxygen into a fuel cell stack to power a fuel cell electric vehicle (FCEV). Hanon Systems’ innovative centrifugal air compressor provides a clean air supply and significantly improves durability and NVH performance compared to a traditional dual lobe screw compressor
Fuel Cell Glycol Heater
A fuel cell glycol heater heats the fuel cell stack for optimal operation during cold start conditions and eliminates oxygen build up around a fuel cell cathode in the event of a vehicle impact.
Heat Pump
A heat pump is a thermal management solution for heating electric, hybrid and internal-combustion engine vehicles where there is insufficient waste heat for cabin heating or when there is a need to reduce electrical load. Redirection of refrigerant via valves enables cooling of the vehicle using common system components.
Source: Hanon Systems
Exhibit 26: Hanon’s hybrid/EV product line-up
Source: Hanon Systems
MicroHybrid
(Idle stop)
Mildhybrid(48V)
FullHybrid
Plug-inHybrid
Fuel CellEV
ElectricVehicle
Kia K5 Hybrid
Kia K5 Hybrid
LF Sonata
2014 Kia PS EV
BMW i3
Hyundai LMFC
Cold Storage Evaporator
48V eCompressor
48V Cooling Fan Motor
48V eSupercharger
High voltageeCompressor
High voltageeCompressor
Exhaust HeatRecovery System
HV iCool Centrifuged Air Compressor
Cathode Oxygen Depletion Heater
HV iCond
Induction HeaterHigh Voltage
Cooling Module
14 BNP PARIBAS 11 DECEMBER 2015

Hanon Systems 018880 KS H James Yoon
Exhibit 27: Product portfolio by market trend
Efficient Light, Compact Turbo Diesel Stop-Start e-Mobility
HV Modular Family Variable Compressor Sliding Door HVAC Charge Air Cooler (CAC) Exhaust Gas
Recirculation (EGR) Cold Storage Evaporator FCEV Centrifugal Air Compressor
Blower Scroll Rotary Suction Compressor (0.4kg lighter than Previous) Water-Cooled CAC Positive Temp
Coefficient Heater 48V e-Compressor Heat Pump
Standardised High Performance-to-weight Evaporator and Heater
Split Condenser (0.24 Drag Coefficient) Low Temp Radiator Exhaust Heat Recovery
Systems (EHRS) Electronic Coolant Pump Battery Thermal Management
Water-Air Cooled Condenser Charge Air Pre-Conditioner Electronic Coolant Valve HV iCool
Source: Hanon Systems
15 BNP PARIBAS 11 DECEMBER 2015

Hanon Systems 018880 KS H James Yoon
Operations
Hanon controls 52% of the Korean climate control market by sales revenue, as the first-tier supplier to HMG, with Doowon (unlisted) as the second-tier supplier with 27% market share. Korea Delphi (unlisted) controls 13% of the marker as the main supplier to GM-Daewoo (unlisted). In the global market, Hanon is the second-largest climate control supplier with 13% market share after Denso which is the main supplier to Toyota. Valeo is the largest European supplier with a global revenue market share of 13%.
As of 2014, air conditioners are the main product of Hanon, accounting for 70% of the total product mix. This is followed by compressors with 21% contribution. In terms of geographies, Korea and Europe are the main markets with respective 28% and 31% contributions to total sales revenue, mainly due to Hanon’s core customers HMG and Ford. This is followed by China and North America, both with roughly 15% of total sales revenue, again mainly due to the company’s core customer base.
Exhibit 28: Domestic climate control market share (2014) Exhibit 29: Global climate control market share (2013)
Source: Company date Sources: Company data; BNP Paribas estimates
Exhibit 30: Revenue breakdown by product Exhibit 31: Revenue breakdown by region
Sources: Hanon Systems; BNP Paribas estimates Sources: Hanon Systems; BNP Paribas estimates
Hanon Systems
52%
Doowon Climate Control
27%
Korea Delphi13%
Others8%
Denso24%
Hanon Systems
13%
Valeo13%Behr
8%
Calsonic5%
Sanden5%
Others32%
0
1,000
2,000
3,000
4,000
5,000
6,000
7,000
2013 2014 2015E 2016E 2017E
(KRW b) Air conditioner Compressor FEM Radiator
0
1,000
2,000
3,000
4,000
5,000
6,000
7,000
2013 2014 2015E 2016E 2017E
(KRW b) Korea Europe China N America Others
16 BNP PARIBAS 11 DECEMBER 2015

Hanon Systems 018880 KS H James Yoon
Historical valuations
Hanon’s shares have been trading above their nine-year average P/E and P/B levels since the acquisition of Visteon assets in 2013, due to the surge in top-line revenues, expectations for continued M&A-fuelled growth and ownership issues with the 70% ownership stake of Visteon up for sale. We believe expectations for further customer diversification, inorganic growth opportunities and structural recovery of profit margins justifies the potential 22% upside to our KRW60,000 target price.
Exhibit 32: Historical P/E Exhibit 33: Historical P/BV
Sources: Hanon Systems; BNP Paribas estimates Sources: Hanon Systems; BNP Paribas estimates
Exhibit 34: Historical EV/EBTIDA
Sources: Hanon Systems; BNP Paribas estimates
Exhibit 35: DuPont analysis
FY10 FY11 FY12 FY13 FY14 FY15E FY16E FY17E FY18E
Net margin (%) 4.6 6.8 6.4 5.7 5.1 4.5 5.4 5.6 5.8
Asset turnover (%) 155.5 161.7 163.4 175.7 168.4 162.7 161.2 160.2 160.2
Equity multiplier (x) 1.8 1.7 1.7 2.0 2.1 2.0 1.9 1.8 1.7
ROE (%) 12.7 18.9 17.6 20.6 17.8 14.6 16.4 16.2 15.9
Sources: Hanon Systems; BNP Paribas estimates
0
10,000
20,000
30,000
40,000
50,000
60,000
70,000
Jun-
06Ja
n-07
Aug-
07M
ar-0
8O
ct-0
8M
ay-0
9D
ec-0
9Ju
l-10
Feb-
11Se
p-11
Apr-1
2N
ov-1
2Ju
n-13
Jan-
14Au
g-14
Mar
-15
Oct
-15
(KRW)
4.4x
8.9x
13.4x
17.9x
22.3x
0
10,000
20,000
30,000
40,000
50,000
60,000
70,000
Jan-
06Au
g-06
Mar
-07
Oct
-07
May
-08
Dec
-08
Jul-0
9Fe
b-10
Sep-
10Ap
r-11
Nov
-11
Jun-
12Ja
n-13
Aug-
13M
ar-1
4O
ct-1
4M
ay-1
5
(KRW)
3.3x
2.7x
2.0x
1.4x
0.7x
0
1,000
2,000
3,000
4,000
5,000
6,000
7,000
Jun-
06Ja
n-07
Aug-
07M
ar-0
8O
ct-0
8M
ay-0
9D
ec-0
9Ju
l-10
Feb-
11Se
p-11
Apr-1
2N
ov-1
2Ju
n-13
Jan-
14Au
g-14
Mar
-15
Oct
-15
(KRW b)
11.2x
9.1x
7.0x
4.8x
2.7x
17 BNP PARIBAS 11 DECEMBER 2015

Hanon Systems 018880 KS H James Yoon
Appendix
Exhibit 36: Shareholding structure – Hanon Systems
Source: Hanon Systems
Exhibit 37: Hanon Systems History
Date Event
1986 Established as Joint Venture between Ford motor Co. and Mando Machinery Corp
1996 Listed on Korea stock Exchange
1999 Visteon became the majority shareholder
2006 Ownership increase in Canada, Portugal, and Thailand (from Visteon)
2007 Ownership increase in India, Beijing and Alabama (from Visteon)
2008 Acquired ownership in Slovakia (from Visteon)
2009 Obtained 100% controlling interests in HVCC Alabama
Sep 2012 Transaction outlined to acquire Visteon Climate business (18 entities and intellectual property)
Jan 2013 Acquired Visteon's climate business
Mar 2013 Changed company name from Halla Climate Control Corp to Halla Visteon Climate Control Corp
Jul 2014 Acquired Cooper-Standard Automotive's thermal and emission business
Sep 2014 Acquisition of majority stake in JCS Nanjing, China
Dec 2014 Hahn & Co. and Hankook Tire acquired Visteon's stake to become majority shareholders
Source: Hanon Systems
Exhibit 38: Major events vs share price v
Source: Hanon Systems
Hahn&Co50.5%
Hankook Tire19.5%
Other30.0%
0
10,000
20,000
30,000
40,000
50,000
60,000
Jan-06 Oct-06 Jul-07 Apr-08 Jan-09 Oct-09 Jul-10 Apr-11 Jan-12 Oct-12 Jul-13 Apr-14 Jan-15 Oct-15
(KRW)
Air-conditioner order of KRW 170b from VW
Application for bankruptcy protection by Visteon
Air-conditioner compressore order of $ 30m from Chrysler
Master service agreement with Visteon
Visteon launches tender offer for Halla Climate Control
Air-conditioner order of KRW 56b from Tesla
Korea's National Pension Service rejects Visteon Tender offer
Acquired Visteon's climate business
Acquires Cooper-Standard automotive/s thermal and emissions business
Visteon decided to sell its stake (70%) to Hahn&Co and Hankook Tire
18 BNP PARIBAS 11 DECEMBER 2015

Hanon Systems 018880 KS H James Yoon
Corporate governance
Board structure
Number of Independent Directors (ID) 5
Percentage of IDs in the board 55.6%(5/9)
ID participation/attendance at board meetings 95%
ID participation in audit/remuneration committees 100%
ID terms (years of service, re-election/replacement procedures) 3 years or less; Nominating Committee will make recommendations to the Board on all appointments, while appointments are finalised at the general meeting
Sources: Hanon Systems; BNP Paribas
Audit Practices
Auditor EY Han Young
Length of service 2 years
Reporting incidents NIL
Fee track record 380m KRW (FY2014)
Policy on change of Audit firm Reviewed annually at the AGM
Sources: Hanon Systems; BNP Paribas
Compensation and remuneration
Directors' remuneration vs. earnings/ROE/share performance KRW492m (FY14)
Changes/stability in senior management As Visteon sold its ownership to Hahn & Co. and Hankook Tire in December, 2014, c50% of senior management was newly appointed in FY15
Incidents of termination of senior management NIL
Track record on Insider sales NIL
Sources: Hanon Systems; BNP Paribas
Shareholders' rights
Communication - shareholder participation in AGMs/EGMs Periodic and timely communication with shareholders for AGM/EGM
Related party transactions In FY14, the company had KRW155.6b in related party transactions for sales, purchase of raw materials, services, fixed asset purchase and disposal, etc.
Voting issues - policies, incidents of rejected proposals NIL
Sources: Hanon Systems; BNP Paribas
19 BNP PARIBAS 11 DECEMBER 2015

Hanon Systems 018880 KS H James Yoon
Financial statements Hanon Systems
Sources: Hanon Systems; BNP Paribas estimates
Profit and Loss (KRW b) Year Ending Dec 2013A 2014A 2015E 2016E 2017E
Revenue 5,189 5,455 5,537 5,814 6,153
Cost of sales ex depreciation (4,164) (4,381) (4,526) (4,681) (4,936)
Gross profit ex depreciation 1,025 1,074 1,011 1,134 1,216Other operating income 0 0 0 0 0
Operating costs (500) (538) (502) (538) (575)
Operating EBITDA 525 536 508 596 641Depreciation (160) (163) (170) (171) (173)
Goodwill amortisation (2) (2) (4) (4) (4)
Operating EBIT 364 370 335 421 464Net financing costs 0 (12) (21) (20) (18)
Associates 8 13 14 15 15
Recurring non operating income 33 13 30 31 31
Non recurring items 0 0 0 0 0
Profit before tax 397 371 344 431 478Tax (85) (80) (83) (104) (116)
Profit after tax 312 290 261 327 362Minority interests (16) (15) (14) (17) (19)
Preferred dividends 0 0 0 0 0
Other items 0 0 0 0 0
Reported net profit 296 275 247 310 343Non recurring items & goodwill (net) 2 2 4 4 4
Recurring net profit 298 278 251 314 347
Per share (KRW)
Recurring EPS * 2,793 2,601 2,352 2,943 3,253
Reported EPS 2,776 2,579 2,314 2,904 3,214
DPS 970 970 970 1,200 1,500
Growth
Revenue (%) 42.1 5.1 1.5 5.0 5.8
Operating EBITDA (%) 24.5 1.9 (5.1) 17.2 7.6
Operating EBIT (%) 17.4 1.9 (9.6) 25.7 10.3
Recurring EPS (%) 27.9 (6.9) (9.6) 25.1 10.6
Reported EPS (%) 28.0 (7.1) (10.3) 25.5 10.7
Operating performance
Gross margin inc depreciation (%) 16.7 16.7 15.2 16.6 17.0
Operating EBITDA margin (%) 10.1 9.8 9.2 10.3 10.4
Operating EBIT margin (%) 7.0 6.8 6.0 7.2 7.5
Net margin (%) 5.7 5.1 4.5 5.4 5.6
Effective tax rate (%) 21.3 21.7 24.2 24.2 24.2
Dividend payout on recurring profit (%) 34.7 37.3 41.2 40.8 46.1
Interest cover (x) n/a 31.4 17.4 22.9 28.1
Inventory days 24.7 30.0 31.2 31.1 31.1
Debtor days 52.0 58.7 60.9 58.0 56.9
Creditor days 49.5 56.6 53.6 50.0 49.5
Operating ROIC (%) 24.5 20.2 16.0 18.7 19.2
ROIC (%) 22.2 17.2 14.3 16.5 16.9
ROE (%) 20.6 17.8 14.6 16.4 16.2
ROA (%) 12.1 9.8 8.5 9.9 10.2*Pre exceptional pre-goodwill and fully diluted
Revenue By Division (KRW b) 2013A 2014A 2015E 2016E 2017E
Air conditioner 3,482 3,791 4,043 4,249 4,505
Compressor 1,193 1,152 1,046 1,095 1,151
Radiator 400 386 320 335 352
Module 113 126 128 136 145
20 BNP PARIBAS 11 DECEMBER 2015

Hanon Systems 018880 KS H James Yoon
Financial statements Hanon Systems
Sources: Hanon Systems; BNP Paribas estimates
Cash Flow (KRW b) Year Ending Dec 2013A 2014A 2015E 2016E 2017E
Recurring net profit 298 278 251 314 347
Depreciation 160 163 170 171 173
Associates & minorities (24) (28) (27) (32) (34)
Other non-cash items (5) 5 14 14 14
Recurring cash flow 431 420 411 472 504Change in working capital (75) (79) (82) 22 (79)
Capex - maintenance (193) (269) (270) (270) (270)
Capex - new investment 0 0 0 0 0
Free cash flow to equity 164 71 59 224 155Net acquisitions & disposals (422) (47) 0 0 0
Dividends paid (76) (104) (104) (104) (128)
Non recurring cash flows 53 22 76 11 14
Net cash flow (281) (57) 32 131 41Equity finance 0 0 0 0 0
Debt finance 226 92 3 (40) (37)
Movement in cash (54) 34 34 91 4
Per share (KRW)
Recurring cash flow per share 4,040 3,933 3,853 4,422 4,725
FCF to equity per share 1,536 668 556 2,096 1,454
Balance Sheet (KRW b) Year Ending Dec 2013A 2014A 2015E 2016E 2017E
Working capital assets 1,358 1,475 1,501 1,496 1,608
Working capital liabilities (962) (999) (943) (960) (993)
Net working capital 396 476 557 536 615Tangible fixed assets 970 1,053 1,122 1,220 1,317
Operating invested capital 1,366 1,528 1,679 1,756 1,932Goodwill 0 0 0 0 0
Other intangible assets 156 172 198 199 200
Investments 86 87 92 105 121
Other assets 37 72 76 79 83
Invested capital 1,645 1,859 2,044 2,140 2,337Cash & equivalents (347) (381) (416) (507) (511)
Short term debt 72 124 338 197 161
Long term debt * 237 277 66 167 167
Net debt (37) 20 (12) (143) (184)Deferred tax 0 0 0 0 0
Other liabilities 63 72 75 75 75
Total equity 1,494 1,619 1,810 2,033 2,267
Minority interests 47 51 63 63 63
Invested capital 1,645 1,859 2,044 2,140 2,337
Per share (KRW)
Book value per share 13,995 15,160 16,951 19,044 21,236
Tangible book value per share 12,534 13,551 15,100 17,181 19,359
Financial strength
Net debt/equity (%) (2.4) 1.2 (0.6) (6.8) (7.9)
Net debt/total assets (%) (1.3) 0.6 (0.3) (4.0) (4.8)
Current ratio (x) 1.6 1.7 1.5 1.7 1.8
CF interest cover (x) n/a 6.8 3.8 12.2 9.7
* includes convertables and preferred stock which is being treated as debt
Valuation 2013A 2014A 2015E 2016E 2017E
Recurring P/E (x) * 17.6 18.9 20.9 16.7 15.1
Recurring P/E @ target price (x) * 21.5 23.1 25.5 20.4 18.4
Reported P/E (x) 17.7 19.0 21.2 16.9 15.3
Dividend yield (%) 2.0 2.0 2.0 2.4 3.1
P/CF (x) 12.2 12.5 12.7 11.1 10.4
P/FCF (x) 32.0 73.5 88.3 23.4 33.8
Price/book (x) 3.5 3.2 2.9 2.6 2.3
Price/tangible book (x) 3.9 3.6 3.3 2.9 2.5
EV/EBITDA (x) ** 9.3 9.9 10.1 8.5 7.8
EV/EBITDA @ target price (x) ** 11.6 12.0 12.2 10.5 9.7
EV/invested capital (x) 3.2 2.9 2.6 2.4 2.2* Pre exceptional & pre-goodwill and fully diluted ** EBITDA includes associate income and recurring non operating income
21 BNP PARIBAS 11 DECEMBER 2015

Hanon Systems 018880 KS H James Yoon
Disclaimers and Disclosures
APPENDIX
DISCLAIMERS AND DISCLOSURES APPLICABLE TO NON-US BROKER-DEALER(S): BNP PARIBAS SECURITIES KOREA CO LTD
ANALYST(S) CERTIFICATION
H James Yoon, BNP Paribas Securities Korea Co Ltd , +822 2125 0533, [email protected] The BNP Paribas Securities Korea Co Ltd Analysts mentioned in this disclaimer are employed by a non-US affiliate of BNP Paribas Securities Corp., and are not registered/ qualified pursuant to NYSE and/or FINRA regulations
The individual(s) identified above certify(ies) that (i) all views expressed in this report accurately reflect the personal view of the analyst(s) with regard to any and all of the subject securities, companies or issuers mentioned in this report; and (ii) no part of the compensation of the analyst(s) was, is, or will be, directly or indirectly, related to the specific recommendations or views expressed herein.
IMPORTANT DISCLOSURES REQUIRED IN THE UNITED STATES BY FINRA RULES AND OTHER JURISDICTIONS "BNP Paribas” is the marketing name for the global banking and markets business of BNP Paribas Group. No portion of this report was prepared by BNP Paribas Securities Corp (US) personnel, and it is considered Third-Party Affiliate research under NASD Rule 2711. The following disclosures relate to relationships between companies covered in this research report and the BNP entity identified on the cover of this report, BNP Securities Corp., and other entities within the BNP Paribas Group (collectively, "BNP Paribas"). The disclosure column in the following table lists the important disclosures applicable to each company that has been rated and/or recommended in this report:
BNP Paribas represents that: 1. Within the past year, it has managed or co-managed a public offering for this company, for which it received fees. 2. It had an investment banking relationship with this company in the last 12 months. 3. It received compensation for investment banking services from this company in the last 12 months. 4. It expects to receive or intends to seek compensation for investment banking services from the subject company/ies in the next 3 months. 5. It beneficially owns 1% or more of any class of common equity securities of the subject company. 6. It makes a market in securities in respect of this company. 7. The analyst(s) or an individual who assisted in the preparation of this report (or a member of his/her household) has a financial interest position in
securities issued by this company. The financial interest is in the common stock of the subject company, unless otherwise noted. 8. The analyst (or a member of his/her household) is an officer, director, or advisory board member of this company or has received compensation from the
company.
IMPORTANT DISCLOSURES REQUIRED IN KOREA The disclosure column in the following table lists the important disclosures applicable to each Korea listed company that has been rated and/or recommended in this report:
1. The performance of obligations of the Company is directly or indirectly guaranteed by BNP Paribas Securities Korea Co. Ltd (“BNPPSK”) by means of payment guarantees, endorsements, and provision of collaterals and/or taking over the obligations.
2. BNPPSK owns 1/100 or more of the total outstanding shares issued by the Company. 3. The Company is an affiliate of BNPPSK as prescribed by Item 3, Article 2 of the Monopoly Regulation and Fair Trade Act. 4. BNPPSK is the financial advisory agent of the Company for the Merger and Acquisition transaction or of the Target Company whereby the size of the
transaction does not exceed 5/100 of the total asset of the Company or the total number of outstanding shares. 5. BNPPSK has taken financial advisory service regarding listing to the Company within the past 1 year. 6. With regards to the tender offer initiated by the Company based on Item 2, Article 133 of the Financial Investment Services and Capital Market Act,
BNPPSK acts in the capacity of the agent for the tender offer designated either by the Company or by the target company, provided that this provision shall apply only where tender offer has not expired.
7. The listed company which issued the stocks in question in case where 40 days has not passed since the new shares were listed from the date of entering into arrangement for public offering or underwriting-related agreement for issuance of stocks
8. The Company that has signed a nominated advisor contract with BNPPSK as defined in Item 2 of Article 8 of the KONEX Market Listing Regulation. 9. The Company is recognized as having considerable interests with BNPPSK in relation to No.1 to No. 8. 10. The analyst or his/her spouse owns (including delivery claims of marketable securities based on legal regulations and trading and misc. contracts) the
following securities or rights (hereinafter referred to as “Securities, etc.” in this Article) regardless of whose name is used in the trading. 1) Stocks, bond with stock certificate, and certificate of pre-emptive rights issued by the Company whose securities dealings are being solicited. 2) Stock options of the Company whose securities dealings are being solicited. 3) Individual stock future, stock option, and warrants that use the stocks specified in Item 1) as underlying.
GENERAL DISCLAIMER
This report was produced by BNP Paribas Securities Korea Co Ltd , member company(ies) of the BNP Paribas Group.
This report is for the use of intended recipients only and may not be reproduced (in whole or in part) or delivered or transmitted to any other person without our prior written consent. By accepting this report, the recipient agrees to be bound by the terms and limitations set forth herein. This report does not constitute a personal recommendation or take into account the particular investment objectives, financial situations, or needs of individual clients. Customers are advised to use the information contained herein as just one of many inputs and considerations prior to engaging in any
Company Ticker Disclosure (as applicable)
N/A N/A N/A
Company Ticker Price (as of 09-Dec-2015 closing price) InterestHanon Systems 018880 KS KRW44,250 N/A
22 BNP PARIBAS 11 DECEMBER 2015

Hanon Systems 018880 KS H James Yoon
trading activity. This report does not constitute a prospectus or other offering document or an offer or solicitation to buy or sell any securities or other investments. This report is not intended to provide the sole basis of any evaluation of the subject securities and companies mentioned in this report. Information and opinions contained in this report are published for reference of the recipients and are not to be relied upon as authoritative or without the recipient’s own independent verification, or taken in substitution for the exercise of judgment by the recipient. Additionally, the products mentioned in this report may not be available for sale in certain jurisdictions. As an investment bank with a wide range of activities, BNP Paribas may face conflicts of interest, which are resolved under applicable legal provisions and internal guidelines. You should be aware, however, that BNP Paribas may engage in transactions in a manner inconsistent with the views expressed in this document, either for its own account or for the account of its clients. Australia: This report is being distributed in Australia by BNP Paribas Sydney Branch, registered in Australia as ABN 23 000 000 117 at 60 Castlereagh Street Sydney NSW 2000. BNP Paribas Sydney Branch is licensed under the Banking Act 1959 and the holder of Australian Financial Services Licence no. 238043 and therefore subject to regulation by the Australian Securities & Investments Commission in relation to delivery of financial services. By accepting this document you agree to be bound by the foregoing limitations, and acknowledge that information and opinions in this document relate to financial products or financial services which are delivered solely to wholesale clients (in terms of the Corporations Act 2001, sections 761G and 761GA; Corporations Regulations 2001, division 2, reg. 7.1.18 & 7.1.19) and/or professional investors (as defined in section 9 of the Corporations Act 2001). Canada: The information contained herein is not, and under no circumstances is to be construed as, a prospectus, an advertisement, a public offering, an offer to sell securities described herein, or solicitation of an offer to buy securities described herein, in Canada or any province or territory thereof. Any offer or sale of the securities described herein in Canada will be made only under an exemption from the requirements to file a prospectus with the relevant Canadian securities regulators and only by a dealer properly registered under applicable securities laws or, alternatively, pursuant to an exemption from the dealer registration requirement in the relevant province or territory of Canada in which such offer or sale is made. The information contained herein is under no circumstances to be construed as investment advice in any province or territory of Canada and is not tailored to the needs of the recipient. To the extent that the information contained herein references securities of an issuer incorporated, formed or created under the laws of Canada or a province or territory of Canada, any trades in such securities must be conducted through a dealer registered in Canada. No securities commission or similar regulatory authority in Canada has reviewed or in any way passed judgment upon these materials, the information contained herein or the merits of the securities described herein, and any representation to the contrary is an offence. Hong Kong: This report is prepared for professional investors and is being distributed in Hong Kong by BNP Paribas Securities (Asia) Limited to persons whose business involves the acquisition, disposal or holding of securities, whether as principal or agent. BNP Paribas Securities (Asia) Limited, a subsidiary of BNP Paribas, is regulated by the Securities and Futures Commission for the conduct of dealing in securities, advising on securities, providing automated trading services, dealing in futures contacts and advising on corporate finance. For professional investors in Hong Kong, please contact BNP Paribas Securities (Asia) Limited for all matters and queries relating to this report. India: In India, this document is being distributed by BNP Paribas Securities India Pvt. Ltd. ("BNPPSIPL"), having its registered office at 5th floor, BNP Paribas House, 1 North Avenue, Maker Maxity, Bandra Kurla Complex, Bandra (East), Mumbai 400 051, INDIA (Tel. no. +91 22 3370 4000 / 6196 4000, Fax no. +91 22 6196 4363). BNPPSIPL is registered with the Securities and Exchange Board of India (“SEBI”) as a research analyst (Regn. No. INH000000792) and as a stockbroker in the Equities and the Futures & Options segments of National Stock Exchange of India Ltd. and BSE Ltd. (SEBI Regn. Nos.: INB/INF/NSF231474835, INB/INF011474831; CIN: U74920MH2008FTC182807; Website: www.bnpparibas.co.in). No material disciplinary action has been taken against BNPPSIPL by any regulatory or government authority. Indonesia: This report is being distributed by PT BNP Paribas Securities Indonesia and is delivered by its licensed employee(s), including marketing/sales person, to its client. PT BNP Paribas Securities Indonesia, having its registered office at Menara BCA, 35th floor, Grand Indonesia, JL. M.H. Thamrin No.1, Jakarta 10310, Indonesia, is a subsidiary company of BNP Paribas SA and licensed under Capital Market Law no. 8 year 1995, a holder of broker-dealer and underwriter licenses issued by the Capital Market and Financial Institution Supervisory Agency (now Otoritas Jasa Keuangan/OJK). PT BNP Paribas Securities Indonesia is also a member of Indonesia Stock Exchange and supervised by Otoritas Jasa Keuangan (OJK). Neither this report nor any copy hereof may be distributed in Indonesia or to any Indonesian citizens except in compliance with applicable Indonesian capital market laws and regulations. This report is not an offer of securities in Indonesia and may not be distributed within the territory of the Republic of Indonesia or to Indonesian citizens in circumstance which constitutes an offering within the meaning of Indonesian capital market laws and regulations. Japan: This report is being distributed to Japanese based firms by BNP Paribas Securities (Japan) Limited or by a subsidiary or affiliate of BNP Paribas not registered as a financial instruments firm in Japan, to certain financial institutions defined by article 17-3, item 1 of the Financial Instruments and Exchange Law Enforcement Order. BNP Paribas Securities (Japan) Limited is a financial instruments firm registered according to the Financial Instruments and Exchange Law of Japan and a member of the Japan Securities Dealers Association, the Financial Futures Association of Japan and the Type II Financial Instruments Firms Association. BNP Paribas Securities (Japan) Limited accepts responsibility for the content of a report prepared by another non-Japan affiliate only when distributed to Japanese based firms by BNP Paribas Securities (Japan) Limited. Some of the foreign securities stated on this report are not disclosed according to the Financial Instruments and Exchange Law of Japan. Malaysia: This report is issued and distributed by BNP Paribas Capital (Malaysia) Sdn Bhd. The views and opinions in this research report are our own as of the date hereof and are subject to change. BNP Paribas Capital (Malaysia) Sdn Bhd has no obligation to update its opinion or the information in this research report. This publication is strictly confidential and is for private circulation only to clients of BNP Paribas Capital (Malaysia) Sdn Bhd. This publication is being provided to you strictly on the basis that it will remain confidential. No part of this material may be (i) copied, photocopied, duplicated, stored or reproduced in any form by any means or (ii) redistributed or passed on, directly or indirectly, to any other person in whole or in part, for any purpose without the prior written consent of BNP Paribas Capital (Malaysia) Sdn Bhd. Philippines: This report is being distributed in the Philippines by BNP Paribas Manila Branch, an Offshore Banking Unit (OBU) of BNP Paribas whose head office is in Paris, France. BNP Paribas Manila OBU is registered as an offshore banking unit under Presidential Decree No. 1034 (PD 1034), and regulated by the Bangko Sentral ng Pilipinas. This report is being distributed in the Philippines to qualified clients of OBUs as allowed under PD 1034, and is qualified in its entirety to the products and services allowed under PD 1034. Singapore: This report is distributed in Singapore by BNP Paribas Securities (Singapore) Pte Ltd ("BNPPSSL") and may be distributed in Singapore only to an Accredited or Institutional Investor, each as defined under the Financial Advisers Regulations ("FAR") and the Securities and Futures Act (Chapter 289) of Singapore, as amended from time to time. In relation to the distribution to such categories of investors, BNPPSSL and its representatives are exempted under Regulation 35 of the FAR from the requirements in Section 36 of the Financial Advisers Act of Singapore, regarding the disclosure of certain interests in, or certain interests in the acquisition or disposal of, securities referred to in this report. For Institutional and Accredited Investors in Singapore, please contact BNP Paribas Securities (Singapore) Ptd Ltd (company registration number: 199801966C; address: 10 Collyer Quay, 34/F Ocean Financial Centre, Singapore 049315; tel: (65) 6210 1288; fax: (65) 6210 1980) for all matters and queries relating to this report. South Africa: In South Africa, BNP Paribas Securities South Africa (Pty) Ltd is a licensed member of the Johannesburg Stock Exchange and an authorised Financial Services Providers and subject to regulation by the Financial Services Board. BNP Paribas Securities South Africa (Pty) Ltd does not expressly or by implication represent, recommend or propose that the financial products referred to in this report are appropriate to the particular investment objectives, financial situation or particular needs of the recipient. This document does not constitute advice as contemplated in the Financial Advisory and Intermediary Services Act, 2002. South Korea: BNP Paribas Securities Korea is registered as a Licensed Financial Investment Business Entity under the FINANCIAL INVESTMENT SERVICES AND CAPITAL MARKETS ACT and regulated by the Financial Supervisory Service and Financial Services Commission. This document does not constitute an offer to sell to or the solicitation of an offer to buy from any person any financial products where it is unlawful to make the offer or solicitation in South Korea. Switzerland: This report is intended solely for customers who are “Qualified Investors” as defined in article 10 paragraphs 3 and 4 of the Swiss Federal Act on Collective Investment Schemes of 23 June 2006 (CISA) and the relevant provisions of the Swiss Federal Ordinance on Collective Investment Schemes of 22 November 2006 (CISO). “Qualified Investors” includes, among others, regulated financial intermediaries such as banks, securities dealers, fund management companies and asset managers of collective investment schemes, regulated insurance companies as well as pension funds and companies with professional treasury operations. This document may not be suitable for customers who are not Qualified Investors and should only be used and passed on to Qualified Investors. For specification purposes, a “Swiss Corporate Customer” is a Client which is a corporate entity, incorporated and existing under the laws of
23 BNP PARIBAS 11 DECEMBER 2015

Hanon Systems 018880 KS H James Yoon
Switzerland and which qualifies as “Qualified Investor” as defined above." BNP Paribas (Suisse) SA is authorised as bank and as securities dealer by the Swiss Federal Market Supervisory Authority FINMA. BNP Paribas (Suisse) SA is registered at the Geneva commercial register under No. CH-270-3000542-1. BNP Paribas (Suisse) SA is incorporated in Switzerland with limited liability. Registered Office: 2 place de Hollande, CH-1204 Geneva. Taiwan: Information on securities that trade in Taiwan is distributed by BNP Paribas Securities (Taiwan) Co., Ltd. Such information is for your reference only. The reader should independently evaluate the investment risks and is solely responsible for their investment decision. Information on securities that do not trade in Taiwan is for informational purposes only and is not to be construed as a recommendation or a solicitation to trade in such securities. BNP Paribas Securities (Taiwan) Co., Ltd. may not execute transactions for clients in these securities. This publication may not be distributed to the public media or quoted or used by the public media without the express written consent of BNP Paribas.
Thailand: Research relating to Thailand and Thailand based issuers is produced pursuant to an arrangement between BNP PARIBAS (“BNPP”) and Finansia Syrus Securities Public Company Limited (“FSS”). FSS International Investment Advisory Securities Co Ltd (“FSSIA”) prepares and distributes research under the brand name “BNP PARIBAS/FSS”. BNPP is not an affiliate of FSSIA or FSS. FSS also publishes a different research product under the brand name “FINANSIA SYRUS,” which is prepared by research analysts who are not part of FSSIA and who may cover the same securities, issuers, or industries that are the subject of this report. The ratings, recommendations, and views expressed in this report may differ from the ratings, recommendations, and views expressed by other research analysts or research teams employed by FSS. This report is being distributed outside Thailand by members of BNP Paribas. Turkey: This report is being distributed in Turkey by TEB Investment (TEB YATIRIM MENKUL DEGERLER A.S., Teb Kampus D Blok Saray Mah. Kucuksu Cad. Sokullu Sok., No:7 34768 Umraniye, Istanbul, Turkey, Trade register number: 358354, www.tebyatirim.com.tr) and outside Turkey jointly by TEB Investment and BNP Paribas. Information, comments and suggestions on investment given in this material are not within the scope of investment consulting. The investment consulting services are rendered tailor made for individuals by competent authorities considering the individuals’ risk and return preferences. However the comments and recommendations herein are based on general principles. These opinions may not be consistent with your financial status as well as your risk and return preferences. Therefore, making an investment decision only based on the information provided herein may not bear consequences in parallel with your expectations. This material issued by TEB Yatırım Menkul Değerler A.Ş. for information purposes only and may be changed without any prior notification. All rights reserved. No part of this material may be copied or reproduced in any manner without the written consent of TEB Yatırım Menkul Değerler A.Ş. Although TEB Yatırım Menkul Değerler A.Ş. gathers the presented material that is current as possible, it does not undertake that all the information is accurate or complete, nor should it be relied upon as such. TEB Yatırım Menkul Değerler A.Ş. assumes no responsibility whatsoever in respect of or arising out or in connection with the content of this material to third parties. If any third party chooses to use the content of this material as reference, he/she accepts and approves to do so entirely at his/her own risk.
United States: This report may be distributed in the United States only to U.S. Persons who are “major U.S. institutional investors” (as such term is defined in Rule 15a-6 under the Securities Exchange Act of 1934, as amended) and is not intended for the use of any person or entity that is not a “major U.S. institutional investor”. U.S persons who wish to effect transactions in securities discussed herein must do so through BNP Paribas Securities Corp., a US-registered broker dealer and member of FINRA, SIPC, NFA, NYSE and other principal exchanges. Certain countries within the European Economic Area: This document may only be distributed in the United Kingdom to eligible counterparties and professional clients and is not intended for, and should not be circulated to, retail clients (as such terms are defined in the Markets in Financial Instruments Directive 2004/39/EC (“MiFID”)). This document will have been approved for publication and distribution in the United Kingdom by BNP Paribas London Branch, a branch of BNP Paribas SA whose head office is in Paris, France. BNP Paribas SA is incorporated in France with limited liability with its registered office at 16 boulevard des Italiens, 75009 Paris. BNP Paribas London Branch (registered office: 10 Harewood Avenue, London NW1 6AA; tel: [44 20] 7595 2000; fax: [44 20] 7595 2555) is lead supervised by the European Central Bank (ECB) and the Autorité de Contrôle Prudentiel et de Résolution (ACPR). BNP Paribas London Branch is authorised by the ACPR and the Prudential Regulation Authority (PRA) and subject to limited regulation by the Financial Conduct Authority and PRA. Details about the extent of our authorisation and regulation by the PRA, and regulation by the Financial Conduct Authority are available from us on request. This report has been approved for publication in France by BNP Paribas, a credit institution licensed as an investment services provider by the ACPR whose head office is 16, Boulevard des Italiens 75009 Paris, France. This report is being distributed in Germany either by BNP Paribas London Branch or by BNP Paribas Niederlassung Frankfurt am Main, regulated by the Bundesanstalt für Finanzdienstleistungsaufsicht (BaFin). Other Jurisdictions: The distribution of this report in other jurisdictions or to residents of other jurisdictions may also be restricted by law, and persons into whose possession this report comes should inform themselves about, and observe, any such restrictions. By accepting this report you agree to be bound by the foregoing instructions. This report is not directed to, or intended for distribution to or use by, any person or entity that is a citizen or resident of or located in any locality, state, country, or other jurisdiction where such distribution, publication, availability or use would be contrary to law or regulation. All research reports are disseminated and available to all clients simultaneously through our internal client websites. For all research available on a particular stock, please contact the relevant BNP Paribas research team or the author(s) of this report.
Additional Disclosures Target price history, stock price charts, valuation and risk details, and equity rating histories applicable to each company rated in this report is available in our most recently published reports available on our website: http://eqresearch.bnpparibas.com, or you can contact the analyst named on the front of this note or your BNP Paribas representative. All share prices are as at market close on 11 December 2015 unless otherwise stated.
RECOMMENDATION STRUCTURE
Stock Ratings Stock ratings are based on absolute upside or downside, which we define as (target price* - current price) / current price. BUY (B). The upside is 10% or more. HOLD (H). The upside or downside is less than 10%. REDUCE (R). The downside is 10% or more. Unless otherwise specified, these recommendations are set with a 12-month horizon. Thus, it is possible that future price volatility may cause a temporary mismatch between upside/downside for a stock based on market price and the formal recommendation. * In most cases, the target price will equal the analyst's assessment of the current fair value of the stock. However, if the analyst doesn't think the market will reassess the stock over the specified time horizon due to a lack of events or catalysts, then the target price may differ from fair value. In most cases, therefore, our recommendation is an assessment of the mismatch between current market price and our assessment of current fair value. Industry Recommendations Improving (): The analyst expects the fundamental conditions of the sector to be positive over the next 12 months. Stable (previously known as Neutral) (): The analyst expects the fundamental conditions of the sector to be maintained over the next 12 months. Deteriorating (): The analyst expects the fundamental conditions of the sector to be negative over the next 12 months. Country (Strategy) Recommendations Overweight (O). Over the next 12 months, the analyst expects the market to score positively on two or more of the criteria used to determine market recommendations: index returns relative to the regional benchmark, index sharpe ratio relative to the regional benchmark and index returns relative to the market cost of equity. Neutral (N). Over the next 12 months, the analyst expects the market to score positively on one of the criteria used to determine market recommendations: index returns relative to the regional benchmark, index sharpe ratio relative to the regional benchmark and index returns relative to the market cost of equity. Underweight (U). Over the next 12 months, the analyst does not expect the market to score positively on any of the criteria used to determine market recommendations: index returns relative to the regional benchmark, index sharpe ratio relative to the regional benchmark and index returns relative to the market cost of equity.
24 BNP PARIBAS 11 DECEMBER 2015

Hanon Systems 018880 KS H James Yoon
RATING DISTRIBUTION (as at 11 December 2015)
Should you require additional information concerning this report please contact the relevant BNP Paribas research team or the author(s) of this report. © 2015 BNP Paribas Group
Total BNP Paribas coverage universe 722 Investment Banking Relationship (%)
Buy 421 (58.3%) Buy 32.54
Hold 190 (26.3%) Hold 38.95
Reduce 111 (15.4%) Reduce 39.64
25 BNP PARIBAS 11 DECEMBER 2015