kongsberg automotive · – increased r&d effort for driver control on ... 1.90 1.93 2.04 2.03...
TRANSCRIPT
1 1
Kongsberg Automotive Second quarter 2014 | July 11, 2014
2
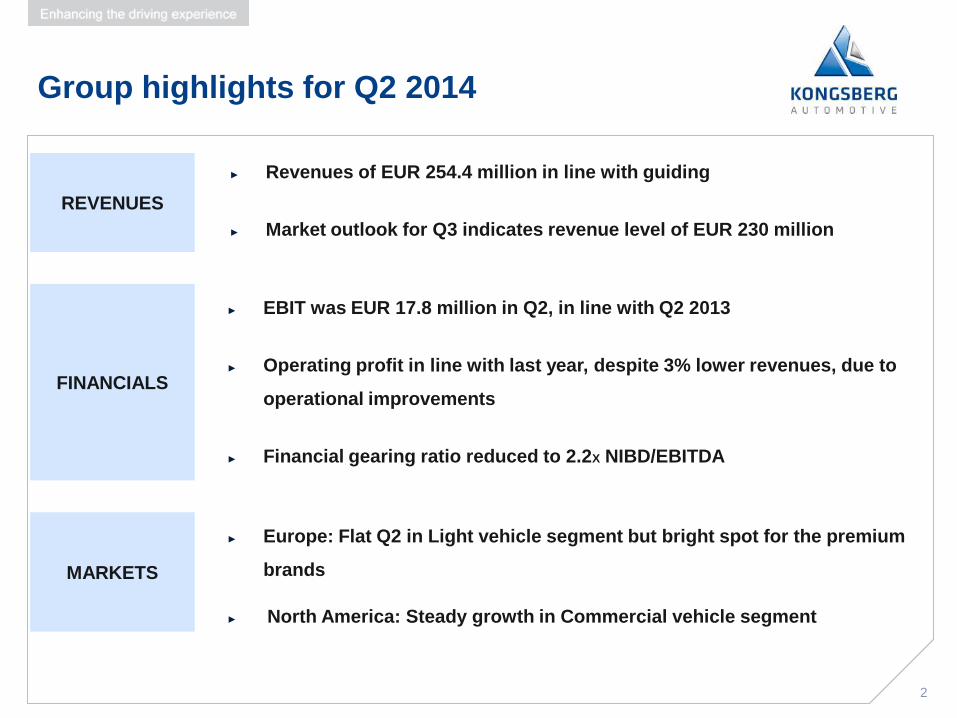
Group highlights for Q2 2014
REVENUES
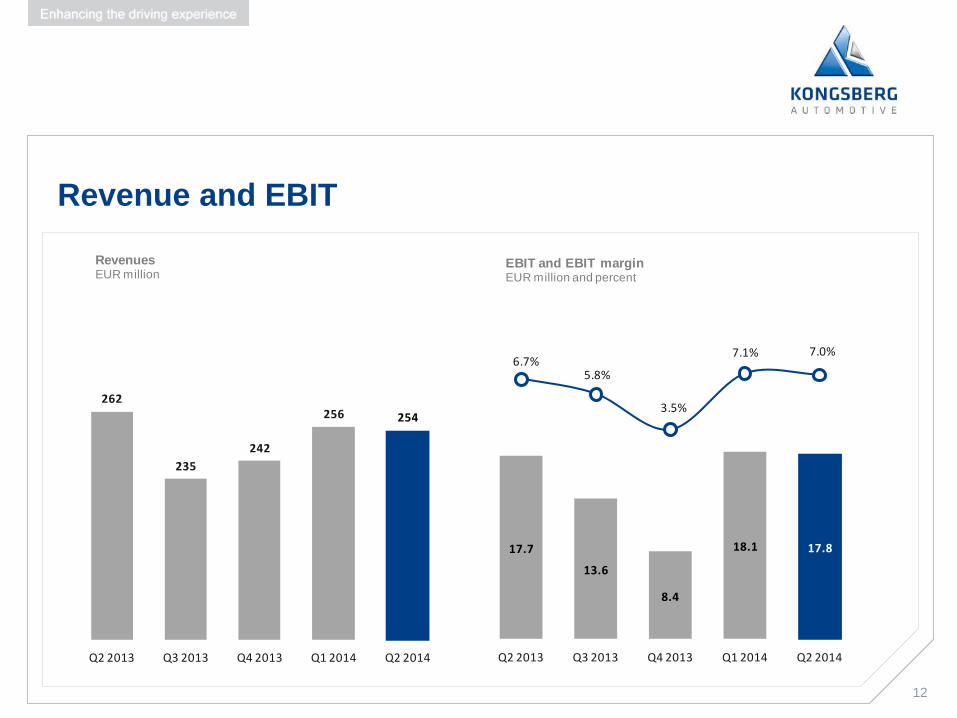
► Revenues of EUR 254.4 million in line with guiding
► Market outlook for Q3 indicates revenue level of EUR 230 million
FINANCIALS
► EBIT was EUR 17.8 million in Q2, in line with Q2 2013
► Operating profit in line with last year, despite 3% lower revenues, due to
operational improvements
► Financial gearing ratio reduced to 2.2X NIBD/EBITDA
MARKETS
► Europe: Flat Q2 in Light vehicle segment but bright spot for the premium
brands
► North America: Steady growth in Commercial vehicle segment
3
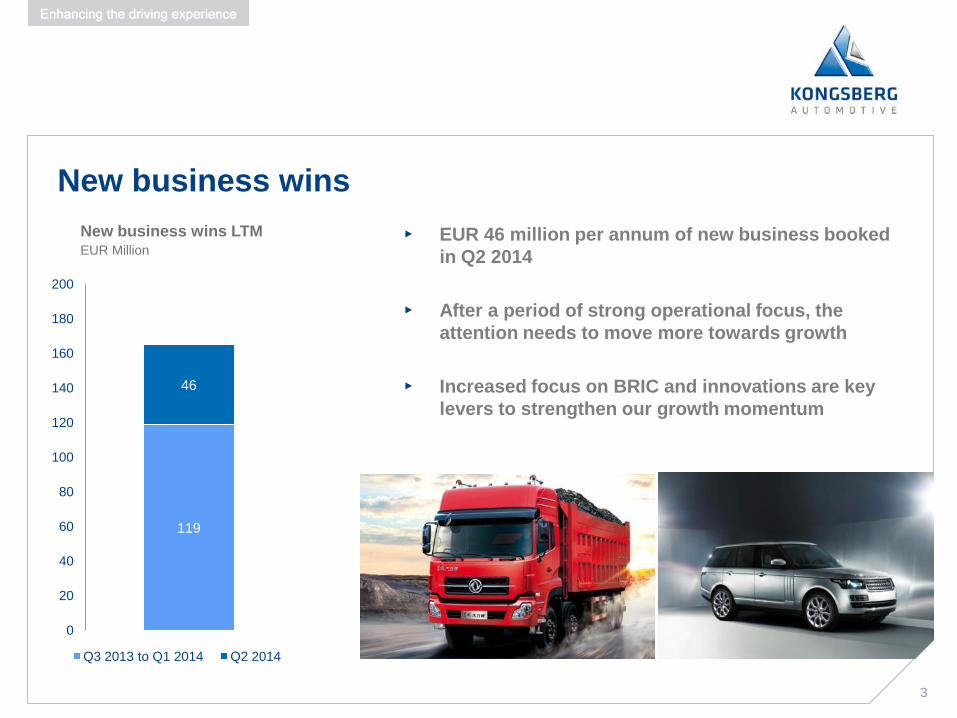
New business wins
▸ EUR 46 million per annum of new business booked
in Q2 2014
▸ After a period of strong operational focus, the
attention needs to move more towards growth
▸ Increased focus on BRIC and innovations are key
levers to strengthen our growth momentum
New business wins LTM EUR Million
119
46
0
20
40
60
80
100
120
140
160
180
200
Q3 2013 to Q1 2014 Q2 2014
3
4 4
OPERATIONAL REVIEW
Hans Peter Havdal, President & CEO
5
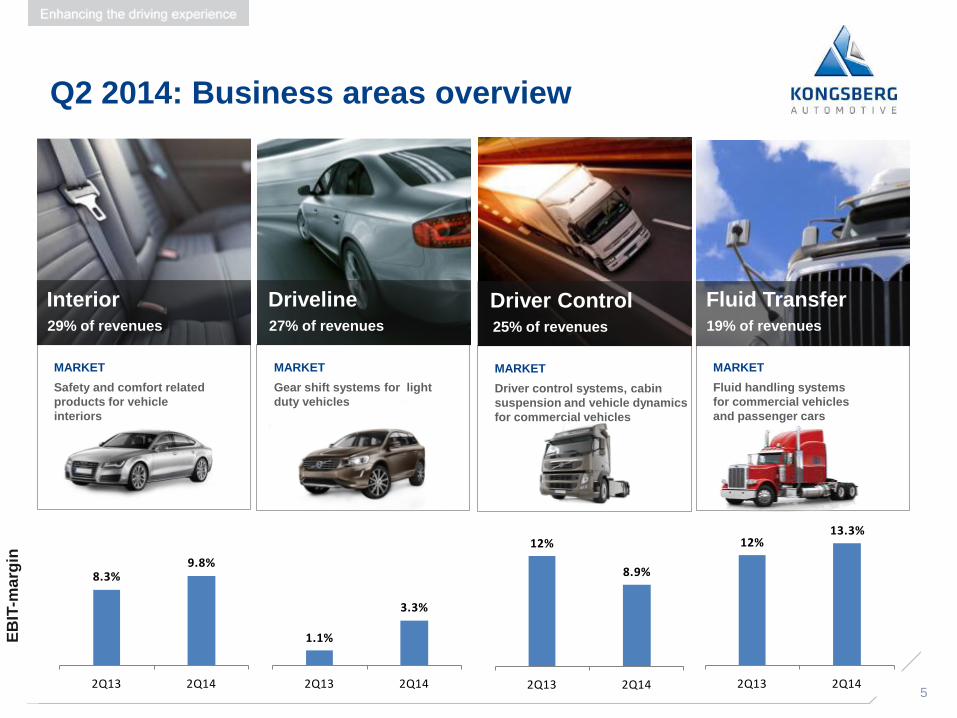
Safety and comfort related
products for vehicle
interiors
Interior
MARKET
Gear shift systems for light
duty vehicles
Driveline
MARKET
29% of revenues 27% of revenues
Driver control systems, cabin
suspension and vehicle dynamics
for commercial vehicles
Driver Control
MARKET
25% of revenues
EB
IT-m
arg
in
Q2 2014: Business areas overview
Fluid handling systems
for commercial vehicles
and passenger cars
MARKET
Fluid Transfer 19% of revenues
8.3%9.8%
2Q13 2Q14
1.1%
3.3%
2Q13 2Q14
12%
8.9%
2Q13 2Q14
12%13.3%
2Q13 2Q145

6
Highlights and performance
COMMERICAL VEHICLES
▸ Operational update
– Increased R&D effort for Driver Control on
developing Automated Manual Transmission (AMT)
technology which is growing in mature markets
– Increased R&D spend will continue
– Industry still consolidates further with Volkswagen
increasing ownership in Scania to 99.6% in Q2
– KA has strong foothold in Scania
– Opportunities for growth at VW/MAN
6

7
Highlights and performance
PASSENGER CARS
▸ Operational update
– Driveline continues to further improve margins &
increase focus on profitable growth
– New program launch for Chrysler for automatic shifters
• Volume 270.000 units annually from Nuevo
Laredo (Mexico) facility
– Interior increasing market momentum by demonstrating
new innovations
• Successful Tech Day with BMW in May
7
8 8
IMPORTANT BUSINESS WINS IN Q2
KA in the Premium automotive segment
9
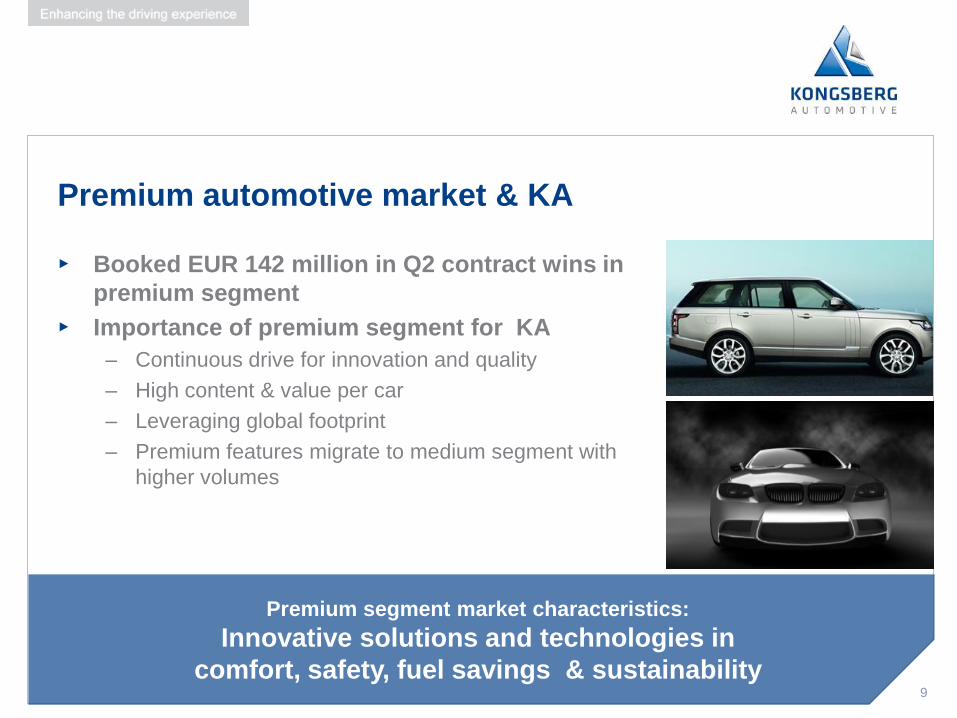
Premium automotive market & KA
▸ Booked EUR 142 million in Q2 contract wins in
premium segment
▸ Importance of premium segment for KA
– Continuous drive for innovation and quality
– High content & value per car
– Leveraging global footprint
– Premium features migrate to medium segment with
higher volumes
9
Premium segment market characteristics:
Innovative solutions and technologies in
comfort, safety, fuel savings & sustainability
10
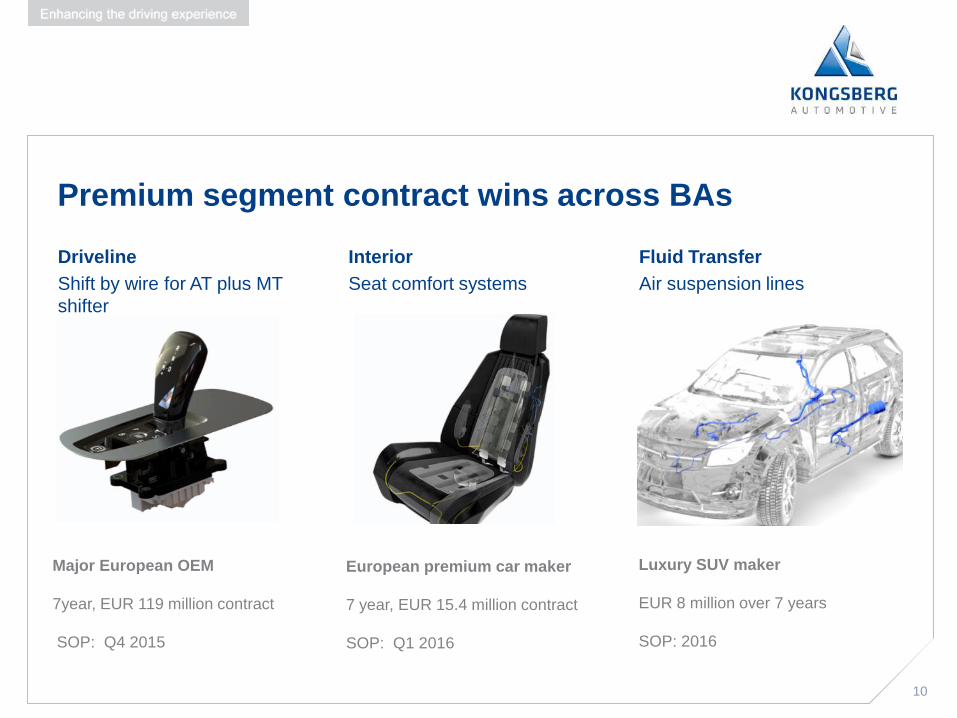
Premium segment contract wins across BAs
Driveline
Shift by wire for AT plus MT
shifter
Interior
Seat comfort systems
Fluid Transfer
Air suspension lines
Major European OEM
7year, EUR 119 million contract
SOP: Q4 2015
European premium car maker
7 year, EUR 15.4 million contract
SOP: Q1 2016
Luxury SUV maker
EUR 8 million over 7 years
SOP: 2016
10

11
FINANCIAL UPDATE
Trond Stabekk EVP & CFO
11
12
Revenue and EBIT
262
235
242
256 254
Q2 2013 Q3 2013 Q4 2013 Q1 2014 Q2 2014
Revenues EUR million
17.7
13.6
8.4
18.1 17.8
6.7%5.8%
3.5%
7.1% 7.0%
Q2 2013 Q3 2013 Q4 2013 Q1 2014 Q2 2014
EBIT and EBIT marginEUR million and percent

13
Segment financials 2nd quarter
Revenues and EBITDA margin EUR million and percent
7871 74
78 78
Interior
Revenues
6.5 5.2 5.4 8.3 7.6
8.3% 7.3% 7.4%10.6% 9.8%
Q2 2013
Q3 2013
Q4 2013
Q1 2014
Q2 2014
EBIT
7267 69 69 71
Driveline
Revenues
0.8 1.0
-0.40.6
2.3
1.1% 1.6%
-0.6%
0.9%
3.3%
Q2 2013
Q3 2013
Q4 2013
Q1 2014
Q2 2014
EBIT
72
58 6067 67
Driver Control
Revenues
8.7 4.8 1.6 6.6 5.9
12.0%8.4%
2.6%
9.8% 8.9%
Q2 2013
Q3 2013
Q4 2013
Q1 2014
Q2 2014
EBIT
48 47 48 50 49
Fluid
Revenues
5.8 6.2 6.2 6.6 6.5
12.0% 13.1% 12.9% 13.2% 13.3%
Q2 2013
Q3 2013
Q4 2013
Q1 2014
Q2 2014
EBIT
14
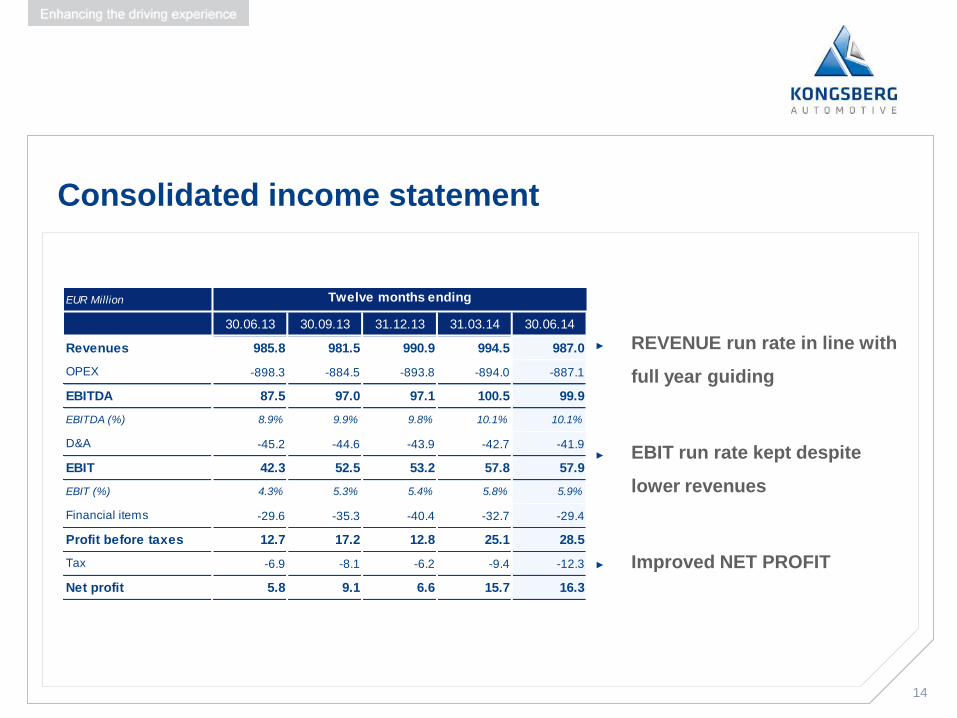
Consolidated income statement
► REVENUE run rate in line with
full year guiding
► EBIT run rate kept despite
lower revenues
► Improved NET PROFIT
30.06.13 30.09.13 31.12.13 31.03.14 30.06.14
985.8 981.5 990.9 994.5 987.0
-898.3 -884.5 -893.8 -894.0 -887.1
87.5 97.0 97.1 100.5 99.9
8.9% 9.9% 9.8% 10.1% 10.1%
-45.2 -44.6 -43.9 -42.7 -41.9
42.3 52.5 53.2 57.8 57.9
4.3% 5.3% 5.4% 5.8% 5.9%
-29.6 -35.3 -40.4 -32.7 -29.4
12.7 17.2 12.8 25.1 28.5
-6.9 -8.1 -6.2 -9.4 -12.3
5.8 9.1 6.6 15.7 16.3
Financial items
Profit before taxes
Tax
Net profit
D&A
EBIT
EBIT (%)
Twelve months ending
Revenues
OPEX
EBITDA
EBITDA (%)
EUR Million
15
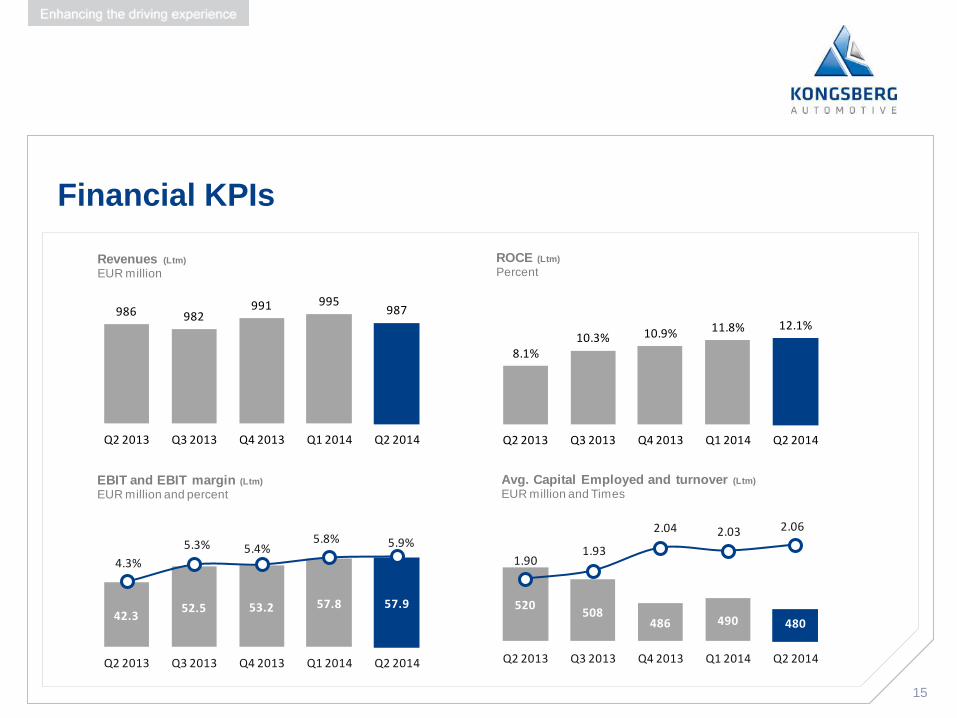
Financial KPIs
75.3
986 982991 995
987
Q2 2013 Q3 2013 Q4 2013 Q1 2014 Q2 2014
Revenues (Ltm)
EUR million
8.1%10.3% 10.9% 11.8% 12.1%
Q2 2013 Q3 2013 Q4 2013 Q1 2014 Q2 2014
ROCE (Ltm)
Percent
42.352.5 53.2 57.8 57.9
4.3%
5.3% 5.4%5.8% 5.9%
Q2 2013 Q3 2013 Q4 2013 Q1 2014 Q2 2014
EBIT and EBIT margin (Ltm)
EUR million and percent
520508
486 490 480
1.901.93
2.04 2.03 2.06
Q2 2013 Q3 2013 Q4 2013 Q1 2014 Q2 2014
Avg. Capital Employed and turnover (Ltm)
EUR million and Times
16
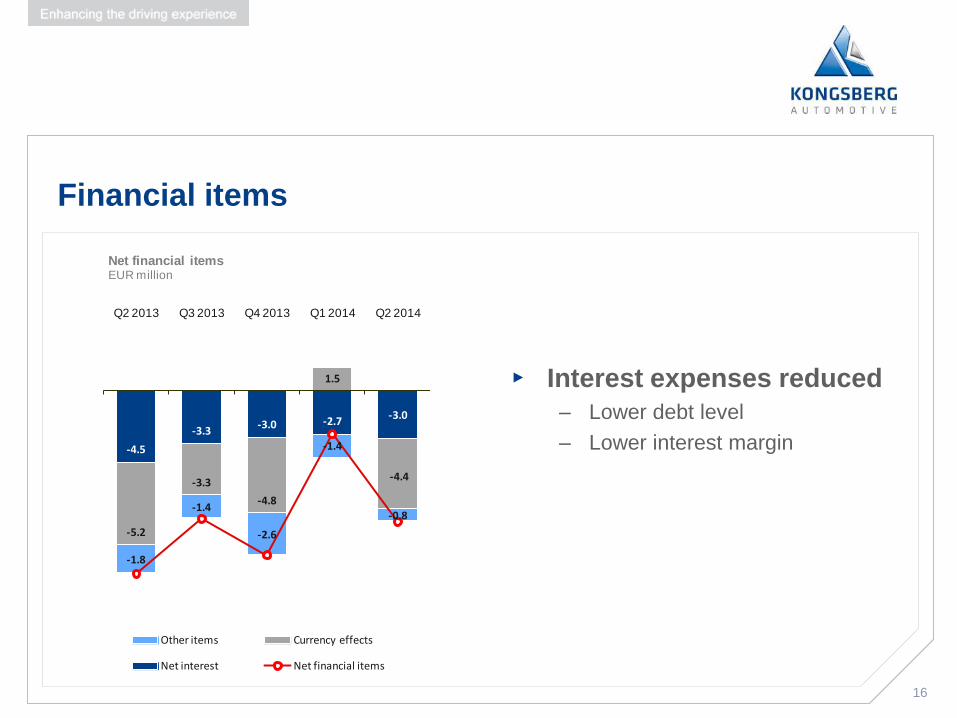
Financial items
▸ Interest expenses reduced
– Lower debt level
– Lower interest margin
-4.5
-3.3-3.0 -2.7
-3.0
-5.2
-3.3
-4.8
1.5
-4.4
-1.8
-1.4
-2.6
-1.4
-0.8
Q2 2013 Q3 2013 Q4 2013 Q1 2014 Q2 2014
Other items Currency effects
Net interest Net financial items
Net financial itemsEUR million
17
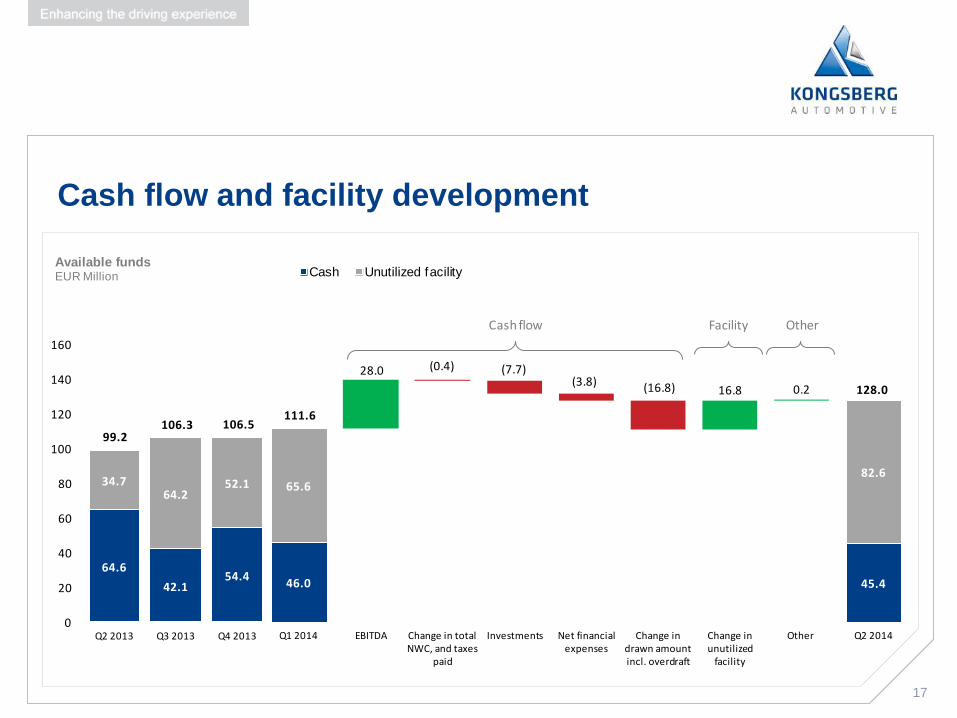
Cash flow and facility development
75.3 61.8
64.6
42.154.4
34.764.2
52.1
99.2 106.3 106.5
0
20
40
60
80
100
120
140
160
Q2 2013 Q3 2013 Q4 2013
Available fundsEUR Million
46.0 45.4
(0.4) (7.7)(3.8) (16.8)
28.0
16.8 0.2
65.682.6
111.6
128.0
Q1 2014 EBITDA Change in total NWC, and taxes
paid
Investments Net financial expenses
Change in drawn amount incl. overdraft
Change in unutilized
facility
Other Q2 2014
Cash Unutilized facility
Cash flow Facility Other

18
Financial ratios
275265
241 239223
Q2 2013 Q3 2013 Q4 2013 Q1 2014 Q2 2014
NIBDEUR million
189.4193.4
189.6
198.6
206.0
Q2 2013 Q3 2013 Q4 2013 Q1 2014 Q2 2014
EquityEUR million
3.12.7
2.5 2.4 2.2
Q2 2013 Q3 2013 Q4 2013 Q1 2014 Q2 2014
NIBD/EBITDATimes
25.2%
27.4% 27.6%28.7%
30.1%
Q2 2013 Q3 2013 Q4 2013 Q1 2014 Q2 2014
Equity ratioPercent
19 19
MARKET UPDATE
Philippe Toth, VP Investor Relations and M&A
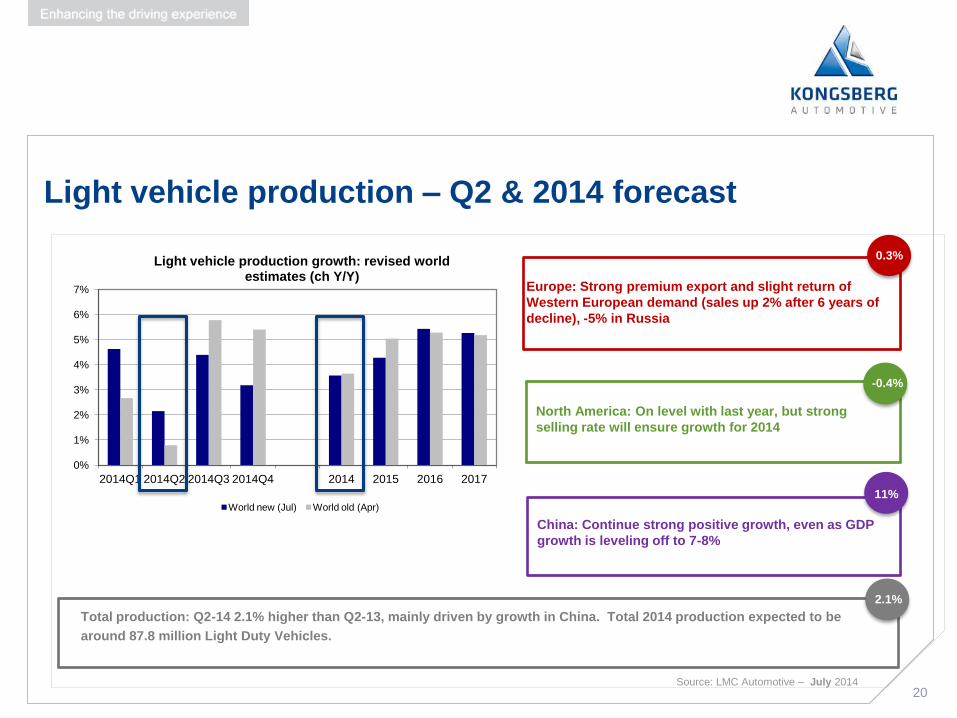
20
0%
1%
2%
3%
4%
5%
6%
7%
2014Q1 2014Q2 2014Q3 2014Q4 2014 2015 2016 2017
Light vehicle production growth: revised world estimates (ch Y/Y)
World new (Jul) World old (Apr)
North America: On level with last year, but strong
selling rate will ensure growth for 2014
Light vehicle production – Q2 & 2014 forecast
Total production: Q2-14 2.1% higher than Q2-13, mainly driven by growth in China. Total 2014 production expected to be
around 87.8 million Light Duty Vehicles.
Source: LMC Automotive – July 2014
Europe: Strong premium export and slight return of
Western European demand (sales up 2% after 6 years of
decline), -5% in Russia
0.3%
-0.4%
China: Continue strong positive growth, even as GDP
growth is leveling off to 7-8%
11%
2.1%

21
-8%
-6%
-4%
-2%
0%
2%
4%
6%
8%
10%
2014Q1 2014Q2 2014Q3 2014Q4 2014 2015 2016 2017
Medium and heavy duty truck production growth: revised world estimates (ch Y/Y)
World new (Jul) World old (Apr)
Commercial vehicle production – Q2 & 2014 forecast
Source: LMC Automotive – July 2014
World Wide: Growth in North America, with decline in South America and Europe and small growth in China, sets 2014 on a path
to a level just above 2013. Global production in 2014 expected to be 2.82 million vehicles (+0.6%).
Europe: Decline in Russia and Turkey. Slightly
better in western Europe, but market expected
still to be weak in 2014
-5.6%
North America: Continue growth from Q1, and
estimated above 11% growth for 2014
5.4%
China: Slowing down relative to previous
high growth
2.3%
-0.3%
South America: Highly volatile market due
to political uncertainty leads to weak
economical outlook
-19.9%

22
141 142
92 96
20 21
107
0
50
100
150
200
250
300
2Q13 2Q14
ROW
Asia
NA
Europe
22
Sales in MEUR by region*
54%
36%
8%
Sales in % by region
Sales by region
* Adjusted for currency effect
Expected 2014 growth
2% - 8.4%
3% 11.5%
5.6% 2.1%
Europe
North America
Asia Source: LMC Automotive – July 2014
2%
ROW
265* 262
23 23
SUMMARY & OUTLOOK
Hans Peter Havdal
24
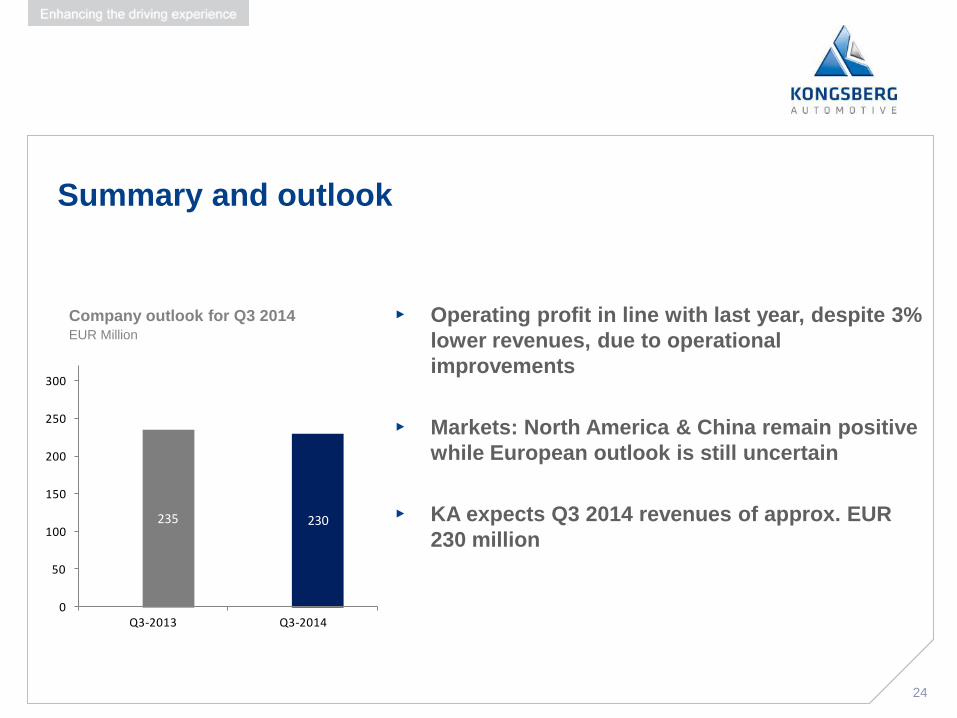
Summary and outlook
▸ Operating profit in line with last year, despite 3%
lower revenues, due to operational
improvements
▸ Markets: North America & China remain positive
while European outlook is still uncertain
▸ KA expects Q3 2014 revenues of approx. EUR
230 million
Company outlook for Q3 2014 EUR Million
235 230
0
50
100
150
200
250
300
Q3-2013 Q3-2014

25 25
CAPITAL MARKETS DAY ON DEC. 3, 2014
Save the date:
26 26
QUESTIONS & ANSWERS
Thank you for your attention!

27 27
Passionate Prepared Accountable
Our values
28
APPENDIX
28
29
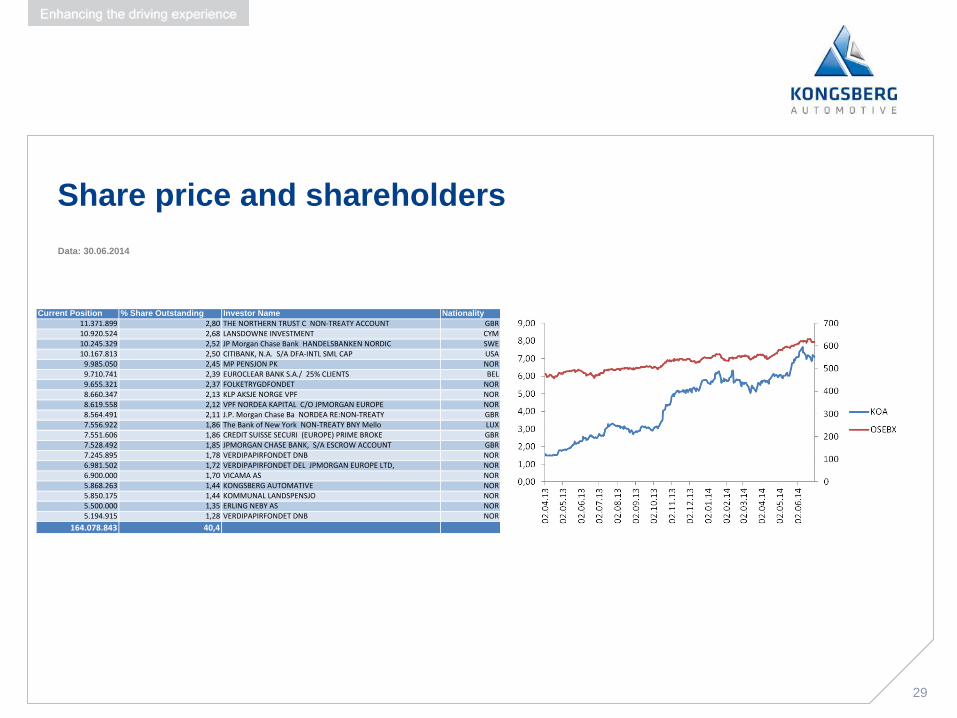
Share price and shareholders
Data: 30.06.2014
Share price increase of 67 % in Q2 2013
Current Position % Share Outstanding Investor Name Nationality
11.371.899 2,80 THE NORTHERN TRUST C NON-TREATY ACCOUNT GBR10.920.524 2,68 LANSDOWNE INVESTMENT CYM10.245.329 2,52 JP Morgan Chase Bank HANDELSBANKEN NORDIC SWE10.167.813 2,50 CITIBANK, N.A. S/A DFA-INTL SML CAP USA
9.985.050 2,45 MP PENSJON PK NOR9.710.741 2,39 EUROCLEAR BANK S.A./ 25% CLIENTS BEL9.655.321 2,37 FOLKETRYGDFONDET NOR8.660.347 2,13 KLP AKSJE NORGE VPF NOR8.619.558 2,12 VPF NORDEA KAPITAL C/O JPMORGAN EUROPE NOR8.564.491 2,11 J.P. Morgan Chase Ba NORDEA RE:NON-TREATY GBR7.556.922 1,86 The Bank of New York NON-TREATY BNY Mello LUX7.551.606 1,86 CREDIT SUISSE SECURI (EUROPE) PRIME BROKE GBR7.528.492 1,85 JPMORGAN CHASE BANK, S/A ESCROW ACCOUNT GBR7.245.895 1,78 VERDIPAPIRFONDET DNB NOR6.981.502 1,72 VERDIPAPIRFONDET DEL JPMORGAN EUROPE LTD, NOR6.900.000 1,70 VICAMA AS NOR5.868.263 1,44 KONGSBERG AUTOMATIVE NOR5.850.175 1,44 KOMMUNAL LANDSPENSJO NOR5.500.000 1,35 ERLING NEBY AS NOR5.194.915 1,28 VERDIPAPIRFONDET DNB NOR
164.078.843 40,4

30
Ulla-Britt Fräjdin-Hellqvist Halvor Stenstadvold
Thomas Falck Eivind Holvik
Malin Persson Tonje Sivesindtajet
Magnus Jonsson Kjell Kristiansen
The Board of Directors of Kongsberg Automotive Holding ASA
•Chairwoman of the Board since 2010
• Other Corporate Affiliations:
• Chairman of Data Respons ASA and SinterCast AB
• Board member, Castellum, e-man, Fouriertransform,
MicronicMydata, SEI and Tallberg Foundation
• Member of the Board since 2010
• Other Corporate Affiliations:
•Chairman of Making Waves AS and Filmparken AS
• Board member, EMS Seven Seas ASA, Vizrt ASA
• Board of several fund-of-fund investment companies
• Member of the Board since 2014
• Other Corporate Affiliations:
• President and CEO of Chalmers University Foundation
• Board member, Konecranes Plc, Helsinki, Hexpol AB,
Stockholm and Becker Industrial Coating, Berlin
• Member of the Board since 2011
• Other Corporate Affiliations:
•Board member, Powercell AB, LeanNova AB and Senseair AB
• Member of the Board since 2011
• Other Corporate Affiliations:
• Chairman of SOS barnebyerNorge, Henie OnstadKunstsenter
and Civita AS
•Board member, Storebrand ASA, Statkraft SF/Statkraft AS,
Navamedic ASA, SosChildrens Villages International and SOS
CV USA
•Member of the Board (Employee representative)
•Manager Research and Development, Kongsberg Automotive
•Member of the Board (Employee representative)
•Measuring Operator, Kongsberg Automotive
•Member of the Board (Employee representative)
• HSE, Kongsberg Automotive
31
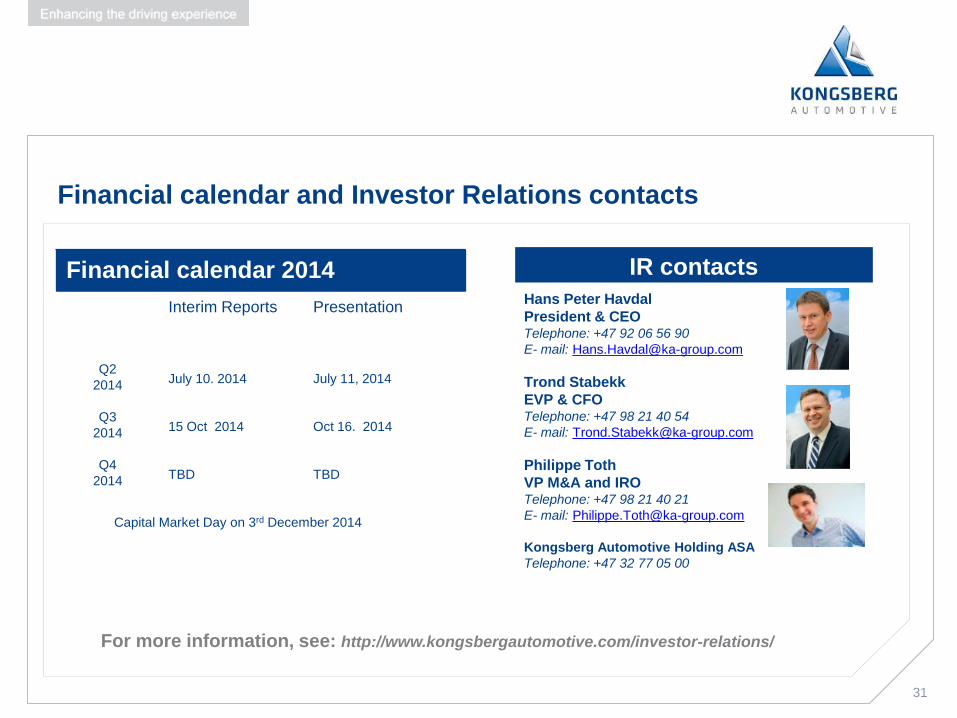
Financial calendar and Investor Relations contacts
Financial calendar 2014
Q2
2014
Q3
2014
Q4
2014
Interim Reports
July 10. 2014
15 Oct 2014
TBD
Presentation
July 11, 2014
Oct 16. 2014
TBD
Capital Market Day on 3rd December 2014
IR contacts
Hans Peter Havdal
President & CEO Telephone: +47 92 06 56 90
E- mail: [email protected]
Trond Stabekk
EVP & CFO Telephone: +47 98 21 40 54
E- mail: [email protected]
Philippe Toth
VP M&A and IRO Telephone: +47 98 21 40 21
E- mail: [email protected]
Kongsberg Automotive Holding ASA
Telephone: +47 32 77 05 00
For more information, see: http://www.kongsbergautomotive.com/investor-relations/
32
Disclaimer
This presentation contains certain forward-looking information and statements. Such forward-looking information and
statements are based on the current, estimates and projections of the Company or assumptions based on information currently
available to the Company. Such forward-looking information and statements reflect current views with respect to future events
and are subject to risks, uncertainties and assumptions. The Company cannot give assurance to the correctness of such
information and statements. These forward-looking information and statements can generally be identified by the fact that they
do not relate only to historical or current facts. Forward-looking statements sometimes use terminology such as "targets",
"believes", "expects", "aims", "assumes", "intends", "plans", "seeks", "will", "may", "anticipates", "would", "could", "continues",
"estimate", "milestone" or other words of similar meaning and similar
expressions or the negatives thereof.
By their nature, forward-looking information and statements involve known and unknown risks, uncertainties and other important
factors that could cause the actual results, performance or achievements of the Company to differ materially from any future
results, performance or achievements that may be expressed or implied by the forward-looking information and statements in
this presentation. Should one or more of these risks or uncertainties materialize, or should any underlying assumptions prove to
be incorrect, the Company's actual financial condition or results of operations could differ materially from that or those described
herein as anticipated, believed, estimated or expected.
Any forward-looking information or statements in this presentation speak only as at the date of this presentation. Except as
required by the Oslo Stock Exchange rules or applicable law, the Company does not intend, and expressly disclaims any
obligation or undertaking, to publicly update, correct or revise any of the information included in this presentation, including
forward-looking information and statements, whether to reflect changes in the Company's expectations with regard thereto or as
a result of new information, future events, changes in conditions or circumstances or otherwise on which any statement in this
presentation is based.
Given the aforementioned uncertainties, prospective investors are cautioned not to place undue reliance on any of these forward-
looking statements.