kondou, c., nagata, r., nii, n., koyama, s., higashi, y
TRANSCRIPT
1
Kondou, C., Nagata, R., Nii, N., Koyama, S., Higashi, Y., “Surface Tension of Low GWP Refrigerants R1243zf,
R1234ze(Z), and R1233zd(E)” Int. J. Refrig., 53, 80-89, (May 2015). DOI:10.1016/j.ijrefrig.2015.01.005
-----------------------
Research paper
Title:
Surface Tension of Low GWP Refrigerants R1243zf, R1234ze(Z), and R1233zd(E)
Authors:
Chieko Kondou*1, Ryuichi Nagata2, Noriko Nii2, Shigeru Koyama2, 3, Yukihiro Higashi4,
Affiliations:
1, Graduate School of Engineering, Nagasaki University, 1-14 Bunkyo, Nagasaki, 852-8521, Japan
2, Interdisciplinary Graduate School of Engineering Sciences, Kyushu University, 6-1 Kasuga-koen, Kasuga, Fukuoka
816-8580, Japan
3, International Institute for Carbon-Neutral Energy Research (WPI-I2CNER), Kyushu University, 6-10-1, Hakozaki,
Higashi-ku, Fukuoka, 812-8581, Japan
4, Department of Science and Engineering, Iwaki Meisei University, 5-5-1 Iino, Chuodai, Iwaki, Fukushima, 970-8551,
Japan
* Corresponding author.
Tel.: +81 95 819 2527
E-mail address: [email protected] (C. Kondou)

2
Abstract
The surface tension of R1243zf, R1234ze(Z), and R1233zd(E) were measured at temperatures from 270 K to 360
K by an experimental apparatus based on the differential capillary rise method. The deviation between the measured
surface tension of R134a and R245fa and the calculated surface tension with REFPROP 9.1 (Lemmon et al., 2013)
was ±0.13 mN m-1, which is less than the estimated propagated uncertainty in surface tension of ±0.2 mN m-1. Eleven
points, thirteen points, and ten points of surface tension data were provided for R1243zf, R1234ze(Z), and
R1233zd(E), respectively, in this paper. The measured data and the estimated surface tension using the methods of
Miller (1963), Miqueu et al. (2000), and Di Nicola et al. (2011) agree within the standard deviation of ±0.43 mN m-
1. The empirical correlations that represent the measured data within ±0.14 mN m-1 were proposed for each refrigerant.
Keywords::::R245fa, R1234zf, R1234ze(Z), R1233zd(E), surface tension, capillary rise height
Nomenclature
NA Avogadro number [ - ]
P pressure [MPa]
[P] parachor [ - ]
STDEV standard deviation [N m-1]
T temperature [K]
U uncertainty in each parameter [ - ]
V molar volume [cm3mol-1]
a2 capillary constant [m2]

3
g local gravitational acceleration [m s-2]
gn normal gravitational acceleration [m s-2]
h capillary rise height [m]
k Boltzmann constant [cm2 kg-2K-1]
m number of measured data [ - ]
r radius [m]
t reduced temperature [ - ]
Greek letters
ω acentric factor [ - ]
θ contact angle [rad]
ε bias [N m-1]
σ surface tension [N m-1]
σ0 substance dependent parameter [N m-1]
ρ' orthobaric liquid density [kg m-3]
ρ'' orthobaric vapor density [kg m-3]
subscripts
1 capillary tube of the smaller diameter

4
2 capillary tube of the larger diameter
b normal boiling point
c corrected
cal calculation
crit critical point
m measured
meas measurement
r reduced parameter

5
1. Introduction
Ozone depletion and global warming caused by refrigerants are currently a worldwide concern. In the last decade,
great efforts have been made for alternatives to the conventional refrigerants R134a and R245fa with a 100-year time
horizon global warming potential (GWP100) of 1300 and 858 (Myhre et al., 2013), respectively.
Brown et al. (2010) compared the estimated thermodynamic properties for eight hydro-fluoro-olefins (HFOs), namely,
R1225ye(E), R1125ye(Z), R1225zc, R1234ye(E), R1234yf, R1234ze(E), R1234ze(Z), and R1243zf. Among these
substances, the GWP100 of R1225ye(E), R1234yf, R1234ze(E), R1234ze(Z) and R1243zf were reported as less than 1 in
IPCC 5AR (Myhre et al., 2013). The newly developed blowing agent R1233zd(E) was recently nominated as the refrigerant
or working fluid (Hulse et al., 2012) alternatives to R245fa that is widely used in organic Rankine cycles. On the basis of
the second law analysis, Cavallini et al. (2014) evaluated the performance potential of seven conventional refrigerants,
three natural refrigerants (R600a, R290, and R717), and three hydro-fluoro-olefins (HFOs) (R1234yf, R1234ze(E), and
R1234ze(Z)). Meanwhile, very comprehensive research has been conducted by McLinden et al. (2014). A set of 1200 low
GWP refrigerants with critical temperatures between 300 K and 400 K was assessed, considering flammability,
thermal stability, and toxicity for air conditioners. Nevertheless, the argumentation on the final candidate of low GWP
refrigerant from a long-term prospective is still controversial.
The physical property data are necessary to build models to evaluate the efficiency and capacity of air
conditioning and heat pump systems in which the candidate refrigerants are used. The surface tension is the one of
important parameters that affects the heat transfer coefficient during condensation and evaporation. For R1234ze(E)
and R1234yf, the surface tension data have been provided by Tanaka and Higashi (2013), Takahashi et al. (2009),

6
and Zhao et al. (2014). For R1233zd(E), only three points of surface tension data are reported by Hulse et al. (2012).
The measurement data of the other HFOs are not yet available in open literature at the present stage. Surface tension
measurements were thus made for R1243zf, R1234ze(Z) and R1233zd(E) in this study.
2. Measurement
2.1 Measurement procedure and data reduction
Figure 1 shows an experimental apparatus for measuring the surface tension. The surface tension is measured as
the capillary elevation in a small diameter tube immersed in a liquid. Two capillaries with inner radii of r1 = 0.4222
±0.0009 mm and r2 = 0.7526 ±0.0009 mm are vertically set by a supporting brace in a pressure vessel (A) composed
of a Pyrex glass tube that is 17 mm in inner diameter and 25 mm in outer diameter. The capillary radii were precisely
measured with mercury slugs. These capillaries and pressure vessel are carefully cleansed by using an alkaline
aqueous solution and an ultrasound bath in the preparatory procedure. The liquid of the test refrigerant is filled
roughly to a half volume of the pressure vessels at room temperature. Then, the pressure vessel is placed in a
thermostatic bath (B), and the temperature in the thermostatic bath is kept constant with a fluctuation within ±2 mK
using a main heater (J) and a PID (F) controlled sub heater (K). The temperature is measured with a 100 Ω platinum
resistance thermometer (C), ASL model F500, calibrated against ITS-90. The uncertainty of the temperature
measurement is estimated to be within ±5 mK. At steady state, the capillary rise difference between the two capillary
tubes is measured using a digital travelling microscope (M) with a tolerance of 0.01 mm.
Figure 2 illustrates the differential capillary-rise-height. Specifically, with the travelling microscope and a CCD

7
camera (N), the height difference of the bottom of the meniscus in each capillary tube, ∆hm as shown in Figure 2, is
measured. Figure 3 is the CCD image displayed on the monitor (G) to determine the position of the meniscus bottom.
The differential height is read twice by six people (12 times reading in total) to eliminate the individual reading
variation. The two standard deviations of 12 times readings was 0.046 mm. This deviation is taken into account as
the reading error in the differential height measurement.The contact angle θ, shown in Figure 2, is approximated as
zero. To obtain the actual differential capillary rise height, the measured differential height ∆hm at the bottom of the
meniscus in each capillary tube has to be corrected by a methodology of Rayleigh (1916).
( ) ( )
( ) ( )
2 2 3 31 2 1 2 1 2
c m1 m2 2 2m1 m2 m1 m2
1 2 2m 1 2
0.1288 0.13123
3
r r r r r rh h h
h h h h
r rh r at r r
∆
∆ Ο
− = − + − − + − +
−
= + + <
…
(1)
where the remainder term Ο (r2) is ( )-3 2 -30.012 10 m 0.022 10 m rΟ− × < < × at -3 -3m11 10 m 20 10 m h× < < × and
-3 -3m21 10 m 20 10 m h× < < × . Because this remainder term is smaller than the reading error in the differential height,
it is justified that the term is omitted in the correction. Therefore, the actual differential capillary-rise-height can be
expressed as,
( )1 2
c m
3
r rh h∆ ∆
−≈ + (2)
The capillary constant a2 is determined only from the capillary radii r1 and r2, and the differential capillary-rise-
height ∆hc,
c c2
n 1 2 n 1 2
(1 1 )cos (1 1 )
g h g ha
g r r g r r
∆ ∆θ
= ≈− −
(3)
where g and gn are the local gravitational acceleration 9.8001 m s-2 at Iwaki, Japan and the normal gravitational
accelerations 9.80665 m s-2, respectively. The contact angle θ of refrigerants in the capillary tube, which is well

8
cleansed, is assumed zero. Hence, cosθ is nearly equal to 1. The capillary constant is rewritten with the surface
tension σ as,
( )2 2
n
ag
σρ ρ
=′ ′′−
(4)
The surface tension σ are determined from the capillary radii r1 and r2, the differential capillary-rise-height ∆hc, and
the orthobaric densities, ρ' and ρ''.
( )
c c 1 2 1 2m
1 2 1 2 2 1
( ' ") ( ' ")( ' ")
2(1 1 )cos 2(1 1 ) 2 6
g h g h gr r gr rh
r r r r r r
∆ ρ ρ ∆ ρ ρσ ∆ ρ ρ
θ
− −= ≈ = − −
− − − (5)
Heide (1997) used the exact same equation for his data reduction and validated this. The orthobaric densities, ρ' and
ρ'', are calculated from measured temperature with REFPROP 9.1 (Lemmon et al., 2013) for R134a, R245fa, and
R1233zd(E). For the refrigerants R1243zf and R1234ze(Z), fluid files optimized by Akasaka et al. (2015, 2014) from
the measurement data provided by Higashi et al. (2015, 2014) were used to calculate ρ' and ρ'' associated with
REFPROP 9.1.
The tested R1234ze(Z) and R1233zd(E) were supplied from Central Glass Co., Ltd., Japan. Preliminarily, they
were well distilled, and the impurities were checked by a TCD gas chromatograph. These impurities were less than
0.1% by mole, which is within the uncertainty of the gas chromatograph. The sample of R1243zf used in this study
was supplied from Mexichem, Ltd., UK. The purity of the supplied R1234zf is more than 99.5 % according to the
manufacturer and the sample was used without further purification.
Table 1 lists the measurement uncertainties of the equipment mentioned above. The propagated uncertainty in
surface tension is calculated by means of the square-root rule using the listed uncertainties. The calculation procedure
for the uncertainty will be specified in Appendix A. The reading error in the capillary rise height was most dominant

9
in the propagated uncertainty. Typically, the propagated uncertainty is estimated to be within ±0.2 mN m-1.
2.2 Validity assessment for the measurement method
The reproducibility and repeatability of the above mentioned measurement methods were confirmed with R134a
for the medium temperature refrigerant R1243zf having the critical temperature blow 400 K and with R245fa for the
high temperature refrigerants R1234ze(Z) and R1233zd(E) having the critical temperatures above 400 K. Figures 4
(a) and 4 (b) compare the surface tension between the present data and other data in literature for R134a and R245fa,
respectively. For R134a, the measured surface tension provided by Chae et al. (1990), Heide (1997), Higashi et al.
(1992), Higashi et al. (1997), and Zhu et al. (1993), and also the calculated surface tension by REFPROP 9.1 were
compared in Figure 4 (a). For R245fa, the data provided by Schmidt et al. (1996), Lin et al. (2003), Zhelezny et al.
(2007), and Geller et al. (1999), and also the calculated surface tension were compared in Figure 4 (b). REFPROP
9.1 adopts the correlations proposed by Mulero et al. (2012). The present surface tension data agree well with the
calculated surface tension and selected data for R134a and R245fa. As shown in Figure 4 (b), data series 1 and 2
measured on the different days repeated along the calculated values. Figure 4 (c) plots the deviation of the present
data from the calculated surface tension by using REFPROP 9.1. The standard deviation of 16 data was 0.13 mN m-
1, which is within the uncertainty 0.2 mN m-1. As remarked, it was confirmed that the measurement method is
sufficiently reproducible and repeatable.
3. Results and discussion

10
3.1. Measurement results
Table 2 provides the measured capillary constants a2 given by Eq. (3) and he surface tensions σ given by Eq. (5)
for R1243zf, R1234ze(Z), and R1233zd(E). The measured temperature T, calculated densities ρ' and ρ'', corrected
capillary rise height ∆hc, and uncertainty in surface tension Uσ are listed in Table 2 as well.
Figures 5 (a), 5 (b), and 5 (c) plot the measured surface tension as a function of temperature for R1243zf,
R1234ze(Z), and R1233zd(E), respectively. The circle symbols indicate the present data; the small vertical bars
overlapped with the symbols indicate the measurement uncertainty in surface tension. The diamond symbols are the
critical temperatures Tcrit, which are measured by Higashi et al. (2015) for R1243zf, Higashi et al. (2014) for
R1234ze(Z) and by Hulse et al. (2012) for R1233zd(E). The triangle symbols in Figure 5 (b) are data for R1233zd(E)
surface tension measured by Hulse et al. (2012). As seen in Figure 5 (b), the present data exhibits an approximately
1.5 mN m-1 greater value than their data at a given temperature. For R1243zf and R1234ze(Z), no available
measurement data can be found as of now.
3.2 Comparison with estimation methods
The present measurement data are compared with the estimation methods below. It should be noted that the methods
are transcribed for the units N m-2 and MPa.
i) Estimation based on the parachor, Macleodo(1923)-Sugden (1924) with modification by Fishtine (1963):
[ ]
4
r4 3b
br
1( ) 10
1
4 = 1.22 (recommended betwe en 1.0 and 1.24)
nT
PT
n
σ ρ −− ′= × − ×
(6)
where bρ ′ is the molar liquid density at the normal boiling point in mol cm-3; r crit/T T T≡ is the reduced temperature;

11
while br b crit/T T T≡ is the reduced normal boiling point. [P] is a temperature independent parameter characteristic of
a substance, called parachor. The values of parachor [P] are listed in Table 3.
ii ) Estimation based on the principle of corresponding states, Miller (1963):
( ) ( ) ( )( )
2 3 11 91 3 3crit crit r
br crit
br
10 1 10
ln 1.013250.1196 1 0.279
1
P T T Q
T PQ
T
σ −= × − ×
= + −
−
(7)
where Pcrit and Tcrit are the critical pressure in MPa and temperature in K, respectively.
iii) Estimation based on the extended scaled equation, Miqueu et al. (2000):
( ) ( )
2 3
A 1.26 0.5crit
crit
crit
4.35 4.14 1 0.19 0.25
1
NkT t t t
V
t T T
σ ω = + + −
≡ −
(8)
where k, NA, Vcrit, and ω are the Boltzmann constant in cm2kg s-2K-1, Avogadro number, critical volume in cm3mol-1,
and acentric factor, respectively.
iv) Estimation based on the extended scaled equation, Di Nicola et al. (2011):
( ) ( ) ( )0.618 0.770 1.2620.340 3crit crit r0.658 10 1 1 10P T Tσ ω −= × + − × (9)
where Pcrit and Tcrit are the critical pressure in MPa and critical temperature in K. r crit/T T T≡ is the reduced
temperature. ω is the acentric factor.
Figures 5 (a), 5 (b), and 5 (c) plot the estimated surface tension by the selected method with lines. As seen, the
estimated value by the method of Macleodo-Sugden (Macleodo, 1923; Sugden, 1924) is distinctly greater than that

12
of the other estimations and present data. For R1243zf, the measured surface tension and the estimated surface tension
by the methods of Miller (1963), Miqueu et al. (2000), and Di Nicola et al. (2011) are in good agreement. Most of
the R1234ze(Z) data agree with these estimations within the measurement uncertainty 0.2 mN m-1. In the case of
R1234ze(Z), as shown in Figure 5 (b), the estimated values by Miqueu et al. (2000) slightly deviate from those by
Miller (1963) and Di Nicola et al. (2011). The value of present data seems to agree with the estimations by Miller
(1963) and Di Nicola et al. (2011) rather than that by Miqueu et al. (2000). In contrast, for R1233zd(E), the present
data are somewhat greater than the estimated values and are close to the estimations by Miqueu et al. (2000) rather
than those by Miller (1963) and Di Nicola et al. (2011).
To quantify the deviations, the following index bias ε and standard deviation STDEV are employed.
( )cal, meas,
1 1
1 1
m m
j j j
j jm mε ε σ σ
= =
= = −∑ ∑ (10)
( )2
1
1
1
m
j
j
STDEVm
ε ε=
= −− ∑ (11)
where σcal and σmeas denote the estimated and measured surface tensions, respectively. m is the number of measured
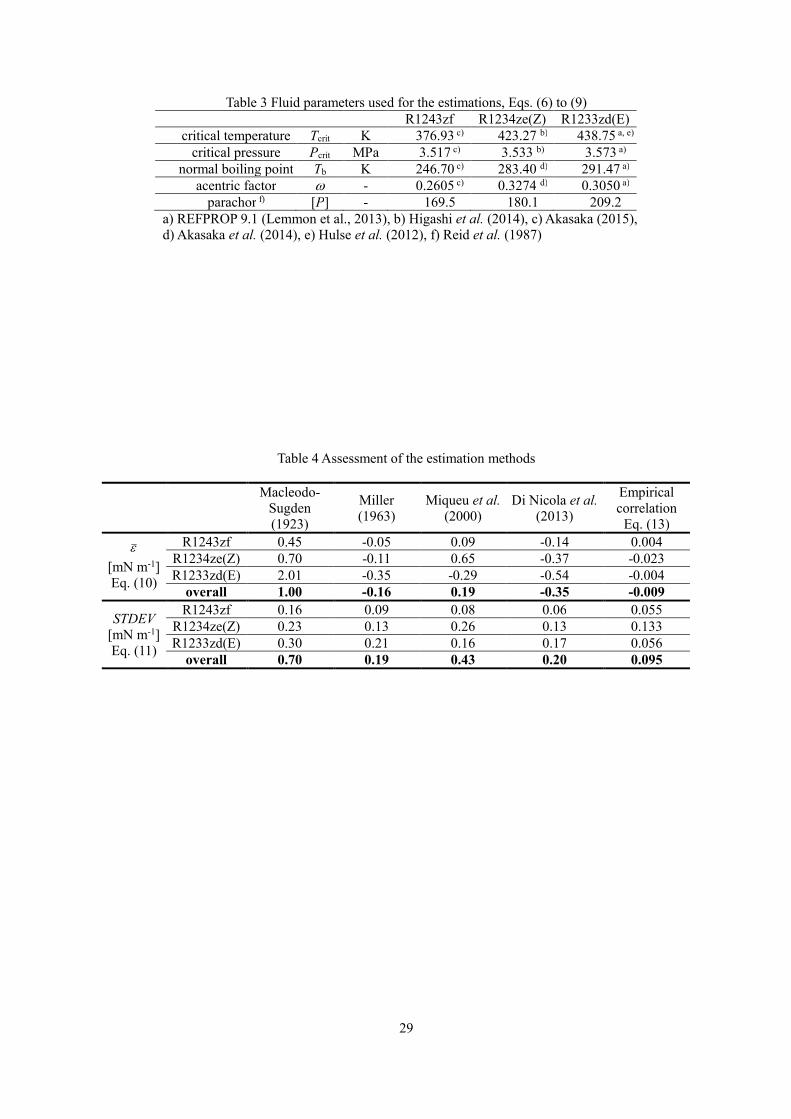
data. Table 4 lists the indexes of the selected estimation method for the tested refrigerants. The Macleodo-Sugden
method (Macleodo, 1923) estimates greater values. Especially for R1233zd(E), the bias indicates +2.0 mN m-1, which
is considerably greater than the measurement uncertainty. Regarding the other three methods, the bias is within the
measurement uncertainty for R1243zf. For R1234ze(Z), although the method of Miqueu et al. (2000) estimates a 0.7
mN m-1 greater value, the other two methods of Miller (1963) and Di Nicola et al. (2011) agree almost within the
uncertainty. On the other hand, these three methods estimate a smaller surface tension, which is from -0.25 mN m-1
to -0.51 mN m-1. The possible causes are the unexpected effects of chlorine on the measurement or the estimation,
13
the uncertainty in the critical parameters or the acentric factor. The standard deviation that indicates the scatterings
is comparable to the measurement uncertainty for Miller (1963) and Di Nicola et al. (2011). The method of Mique et
al. (2000) exhibits a slightly greater standard deviation because this method shows different relativity to the measured
surface tension for each refrigerant. Nevertheless, the surface tension deviation of, for instance, 0.3 mN m-1, differs
the pool boiling heat transfer coefficient by only 0.4% for R1234ze(Z) at a reduced temperature of 74%, according
to the correlation of Stephan and Abdelsalam (1980). Overall, the estimation methods of Miller (1963), Miqueu et al.
(2000), and Di Nicola et al. (2011) should be sufficiently accurate for heat exchanger design.
3.3 Empirical correlation
For this situation, a more accurate surface tension estimation is required, the empirical correlation is proposed
here. The solid lines in Figures 5 (a) and 5 (b) denote the empirical correlation, which are proposed with the following
function form of the van der Waals equation.
( )0 crit1n
T Tσ σ= − (12)
where σ, T, and Tcrit are the surface tension in N m-1, temperature in K, and the critical temperature in K, respectively.
The coefficient σ0 and the exponent n are optimized to fit the measured surface tension and the provided critical
temperature by the least square mean method. From the principle of the corresponding state, the exponent n has been
derived as 1.22 (= 11 / 9 ) by Guggenheim (1945) and verified by Brock and Bird (1955). This exponent shall range
from 1.2 to 1.3 for most non-polar fluids (Reid et al., 1987). According to the scaling law (Widom, 1974), this
exponent is given as 2n v= in three dimensions. The critical exponent v is suggested 0.64 in his paper; however,

14
the number 0.63 is most authorized nowadays (Moldover, 1985). The correlations empirically obtained from the
measurement data are summarized as,
1.247 1
1.220 1
1.277 1
0.05330(1 376.93) [N m ] for R1243zf
0.05657(1 423.27) [N m ] for R1234ze(Z)
0.06195(1 438.75) [N m ] for R1233zd(E)
T
T
T
σ
σ
σ
−
−
−
= −
= − = −
(13)
The exponents in the empirical correlations Eq. (13) are close to the suggested number in previous studies. Figure 6
plots the deviation of the measured surface tension from the empirical correlation. As shown in Figure 6, these
empirical correlations represent the measured surface tension within 0.13 mN m-1 and are available at temperatures
from 270 K to 360 K.
3.4 Comparison with other refrigerants
Figure 7 compares the temperature dependence in surface tension between several refrigerants. Because the high
temperature refrigerants have critical temperatures above 400 K, R1233zd(E), R245fa, and R1234ze(Z) are plotted.
Because the medium temperature refrigerants have critical temperatures below 400 K, R134a and R1243zf are plotted.
Additionally, the data of R1234ze(E), which is the isomer of R1234ze(Z), measured by Tanaka and Higashi (2013)
are plotted. Comparing the surface tension between R1234ze(E) and R1234ze(Z) at a given temperature, the surface
tension of R1234ze(Z) having a cis arrangement is markedly greater than that of R1234ze(E) having a trans
arrangement. Although their constituent atoms and molecular weights are the same, most likely, the stronger polarity
in the cis arrangement of R1234ze(Z) strengthens the surface tension. The surface tension gradient against the
temperature of the HFO refrigerants R1233zd(E) and R1234ze(Z) having a carbonate double bond are comparable;
meanwhile, the gradient of the HFC refrigerant R245fa is slightly greater than those of R1233zd(E) and R1234ze(Z).

15
Similarly, the gradient of the HFC refrigerant R134a is slightly greater than those of HFO refrigerants R1234ze(E)
and R1243zf. Although the critical temperature of R1243zf is higher than that of R134a, the surface tension of
R1243zf exhibits a smaller surface tension at temperatures below 340 K. Among the selected refrigerants, the
temperature dependence in surface tension is more moderate for HFO refrigerants having a carbon double bond.
4. Conclusions
The surface tension data of low GWP refrigerants R1243zf, R1234ze(Z), and R1233zd(E) have been measured at
temperatures from 270 K to 360 K by the differential capillary rise method. The measurement method was validated
with conventional refrigerants R134a and R245a. The estimation method of Miller (1963), Miqueu et al. (2000), and
Di Nicola et al. (2011) agreed with the measurement results within ±0.43 mN m-1. The empirical correlations with
the function form of van der Waals equation were proposed as, σ = 0.05330(1-T/376.93)1.247 for R1243zf, σ =
0.05657(1-T/423.27)1.220 for R1234ze(Z), and σ = 0.06195(1-T/438.75)1.277 for R1233zd(E), where σ and T are the
surface tension in N m-1 and the temperature in K, respectively. The correlation represents the measured surface
tension within 0.13 mN m-1.
Acknowledgments
The tested R1234ze(Z) and R1233zd(E) were supplied by Central Glass Co., Ltd., Japan. The tested R1243zf was
supplied by Mexichem, Ltd., UK. This study is sponsored by the project on the "Development of High Efficiency
and Non-Freon Air Conditioning Systems" of the New Energy and Industrial Technology Development Organization

16
(NEDO) in Japan. The authors are grateful to Mr. Okabe, Mr. Doi, and Mr. Domoto at Iwaki Meisei University for
their kind assistance.
Reference
Akasaka, R., Higashi, Y., Miyara, A., Brown, J.S., Koyama, S, 2015. A preliminary equation of state for R-1243zf. 19th
symposium on thermophysical properties, Boulder, CO, USA, (to be presented)
Akasaka, R., Higashi, Y., Miyara, A., Koyama, S., 2014. A fundamental equation of state for cis-1,3,3,3- tetrafluoropropene
(R-1234ze(Z)). Int. J. Refrig., 44, 168-176.
Brock, J.R., Bird, R.B., 1955. Surface tension and the principle of corresponding states. AIChE J., 1, 174–177.
Brown, J.S., Zilio, C., Cavallini, A., 2010. Thermodynamic properties of eight fluorinated olefins. Int. J. Refrig. 33, 235–
241.
Cavallini, A., Zilio, C., Brown, J.S., 2014. Sustainability with prospective refrigerants. Energy Research, 38, 285–298.
Chae, H.B., Schmidt, J.W., Moldover, M.R., 1990. Alternative refrigerants R123a, R134, R141b, R142b and R152a:
Critical temperature, refractive index, surface tension, and estimates of liquid, vapor, and critical densities. J. Phys.
Chem. 94, 8840-8845.
Di Nicola, G., Di Nicola, C., Moglie, M., 2011. A New Surface Tension Equation for Refrigerants. Int. J. Thermophys. 34,
2243–2260.
Fishtine, S.H., 1963. Estimates of saturated fluid densities and critical constants. Ind. Eng. Chem. Fundam. 2, 149–155.
Geller, Z., Bivens, D., Yokozeki, A., 1999. Transport properties and surface tension of hydrofluorocarbons HFC 236fa and
HFC 245fa. Proc. 20th Int. Congress of Refrigeration. IIR/IIF, Sydney, Volume II, Paper no. 027, 1-7.
Guggenheim, E.A., 1945. The Principle of Corresponding States. J. Chem. Phys. 13, 253–261.
Heide, R., 1997. The surface tension of HFC refrigerants and mixtures. Int. J. Refrig., vol. 20, no. 7, 296-503.
Higashi, Y., Hayasaka, S., Shirai, C., Akasaka, R., 2014. Measurements of PρT properties, vapor pressures, saturated
densities, and critical parameters for R 1234ze(Z) and R 245fa. Int. J. Refrig., DOI: 10.1016/j.ijrefrig.2014.12.007 (in
press).
Higashi, Y., Ikeda, T., Kuwana, T., Okada, M., 1992. Measurement of the surface tension for CFC alternatives, 2nd report:
surface tension for HCFC-123 and HFC-134a. Trans. of the JAR, vol.9, no. 2, 191-198.
Higashi, Y., Shibata, T., Okada, M., 1997. Surface tension for 1,1,1-trifluoroethan (R-143a), 1,1,1,2- tetrafluoroethane (R-

17
134a), 1,1-Dichloro-2,2,3,3,3-pentafluoropropane (R-225ca), and 1,3-Dochloro-1,2,2,3,3 -pentafluoropropane,
(R225cb). J. Chem. Eng. Data, 42,438-440.
Higashi, Y., Shirai, C., Akasaka, R., 2015. Measurements of PρT Properties, Vapor Pressures, Saturated Densities, and
Critical Parameters for R 1243zf. 19th symposium on thermophysical properties, Boulder, CO, USA, (to be presented)
Hulse, R.J., Basu, R.S., Singh, R.R., Thomas, R.H.P., 2012. Physical Properties of HCFO-1233zd(E). J. Chem. Eng. Data,
57, 3581–3586.
Lemmon, E.W., Huber, M.L., McLinden, M.O., 2013. Reference Fluid Thermodynamic and Transport Properties -
REFPROP Ver. 9.1. National Institute of Standards and Technology, Boulder, CO, USA.
Lin, H., Duan, Y.Y., Wang, Z.W., 2003. Surface tension measurements of 1,1,1,3,3-pentafluoropropane (HFC-245fa) and
1,1,1,3,3,3-hexafluoropropane (HFC-236fa) from 254 to 333 K. Fluid Phase Equilibria, 214 (1), 79–86.
Macleod, D.B., 1923. On a relation between surface tension and density, Transactions of the Faraday Society, vol. 19, 38-
41.
McLinden, M.O., Kazakov, A.F., Brown, J.S., Domanski, P.A., 2014. A thermodynamic analysis of refrigerants:
Possibilities and tradeoffs for Low-GWP refrigerants. Int. J. Refrig. 38, 80–92.
Miller, D.G., 1963. Reduced Frost-Kalkwarf vapor-pressure equation. Ind. Eng. Chem. Fundam., 2, 78–80.
Miqueu, C., Broseta, D., Satherley, J., Mendiboure, B., Lachaise, J., Graciaa, A, 2000. An extended scaled equation for the
temperature dependence of the surface tension of pure compounds inferred from an analysis of experimental data.
Fluid Phase Equilib. 172, 169–182.
Moffat, R.J., 1988. Describing the uncertainties in experimental results. Experimental Thermal and Fluid Science, 1 (1),
3–17.
Moldover, M.R., 1985. Interfacial tension of fluids near critical points and two-scale-factor universality. Phys. Rev. A 31,
1022–1033.
Mulero, A., Cachadiña, I., Parra, M.I., 2012. Recommended Correlations for the Surface Tension of Common Fluids. J.
Phys. Chem. Ref. Data, 41, (4) 043105, 1-13.
Myhre, G., Shindell, D., Bréon, F.M., Collins, W., Fuglestvedt, J., Huang, J., Koch, D., Lamarque, J.F., Lee, D., Mendoza,
B., Nakajima, T., Robock, A., Stephens, G., Takemura, T., Zhang, H., 2013. Chapter 8 Anthropogenic and Natural
Radiative Forcing. IPCC 2013 Assessment Report 5th Climate Change - The Physical Science Basis, the
Intergovernmental Panel on Climate Change [Stocker, T.F., D. Qin, G.-K. Plattner, M. Tignor, S.K. Allen, J. Boschung,
A. Nauels, Y. Xia, V. Bex and P.M. Midgley (eds.)]. Cambridge University Press, Cambridge, United Kingdom and
New York, NY, USA.
18
Rayleigh, L., 1916. On the theory of the capillary tube. Proc. Royal Society of London, series A, 184-195
Reid, R.C., Prausnitz, J.M., Poling, B.E., 1987. The properties of gases and liquids (4th ed). New York, United States,
McGraw-Hill, 636-637.
Schmidt, J.W., Carrillo-Nava, E., Moldover, M.R., 1996. Partially halogenated hydrocarbons CHFCl-CF3, CF3-CH3, CF3-
CHF-CHF2, CF3-CH2-CF3, CHF2-CF2-CH2F, CF3-CH2-CHF2, CF3-O-CHF2: critical temperature, refractive indices,
surface tension and estimates of liquid, vapor and critical densities. Fluid Phase Equilibria, 112, 187-206.
Stephan, K., Abdelsalam, M., 1980. Heat-transfer correlations for natural convection boiling. Int. J. Heat Mass Transf., 23,
1, 73–87.
Sugden, S., 1924. The variation of surface tension with temperature and some related functions, Journal of the Chemical
Society Transactions, vol. 125, 32-41.
Takahashi, K., Tanaka, K., Higashi, Y., 2009. Measurement of the surface tension for 2,3,3,3-tetrafluoropropene (HFO-
1234yf). 17th Symposium on Thermophysical Properties, Boulder, CO, USA, no. A2-1.
Tanaka, K., Higashi, Y., 2013. Surface Tensions of trans-1,3,3,3-Tetrafluoropropene and trans-1,3,3,3-Tetrafluoropropene
+Difluoromethane Mixture. J. Chem. Eng. Japan 46, 371–375.
Taylor, J.T., 1982. An Introduction to Error Analysis, second ed. University science book.
Widom, B., 1974. The critical point and scaling theory. Physica, 73, 107–118.
Zhao, G., Bi, S., Fröba, A.P., Wu, J., 2014. Liquid Viscosity and Surface Tension of R1234yf and R1234ze Under Saturation
Conditions by Surface Light Scattering. J. Chem. Eng. Data 59, 1366–1371.
Zhelezny, V.P., Semenyuk, Y.V., Ancherbak, S.N., Grebenkov, A.J., Beliayeva, O.V., 2007. An experimental investigation
and modelling of the solubility, density and surface tension of 1,1,1,3,3-pentafluoropropane (R-245fa)/synthetic
polyolester compressor oil solutions. Journal of Fluorine Chemistry, 128 (9), 1029–1038.
Zhu, M.S., Han, L.Z., Lu, C.X., 1993. Surface tension of HFC-134a. Fluid Phase Equilibria, 86, 363–367.
A. Uncertainty analysis
The measurement uncertainty in surface tension is specified here. The 95% coverage of uncertainty propagated
with several variables is obtained by means of the square-root rule (Taylor 1982; Moffat, 1988), assuming that the
variables are independent and random.

19
The uncertainty in the corrected differential capillary-rise-height ∆hc is considered to be same as that of the
reading error 0.046 mm as listed in Table 1. Hence, from Equation (4), the uncertainty in surface tension can be
expressed as,
c 1 2
2 2 2 2 2
2 2 2 2 2 2
c 1 2
h r rU U U U U Uh r r
σ ρ ρ ∆σ σ σ σ σρ ρ ∆
′′ ′ ∂ ∂ ∂ ∂ ∂ = + + + + ′′ ′∂ ∂ ∂ ∂ ∂
(A.1)
where
( )1 22 1 1
cg h
r r
σ ∆ρ
∂= ′′∂ −
(A.2)
( )1 22 1 1
cg h
r r
σ ∆ρ
∂= ′∂ −
(A.3)
( )
( )c 1 22 1 1
g
h r r
ρ ρσ∆
′ ′′−∂ = ∂ − (A.4)
( )( )22
1 1 1 22 1 1
cg h
r r r r
∆ ρ ρσ ′ ′′−∂ = − ∂ −
(A.5)
( )( )22
2 2 1 22 1 1
cg h
r r r r
∆ ρ ρσ ′ ′′−∂ = ∂ −
(A.6)
The value of the each uncertainty source is listed in Table 1. The most dominant source is the reading error in the differential
capillary-rise-height m ch hU U∆ ∆≈ . The estimated uncertainty in the surface tension Uσ ranges from 0.14 mN m-1 to 0.30
mN m-1.

20
Figure Captions
Figure 1 Experimental apparatus
Figure 2 Principle of differential capillary rise method
Figure 3 CCD image for the determination of meniscus bottom height
Figure 4 Validation of measurement method with R134a and R245fa
(a) Comparison on R134a surface tension data
(b) Comparison on R245fa surface tension data
(c) Deviation of the measured data from REFPROP 9.1
Figure 5 Temperature dependence in surface tension
(a) R1243zf
(b) R1234ze(Z)
(c) R1233zd(E)
Figure 6 Temperature dependence in surface tension
(a) R1243zf
(b) R1234ze(Z)
(c) R1233zd(E)
Figure 7 Comparison of surface tension between refrigerants

21
A: pressure vessel
B: thermostatic bath
C: platinum resistance thermometer (100 Ω)
D: sheathed thermocouple
E: thermometer bridge
F: temperature control system (PID)
G: computer
H: voltage transformer
I: illumination lamp
J: main heater (1 kW)
K: sub heater (500 W)
L: stirrer
M: traveling microscope
N: CCD camera
Figure 1 Experimental apparatus
A
B
C
EFG
H
I
JK
L
M
D
N

22
Figure 2 Principle of differential capillary rise method
Figure 3 CCD image for the determination of meniscus bottom height
2r2
hm2
2r1
∆hm
hm1
θρ ′
ρ ′′

23
(a) Comparison on R134a surface tension data
(b) Comparison on R245fa surface tension data
250 300 3500
5
10
15
20
Temperature, T [K]
Surf
ace
ten
sion, σ
[m
N m
-1]
R134a
present data critical point (REFPROP ver. 9.1) Chae et al. (1990) Heide (1997) Higashi et al. (1992) Higashi et al. (1997) Zhu et al. (1993) REFPROP ver. 9.1
250 300 350 4000
5
10
15
20
Temperature, T [K]
Surf
ace t
ensi
on, σ
[m
N m
-1]
R245fa
present data (series1) present data (series2) critical point (Higashi et al., 2014) Schmidt et al. (1996) Lin et al. (2003) Zhelezny et al. (2007) Geller et al. (1999) REFPROP ver. 9.1

24
(c) Deviation of the measured data from REFPROP 9.1
Figure 4 Validation of measurement method with R134a and R245fa
(a) R1243zf
300 350-0.5
0
0.5
Temperature, T [K]
Devia
tion, σ
exp -
σre
fpro
p [
mN
m-1
]
R134a, R245fa R134a R245fa (series1) R245fa (series2)
standard deviation = 0.13 [mN m-1]
+0.13 mN m-1
-0.13 mN m-1
250 300 350 4000
5
10
15
20
Temperature, T [K]
Surf
ace t
ensi
on, σ
[m
N m
-1]
R1243zf
σ = 53.30(1 - T / Tcrit)1.247
Tcrit = 376.93 K
present data (series1) present data (series2) critical point (Higashi et al., 2015) Macleodo-Sugden (1923) Miller (1963) Miqueu et al. (2000) Di Nicola et al. (2011) empirical correlation

25
(b) R1234ze(Z)
(c) R1233zd(E)
Figure 5 Temperature dependence in surface tension
300 350 4000
5
10
15
20
Temperature, T [K]
Surf
ace t
ensi
on, σ
[m
N m
-1]
R1234ze(Z)
σ = 56.57(1 - T / Tcrit)1.220
Tcrit = 423.27 K
present data (series1) present data (series2) critical point (Higashi et al., 2012) Macleodo-Sugden (1923) Miller (1963) Miqueu et al. (2000) Di Nicola et al. (2011) empirical correlation
300 350 4000
5
10
15
20
Temperature, T [K]
Surf
ace t
ensi
on, σ
[m
N m
-1]
R1233zd(E)
present data (series1) present data (series2) Hulse et al. (2012) critical point (Hulse et al., 2012) Macleodo-Sugden (1923) Miller (1963) Miqueu et al. (2000) Di Nicola et al. (2011)
empirical correlation σ =61.95(1 - T / Tcrit)1.277
Tcrit = 438.75 K

26
(a) R1243zf
(b) R1234ze(Z)
(c) R1233zd(E)
Figure 6 Temperature dependence in surface tension
300 350-0.5
0
0.5
Temperature, T [K]
Devia
tion, σ
exp -
σca
l [m
N m
-1]
R1243zf present data (series1) present data (series2)
standard deviation = 0.054 [mN m-1]
+0.054 mN m-1
-0.054 mN m-1
300 350-0.5
0
0.5
Temperature, T [K]
Devia
tion, σ
exp -
σca
l [m
N m
-1]
R1234ze(Z) present data (series1) present data (series2)
standard deviation = 0.133 [mN m-1]
+0.133 mN m-1
-0.133 mN m-1
300 350-0.5
0
0.5
Temperature, T [K]
Devia
tion, σ
exp -
σca
l [m
N m
-1]
R1233zd(E)
standard deviation = 0.053 [mN m -1]
+ 0.053 mN m-2
- 0.053 mN m-2
present data (series1) present data (series2)

27
Figure 7 Comparison of surface tension between refrigerants
Table 1 Measurement uncertainties
measured parameter equipment uncertainty
temperature (ITS-90) Platinum resistance thermometer and
thermometer bridge, ASL F500 5 mK
differential capillary-rise-height, ∆hm
digital traveling microscope, Nippon optical works Co., Ltd., NRM-D-2XZ
0.046 mm (tolerance; 0.01 mm)
inner radii of the capillaries, r1 and r2
- 0.0009 mm
orthobaric densities, ρ' and ρ''
- 0.04% of the
calculated values with the representative temperature
300 350 4000
5
10
15
20
Temperature, T [ K ]
Surf
ace t
ensi
on,
σ
[mN
m-1
]
exp. cal. R1233zd(E) R245fa a)
R1234ze(Z) R1234ze(E) b)
R134a a)
R1243zf
a) calculated with REFRPOP 9.1 (Lemmon et al., 2013)b) Tanaka and Higashi, 2013

28
Table 2 Measured capillary constant and surface tension
temperature
(ITS-90) liquid density vapor density
capillary rise height
difference
capillary constant
surface tension
T ρ' ρ'' ∆hc a2 σ
K kg m-3 kg m-3 ×10-3 m ×10-6 m2 ×10-3 N m-1
R1243zf
seri
es 1
298.97 975.62 27.55 1.67 1.72 7.47
308.68 945.26 36.12 1.45 1.50 6.22
318.04 913.85 46.50 1.27 1.33 5.19
seri
es 2
303.99 960.18 31.73 1.56 1.61 6.84
273.50 1047.34 12.65 2.18 2.20 10.63
277.58 1036.50 14.45 2.10 2.12 10.10
288.18 1007.24 20.09 1.89 1.93 8.80
322.35 898.55 52.13 1.23 1.28 4.89
332.81 858.60 68.61 0.99 1.06 3.70
343.54 812.06 91.12 0.77 0.85 2.62
352.22 768.10 115.70 0.58 0.66 1.78
R1234ze(Z)
seri
es 1
294.00 1231.44 7.67 2.28 2.19 13.15
310.61 1187.64 13.09 2.06 1.98 11.38
319.97 1161.56 17.29 1.90 1.83 10.23
330.01 1132.27 22.96 1.71 1.65 8.95
339.94 1101.73 30.01 1.58 1.52 7.96
350.03 1068.67 38. 1.37 1.32 6.66
273.22 1282.53 3.58 2.70 2.60 16.26
277.34 1272.71 4.20 2.59 2.50 15.51
seri
es 2
283.24 1258.37 5.24 2.45 2.46 14.47
293.20 1233.48 7.46 2.31 2.33 13.35
303.19 1207.58 10.38 2.16 2.18 12.19
313.05 1180.96 14.09 1.97 2.00 10.83
323.05 1152.75 18.89 1.83 1.87 9.78
R1233zd(E)
seri
es 1
299.64 1259.20 7.56 2.42 2.33 14.29
310.54 1232.22 10.75 2.26 2.17 12.99
320.56 1206.51 14.53 2.05 1.98 11.54
330.37 1180.36 19.19 1.90 1.82 10.38
340.23 1152.92 25.01 1.72 1.65 9.13
349.98 1124.41 32.11 1.56 1.51 8.05
305.58 1244.61 9.19 2.32 2.24 13.53
seri
es 2
280.72 1303.97 3.82 2.74 2.64 16.78
301.79 1253.94 8.12 2.40 2.31 14.08
279.26 1307.32 3.61 2.77 2.67 17.02
29
Table 3 Fluid parameters used for the estimations, Eqs. (6) to (9)
R1243zf R1234ze(Z) R1233zd(E)
critical temperature Tcrit K 376.93 c) 423.27 b) 438.75 a, e)
critical pressure Pcrit MPa 3.517 c) 3.533 b) 3.573 a)
normal boiling point Tb K 246.70 c) 283.40 d) 291.47 a)
acentric factor ω - 0.2605 c) 0.3274 d) 0.3050 a)
parachor f) [P] - 169.5 180.1 209.2
a) REFPROP 9.1 (Lemmon et al., 2013), b) Higashi et al. (2014), c) Akasaka (2015),
d) Akasaka et al. (2014), e) Hulse et al. (2012), f) Reid et al. (1987)
Table 4 Assessment of the estimation methods
Macleodo-
Sugden
(1923)
Miller
(1963)
Miqueu et al.
(2000)
Di Nicola et al.
(2013)
Empirical
correlation
Eq. (13)
ε
[mN m-1]
Eq. (10)
R1243zf 0.45 -0.05 0.09 -0.14 0.004
R1234ze(Z) 0.70 -0.11 0.65 -0.37 -0.023
R1233zd(E) 2.01 -0.35 -0.29 -0.54 -0.004
overall 1.00 -0.16 0.19 -0.35 -0.009
STDEV
[mN m-1]
Eq. (11)
R1243zf 0.16 0.09 0.08 0.06 0.055
R1234ze(Z) 0.23 0.13 0.26 0.13 0.133
R1233zd(E) 0.30 0.21 0.16 0.17 0.056
overall 0.70 0.19 0.43 0.20 0.095