kommunikasjon: a tool for managing product quality
DESCRIPTION
ASPIRE (A System for Product Improvement, Review, and Evaluation) - A Tool for Managing Product QualityTRANSCRIPT
ASPIRE*
- A Tool for Managing
Product Quality
Heather Bergdahl
Lilli Japec
Åke Pettersson
*ASPIRE: A System for Product Improvement, Review, and Evaluation
Background
• Need for quantitative and objective measure of
quality in a variety of statistical products (including
surveys, registers, compilations) to stakeholders
• ESS Quality Framework for statistical outputs
• Thorough process, simple reporting, credible
results
• Consultants, Dennis Trewin and Paul Biemer,
asked to develop and implement the system (our
paper and presentation rely heavily on their report)
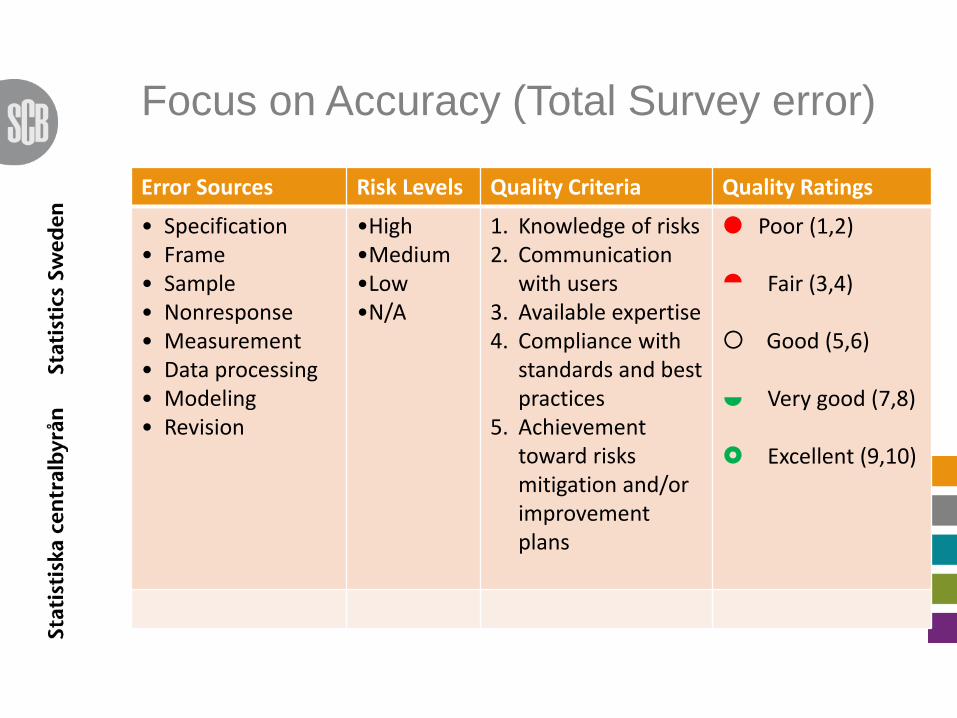
Focus on Accuracy (Total Survey error)
Error Sources Risk Levels Quality Criteria Quality Ratings
• Specification • Frame • Sample • Nonresponse • Measurement • Data processing • Modeling • Revision
•High •Medium •Low •N/A
1. Knowledge of risks 2. Communication
with users 3. Available expertise 4. Compliance with
standards and best practices
5. Achievement toward risks mitigation and/or improvement plans
Poor (1,2)
Fair (3,4)
Good (5,6)
Very good (7,8)
Excellent (9,10)
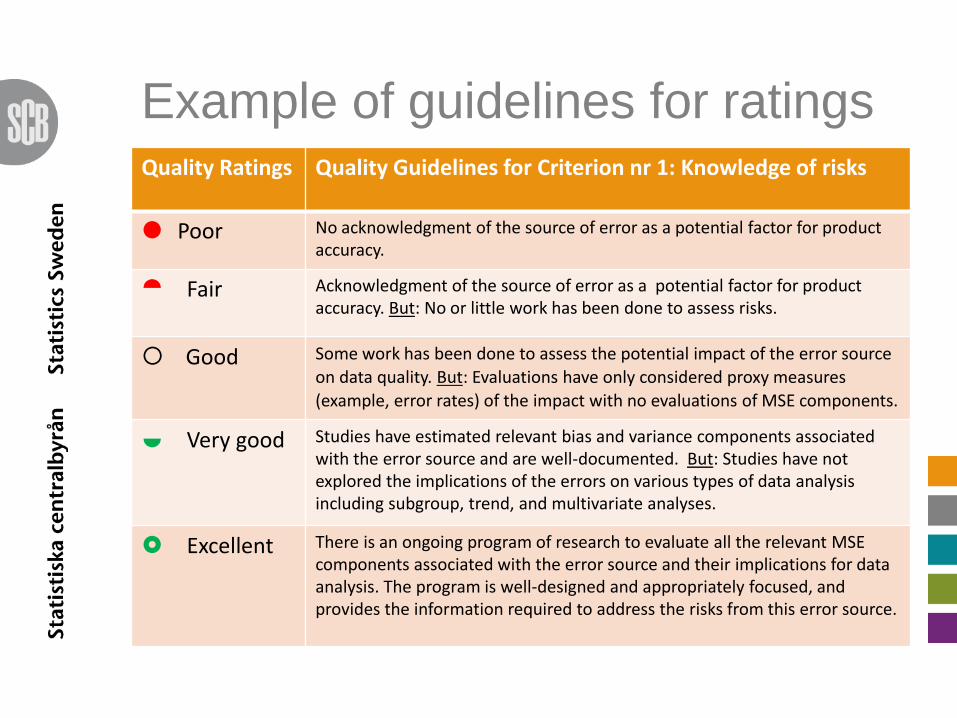
Example of guidelines for ratings Quality Ratings Quality Guidelines for Criterion nr 1: Knowledge of risks
Poor No acknowledgment of the source of error as a potential factor for product accuracy.
Fair Acknowledgment of the source of error as a potential factor for product accuracy. But: No or little work has been done to assess risks.
Good
Some work has been done to assess the potential impact of the error source
on data quality. But: Evaluations have only considered proxy measures
(example, error rates) of the impact with no evaluations of MSE components.
Very good
Studies have estimated relevant bias and variance components associated with the error source and are well-documented. But: Studies have not explored the implications of the errors on various types of data analysis including subgroup, trend, and multivariate analyses.
Excellent
There is an ongoing program of research to evaluate all the relevant MSE components associated with the error source and their implications for data analysis. The program is well-designed and appropriately focused, and provides the information required to address the risks from this error source.
Tested Products
• Labour Force Survey
• Consumer Price Index
• Foreign Trade of Goods
• Annual Municipal Accounts
• Structural Business Statistics
• Business Register
• Total Population Register
• Survey of Living Conditions
• National Accounts – quarterly and annual GDP
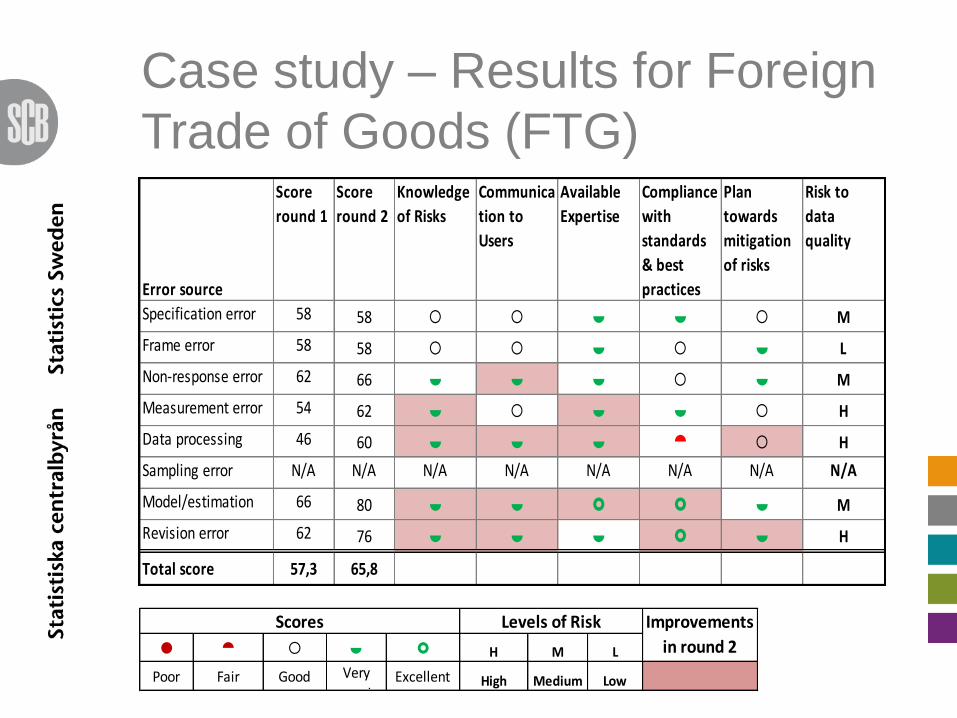
Case study – Results for Foreign
Trade of Goods (FTG)
Error source
Score
round 1
Score
round 2
Knowledge
of Risks
Communica
tion to
Users
Available
Expertise
Compliance
with
standards
& best
practices
Plan
towards
mitigation
of risks
Risk to
data
quality
Specification error 58 58 M
Frame error 58 58 L
Non-response error 62 66 M
Measurement error 54 62 H
Data processing
error
46 60 H
Sampling error N/A N/A N/A N/A N/A N/A N/A N/A
Model/estimation
error
66 80 M
Revision error 62 76 H
Total score 57,3 65,8
H M L
Poor Fair Good Very
goodExcellent High Medium Low
Improvements
in round 2
Scores Levels of Risk
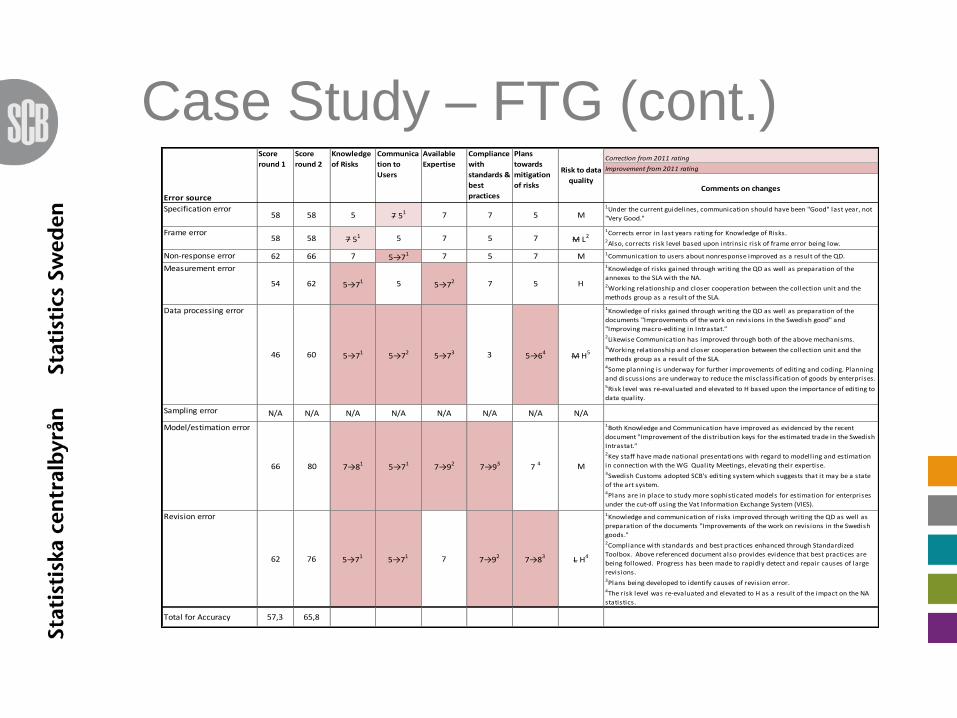
Case Study – FTG (cont.) Correction from 2011 rating
Improvement from 2011 rating
Comments on changes
Specification error58 58 5 7 51 7 7 5 M
1Under the current guidelines, communication should have been "Good" last year, not
"Very Good."
Frame error58 58 7 51 5 7 5 7 M L2
1Corrects error in last years rating for Knowledge of Risks. 2Also, corrects risk level based upon intrinsic risk of frame error being low.
Non-response error 62 66 7 5→71 7 5 7 M 1Communication to users about nonresponse improved as a result of the QD.
Measurement error
54 62 5→71 5 5→72 7 5 H
1Knowledge of risks gained through writing the QD as well as preparation of the
annexes to the SLA with the NA.2Working relationship and closer cooperation between the collection unit and the
methods group as a result of the SLA.
Data processing error
46 60 5→71 5→72 5→73 3 5→64 M H5
1Knowledge of risks gained through writing the QD as well as preparation of the
documents "Improvements of the work on revisions in the Swedish good" and
"Improving macro-editing in Intrastat."2Likewise Communication has improved through both of the above mechanisms.3Working relationship and closer cooperation between the collection unit and the
methods group as a result of the SLA.4Some planning is underway for further improvements of editing and coding. Planning
and discussions are underway to reduce the misclassification of goods by enterprises.5Risk level was re-evaluated and elevated to H based upon the importance of editing to
data quality.
Sampling error N/A N/A N/A N/A N/A N/A N/A N/A
Model/estimation error
66 80 7→81 5→71 7→92 7→93 7 4 M
1Both Knowledge and Communication have improved as evidenced by the recent
document "Improvement of the distribution keys for the estimated trade in the Swedish
Intrastat."2Key staff have made national presentations with regard to modelling and estimation
in connection with the WG Quality Meetings, elevating their expertise.3Swedish Customs adopted SCB's editing system which suggests that it may be a state
of the art system.4Plans are in place to study more sophisticated models for estimation for enterprises
under the cut-off using the Vat Information Exchange System (VIES).
Revision error
62 76 5→71 5→71 7 7→92 7→83 L H4
1Knowledge and communication of risks improved through writing the QD as well as
preparation of the documents "Improvements of the work on revisions in the Swedish
goods." 2Compliance with standards and best practices enhanced through Standardized
Toolbox. Above referenced document also provides evidence that best practices are
being followed. Progress has been made to rapidly detect and repair causes of large
revisions.3Plans being developed to identify causes of revision error.4The risk level was re-evaluated and elevated to H as a result of the impact on the NA
statistics.
Total for Accuracy 57,3 65,8
Compliance
with
standards &
best
practices
Plans
towards
mitigation
of risks
Risk to data
quality
Error source
Score
round 1
Score
round 2
Knowledge
of Risks
Communica
tion to
Users
Available
Expertise
Examples of general findings and
recommendations to Stat Sweden • Measurement error remains a high risk area and shows
lower scores, although somewhat improved from last year
• Non-response in household surveys requires even more
focused effort to find the most important drivers of non-
response bias
• Evaluation studies need to focus more on MSE components
and be more coordinated across the organisation
• More integration and coordination needed in economic
statistics
• Documentation of quality in statistics has improved between
rounds 1 and 2 but there is further room for improvement
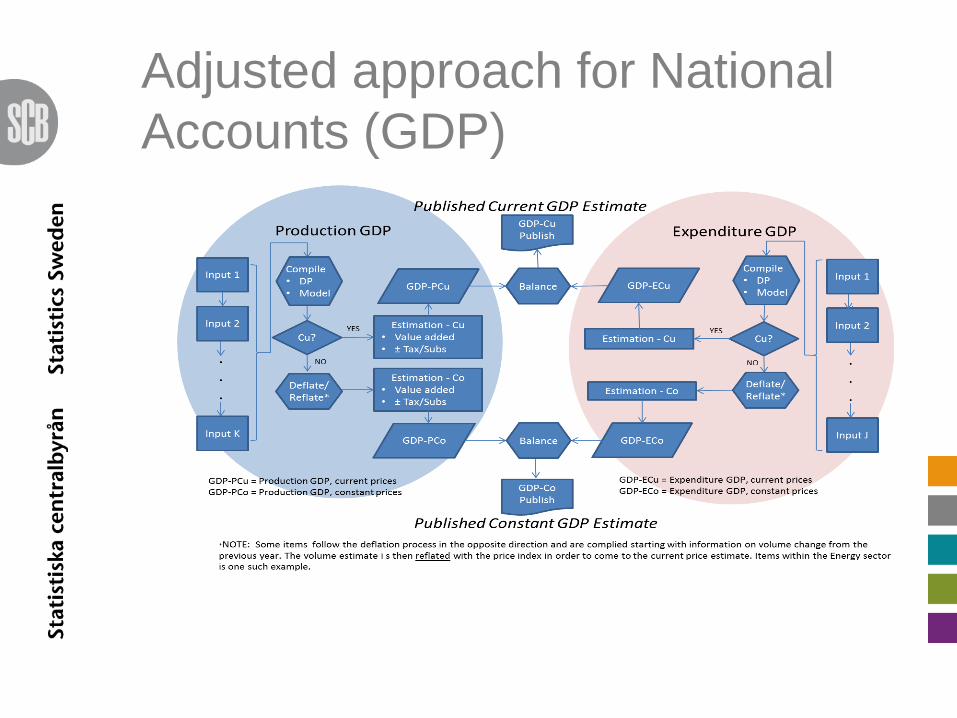
Adjusted approach for National
Accounts (GDP)
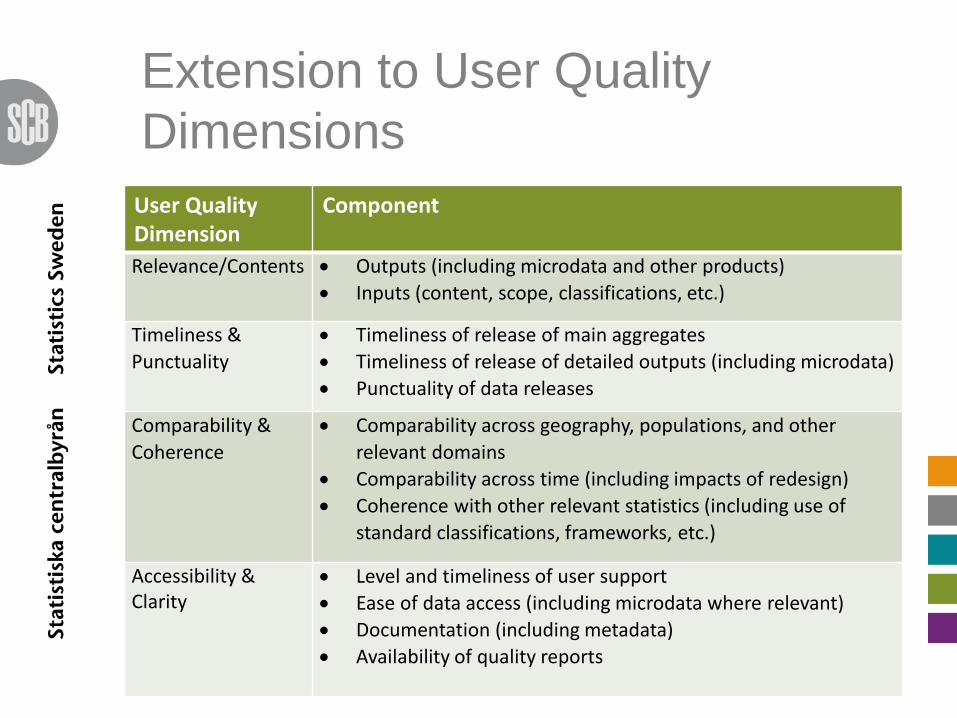
Extension to User Quality
Dimensions
User Quality Dimension
Component
Relevance/Contents Outputs (including microdata and other products)
Inputs (content, scope, classifications, etc.)
Timeliness &
Punctuality
Timeliness of release of main aggregates
Timeliness of release of detailed outputs (including microdata)
Punctuality of data releases
Comparability &
Coherence
Comparability across geography, populations, and other
relevant domains
Comparability across time (including impacts of redesign)
Coherence with other relevant statistics (including use of
standard classifications, frameworks, etc.)
Accessibility & Clarity
Level and timeliness of user support
Ease of data access (including microdata where relevant)
Documentation (including metadata)
Availability of quality reports
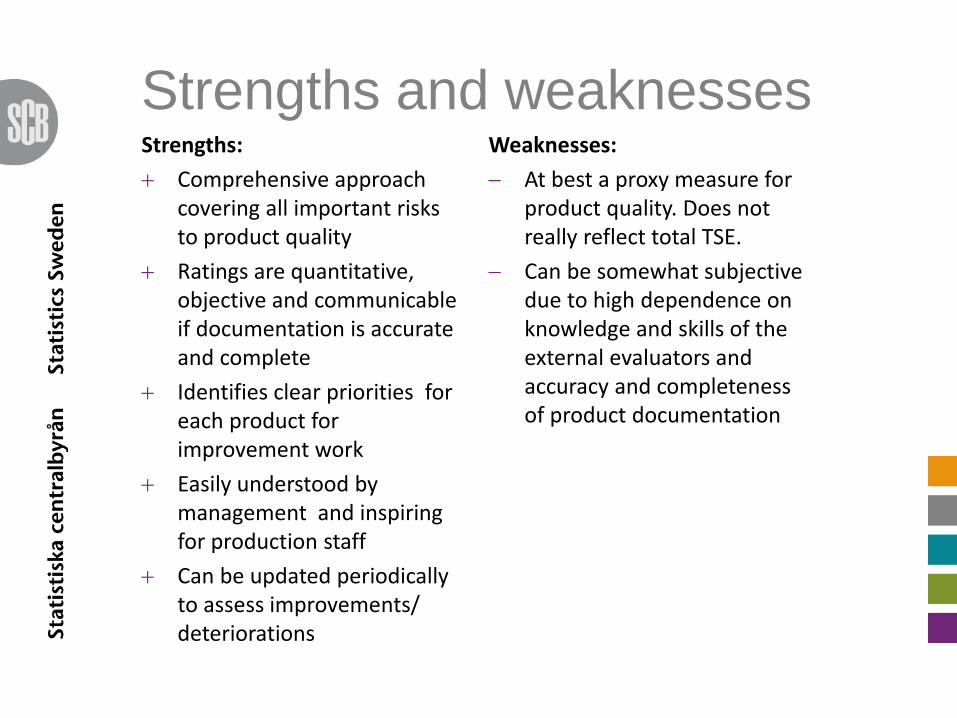
Strengths and weaknesses Strengths:
Comprehensive approach covering all important risks to product quality
Ratings are quantitative, objective and communicable if documentation is accurate and complete
Identifies clear priorities for each product for improvement work
Easily understood by management and inspiring for production staff
Can be updated periodically to assess improvements/ deteriorations
Weaknesses:
At best a proxy measure for product quality. Does not really reflect total TSE.
Can be somewhat subjective due to high dependence on knowledge and skills of the external evaluators and accuracy and completeness of product documentation
ASPIRE– pointing us towards
excellence
and beyond…