kokopelli riverfront trail phase 2 addendum #2 · d. kokopelli riverfront trail geotechnical...
TRANSCRIPT
Kokopelli Riverfront Trail Phase 2 Project #130-790-77-4730 ADDENDUM #2 Date Issued: November 10, 2017 Question Deadline: November 15, 2017 5:00 PM (Changed Date with this Addendum #2) Bids Due: November 22, 2017 (Changed Date with this Addendum #2) Time: 1:30 pm Location: 325 E. Aspen Ave. Fruita, CO 81521 The items contained in this addendum are hereby issued to provide potential bidders with additional information regarding the Bid Process. The information presented herein augments and supersedes if in conflict with all previously issued Bid Documents and/or information. This Addendum includes the following enclosed items:
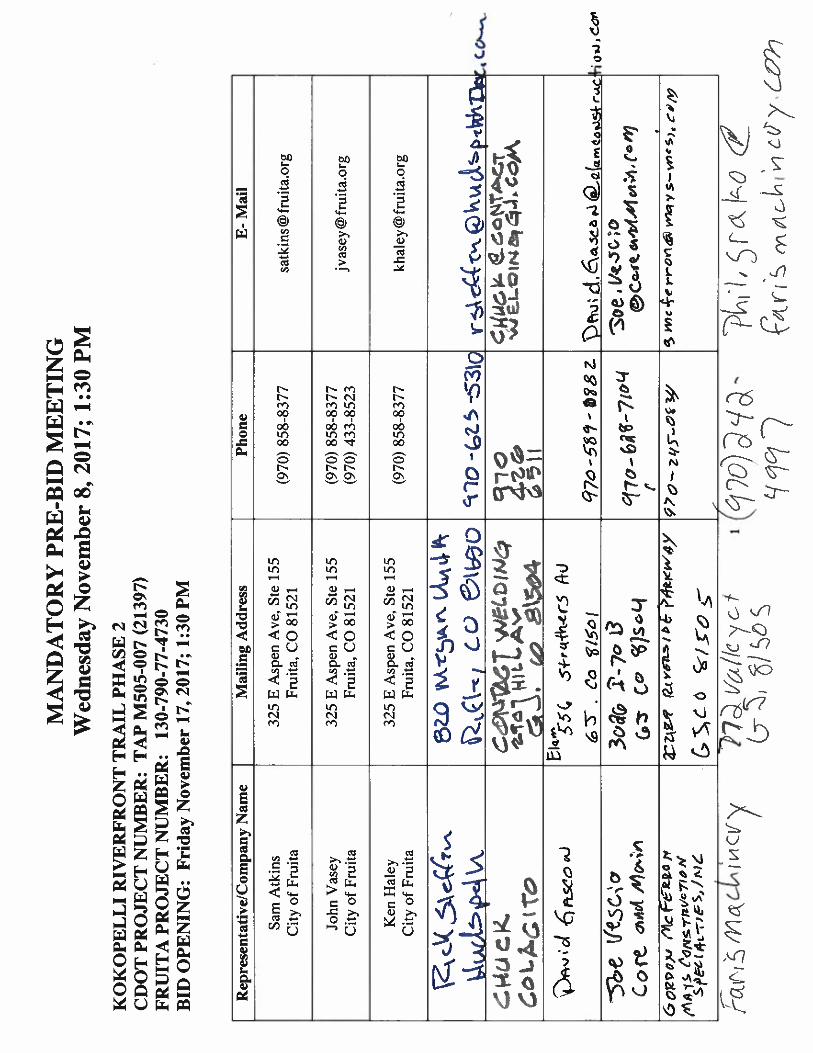
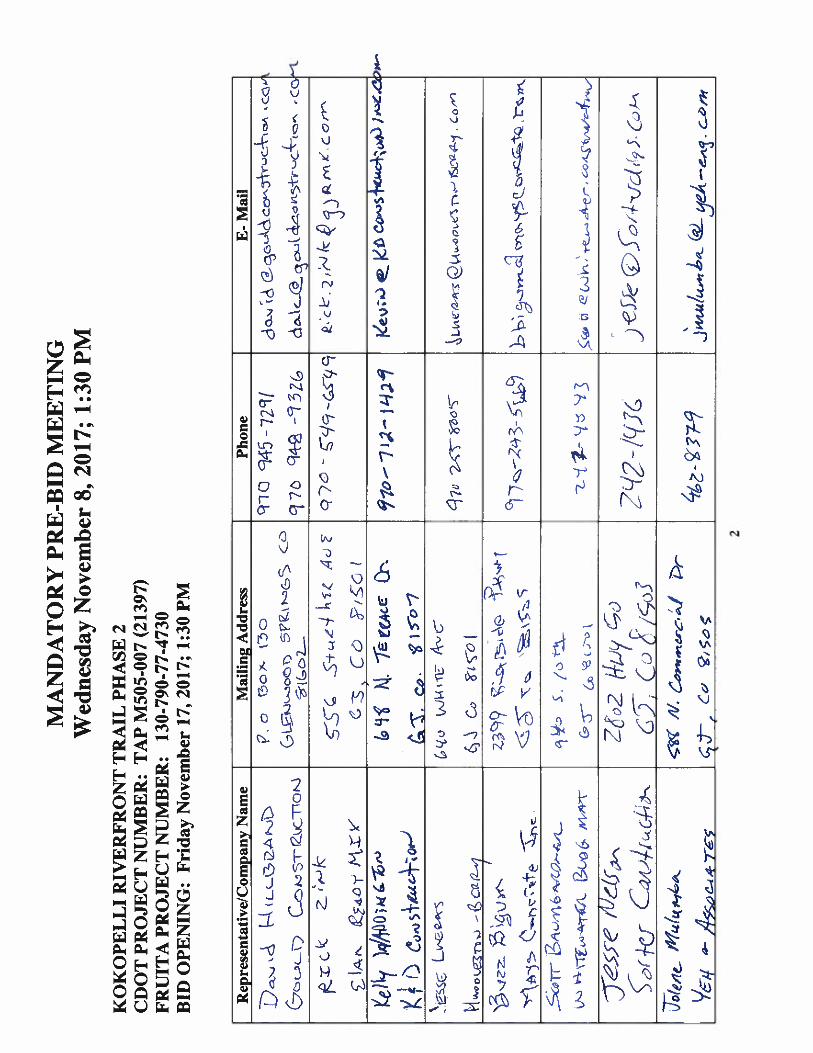
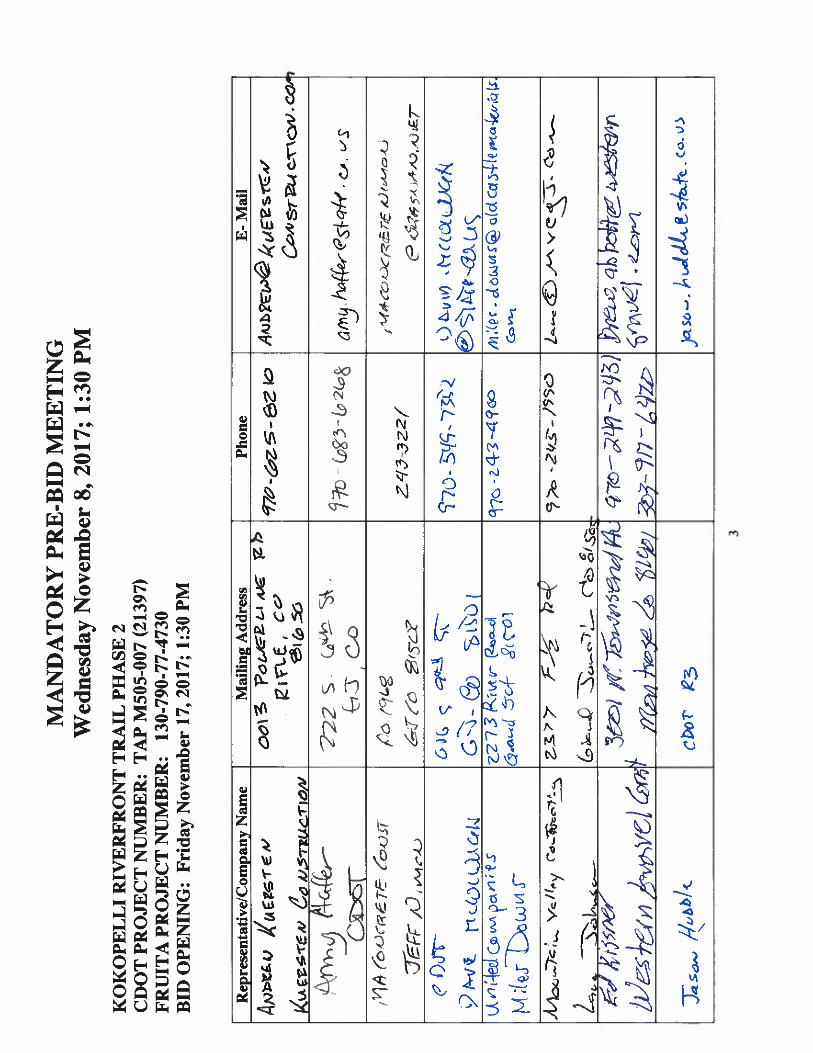
A. Pre-Bid Meeting Minutes (5 Pages) B. Pre-Bid Sign In Sheet (4 Pages) C. Kokopelli Riverfront Trail (Phases 1 & 2) - Geotechnical Report (93 Pages) D. Kokopelli Riverfront Trail Geotechnical Addendum Comments (3 Pages)
This Addendum #2 extends the deadline for questions regarding the project until 5:00 PM Wednesday November 15, 2017. The Bid Due Date is also being extended until 1:30 PM Wednesday November 22, 2017. The technical questions posed during the Pre-Bid meeting and via email after the Pre-Bid meeting along with an updated Bid Schedule will be addressed with a subsequent Addendum next week. The Contractor shall acknowledge receipt of this, and any future Addenda on the Bid Schedule to be considered a responsive bid.

Kokopelli Riverfront Trail Phase 2 Pre-Bid Meeting Agenda
City of Fruita
__________________________________________________________________ CDOT Project No. TAP M505-007 (21397) Fruita Project No. 130-790-77-4730
Page 1 of 5
Wednesday November 8, 2017 1:30 PM Mandatory Attendance for Prime Contractors
1) PROJECT STAFF
a) City of Fruita i) Project Engineer John Vasey [email protected] ii) City Engineer Sam Atkins iii) Public Works Director Ken Haley
b) CDOT i) Resident Engineer Rob Beck ii) Local Agency Construction Coordinator Dave McCollough iii) CDOT EEO Aleya Swington Amy Haffer
c) Project Design and Plans i) SGM, Inc. Bill Taylor, Jacob McNutt
2) PROJECT SUMMARY
a) City of Fruita will manage Project Construction b) CDOT to provide Local Agency oversight c) Prime Contractors must be CDOT Pre-Qualified d) The Engineers Estimate falls in the $1,000,000.00 to $5,000,000.00 Range e) Location
i) City of Fruita, Mesa County, Colorado ii) Along and under I-70 from 15 Road west to the Loma Exit
f) Properties Crossed i) City of Fruita ii) Colorado Department of Transportation
g) Project Features i) 2.23 Miles of 10’ wide concrete path ii) Gravel and Concrete shoulders iii) 50’ Pedestrian Bridge iv) 6,755 SF of Large Block Retaining wall v) 1,115 SF of Soil Nail Retaining wall vi) 1,690 CY of Gabion Riprap vii) Trail passes under 2 existing 1-70 bridges
3) PROJECT SCHEDULE
a) Mandatory Pre-Bid Conference November 8, 2017 b) Question Deadline November 10, 2017 5:00 PM c) Final Addenda Issued November 13, 2017 d) Bid Opening November 17, 2017 1:30 PM e) Successful Bidder Additional CDOT Forms November 22, 2017 4:30 PM
(Forms 605, 621, 1415, 1416 if DBE not reached) CDOT contracts division is fully staffed now and should be able to complete review in about 2 weeks per CDOT Local Agency Program Manager
f) Notice to Proceed/Preconstruction Meeting January, 2018 g) Substantial Completion 120 Working Days after NTP
Note: All dates after submittal of additional CDOT forms are dependent on obtaining CDOT Concurrence
Kokopelli Riverfront Trail Phase 2 Pre-Bid Meeting Agenda
City of Fruita
__________________________________________________________________ CDOT Project No. TAP M505-007 (21397) Fruita Project No. 130-790-77-4730
Page 2 of 5
4) CERTIFIED PAYROLLS
a) Required weekly b) Required for all subcontractors c) CDOT Form 118 – Certificate of Compliance d) Single Form 118 acceptable for multiple weeks of “No Work” e) Davis Bacon wage rates apply f) Delays in certified payrolls may delay Pay Estimates applications.
5) DISADVANTAGED BUSINESS ENTERPRISES (DBE)
a) TAKE SERIOUSLY b) 2% Goal c) Details in CDOT Standard Special Provisions d) Form 1413 Bidders List Required with bid e) Form 1414 Anticipated DBE Participation Plan required with bid f) Form 1415 DBE Commitment Confirmation required from apparent low bidder g) Form 1416 Good Faith Effort Report if necessary required from the apparent low
bidder. h) Forms required for Bid submittal are on the City of Fruita website:
http://www.fruita.org/rfps i) Failure to submit the DBE forms will result in rejection of the Bid.
6) ON THE JOB TRAINING (OJT)
a) 640 hours b) $2.00 per hour per trainee c) Per the CDOT EEO contact: The contractor should have an OJT plan in place by
the time of the Preconstruction Meeting. d) Do not wait to establish the plan during construction, the process for approval of the
plan can be lengthy and time consuming. e) OJT training hours cannot be applied retroactively.
7) BID SUBMITTAL
a) CDOT prequalified contractors in attendance at Pre-Bid meeting b) Due November 17, 2017 at 1:30 PM Fruita Civic Center Building c) Bid Package contained in Sealed Envelope labeled:
i) Kokopelli Riverfront Trail Phase 2 ii) Prime Contractor’s Name
d) Bid Package Contents i) Completed & Signed Bid Schedule and Acknowledgement of each Addendum ii) 5 % Bid Bond iii) Insurance Certificates iv) CDOT Form 606 - Anti-Collusion Affidavit v) CDOT Form 1413 - Bidders List vi) CDOT Form 1414 - Anticipated DBE Participation Plan
e) No electronic submittals accepted 8) LOWEST RESPONSIVE BIDDER REQUIRMENTS
a) CDOT Form 605 - Contractors Performance Capability Statement
Kokopelli Riverfront Trail Phase 2 Pre-Bid Meeting Agenda
City of Fruita
__________________________________________________________________ CDOT Project No. TAP M505-007 (21397) Fruita Project No. 130-790-77-4730
Page 3 of 5
b) CDOT Form 621 – Assignment of Antitrust Claims c) CDOT Form 1415 DBE Commitment Confirmation d) CDOT Form 1416 Good Faith Effort Report (if applicable) e) Forms required for award concurrence from CDOT f) The City of Fruita may reject any or all bids with CDOT concurrence g) Prime Contractor is required to complete at least 30% of the work
9) PLANS
a) There are no changes to the plans at this time. b) Award set of plans issued prior to the Pre-Construction Meeting.
10) CONTRACT DOCUMENTS
a) CDOT Project Special Provisions i) Project Specifications File ii) Specific to this project
b) CDOT Standard Special Provisions i) Based on the CDOT 2011 2017 Standard Specifications for Road and Bridge
Construction ii) Project specifications file
c) Contract Time i) 120 Working Days ii) No Incentives for early completion iii) Liquidated Damages listed in Section 108 CDOT Standard Special Provisions
(1) Assessed per Calendar Day exceeding the Contract Time d) CDOT Prequalification
i) Prime Contractors must be Prequalified with CDOT ii) CDOT Form 66 for Prequalification requires submittal 17 days prior to bid iii) 17 Day exception considered by contacting Peter Avbenake at (303) 757-9583
e) The Project Scope/Bid Instructions and Draft Contract including Construction Services Agreement and Standard Contract Insurance Requirements were issued as Addendum #1 and was distributed to those contractors included on the City of Fruita’s solicitation list and is posted on the Fruita website for this project at: http://www.fruita.org/rfps
11) PROJECT MATERIALS TESTING
a) CDOT to provide Form 250 for all materials testing b) Contractor must provide Quality Control (QC) testing c) City of Fruita has contracted with Yeh and Associates, Inc. to complete the Quality
Assurance (QA) testing. d) CDOT may provide Independent Assurance (IA) Testing
12) PROJECT SUBMITTALS – MATERIALS
a) Contractor furnished documents shall include: i) Certificates of Compliance ii) Lab test reports iii) Mill tests iv) All other tests or certifications required by the Form 250
Kokopelli Riverfront Trail Phase 2 Pre-Bid Meeting Agenda
City of Fruita
__________________________________________________________________ CDOT Project No. TAP M505-007 (21397) Fruita Project No. 130-790-77-4730
Page 4 of 5
v) Materials on the CDOT and NYDOT Approved Products Lists may be used in lieu of the Certificates of Compliance
vi) All submittals shall be stamped and certified by the Prime Contractor (1) Submittals must be originals signed by the manufacturer or vendor (2) Lack of original documents may delay payments
13) STORM WATER MANAGEMENT PLAN (SWMP)
a) Contractor must obtain and manage the required Storm Water Permit for the duration of construction for this project.
b) Contractor must provide an Erosion Control Supervisor (ECS) i) ECS completed the CDOT Erosion Control Program and hold ECS Certification ii) Copies of all reports must be provided to the City of Fruita Project Manager
c) The City of Fruita will accept the permittee responsibilities for the Project SWMP at Final Completion of the project
14) UTILITIES
a) Utilities are identified on the plan set to the best available information b) Colorado One Call locate service Contractors responsibility c) Contractor must protect all existing utilities d) Known utilities include the City of Fruita outfall pipeline from the Waste Water
Reclamation Facility and a fiber optic line recently installed south of the North ROW fence at Reed Wash with another crossing between Reed Wash and the Loma Exit.
e) The Field Trip after the meeting revealed a buried phone line crossing in the City of Fruita property. The alignment can be identified by a pedestal and Phone poles south of the alignment.
15) METHOD OF HANDLING TRAFFIC (MHT)
a) Contractor responsible for MHT b) There is no access to the project off I-70.
i) Access from City property on north side of I-70 ii) Access off Hawkeye Road on south side of I-70 iii) Only Access to the west side of Reed Wash is under the I-70 Bridges
16) ENVIRONMENTAL
a) Environmental Clearances are approved b) Wetlands are minimal but present. No mitigation is required. c) No restrictions for nesting birds on this Project – This is in reference to the eagles
nest which affected Phase 1 of this project. The migratory bird specification included in Section 240 of the Project Special Provisions must be adhered with by the success
17) STAGING AREA(S)
a) Project parking lot off Hawkeye Road on west end south of I-70 to clarify – this is the designed parking lot area at approximately STA 24+00. The paved parking area at the south side of the Loma Exit on I-70 cannot be utilized for any aspect of this project.
b) Approved areas on Fruita Parcel north of I-70
Kokopelli Riverfront Trail Phase 2 Pre-Bid Meeting Agenda
City of Fruita
__________________________________________________________________ CDOT Project No. TAP M505-007 (21397) Fruita Project No. 130-790-77-4730
Page 5 of 5
c) All lands protected per CDOT standards d) Disturbed areas restored at the completion of construction
18) CLEARING AND GRUBBING
a) Contractor arranged disposal b) Fruita will not accept clear and grub materials at any site
19) RETAINING WALLS
a) Two retaining wall designs above trail elevation i) Large Gravity Block Walls
(1) Block Wall Sta 25+15.91 to 31+92.20 (2) River Wall Sta 43+21.92 to 48+53.68
ii) Soil Nail and Shotcrete Wall (1) River Wall Sta 48+53.68 to 49+35.65
20) GABION BASKET RETAINING WALL
a) Located below and under trail and above grade retaining walls b) All material must be delivered from the south side of I-70
QUESTIONS RECEIVED PRIOR TO PRE-BID MEETING Q: There are no bidding instructions or bonding requirements shown in the Project
Specifications. What are the requirements for this project? A: Addendum #1 was issued to rectify this oversight. Addendum #1 contains a Bid
Document Cover Sheet, Bid Documents Index, Project Scope/Bid Instructions and Draft Construction Services Contract including Exhibit A – Contract Standard Conditions and Exhibit B – Contract Insurance Requirements. This Addendum was distributed to those companies that are on the City of Fruita solicitation list, the Western Colorado Contractors Association and is located on the Fruita website at: http://www.fruita.org/rfps
Q: Is there a Geotechnical Report available for this project? A: Yes, a single Geotechnical Report was prepared for both Phase 1 and Phase 2 of
this project. This report has been placed on the Fruita website as listed above. It will be attached to the Pre-Bid Meeting Minutes and distributed to all attendees of the Pre-Bid Meeting.
Q: When do you think the concrete work will start? A: Addendum #1 contains an estimated schedule for the project. We hope to issue
the Notice of Award to the successful bidder as soon as practical, however we are required to obtain CDOT and FHWA concurrence prior to awarding the project. Since this concurrence will fall during the holiday season it may be difficult to obtain in a timely manner. The concrete schedule will depend on the overall schedule established by the successful bidder.
Offices:
Colorado
Wyoming
Montana
Arizona
North Dakota
Oregon
Washington
Alaska
GEOTECHNICAL REPORT AND PAVEMENT DESIGN FOR
KOKOPELLI SECTION RIVERFRONT TRAIL CITY OF FRUITA
MESA COUNTY, COLORADO
March 21, 2016
Prepared for: John Vasey, Project Engineer City of Fruita Engineering Department 325 East Aspen Street Fruita, CO 81521
Introduction DOWL conducted a geotechnical evaluation of the proposed 5.8 mile trail alignment that roughly parallels the Colorado River and I-70 and connects the City of Fruita at Little Salt Wash with the Kokopelli Trailhead in Mesa County, Colorado. This project is called the Kokopelli Section Riverfront Trail, hereafter referred to as the Kokopelli Section, and it is the western-most section of paved recreation path that traverses the Grand Valley from Palisade to Fruita and Loma (see Vicinity Map, Map 1). Our services were performed at the request of John Vasey, project engineer, on behalf of the City of Fruita (COF) to evaluate the trail alignment for construction of a paved trail with two alternate routes. The project consists of four segments, or phases, according to the COF Engineering Department and shown on the Site Plan (Map 2):
1.) The first trail segment (East Phase) is roughly 1.8 miles long and starts on the west side of the Little Salt Wash, crosses the Big Salt Wash, and ends before the Grand Valley Drainage Ditch (GVDD) crossing. It follows existing easements to the COF Waste Water Reclamation Facility (WWRF) and will require a bridge to cross the Big Salt Wash.
2.) The second trail segment (WWRF Phase) is roughly 1.4 miles long and starts at the GVDD crossing (which will require a culvert), and extends northwest across Waste Water Reclamation Facility (WWRF) property to the Colorado Department of Transportation (CDOT) Right-of-Way (ROW) on the southeast side of Reed Wash.
3.) The third trail segment (CDOT I-70 Phase) has two alternate routes. The north alternative route is roughly 1.5 miles long and starts at the CDOT ROW, crosses Reed Wash (which will require a bridge), continues west on the north side of I-70 to the off-ramp for the Loma exit, south on Highway 139 and crosses over I-70 to its’ intersection with Hawkeye Road. The south alternative route would be a roughly 0.8 mile trail that crosses Reed Wash, turns south to pass under I-70 on the northwest side of Reed Wash, and roughly parallels I-70 west to Highway 139. Both alternatives would continue west on Hawkeye Road, then south onto Kokopelli Trail Road, which turns west until it intersects a fenceline at Bureau of Land Management (BLM) property.
4.) The fourth trail segment (BLM Phase), which is roughly 0.3 miles long, is entirely on BLM property and extends from the CDOT I-70 Phase fenceline west to the Kokopelli Trailhead.
Our evaluation of the Kokopelli Section consisted of a site reconnaissance, field evaluation of subsurface conditions including twenty-two (22) test holes, observation, logging and testing of representative materials found, pavement design, and analysis of available data. Of the 22 test holes, seventeen (17) were augered with a tracked drill rig (BH#1 to BH#8 and BH#13 to BH#21), four (4) were excavated with a backhoe (TP#9 to TP#12), and one (1) was hand-dug with a bucket auger (BH#22) since it was not accessible with heavy equipment. The COF had rough staked the alignment with pin flags within Phase 1 and 2 properties prior to our field work and our field evaluation was performed on January 21 and February 4, 2016. Each test hole location was then surveyed by the COF (Table 1). As indicated on the Site Plan, the trail boreholes were typically 6.5 feet deep, the trail test pits were 6 feet deep, and the two bridge sites and one culvert site were deeper (14-20.5 feet) to provide recommendations for foundation design. In addition, BH#1 near the Little Salt Wash was 15 feet deep to characterize the depth and nature of fill associated with the COF sewerline in the trail corridor and the hand augered test hole (BH#22) was 3 feet deep.
Kokopelli Section Riverfront Trail geotech report.docx Project #7131.74482.01 Page 2 of 32

This report presents the findings of our evaluation and our geotechnical engineering recommendations for site preparation, pavement design, general management of drainage and geologic hazards, and design of foundation systems for the bridges and culvert. Construction Plans & Site Conditions The proposed 5.8 miles of the Kokopelli Section Trail is the final section of the Riverfront Trail system to be constructed along the Colorado River in the Grand Valley. The Kokopelli Section will be a 10-foot wide paved concrete trail with bridges meeting a 16,000 pound load rating for emergency vehicles. Portions of the Kokopelli Section are within the 100 year floodplain of the Colorado River and are subject to seasonal flooding. We understand it is the desire of the COF to allow flooding of the trail rather than elevating it above anticipated flood stage. Protection of the trail and bridges from scour is a concern and options for protection will be discussed in this report. The four trail segments have different surface conditions and ownership, as follows: 1. East Phase – This phase is characterized by open, undeveloped and disturbed land with mostly low native vegetation on the north side of I-70. The trail alignment follows existing easements to the COF Waste Water Reclamation Facility property. The first portion of the East Phase between the Little and Big Salt Washes is COF and private property, while the portion between the Big Salt Wash and the GVDD crossing is mostly United Companies and private property. The easterly COF section also serves as a sanitary sewer line route until it turns north at 16 Road. There are two large ponds, where previous gravel mining operations have taken place, and existing access/haul roads. No active gravel mining is occurring within the trail alignment, but ongoing operations are underway nearby. This area is in the 100 year floodplain of the Colorado River. The alignment had been flagged and roughly cleared prior to our field work and access was possible due to existing gravel or dirt roads within or adjacent to the alignment. A bridge will need to be constructed over the Big Salt Wash for the trail. The following photographs show the Big Salt Wash (left) and the typical nature of the terrain in this phase (right) at the time of our field exploration.
Figure 1. Left photograph was taken looking south at the Big Salt Wash as it flows under I-70 and joins the Colorado River. The proposed trail will cross the Big Salt Wash in the vicinity of the foreground of the photo. Right photograph was taken looking east at BH#5. Note the vegetative cover and overhead powerlines.
Kokopelli Section Riverfront Trail geotech report.docx Project #7131.74482.01 Page 3 of 32
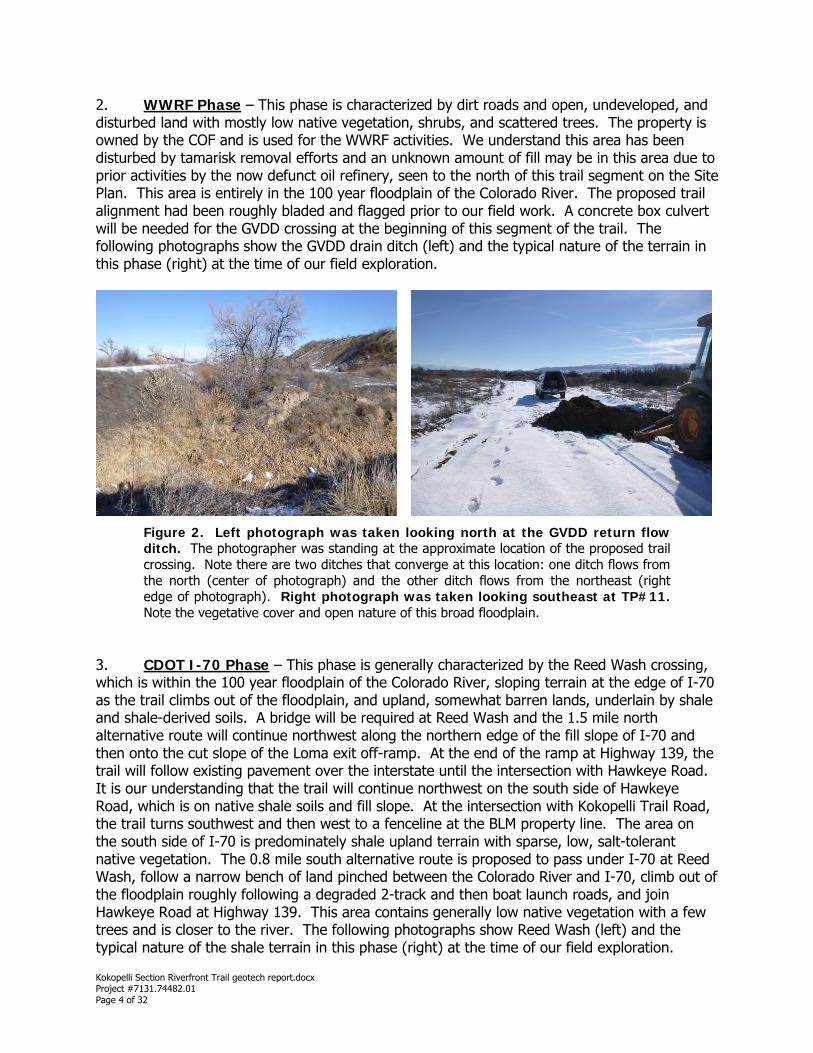
2. WWRF Phase – This phase is characterized by dirt roads and open, undeveloped, and disturbed land with mostly low native vegetation, shrubs, and scattered trees. The property is owned by the COF and is used for the WWRF activities. We understand this area has been disturbed by tamarisk removal efforts and an unknown amount of fill may be in this area due to prior activities by the now defunct oil refinery, seen to the north of this trail segment on the Site Plan. This area is entirely in the 100 year floodplain of the Colorado River. The proposed trail alignment had been roughly bladed and flagged prior to our field work. A concrete box culvert will be needed for the GVDD crossing at the beginning of this segment of the trail. The following photographs show the GVDD drain ditch (left) and the typical nature of the terrain in this phase (right) at the time of our field exploration.
Figure 2. Left photograph was taken looking north at the GVDD return flow ditch. The photographer was standing at the approximate location of the proposed trail crossing. Note there are two ditches that converge at this location: one ditch flows from the north (center of photograph) and the other ditch flows from the northeast (right edge of photograph). Right photograph was taken looking southeast at TP#11. Note the vegetative cover and open nature of this broad floodplain.
3. CDOT I-70 Phase – This phase is generally characterized by the Reed Wash crossing, which is within the 100 year floodplain of the Colorado River, sloping terrain at the edge of I-70 as the trail climbs out of the floodplain, and upland, somewhat barren lands, underlain by shale and shale-derived soils. A bridge will be required at Reed Wash and the 1.5 mile north alternative route will continue northwest along the northern edge of the fill slope of I-70 and then onto the cut slope of the Loma exit off-ramp. At the end of the ramp at Highway 139, the trail will follow existing pavement over the interstate until the intersection with Hawkeye Road. It is our understanding that the trail will continue northwest on the south side of Hawkeye Road, which is on native shale soils and fill slope. At the intersection with Kokopelli Trail Road, the trail turns southwest and then west to a fenceline at the BLM property line. The area on the south side of I-70 is predominately shale upland terrain with sparse, low, salt-tolerant native vegetation. The 0.8 mile south alternative route is proposed to pass under I-70 at Reed Wash, follow a narrow bench of land pinched between the Colorado River and I-70, climb out of the floodplain roughly following a degraded 2-track and then boat launch roads, and join Hawkeye Road at Highway 139. This area contains generally low native vegetation with a few trees and is closer to the river. The following photographs show Reed Wash (left) and the typical nature of the shale terrain in this phase (right) at the time of our field exploration.
Kokopelli Section Riverfront Trail geotech report.docx Project #7131.74482.01 Page 4 of 32
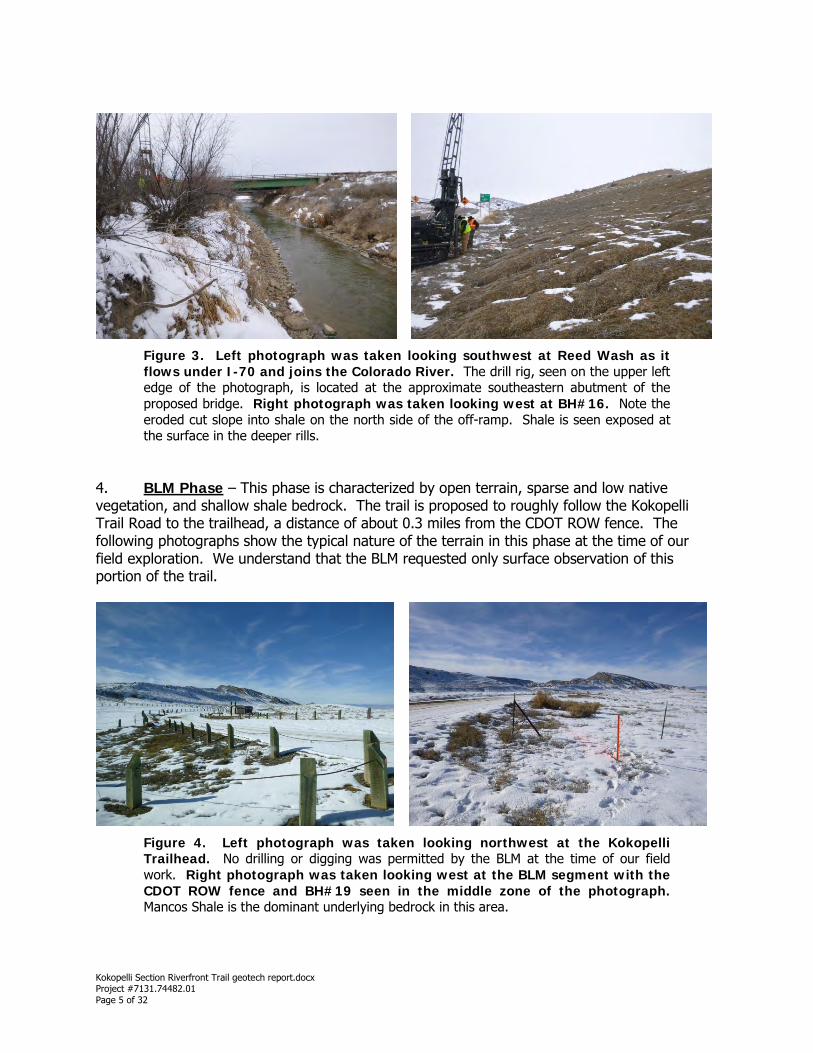
Figure 3. Left photograph was taken looking southwest at Reed Wash as it flows under I-70 and joins the Colorado River. The drill rig, seen on the upper left edge of the photograph, is located at the approximate southeastern abutment of the proposed bridge. Right photograph was taken looking west at BH#16. Note the eroded cut slope into shale on the north side of the off-ramp. Shale is seen exposed at the surface in the deeper rills.
4. BLM Phase – This phase is characterized by open terrain, sparse and low native vegetation, and shallow shale bedrock. The trail is proposed to roughly follow the Kokopelli Trail Road to the trailhead, a distance of about 0.3 miles from the CDOT ROW fence. The following photographs show the typical nature of the terrain in this phase at the time of our field exploration. We understand that the BLM requested only surface observation of this portion of the trail.
Figure 4. Left photograph was taken looking northwest at the Kokopelli Trailhead. No drilling or digging was permitted by the BLM at the time of our field work. Right photograph was taken looking west at the BLM segment with the CDOT ROW fence and BH#19 seen in the middle zone of the photograph. Mancos Shale is the dominant underlying bedrock in this area.
Kokopelli Section Riverfront Trail geotech report.docx Project #7131.74482.01 Page 5 of 32
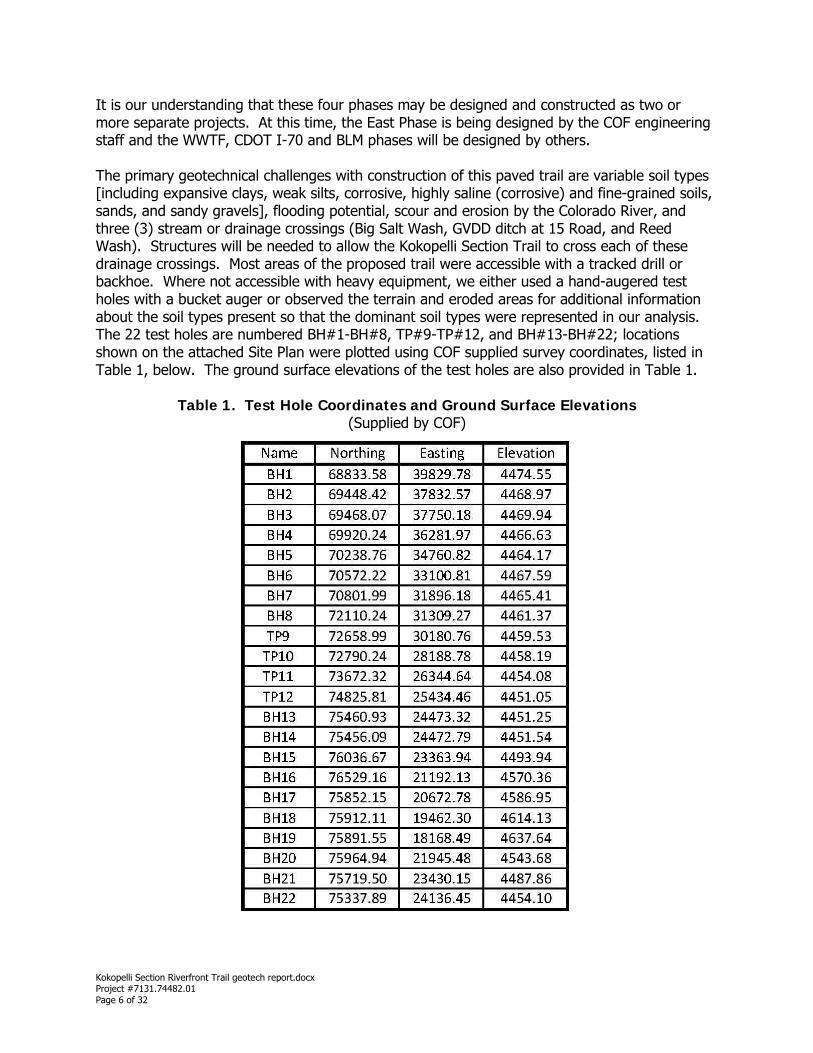
It is our understanding that these four phases may be designed and constructed as two or more separate projects. At this time, the East Phase is being designed by the COF engineering staff and the WWTF, CDOT I-70 and BLM phases will be designed by others. The primary geotechnical challenges with construction of this paved trail are variable soil types [including expansive clays, weak silts, corrosive, highly saline (corrosive) and fine-grained soils, sands, and sandy gravels], flooding potential, scour and erosion by the Colorado River, and three (3) stream or drainage crossings (Big Salt Wash, GVDD ditch at 15 Road, and Reed Wash). Structures will be needed to allow the Kokopelli Section Trail to cross each of these drainage crossings. Most areas of the proposed trail were accessible with a tracked drill or backhoe. Where not accessible with heavy equipment, we either used a hand-augered test holes with a bucket auger or observed the terrain and eroded areas for additional information about the soil types present so that the dominant soil types were represented in our analysis. The 22 test holes are numbered BH#1-BH#8, TP#9-TP#12, and BH#13-BH#22; locations shown on the attached Site Plan were plotted using COF supplied survey coordinates, listed in Table 1, below. The ground surface elevations of the test holes are also provided in Table 1.
Table 1. Test Hole Coordinates and Ground Surface Elevations (Supplied by COF)
Kokopelli Section Riverfront Trail geotech report.docx Project #7131.74482.01 Page 6 of 32

Geologic Setting According to the Geologic and Structure Map of the Grand Junction Quadrangle, Colorado and Utah (USGS Map I-736, Cashion: 1973), the bedrock underlying the entire trail project is Cretaceous Mancos Shale (Km), a dark gray to black, soft calcareous shale with some thin sandstone beds. However, the roughly eastern 75% of the trail (i.e. east of BH#20 as seen on the Site Plan) has alluvial deposits overlying this marine shale formation. According to the Surficial Geologic Map of the Grand Junction 1° x 2° Quadrangle (USGS Map I-1289, Whitney: 1981), most of the alluvium is geologically recent Holocene alluvium (Qa) with some areas of young (Late Pleistocene) gravel (Qyg) on low terraces adjacent to the floodplain. The extensive Holocene alluvium consists of clay, silt, sand, and gravel deposited by the Colorado River and its tributaries in current or former channels and in floodplain deposits. These alluvial deposits can be up to 50 meters thick adjacent to the Colorado River, according to Whitney (1981). There are no mapped faults, folds, intrusions or other major geologic features that cross the proposed trail alignment. Site Soils As mentioned above in the Geologic Setting section, there are basically two geologic settings that the trail traverses: deep, fine- to coarse-grained river alluvial deposits that cover the eastern 75% of the proposed trail and shallow, fine-grained soils derived from the in-situ weathering of Mancos Shale in the western roughly 25% of the trail. According to the Natural Resources Conservation Service (NRCS) Web Soil Survey (websoilsurvey.sc.egov.usda.gov), there are six predominant soil types mapped along the Kokopelli Section Trail. These mapping units are Bc – Sagers silty clay loam (0 to 2% slopes), Rc – Fruitland sandy clay loam (0 to 2% slopes), Ro – Bebeevar-Green River-Riverwash soils (0 to 2% slopes), Gk - Bebeevar loam (0 to 2% slopes), Re – Sagrlite loam (1 to 2% slopes), and 68 - Killpack-Badlands-Persayo (KBP) complex, saline (3 to 25% slopes). According to the NRCS mapping, the Sagers silty clay loam is the most common soil type in the alluvial floodplain area of the trail and the KBP complex is the dominant soil mapping unit in the upland shale terrain in the western portion of the trail. The Sagers soils are described as silty clay loam alluvial soils with depth to bedrock and water table greater than 80 inches and are slightly saline to moderately saline. Some of the minor soil types in the floodplain region have a shallower water table (within 2 to 4 feet of the surface) and coarser texture (sandy gravels) such as the Bebeevar, Green River and Riverwash soils. The KBP complex soils are described as silty clay and silty clay loam residuum weathered from clayey shale that have a restrictive paralithic bedrock layer at 2 to 40 inches, a water table greater than 80 inches, and are non-saline to strongly saline. We used the NRCS soils mapping to aid in selecting our subsurface testing locations to ensure that we sampled the dominant soil types. We also performed site-specific subsurface testing at the bridge and culvert locations for foundation design recommendations. The specific soils we found along the Kokopelli Section are described below in the Subsurface Conditions section of this report.
Kokopelli Section Riverfront Trail geotech report.docx Project #7131.74482.01 Page 7 of 32

Geologic Hazards The primary geologic hazards relevant to the Kokopelli Section Trail are bank erosion and flooding. Secondary hazards include soil-related conditions such as compressible and expansive soils, corrosivity, and seasonal shallow groundwater conditions. These soil-specific conditions are discussed in Subsurface Conditions section of this report and remediation is provided in the Recommendations section. The primary hazards are discussed in more detail below. It should be noted that, although not a geologic hazard, due to the proximity of the south alternative route to I-70, providing protection from interstate traffic should be taken into account in the design of this portion of the trail. This is also further discussed in the Recommendations section of this report.
Bank Erosion (Scour) The only location where the Kokopelli Section Trail is immediately adjacent to the active channel of the Colorado River is along the proposed south alternative route of the CDOT I-70 phase of trail between Reed Wash and the sharp bend in the river seen on the Site Plan near BH#22. In this area, the river makes a sharp bend to the southwest, so the trail is located on a narrow strip of land above a cut bank (outside bend) of the river and I-70. The following photograph shows the nature of the terrain for the south alternative route in this area.
There are varying amounts of boulder rip-rap stacked along this bank non-uniformly, as seen in the photos below, which is evidence of some effort to protect this bank from erosion. Erosion of this bank not only potentially undercuts a portion of the proposed trail, but also potentially threatens a portion of I-70, which is presumably why the previous effort has been made to place rip-rap in this area. The variability of rip-rap appearance could be due to placement methods, effects of past erosion, or combinations, thereof.
Figure 5. View southeast at the major bend in the Colorado River at the area of the south alternative route. This is an area of active erosion as it is the cut bank in the river meander. Some boulder rip-rap can be seen along the left side of the water’s edge. The location of the Reed Wash confluence is indicated.
Reed Wash south alternative route
Kokopelli Section Riverfront Trail geotech report.docx Project #7131.74482.01 Page 8 of 32
The above photos illustrate the nature of the rip-rap, which appears to have been placed in different phases and without design, grouting or anchoring. It will have to be decided how much expense is to be budgeted for this section, as the construction of a mechanically stabilized earth (MSE) or proper boulder stack wall with a foundation would be more expensive for this roughly 625 foot section of trail than just adding more rip-rap. We suggest that, at a minimum, the bank should be armored with more uniform, large boulder rip-rap for the entire length of the trail in this section. This effort would be advantageous to CDOT, as well, since it would provide more long-term stability for this section of I-70 that would be subject to undercutting due to erosion during large flood events of the Colorado River. An example schematic is offered in the Recommendations section of this report for providing scour and highway protection of the south alternative route, such as was used successfully in the “Narrows” section of the Fruita Connection Riverfront Trail that had similar hazards from both highway traffic on the east side and river scour hazard on the west side of the trail. Also due to smaller scale erosion, the section of the proposed south alternative route from BH#20 to several hundred feet southeast of BH#21 (see Site Plan) is subject to gullying and
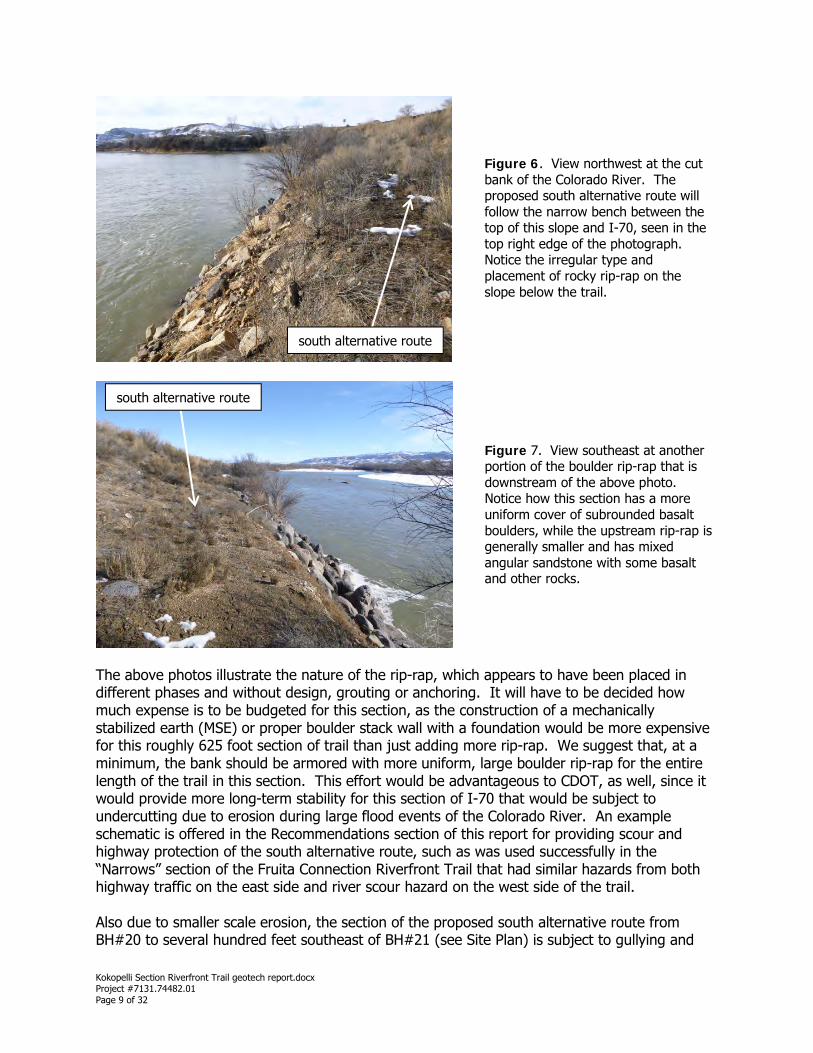
Figure 6. View northwest at the cut bank of the Colorado River. The proposed south alternative route will follow the narrow bench between the top of this slope and I-70, seen in the top right edge of the photograph. Notice the irregular type and placement of rocky rip-rap on the slope below the trail.
Figure 7. View southeast at another portion of the boulder rip-rap that is downstream of the above photo. Notice how this section has a more uniform cover of subrounded basalt boulders, while the upstream rip-rap is generally smaller and has mixed angular sandstone with some basalt and other rocks.
south alternative route
south alternative route
Kokopelli Section Riverfront Trail geotech report.docx Project #7131.74482.01 Page 9 of 32
erosion from runoff from I-70. One particular deeply incised channel appears to drain runoff from the north side of I-70 to this channel. Care will need to be taken to protect the trail from erosion in this area with armoring above and below the trail and taking this into account in the drainage plan. In addition to erosion caused by the flooding of the Colorado River, there is also the hazard of erosion and scour of the banks of both the Big Salt Wash and Reed Wash. The abutments for the bridges across those streams will need to be protected from scour at high flows so that the bridge foundations are not compromised. The following photograph shows evidence of erosion of the banks of Reed Wash, seen at the time of our drilling.
Grouted, large boulder rip-rap and other protection, as determine by the hydrology and hydraulics studies of both Big Salt Wash and Reed Wash, will be necessary for the long-term stability of the bridges that cross these drainages.
Flooding Roughly 60% of the proposed Kokopelli Section Trail is within the 100 year floodplain of the Colorado River, as seen on the following page (Figure 9), on the Federal Emergency Management Agency (FEMA) flood map available on the Mesa County GIS website. According to the FEMA map, this area is located in Zone AE, where flood elevations have been determined and are indicated on the map. A comparison of the mapped flood elevations (Figure 9) and the ground surface elevations (Table 1) at each of the 15 boreholes in this zone (Site Plan, Map 2) indicates inundation depths of the trail ranging from 2 feet to 9 feet, with most areas of the trail under 6-8 feet of water in a 100 year event. The greatest depths are in the vicinity of the Little and Big Salt Wash and the entire section in the WWRF property. It would be impractical to elevate the trail above these anticipated flood levels, so the trail will need to be protected from periodic flood events such as with edge placed rip-rap. The trail may therefore require maintenance and repair following high water events. Typical trail sections for
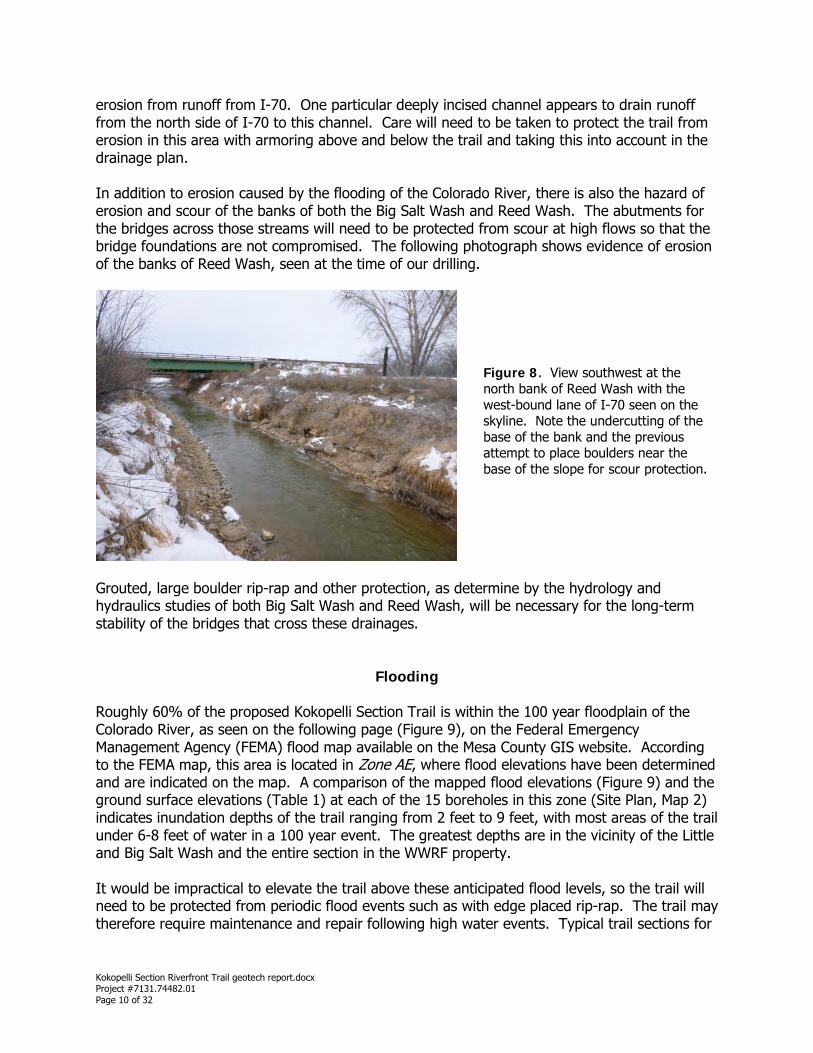
Figure 8. View southwest at the north bank of Reed Wash with the west-bound lane of I-70 seen on the skyline. Note the undercutting of the base of the bank and the previous attempt to place boulders near the base of the slope for scour protection.
Kokopelli Section Riverfront Trail geotech report.docx Project #7131.74482.01 Page 10 of 32
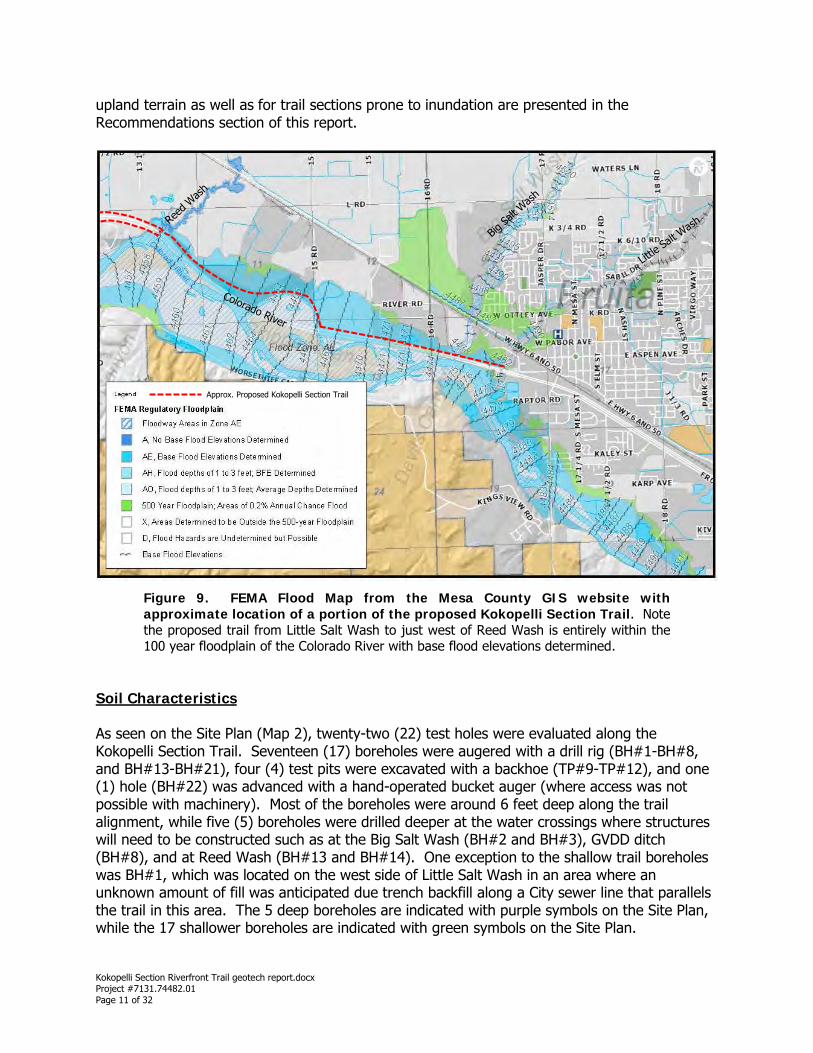
upland terrain as well as for trail sections prone to inundation are presented in the Recommendations section of this report.
Figure 9. FEMA Flood Map from the Mesa County GIS website with approximate location of a portion of the proposed Kokopelli Section Trail. Note the proposed trail from Little Salt Wash to just west of Reed Wash is entirely within the 100 year floodplain of the Colorado River with base flood elevations determined.
Soil Characteristics As seen on the Site Plan (Map 2), twenty-two (22) test holes were evaluated along the Kokopelli Section Trail. Seventeen (17) boreholes were augered with a drill rig (BH#1-BH#8, and BH#13-BH#21), four (4) test pits were excavated with a backhoe (TP#9-TP#12), and one (1) hole (BH#22) was advanced with a hand-operated bucket auger (where access was not possible with machinery). Most of the boreholes were around 6 feet deep along the trail alignment, while five (5) boreholes were drilled deeper at the water crossings where structures will need to be constructed such as at the Big Salt Wash (BH#2 and BH#3), GVDD ditch (BH#8), and at Reed Wash (BH#13 and BH#14). One exception to the shallow trail boreholes was BH#1, which was located on the west side of Little Salt Wash in an area where an unknown amount of fill was anticipated due trench backfill along a City sewer line that parallels the trail in this area. The 5 deep boreholes are indicated with purple symbols on the Site Plan, while the 17 shallower boreholes are indicated with green symbols on the Site Plan.
Approx. Proposed Kokopelli Section Trail
Kokopelli Section Riverfront Trail geotech report.docx Project #7131.74482.01 Page 11 of 32
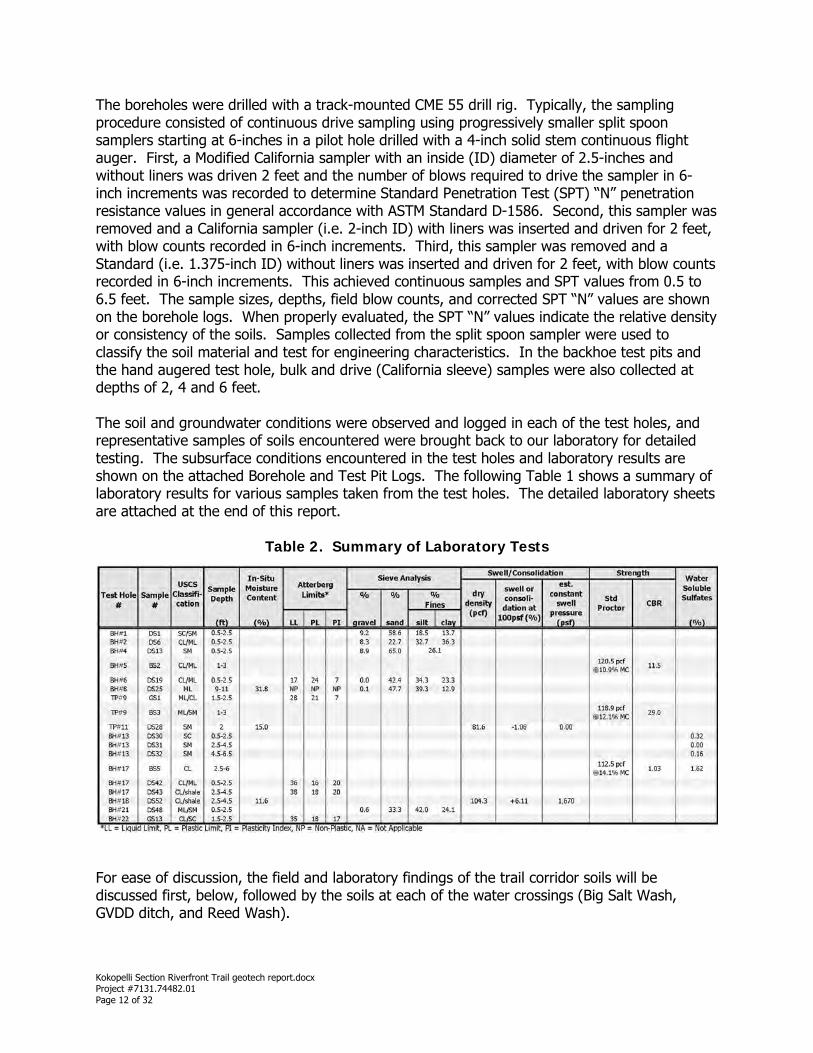
The boreholes were drilled with a track-mounted CME 55 drill rig. Typically, the sampling procedure consisted of continuous drive sampling using progressively smaller split spoon samplers starting at 6-inches in a pilot hole drilled with a 4-inch solid stem continuous flight auger. First, a Modified California sampler with an inside (ID) diameter of 2.5-inches and without liners was driven 2 feet and the number of blows required to drive the sampler in 6-inch increments was recorded to determine Standard Penetration Test (SPT) “N” penetration resistance values in general accordance with ASTM Standard D-1586. Second, this sampler was removed and a California sampler (i.e. 2-inch ID) with liners was inserted and driven for 2 feet, with blow counts recorded in 6-inch increments. Third, this sampler was removed and a Standard (i.e. 1.375-inch ID) without liners was inserted and driven for 2 feet, with blow counts recorded in 6-inch increments. This achieved continuous samples and SPT values from 0.5 to 6.5 feet. The sample sizes, depths, field blow counts, and corrected SPT “N” values are shown on the borehole logs. When properly evaluated, the SPT “N” values indicate the relative density or consistency of the soils. Samples collected from the split spoon sampler were used to classify the soil material and test for engineering characteristics. In the backhoe test pits and the hand augered test hole, bulk and drive (California sleeve) samples were also collected at depths of 2, 4 and 6 feet. The soil and groundwater conditions were observed and logged in each of the test holes, and representative samples of soils encountered were brought back to our laboratory for detailed testing. The subsurface conditions encountered in the test holes and laboratory results are shown on the attached Borehole and Test Pit Logs. The following Table 1 shows a summary of laboratory results for various samples taken from the test holes. The detailed laboratory sheets are attached at the end of this report.
Table 2. Summary of Laboratory Tests
For ease of discussion, the field and laboratory findings of the trail corridor soils will be discussed first, below, followed by the soils at each of the water crossings (Big Salt Wash, GVDD ditch, and Reed Wash).
Kokopelli Section Riverfront Trail geotech report.docx Project #7131.74482.01 Page 12 of 32
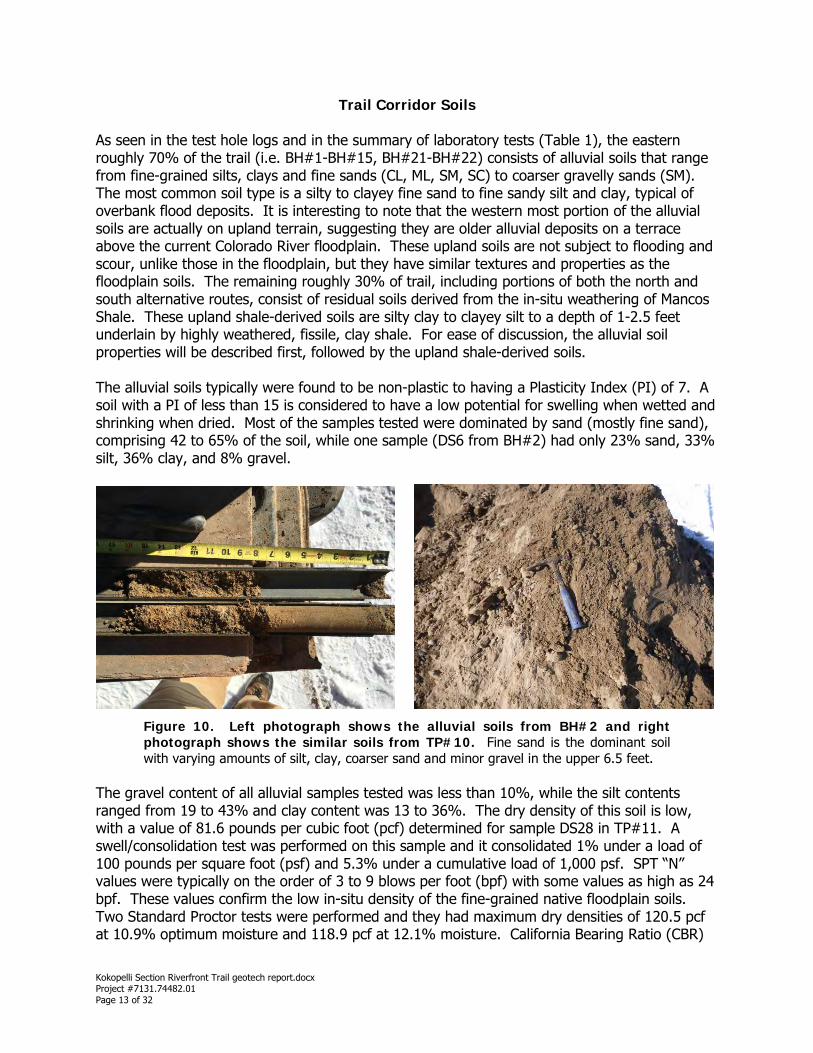
Trail Corridor Soils As seen in the test hole logs and in the summary of laboratory tests (Table 1), the eastern roughly 70% of the trail (i.e. BH#1-BH#15, BH#21-BH#22) consists of alluvial soils that range from fine-grained silts, clays and fine sands (CL, ML, SM, SC) to coarser gravelly sands (SM). The most common soil type is a silty to clayey fine sand to fine sandy silt and clay, typical of overbank flood deposits. It is interesting to note that the western most portion of the alluvial soils are actually on upland terrain, suggesting they are older alluvial deposits on a terrace above the current Colorado River floodplain. These upland soils are not subject to flooding and scour, unlike those in the floodplain, but they have similar textures and properties as the floodplain soils. The remaining roughly 30% of trail, including portions of both the north and south alternative routes, consist of residual soils derived from the in-situ weathering of Mancos Shale. These upland shale-derived soils are silty clay to clayey silt to a depth of 1-2.5 feet underlain by highly weathered, fissile, clay shale. For ease of discussion, the alluvial soil properties will be described first, followed by the upland shale-derived soils. The alluvial soils typically were found to be non-plastic to having a Plasticity Index (PI) of 7. A soil with a PI of less than 15 is considered to have a low potential for swelling when wetted and shrinking when dried. Most of the samples tested were dominated by sand (mostly fine sand), comprising 42 to 65% of the soil, while one sample (DS6 from BH#2) had only 23% sand, 33% silt, 36% clay, and 8% gravel.
Figure 10. Left photograph shows the alluvial soils from BH#2 and right photograph shows the similar soils from TP#10. Fine sand is the dominant soil with varying amounts of silt, clay, coarser sand and minor gravel in the upper 6.5 feet.
The gravel content of all alluvial samples tested was less than 10%, while the silt contents ranged from 19 to 43% and clay content was 13 to 36%. The dry density of this soil is low, with a value of 81.6 pounds per cubic foot (pcf) determined for sample DS28 in TP#11. A swell/consolidation test was performed on this sample and it consolidated 1% under a load of 100 pounds per square foot (psf) and 5.3% under a cumulative load of 1,000 psf. SPT “N” values were typically on the order of 3 to 9 blows per foot (bpf) with some values as high as 24 bpf. These values confirm the low in-situ density of the fine-grained native floodplain soils. Two Standard Proctor tests were performed and they had maximum dry densities of 120.5 pcf at 10.9% optimum moisture and 118.9 pcf at 12.1% moisture. California Bearing Ratio (CBR)
Kokopelli Section Riverfront Trail geotech report.docx Project #7131.74482.01 Page 13 of 32
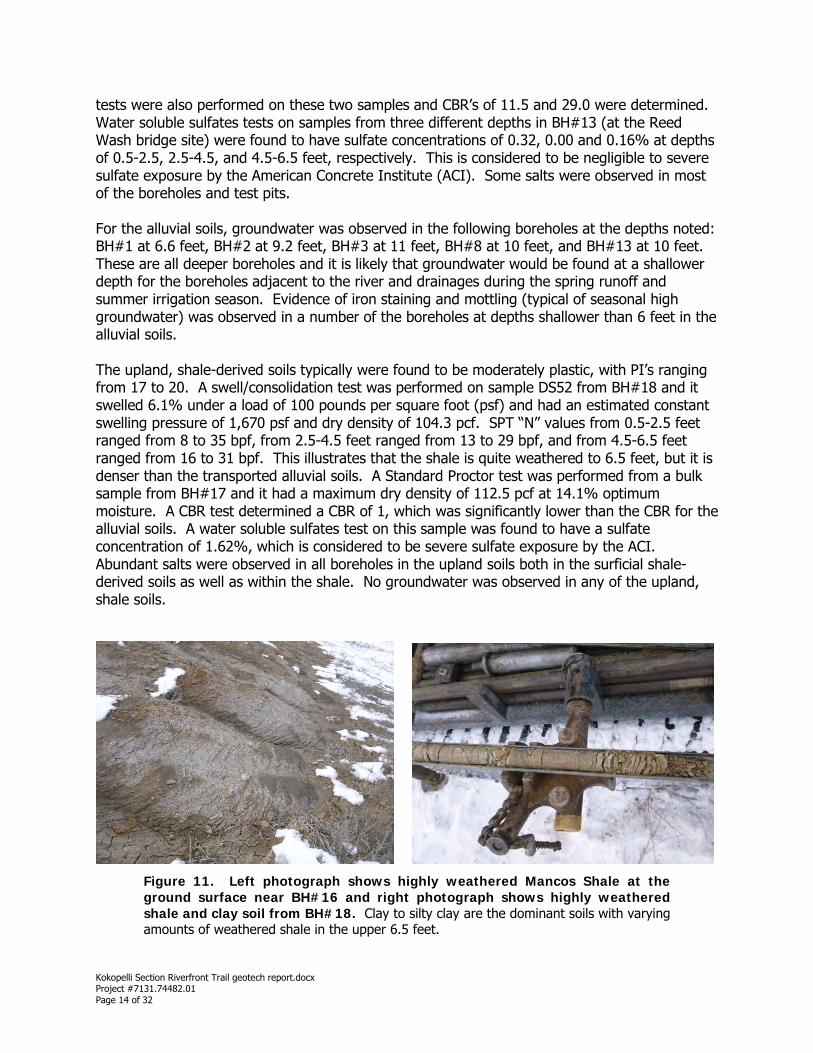
tests were also performed on these two samples and CBR’s of 11.5 and 29.0 were determined. Water soluble sulfates tests on samples from three different depths in BH#13 (at the Reed Wash bridge site) were found to have sulfate concentrations of 0.32, 0.00 and 0.16% at depths of 0.5-2.5, 2.5-4.5, and 4.5-6.5 feet, respectively. This is considered to be negligible to severe sulfate exposure by the American Concrete Institute (ACI). Some salts were observed in most of the boreholes and test pits. For the alluvial soils, groundwater was observed in the following boreholes at the depths noted: BH#1 at 6.6 feet, BH#2 at 9.2 feet, BH#3 at 11 feet, BH#8 at 10 feet, and BH#13 at 10 feet. These are all deeper boreholes and it is likely that groundwater would be found at a shallower depth for the boreholes adjacent to the river and drainages during the spring runoff and summer irrigation season. Evidence of iron staining and mottling (typical of seasonal high groundwater) was observed in a number of the boreholes at depths shallower than 6 feet in the alluvial soils. The upland, shale-derived soils typically were found to be moderately plastic, with PI’s ranging from 17 to 20. A swell/consolidation test was performed on sample DS52 from BH#18 and it swelled 6.1% under a load of 100 pounds per square foot (psf) and had an estimated constant swelling pressure of 1,670 psf and dry density of 104.3 pcf. SPT “N” values from 0.5-2.5 feet ranged from 8 to 35 bpf, from 2.5-4.5 feet ranged from 13 to 29 bpf, and from 4.5-6.5 feet ranged from 16 to 31 bpf. This illustrates that the shale is quite weathered to 6.5 feet, but it is denser than the transported alluvial soils. A Standard Proctor test was performed from a bulk sample from BH#17 and it had a maximum dry density of 112.5 pcf at 14.1% optimum moisture. A CBR test determined a CBR of 1, which was significantly lower than the CBR for the alluvial soils. A water soluble sulfates test on this sample was found to have a sulfate concentration of 1.62%, which is considered to be severe sulfate exposure by the ACI. Abundant salts were observed in all boreholes in the upland soils both in the surficial shale-derived soils as well as within the shale. No groundwater was observed in any of the upland, shale soils.
Figure 11. Left photograph shows highly weathered Mancos Shale at the ground surface near BH#16 and right photograph shows highly weathered shale and clay soil from BH#18. Clay to silty clay are the dominant soils with varying amounts of weathered shale in the upper 6.5 feet.
Kokopelli Section Riverfront Trail geotech report.docx Project #7131.74482.01 Page 14 of 32
In summary, the soils along the proposed trail corridor consist of several soil types that are variable in composition, color, physical and chemical properties. The field observations and laboratory testing indicates that the mostly silty to clayey fine sand alluvial soils and clay to silty clay upland shale-derived soils are non-plastic to moderately plastic, have moderately low to moderate density, and are both moderately compressible (alluvial soils) and have moderate swell potential (shale-derived upland soils). The alluvial soils generally have flooding and possibly shallow groundwater conditions, while the upland soils are dry and not subject to flooding or groundwater. All soils appear to be corrosive to concrete, so using some level of sulfate-resistant cement is recommended for corrosion protection of the concrete.
Bridge or Culvert Soils Field and laboratory findings at the three water crossing sites are presented below. Refer to Table 2 for a summary of laboratory testing performed on samples obtained at Big Salt Wash, GVDD Ditch and Reed Wash.
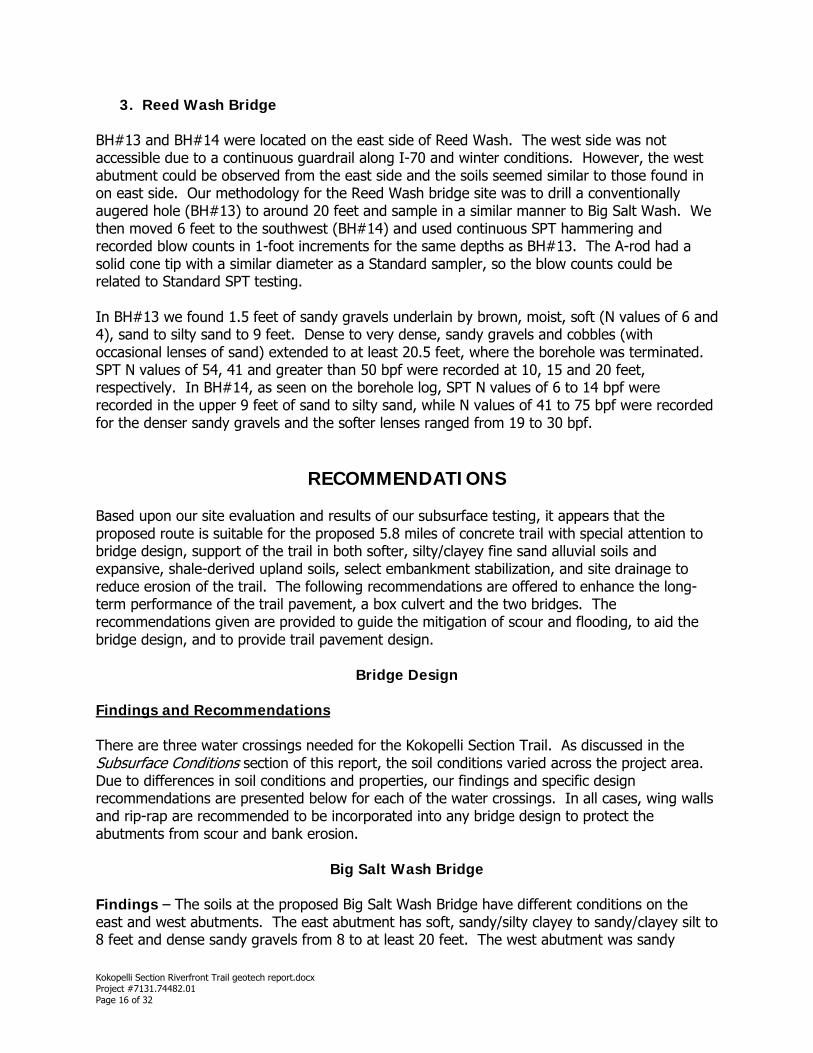
1. Big Salt Wash Bridge BH#2 was located on the east side of the Big Salt Wash and BH#3 was on the west side of the wash, in the approximate locations of the proposed abutments. On the east side we found brown, moist, sandy/silty clay to sandy/clayey silt with some gravels to 8 feet, where dense sandy gravels and cobbles were encountered. SPT N values of 6, 9 and 7 bpf were recorded in the upper 6 feet, while an N value of 38 was recorded in the gravels at 9.5-10.5 feet. A soil sample from 0.5-2.5 feet was composed of 8% gravel, 23% sand, 33% silt, and 36% clay. Although the borehole was augered to 19 feet, the hole caved to 10.4 feet upon removal of the drill stem; no samples were obtained of the deeper gravels. No bedrock was reached at 19 feet, the gravels were dense to very dense, and groundwater was measured at 9.2 feet. On the west side of the Big Salt Wash, dense sandy gravels and cobbles were encountered from near the surface for the entire depth to 14 feet. Refusal on a boulder occurred at 5 feet, so a twin hole was drilled within 3 feet of the initial hole and it advanced to 14, where another boulder caused refusal of the augering. The hole caved to 10 feet upon auger removal and groundwater was measured at 11 feet during drilling.
2. GVDD Ditch Box Culvert BH#8 was located on the east side of the GVDD return flow ditch. We found brown, moist, soft, fine sandy silt with some clay to 11.5 feet. SPT N values of 5, 5 and 3 bpf were recorded in the upper 6 feet and 6 bpf from 9.5-10.5 feet. From 11.5 to 19 feet were dense sandy gravels and cobbles. No bedrock was found to 19 feet and groundwater was measured at 10 feet. Caving to 9.4 feet prevented a sandy gravel sample, but a shallower sample from 9 to 11 feet was found to be non-plastic and was composed of <1% gravel, 48% sand (mostly fine sand), 39% silt, and 13% clay. Moisture content was high at 31.8% and this soil classified as an ML (fine sandy silt).
Kokopelli Section Riverfront Trail geotech report.docx Project #7131.74482.01 Page 15 of 32
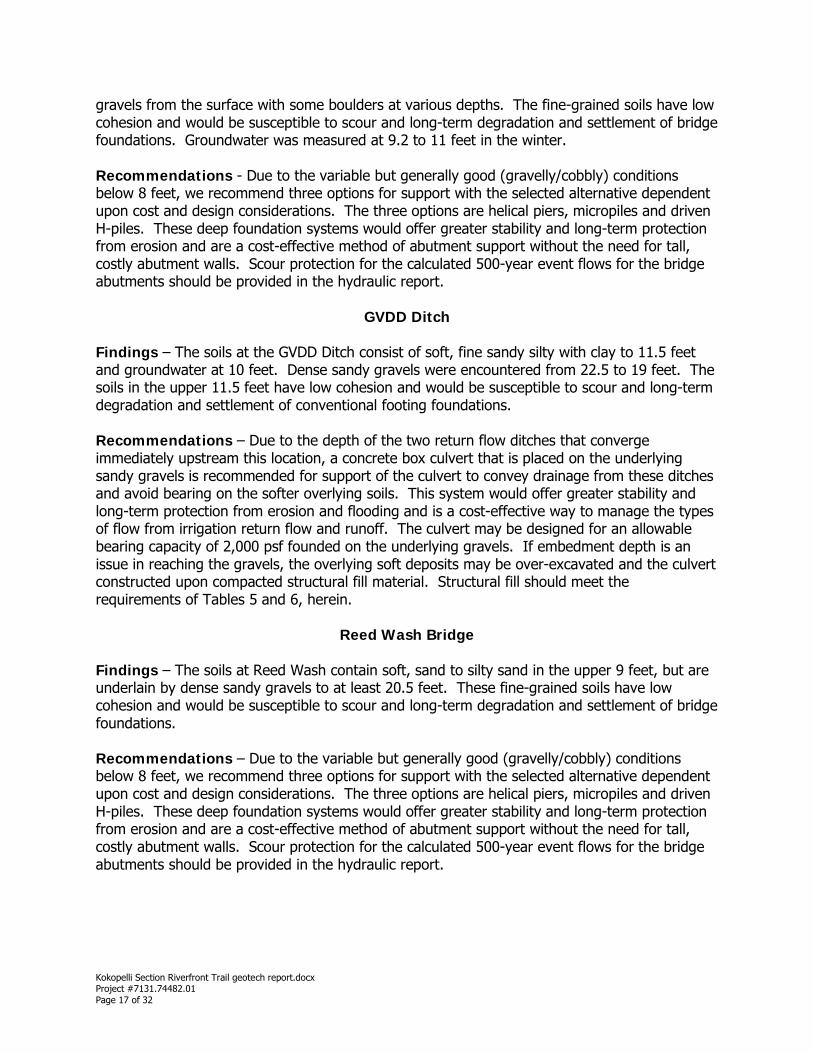
3. Reed Wash Bridge BH#13 and BH#14 were located on the east side of Reed Wash. The west side was not accessible due to a continuous guardrail along I-70 and winter conditions. However, the west abutment could be observed from the east side and the soils seemed similar to those found in on east side. Our methodology for the Reed Wash bridge site was to drill a conventionally augered hole (BH#13) to around 20 feet and sample in a similar manner to Big Salt Wash. We then moved 6 feet to the southwest (BH#14) and used continuous SPT hammering and recorded blow counts in 1-foot increments for the same depths as BH#13. The A-rod had a solid cone tip with a similar diameter as a Standard sampler, so the blow counts could be related to Standard SPT testing. In BH#13 we found 1.5 feet of sandy gravels underlain by brown, moist, soft (N values of 6 and 4), sand to silty sand to 9 feet. Dense to very dense, sandy gravels and cobbles (with occasional lenses of sand) extended to at least 20.5 feet, where the borehole was terminated. SPT N values of 54, 41 and greater than 50 bpf were recorded at 10, 15 and 20 feet, respectively. In BH#14, as seen on the borehole log, SPT N values of 6 to 14 bpf were recorded in the upper 9 feet of sand to silty sand, while N values of 41 to 75 bpf were recorded for the denser sandy gravels and the softer lenses ranged from 19 to 30 bpf.
RECOMMENDATIONS Based upon our site evaluation and results of our subsurface testing, it appears that the proposed route is suitable for the proposed 5.8 miles of concrete trail with special attention to bridge design, support of the trail in both softer, silty/clayey fine sand alluvial soils and expansive, shale-derived upland soils, select embankment stabilization, and site drainage to reduce erosion of the trail. The following recommendations are offered to enhance the long-term performance of the trail pavement, a box culvert and the two bridges. The recommendations given are provided to guide the mitigation of scour and flooding, to aid the bridge design, and to provide trail pavement design.
Bridge Design Findings and Recommendations There are three water crossings needed for the Kokopelli Section Trail. As discussed in the Subsurface Conditions section of this report, the soil conditions varied across the project area. Due to differences in soil conditions and properties, our findings and specific design recommendations are presented below for each of the water crossings. In all cases, wing walls and rip-rap are recommended to be incorporated into any bridge design to protect the abutments from scour and bank erosion.
Big Salt Wash Bridge Findings – The soils at the proposed Big Salt Wash Bridge have different conditions on the east and west abutments. The east abutment has soft, sandy/silty clayey to sandy/clayey silt to 8 feet and dense sandy gravels from 8 to at least 20 feet. The west abutment was sandy
Kokopelli Section Riverfront Trail geotech report.docx Project #7131.74482.01 Page 16 of 32
gravels from the surface with some boulders at various depths. The fine-grained soils have low cohesion and would be susceptible to scour and long-term degradation and settlement of bridge foundations. Groundwater was measured at 9.2 to 11 feet in the winter. Recommendations - Due to the variable but generally good (gravelly/cobbly) conditions below 8 feet, we recommend three options for support with the selected alternative dependent upon cost and design considerations. The three options are helical piers, micropiles and driven H-piles. These deep foundation systems would offer greater stability and long-term protection from erosion and are a cost-effective method of abutment support without the need for tall, costly abutment walls. Scour protection for the calculated 500-year event flows for the bridge abutments should be provided in the hydraulic report.
GVDD Ditch Findings – The soils at the GVDD Ditch consist of soft, fine sandy silty with clay to 11.5 feet and groundwater at 10 feet. Dense sandy gravels were encountered from 22.5 to 19 feet. The soils in the upper 11.5 feet have low cohesion and would be susceptible to scour and long-term degradation and settlement of conventional footing foundations. Recommendations – Due to the depth of the two return flow ditches that converge immediately upstream this location, a concrete box culvert that is placed on the underlying sandy gravels is recommended for support of the culvert to convey drainage from these ditches and avoid bearing on the softer overlying soils. This system would offer greater stability and long-term protection from erosion and flooding and is a cost-effective way to manage the types of flow from irrigation return flow and runoff. The culvert may be designed for an allowable bearing capacity of 2,000 psf founded on the underlying gravels. If embedment depth is an issue in reaching the gravels, the overlying soft deposits may be over-excavated and the culvert constructed upon compacted structural fill material. Structural fill should meet the requirements of Tables 5 and 6, herein.
Reed Wash Bridge Findings – The soils at Reed Wash contain soft, sand to silty sand in the upper 9 feet, but are underlain by dense sandy gravels to at least 20.5 feet. These fine-grained soils have low cohesion and would be susceptible to scour and long-term degradation and settlement of bridge foundations. Recommendations – Due to the variable but generally good (gravelly/cobbly) conditions below 8 feet, we recommend three options for support with the selected alternative dependent upon cost and design considerations. The three options are helical piers, micropiles and driven H-piles. These deep foundation systems would offer greater stability and long-term protection from erosion and are a cost-effective method of abutment support without the need for tall, costly abutment walls. Scour protection for the calculated 500-year event flows for the bridge abutments should be provided in the hydraulic report.
Kokopelli Section Riverfront Trail geotech report.docx Project #7131.74482.01 Page 17 of 32
Bridge Foundation Options
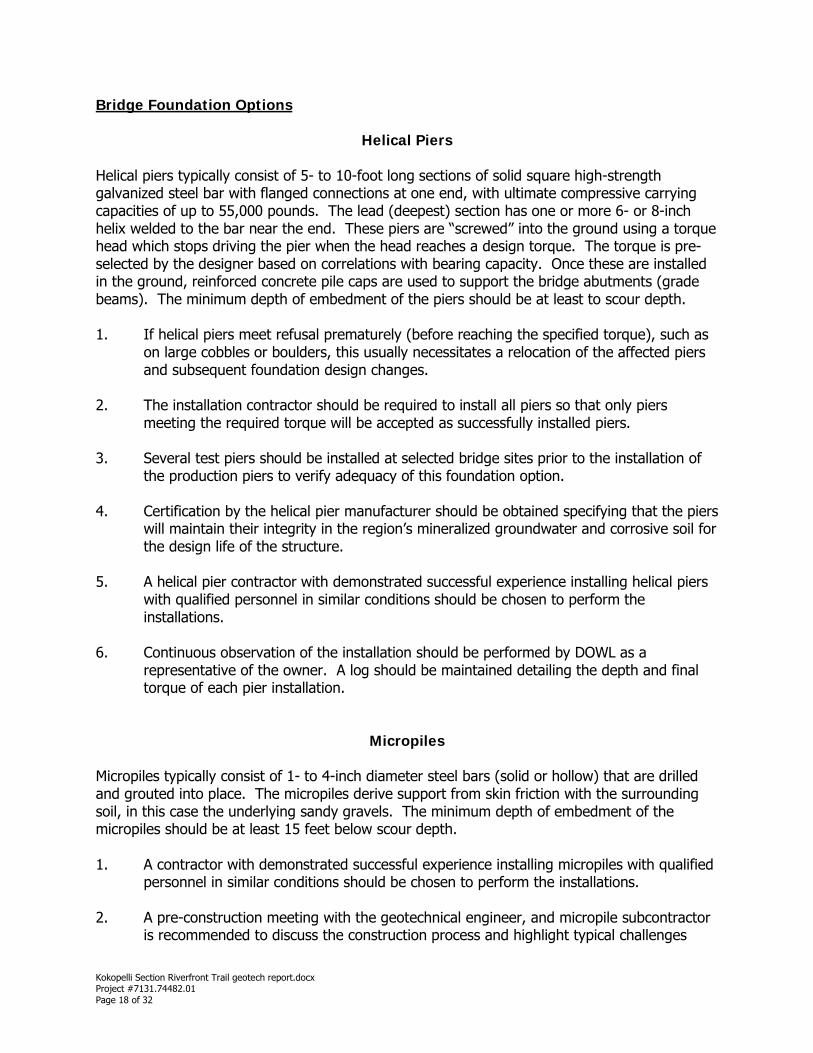
Helical Piers Helical piers typically consist of 5- to 10-foot long sections of solid square high-strength galvanized steel bar with flanged connections at one end, with ultimate compressive carrying capacities of up to 55,000 pounds. The lead (deepest) section has one or more 6- or 8-inch helix welded to the bar near the end. These piers are “screwed” into the ground using a torque head which stops driving the pier when the head reaches a design torque. The torque is pre-selected by the designer based on correlations with bearing capacity. Once these are installed in the ground, reinforced concrete pile caps are used to support the bridge abutments (grade beams). The minimum depth of embedment of the piers should be at least to scour depth. 1. If helical piers meet refusal prematurely (before reaching the specified torque), such as
on large cobbles or boulders, this usually necessitates a relocation of the affected piers and subsequent foundation design changes.
2. The installation contractor should be required to install all piers so that only piers meeting the required torque will be accepted as successfully installed piers.
3. Several test piers should be installed at selected bridge sites prior to the installation of the production piers to verify adequacy of this foundation option.
4. Certification by the helical pier manufacturer should be obtained specifying that the piers will maintain their integrity in the region’s mineralized groundwater and corrosive soil for the design life of the structure.
5. A helical pier contractor with demonstrated successful experience installing helical piers with qualified personnel in similar conditions should be chosen to perform the installations.
6. Continuous observation of the installation should be performed by DOWL as a representative of the owner. A log should be maintained detailing the depth and final torque of each pier installation.
Micropiles Micropiles typically consist of 1- to 4-inch diameter steel bars (solid or hollow) that are drilled and grouted into place. The micropiles derive support from skin friction with the surrounding soil, in this case the underlying sandy gravels. The minimum depth of embedment of the micropiles should be at least 15 feet below scour depth. 1. A contractor with demonstrated successful experience installing micropiles with qualified
personnel in similar conditions should be chosen to perform the installations.
2. A pre-construction meeting with the geotechnical engineer, and micropile subcontractor is recommended to discuss the construction process and highlight typical challenges
Kokopelli Section Riverfront Trail geotech report.docx Project #7131.74482.01 Page 18 of 32
relating to micropile installations. Ideally, this meeting should be carried out at least one week prior to commencement of drilling to ensure the proper equipment is brought to the site.
3. The preliminary design criteria given herein must be verified by a minimum of two sacrificial verification tests at each bridge site conducted in advance of production installation. The bridge designer should select final allowable bond value (factor of safety) based upon the results of testing and structural considerations.
4. For preliminary design considerations, an allowable ground to grout bond stress of 25 psi may be used for compressive resistance of the micropiles for embedment into the underlying sandy gravels. The upper ten feet of each pile should not be credited with any capacity for bearing foundation loads because of the generally weak condition of these soils and/or their shrink/swell potential. Preferably, piles should be spaced at least 3 feet apart center to center.
5. The micropiles may be subject to uplift from the expansive soil at the Reed Wash
crossing only. Micropile design should consider the uplift skin friction to be 5 psi acting on the upper 10 feet of the micropiles. Resistance to uplift pressure should be accounted for in the design so that micropiles and superstructures are not subject to post-construction heave.
6. Continuous observation of the installation should be performed by DOWL as a
representative of the owner. A log should be maintained documenting the installation of each micropile.
H-Piles
Based on our experience with local subsurface conditions, the depth to underlying shale bedrock may be on the order of 30 to 45 feet at the trail’s proposed bridge sites. Depending on the hydraulics and hydrology studies for Big Salt Wash and Reed Wash, where the depth of scour and flood depths will be determined, the depth of embedment of the piles should penetrate into the dense sandy gravels at least 15 feet below scour depth, 10 feet into the gravels or to refusal, whichever comes first. Post-construction movement of less than ¼-inch is anticipated with this foundation system. Design parameters and recommendations for driven pile foundation systems are outlined below. 1. We recommend a pre-construction meeting with the geotechnical engineer, foundation
engineer, contractor, and pile driving subcontractor to discuss the construction process and highlight typical challenges on driven pile installations.
2. Because of their ready availability, steel H-Piles ranging in size from 8X36 to 12X53 may be considered for support and can provide nominal axial end-bearing capacities on the order of 250 to 400 kips.
3. Piles should be driven to “virtual refusal” in the dense sandy gravels, defined as 3 or
more consistent sets of a defined blow count per unit penetration, or a minimum of 10
Kokopelli Section Riverfront Trail geotech report.docx Project #7131.74482.01 Page 19 of 32

feet embedment in the sandy gravels, whichever comes first. If this option is selected, DOWL can define refusal criteria, in terms of blows per inch of penetration, once the pile driving contractor has been selected and his hammer energy and stroke criteria are available for evaluation. The hammer and cushion should match the pile type to obtain the proper load capacity during driving. Appropriate recommendations on tip reinforcement, if needed, will also be provided. A Pile Driving Analyzer (PDA) should be used to establish field pile driving criteria. We recommend a resistance factor of 0.65 applied to the nominal axial capacities computed by the structural engineer for this purpose. A CAPWAP analysis should be performed to establish final pile capacity.
4. Pile spacing should be a minimum of 36 inches center to center (horizontally) and 50
inches center to center (diagonally) for axially loaded piles and 11 feet center to center (horizontally or diagonally) for laterally-loaded piles.
5. Piles damaged prior to, during, or after installation should not be used. 6. A piling contractor with demonstrated successful experience driving similar piles with
qualified personnel in similar conditions should be chosen to perform the pile installations.
7. Observation of the pile installation operations should be performed by a representative
of the COF. A log should be maintained on the number of blows per foot required to seat each pile. This observation will aid in attaining an adequate foundation system and any abnormal subsurface condition encountered during foundation installation can be identified and corrective measures taken, as required.
Bridge Seismic Design Criteria In accordance with the 2009 AASHTO Guide Specifications for LRFD Seismic Bridge Design and our knowledge of the site, this site may be designated as Site Class D. This classification is based on limited shallow exploratory data and is based on the predominant soil condition near the surface. The Peak Ground Acceleration (PGA) is 0.075g. The mapped spectral response acceleration at short periods (0.2 second, Ss) is 0.158g and at one second (S1) is 0.039g. These values are derived from data from the USGS National Seismic Hazard Mapping Project based on the average latitude and longitude coordinates for the trail.
Trail Pavement Section Design Per CDOT requirements, the minimum concrete thickness for this application is 6 inches. Therefore, we used assumed traffic equivalent data and the weakest CBR value tested of 1.0 to evaluate the suitability of a 6 inch concrete pavement supported on a 6 inch thick compacted CDOT Class 6 roadbase. Our pavement design recommendations are generally based on the process as outlined in the CDOT 2016 Pavement Design Manual for the paved section of the trail.
Kokopelli Section Riverfront Trail geotech report.docx Project #7131.74482.01 Page 20 of 32
ESAL Calculation for Mixed-Use Trail Due to the limited vehicular traffic anticipated for the mixed-use trail, traditional traffic counts and trip estimation from the Institute of Transportation Engineers (ITE) were not used in estimating the Equivalent Single Axle Loads (ESAL’s) for the pavement section. A 30-year pavement life was assumed for the design. An average of 1 daily trip by a pickup truck for trail inspection and maintenance was used for ESAL calculation. Additionally, we estimated that 1 single axle truck, such as an ambulance, would drive on the trail per month. The two vehicle classifications were multiplied by the appropriate Colorado Equivalency Factors from CDOT Table 1.1 to obtain a total daily ESAL count. That result is: 1 passenger car/pickup truck ADT x 0.003 = 0.003 1 single axle truck per month = 12/365 x 0.249 = 0.008 The daily ESAL total of 0.003 + 0.008 = 0.011 was then multiplied by 365 days per year and by 30 years (design life per CDOT design standards) to get the total number of 18-kip ESAL’s. That total is: 0.011 x 365 x 30 =120.45 18-Kip Total ESAL’s. The ESAL count was conservatively rounded to 5,000 18-kip ESAL’s for design purposes. Soil Sample Classification The CBR value for the weakest subgrade found during our exploration was 1.0 in the clay soils beneath the westerly 25 percent of the trail. This CBR value was used to conservatively calculate the Resilient Modulus (MR) of the site soils using CDOT equation 2.1 which states: MR = CBR x 1,500 = 1.0 x 1,500 = 1,500 psi Subgrade Support Characteristics Table 4 below summarizes the typical subgrade support characteristics for the soils encountered. Assumptions for choosing the subgrade characteristics listed in Table 3 are: (a) The pavement structures on site will be exposed to moisture levels approaching saturation more than 25% of the time and that these areas of potential saturation will be have a “good” quality of drainage. Therefore a CDOT recommended drainage coefficient of m1 = 0.7 was used. (b) A reliability factor of 75% was assumed since this is not a commercial pavement design. CDOT’s Table 1.3 – Reliability (Risk) recommends a range of reliability of 50-85% for roads. However, 75% reliability was used to represent an acceptable long-term service life. (c) A standard normal deviate (ZR) of -0.674 and a standard deviation of 0.34, as required by CDOT for all designs, was used. (d) Per CDOT recommendations, initial and terminal Serviceability Indices were assumed to be 4.5 and 2.5 respectively, thus a Design Serviceability Loss (ΔPSI) of 2.0 was calculated by subtracting the terminal serviceability index from the initial serviceability index.
Kokopelli Section Riverfront Trail geotech report.docx Project #7131.74482.01 Page 21 of 32
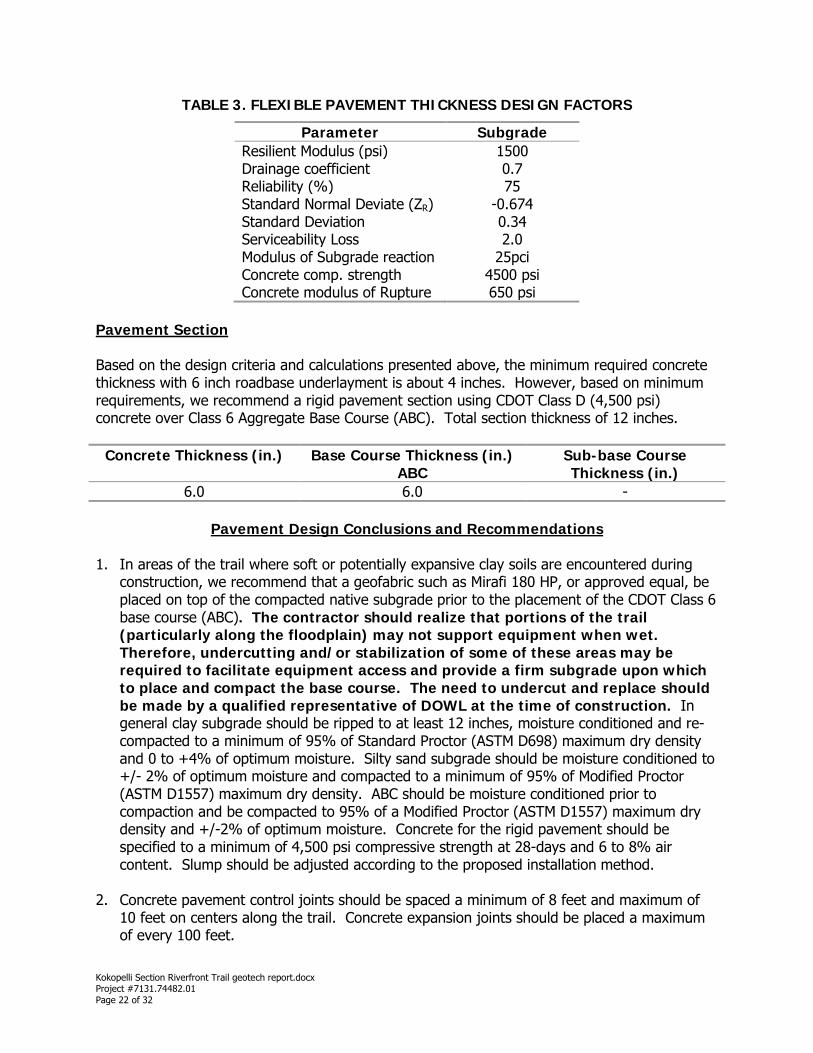
TABLE 3. FLEXIBLE PAVEMENT THICKNESS DESIGN FACTORS
Parameter Subgrade Resilient Modulus (psi) 1500 Drainage coefficient 0.7 Reliability (%) 75 Standard Normal Deviate (ZR) -0.674 Standard Deviation 0.34 Serviceability Loss 2.0 Modulus of Subgrade reaction Concrete comp. strength
25pci 4500 psi
Concrete modulus of Rupture 650 psi Pavement Section Based on the design criteria and calculations presented above, the minimum required concrete thickness with 6 inch roadbase underlayment is about 4 inches. However, based on minimum requirements, we recommend a rigid pavement section using CDOT Class D (4,500 psi) concrete over Class 6 Aggregate Base Course (ABC). Total section thickness of 12 inches.
Concrete Thickness (in.) Base Course Thickness (in.) ABC
Sub-base Course Thickness (in.)
6.0 6.0 -
Pavement Design Conclusions and Recommendations 1. In areas of the trail where soft or potentially expansive clay soils are encountered during
construction, we recommend that a geofabric such as Mirafi 180 HP, or approved equal, be placed on top of the compacted native subgrade prior to the placement of the CDOT Class 6 base course (ABC). The contractor should realize that portions of the trail (particularly along the floodplain) may not support equipment when wet. Therefore, undercutting and/or stabilization of some of these areas may be required to facilitate equipment access and provide a firm subgrade upon which to place and compact the base course. The need to undercut and replace should be made by a qualified representative of DOWL at the time of construction. In general clay subgrade should be ripped to at least 12 inches, moisture conditioned and re-compacted to a minimum of 95% of Standard Proctor (ASTM D698) maximum dry density and 0 to +4% of optimum moisture. Silty sand subgrade should be moisture conditioned to +/- 2% of optimum moisture and compacted to a minimum of 95% of Modified Proctor (ASTM D1557) maximum dry density. ABC should be moisture conditioned prior to compaction and be compacted to 95% of a Modified Proctor (ASTM D1557) maximum dry density and +/-2% of optimum moisture. Concrete for the rigid pavement should be specified to a minimum of 4,500 psi compressive strength at 28-days and 6 to 8% air content. Slump should be adjusted according to the proposed installation method.
2. Concrete pavement control joints should be spaced a minimum of 8 feet and maximum of 10 feet on centers along the trail. Concrete expansion joints should be placed a maximum of every 100 feet.
Kokopelli Section Riverfront Trail geotech report.docx Project #7131.74482.01 Page 22 of 32
3. Design and construction of the trail should promote drainage away from the concrete pavement. Where needed, sub-drains and/or drain pans should be installed to keep water from standing on or adjacent to the concrete surface. Adequate drainage is critical due to the presence of potentially expansive soils along the westerly portion of the trail. I f adequate drainage cannot be provided, concrete pavement should not be used at this site.
4. All paving construction activities should be monitored and tested by a competent
civil/geotechnical engineering firm for compliance with the recommendations contained in this report and with the specifications in the latest edition of the CDOT Standards and Specifications for Roads and Bridges (2011) or Mesa County Standards, whichever is more stringent.
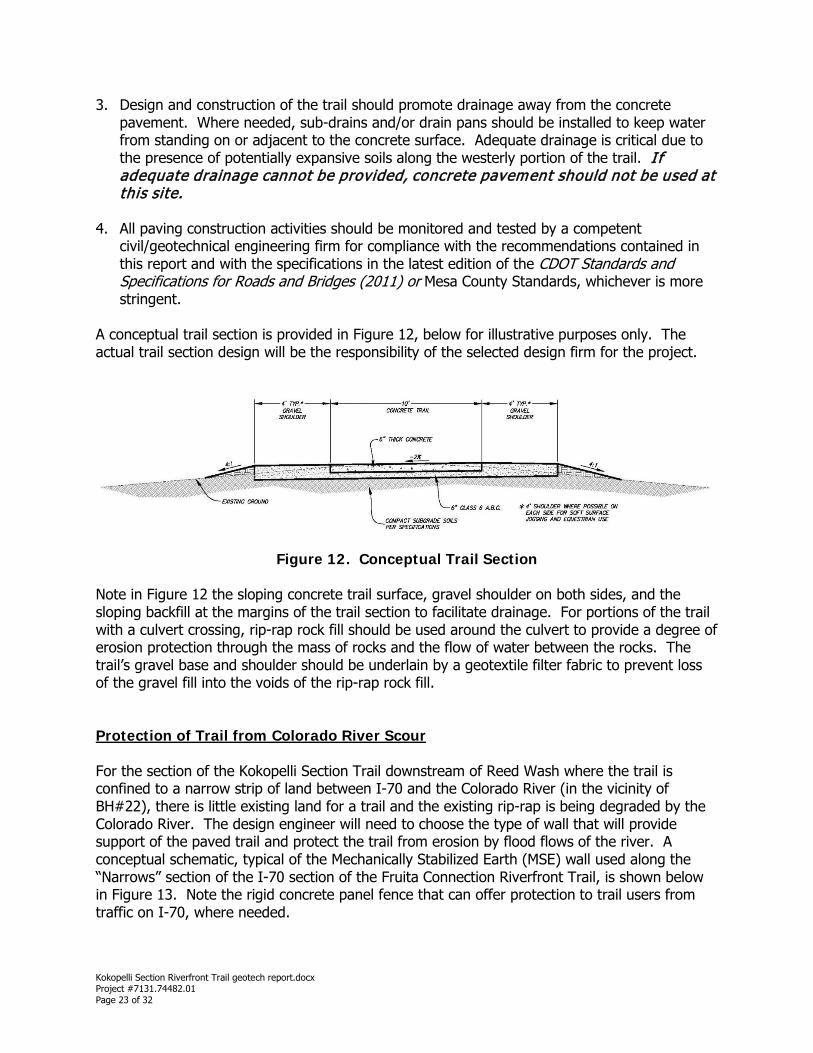
A conceptual trail section is provided in Figure 12, below for illustrative purposes only. The actual trail section design will be the responsibility of the selected design firm for the project.
Figure 12. Conceptual Trail Section Note in Figure 12 the sloping concrete trail surface, gravel shoulder on both sides, and the sloping backfill at the margins of the trail section to facilitate drainage. For portions of the trail with a culvert crossing, rip-rap rock fill should be used around the culvert to provide a degree of erosion protection through the mass of rocks and the flow of water between the rocks. The trail’s gravel base and shoulder should be underlain by a geotextile filter fabric to prevent loss of the gravel fill into the voids of the rip-rap rock fill. Protection of Trail from Colorado River Scour For the section of the Kokopelli Section Trail downstream of Reed Wash where the trail is confined to a narrow strip of land between I-70 and the Colorado River (in the vicinity of BH#22), there is little existing land for a trail and the existing rip-rap is being degraded by the Colorado River. The design engineer will need to choose the type of wall that will provide support of the paved trail and protect the trail from erosion by flood flows of the river. A conceptual schematic, typical of the Mechanically Stabilized Earth (MSE) wall used along the “Narrows” section of the I-70 section of the Fruita Connection Riverfront Trail, is shown below in Figure 13. Note the rigid concrete panel fence that can offer protection to trail users from traffic on I-70, where needed.
Kokopelli Section Riverfront Trail geotech report.docx Project #7131.74482.01 Page 23 of 32
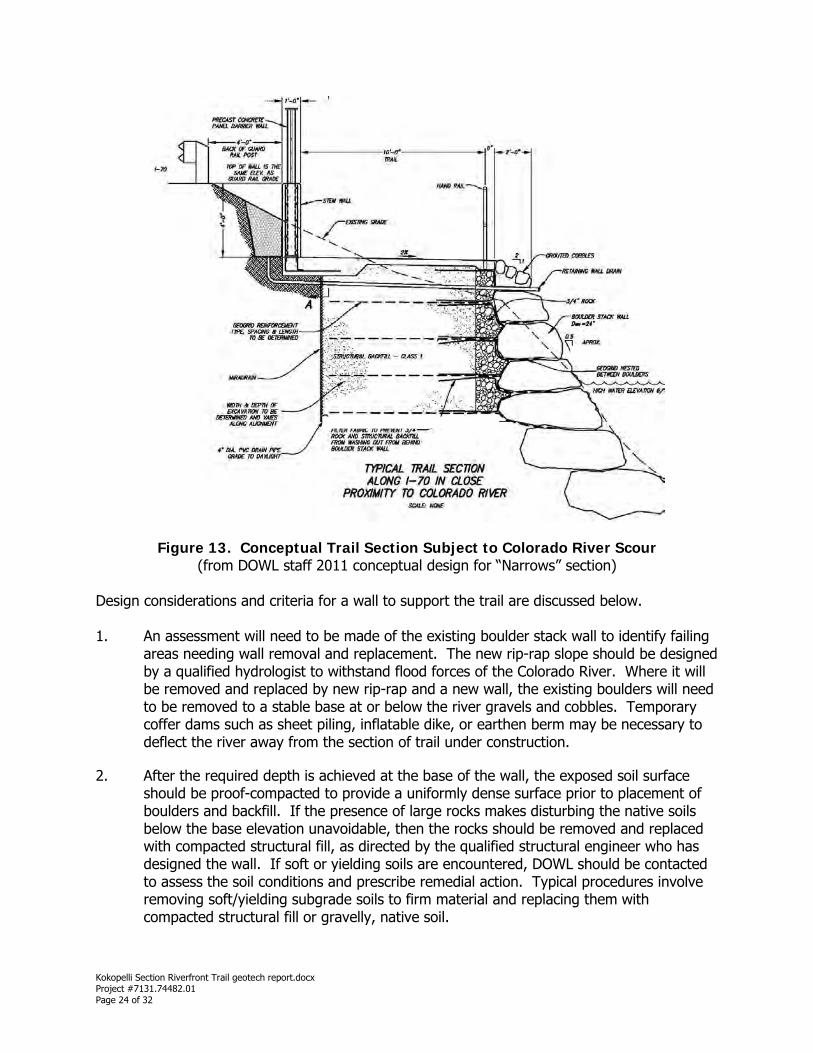
Figure 13. Conceptual Trail Section Subject to Colorado River Scour (from DOWL staff 2011 conceptual design for “Narrows” section)
Design considerations and criteria for a wall to support the trail are discussed below. 1. An assessment will need to be made of the existing boulder stack wall to identify failing
areas needing wall removal and replacement. The new rip-rap slope should be designed by a qualified hydrologist to withstand flood forces of the Colorado River. Where it will be removed and replaced by new rip-rap and a new wall, the existing boulders will need to be removed to a stable base at or below the river gravels and cobbles. Temporary coffer dams such as sheet piling, inflatable dike, or earthen berm may be necessary to deflect the river away from the section of trail under construction.
2. After the required depth is achieved at the base of the wall, the exposed soil surface should be proof-compacted to provide a uniformly dense surface prior to placement of boulders and backfill. If the presence of large rocks makes disturbing the native soils below the base elevation unavoidable, then the rocks should be removed and replaced with compacted structural fill, as directed by the qualified structural engineer who has designed the wall. If soft or yielding soils are encountered, DOWL should be contacted to assess the soil conditions and prescribe remedial action. Typical procedures involve removing soft/yielding subgrade soils to firm material and replacing them with compacted structural fill or gravelly, native soil.
Kokopelli Section Riverfront Trail geotech report.docx Project #7131.74482.01 Page 24 of 32
3. Once the excavation is exposed, a representative of DOWL must be called out to verify the nature and density of the wall excavations, to ensure that uniform soil conditions are present and to confirm that our recommendations are consistent with actual conditions. If we do not verify the soil conditions, DOWL cannot be held responsible for recommendations that may be inconsistent with actual conditions.
4. The wall design engineer should specify the nature of the fill and its’ compaction behind the wall. If an MSE wall is used, the geogrid should be nested between the boulders to provide anchoring. Filter fabric should be used to prevent rock, placed between the backfill and the boulders, from washing out from behind the new boulder stack wall.
5. If a protection panel or fence is used, as shown on Figure 13, a retaining wall drain should be installed near the top of the wall to drain the stemwall that supports the panel fence (between the trail and I-70) and retains the soil uphill of the trail adjacent to the guardrail.
6. The retaining wall and rockery should be designed using the following soil parameters.
Foundation Soil Unit weight (pcf) 125 Internal angle of friction (Ø) 32° Cohesion (psf) 0 Allowable bearing capacity (psf) 1,000^
^water table may affect bearing capacity Reinforced Structural Fill Soil Unit weight (pcf) 135 Internal angle of friction (Ø) 35° Retained Native Soil Unit weight (pcf) 120 Internal angle of friction (Ø) 30° Surcharge load (psf) as determined by design engineer Lateral Earth Pressures from native soil
Active Earth Pressure 60 pcf* Passive Earth Pressure 250 pcf* At-Rest Earth Pressure 80 pcf* Unit weight of soil 120 pcf** Coefficient of Friction 0.30 ***
*pounds per cubic foot (fluid equivalent) **pounds per cubic foot ***concrete on dry soil conditions
7. Reinforced backfill and retained soil/fill materials should be free of excess moisture, roots, organic matter, sod, snow, frozen soil, or other deleterious materials. Reinforced backfill materials which do not meet these criteria should be considered unsuitable and shall be removed. Fill should not be frozen when placed.
Kokopelli Section Riverfront Trail geotech report.docx Project #7131.74482.01 Page 25 of 32
Retaining Structures It is possible that a retaining structure may be needed for the slope adjacent to the proposed trail in the vicinity of the I-70 off-ramp at the Loma exit. Also, for the design of the box culvert and wing walls, we offer the following recommendations. 1. Walls acting to restrain soil should be designed using the lateral earth pressures given in
Table 4 below. These values assume a level backslope (slope behind the walls) or outboard slope (slope below the toe of wall), no hydraulic pressures behind the wall, the use of “free-draining” native soil or structural fill, and no surcharge loads applied within the backslope zone. Native soils are assumed to be predominantly clays/shales soils and are not recommended for backfill due to their low permeability and swell potential. Earth pressure values are provided for native clays/shales in case their use is unavoidable. We should be contacted to recommend modified lateral earth pressure values for increased backslope angles, decreased outboard slope angles or loading within the backslope zone.
Table 4. Lateral Earth Pressures
Native Clay Structural Fill Active Earth Pressure 125 pcf* 34 pcf* Passive Earth Pressure 200 pcf* 400 pcf* At-Rest Earth Pressure 125 pcf* 54 pcf* Unit weight of soil 120 pcf** 120 pcf** Coefficient of Friction 0.30 *** 0.32 ***
* pounds per cubic foot (fluid equivalent) ** pounds per cubic foot *** concrete on dry soil conditions
2. The retaining walls should have provisions for drainage so that hydrostatic pressures are
relieved. This is usually accomplished by providing free-draining granular backfill between the wall and retained soil, with a collection drain provided at the bottom of this granular zone, and/or the use of weep holes through the face of the wall. The drain system should be continuous and have a positive outfall which releases the collected water well away from the wall in a manner that minimizes the erosive energy of concentrated flow. The design engineer should ensure that drainage design is compatible with design assumptions.
3. Excavations for retaining and foundation walls should be laid back a minimum of 35°
from the vertical prior to backfilling against retaining structures. For safety, excavations should also be in accordance with OSHA Regulations 29 CFR 1926. Consequently, gentler excavation faces may be required.
4. Fill material placed behind the walls should consist of free-draining granular material (specified below) compacted as per the design engineer’s specifications. Native soil should not be used as backfill due to the predominance of fines and their expansive qualities unless footings need to be supported within the retaining wall backfill zone. If this is the case, DOWL should be consulted for additional recommendations.
Kokopelli Section Riverfront Trail geotech report.docx Project #7131.74482.01 Page 26 of 32
5. Compaction of 85 to 90% of Standard Proctor maximum dry density is typically used to minimize post-construction settlement of the backfill. Over-compaction of the backfill should be avoided so that excessive pressures are not placed against the retaining wall. Unless expressly approved by the design engineer, only hand-operated light-duty compaction equipment should be used within three feet of the wall. The upper one foot of backfill should consist of clayey (i.e., less permeable) soil to create a barrier against infiltration of surface runoff. Flatwork and other improvements supported on the lightly compacted backfill will likely settle over time. Such improvements should be designed to accommodate such settlement or be founded through the backfill on native undisturbed soils.
6. All concrete used for retaining structures at this site in contact with native soil should
comply with the recommendations in the Concrete Section of these recommendations. Site Preparation and Grading 1. The section of the trail from Little Salt Wash to 16 Road is underlain by an approximate
10 foot deep sewerline. Our boring BH#1 indicates that the backfill within this sewerline excavation was not compacted at depth. With normal water table fluctuations and normal consolidation, we would expect future settlement of these backfill soils that may adversely affect the trail pavement. We therefore recommend that the trail be located as far as possible from the sewer centerline and that the possible settlement influence from the sewerline trench excavation be assessed at that time. Undercutting to firm material followed by replacement and compaction of the backfill in controlled lifts to a minimum of 95% of modified proctor maximum dry density (ASTM D1557) is recommended below the trail footprint and extending 10 feet beyond its edge in any direction.
2. The site drainage and grading plans associated with the trail design should ensure that the construction does not impede natural drainage patterns. Surface water should be directed away from the trail both during and after completion of construction. Drainage plans should ensure that precipitation, snowmelt, and runoff are conveyed around and away from the trail and bridges. This runoff should be dispersed (not concentrated) in a manner consistent with the natural, pre-construction drainage pattern.
3. Final grading around the perimeter of the trail should drop at least one foot of drop within the first 10 feet of horizontal distance. Concrete flatwork adjacent to the trail should slope away at a grade of at least ¼-inch per foot.
4. Development should utilize "best practices" for design and construction so that on-site erosion is minimized. This may include selective thinning of vegetation, construction of temporary diversion ditches, silt fencing, and/or dust suppression. Because the cumulative area of disturbance exceeds one acre, on-site erosion management should be planned and executed in conformance with Colorado Department of Public Health and Environment (Water Quality Control Division) stormwater discharge regulations. The local building official will be able to provide specific details regarding these requirements. Fill needed on sloped areas should be placed on benched keyways to allow adequate placement and compaction of fill material.
Kokopelli Section Riverfront Trail geotech report.docx Project #7131.74482.01 Page 27 of 32
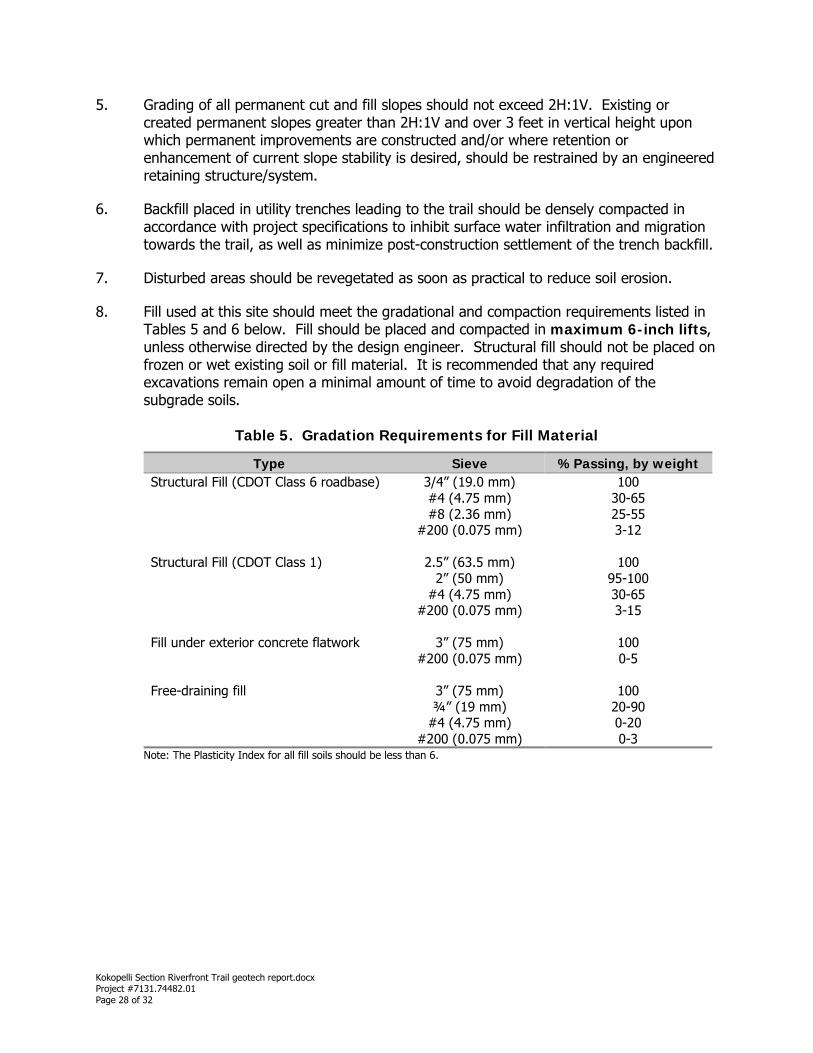
5. Grading of all permanent cut and fill slopes should not exceed 2H:1V. Existing or created permanent slopes greater than 2H:1V and over 3 feet in vertical height upon which permanent improvements are constructed and/or where retention or enhancement of current slope stability is desired, should be restrained by an engineered retaining structure/system.
6. Backfill placed in utility trenches leading to the trail should be densely compacted in accordance with project specifications to inhibit surface water infiltration and migration towards the trail, as well as minimize post-construction settlement of the trench backfill.
7. Disturbed areas should be revegetated as soon as practical to reduce soil erosion.
8. Fill used at this site should meet the gradational and compaction requirements listed in Tables 5 and 6 below. Fill should be placed and compacted in maximum 6-inch lifts, unless otherwise directed by the design engineer. Structural fill should not be placed on frozen or wet existing soil or fill material. It is recommended that any required excavations remain open a minimal amount of time to avoid degradation of the subgrade soils.
Table 5. Gradation Requirements for Fill Material
Type Sieve %Passing, by weight Structural Fill (CDOT Class 6 roadbase) 3/4” (19.0 mm) 100 #4 (4.75 mm) 30-65 #8 (2.36 mm) 25-55 #200 (0.075 mm) 3-12 Structural Fill (CDOT Class 1) 2.5” (63.5 mm) 100 2” (50 mm) 95-100 #4 (4.75 mm) 30-65 #200 (0.075 mm) 3-15 Fill under exterior concrete flatwork 3” (75 mm) 100 #200 (0.075 mm) 0-5 Free-draining fill 3” (75 mm) 100 ¾” (19 mm) 20-90 #4 (4.75 mm) 0-20 #200 (0.075 mm) 0-3
Note: The Plasticity Index for all fill soils should be less than 6.
Kokopelli Section Riverfront Trail geotech report.docx Project #7131.74482.01 Page 28 of 32
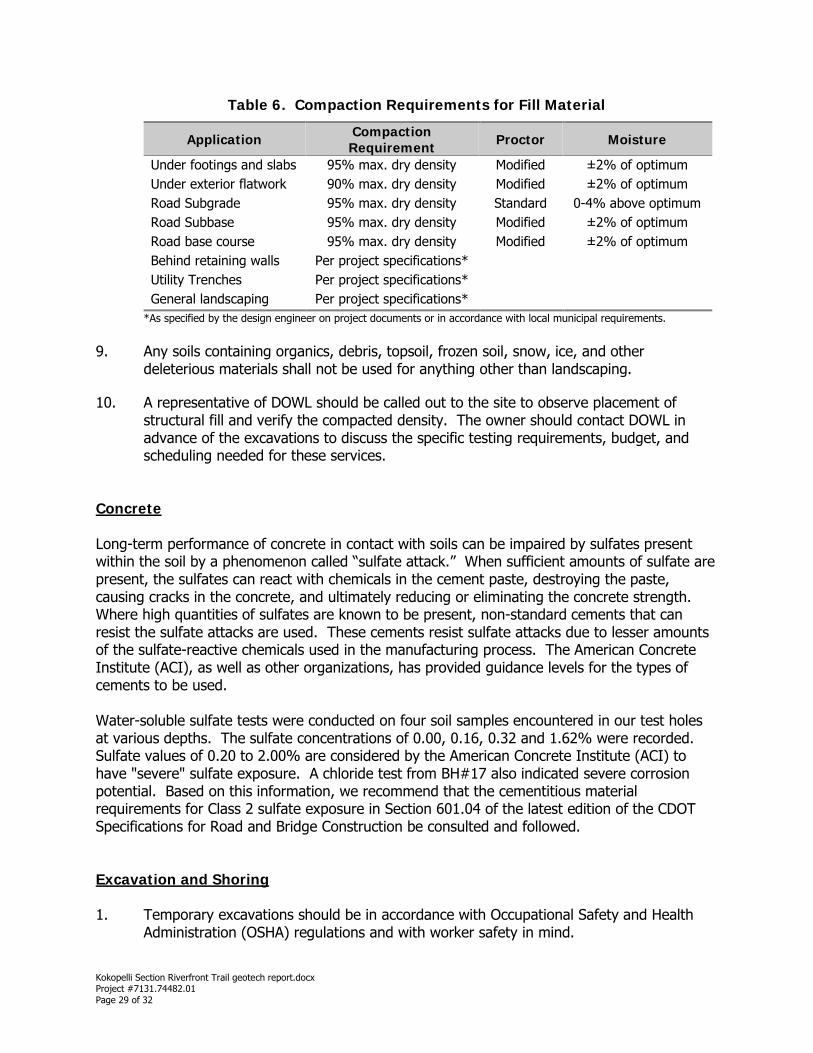
Table 6. Compaction Requirements for Fill Material
Application Compaction Requirement Proctor Moisture
Under footings and slabs 95% max. dry density Modified ±2% of optimum Under exterior flatwork 90% max. dry density Modified ±2% of optimum Road Subgrade 95% max. dry density Standard 0-4% above optimum Road Subbase 95% max. dry density Modified ±2% of optimum Road base course 95% max. dry density Modified ±2% of optimum Behind retaining walls Per project specifications* Utility Trenches Per project specifications* General landscaping Per project specifications*
*As specified by the design engineer on project documents or in accordance with local municipal requirements.
9. Any soils containing organics, debris, topsoil, frozen soil, snow, ice, and other
deleterious materials shall not be used for anything other than landscaping.
10. A representative of DOWL should be called out to the site to observe placement of structural fill and verify the compacted density. The owner should contact DOWL in advance of the excavations to discuss the specific testing requirements, budget, and scheduling needed for these services.
Concrete Long-term performance of concrete in contact with soils can be impaired by sulfates present within the soil by a phenomenon called “sulfate attack.” When sufficient amounts of sulfate are present, the sulfates can react with chemicals in the cement paste, destroying the paste, causing cracks in the concrete, and ultimately reducing or eliminating the concrete strength. Where high quantities of sulfates are known to be present, non-standard cements that can resist the sulfate attacks are used. These cements resist sulfate attacks due to lesser amounts of the sulfate-reactive chemicals used in the manufacturing process. The American Concrete Institute (ACI), as well as other organizations, has provided guidance levels for the types of cements to be used. Water-soluble sulfate tests were conducted on four soil samples encountered in our test holes at various depths. The sulfate concentrations of 0.00, 0.16, 0.32 and 1.62% were recorded. Sulfate values of 0.20 to 2.00% are considered by the American Concrete Institute (ACI) to have "severe" sulfate exposure. A chloride test from BH#17 also indicated severe corrosion potential. Based on this information, we recommend that the cementitious material requirements for Class 2 sulfate exposure in Section 601.04 of the latest edition of the CDOT Specifications for Road and Bridge Construction be consulted and followed. Excavation and Shoring 1. Temporary excavations should be in accordance with Occupational Safety and Health
Administration (OSHA) regulations and with worker safety in mind.
Kokopelli Section Riverfront Trail geotech report.docx Project #7131.74482.01 Page 29 of 32
2. Construction equipment, materials, and soil stockpiles should be located a minimum
horizontal distance equal to the height of any excavation from the crest of the excavation unless otherwise approved by the design engineer.
3. Based upon our evaluation, the silty clay to clayey silt (CL/ML) and silty/clayey sand
(SM/SC) found in our test holes would be most nearly represented by an OSHA Type A and B soils, depending on moisture content and in-situ density of the soils. We note, however, that the recommended excavation slope angles for this classification do not consider topographic slope angle which must be accounted for when excavating. Our assessment is based upon the soil and groundwater conditions found in our limited evaluation and sampling. The contractor’s “competent person” (defined by OSHA as “an individual capable of identifying existing and predictable hazards…and who has the authorization to take prompt corrective measures to eliminate or manage these hazards and conditions) should evaluate the soil materials exposed during excavation based on composition, structure, and environmental conditions per 29 CFR 1926 and recommend appropriate slope laybacks or shoring, as required. Refer to OSHA’s Technical Manual Section V: Chapter 2 on Excavations: Hazard Recognition in Trenching and Shoring (available on-line at: www.osha.gov) for further excavation guidelines. We can provide these services, as requested.
4. If the excavations will be made or remain open during wet weather, it is recommended
that polyethylene sheeting be secured over the excavation face to minimize sediment runoff and deterioration of the foundation soils. Surface runoff above the cuts should be directed away from the trail excavation using berms or diversion ditches. Water should not be allowed to accumulate and/or pond anywhere upon the soils and shales in the construction area. It must be removed by gravity or pumped to avoid this condition until permanent drainage systems are operational.
5. Excavations should be performed during the low groundwater season (late summer
through early spring) to minimize the amount of water that needs to be removed during construction operations at the bridges and low-lying areas. This will minimize pumping of the soil so that maximum compaction densities can be achieved. This time period of construction will also help to avoid areas that may be flooded during the spring snowmelt along the Colorado River.
6. We anticipate that the excavation of the site soils can be accomplished by conventional
excavating equipment.
Kokopelli Section Riverfront Trail geotech report.docx Project #7131.74482.01 Page 30 of 32

Closing Considerations
Standard of Care and Interpretation of Subsurface Data This report has been prepared in a manner consistent with local standards of professional geotechnical engineering practice. The recommendations herein are subject to revision based on review of final site grading and structural plans. We note that we did not perform an evaluation of deep subsurface conditions. Evaluation of environmental contaminants was not part of our scope of services performed at this site. The classification of soils and interpretation of subsurface conditions is based on our training and years of experience, but is necessarily based on limited subsurface observation and testing. As such, inferred ground conditions cannot be guaranteed to be exact. No other warranty, express or implied, is made. Observations of the excavation(s) subgrade by DOWL prior to erection of the bridge foundation systems are integral parts of these recommendations. If subsurface conditions differing from those described herein are discovered during excavation, construction should be stopped until the situation has been assessed by a representative of DOWL. Construction should be resumed only when remedies or design adjustments, as necessary, have been prescribed.
Use of This Report This report is intended for use by the City of Fruita and the design team specifically to address the site and subsurface conditions as they relate to the proposed structures described in the Construction Plans and Site Conditions Section. Changes to the site or proposed development plans may alter or invalidate the recommendations contained herein. DOWL retains an ownership and property interest in this report. Consistent with the industry, copies of this document that may be relied upon by the design team are limited to those that are signed and sealed by the Geotechnical Engineer (Standard Form of Agreement Between Owner and Geotechnical Engineer for Professional Services, Engineer’s Joint Contract Documents Committee, 1996). This report together with ancillary data, analyses, test results, and other components and/or supporting parts are not intended or represented to be suitable for reuse by the design team or others on extensions to this project or on any other project. Any such reuse or modification invalidates all aspects of the report and excuses the Geotechnical Engineer for all responsibility and liability or legal exposure. This report is considered valid for a period of two years from the date of issue provided the site conditions and development plans have not changed from what is referenced in this report. Changes to the site may occur due to development or natural processes. Additionally, technological advances made in construction and changes in legislation may alter the recommendations made herein. Depending upon the site and proposed development changes, DOWL may require additional evaluation (at additional cost) to update the recommendations contained herein.
Kokopelli Section Riverfront Trail geotech report.docx Project #7131.74482.01 Page 31 of 32

PROJECT MAPS
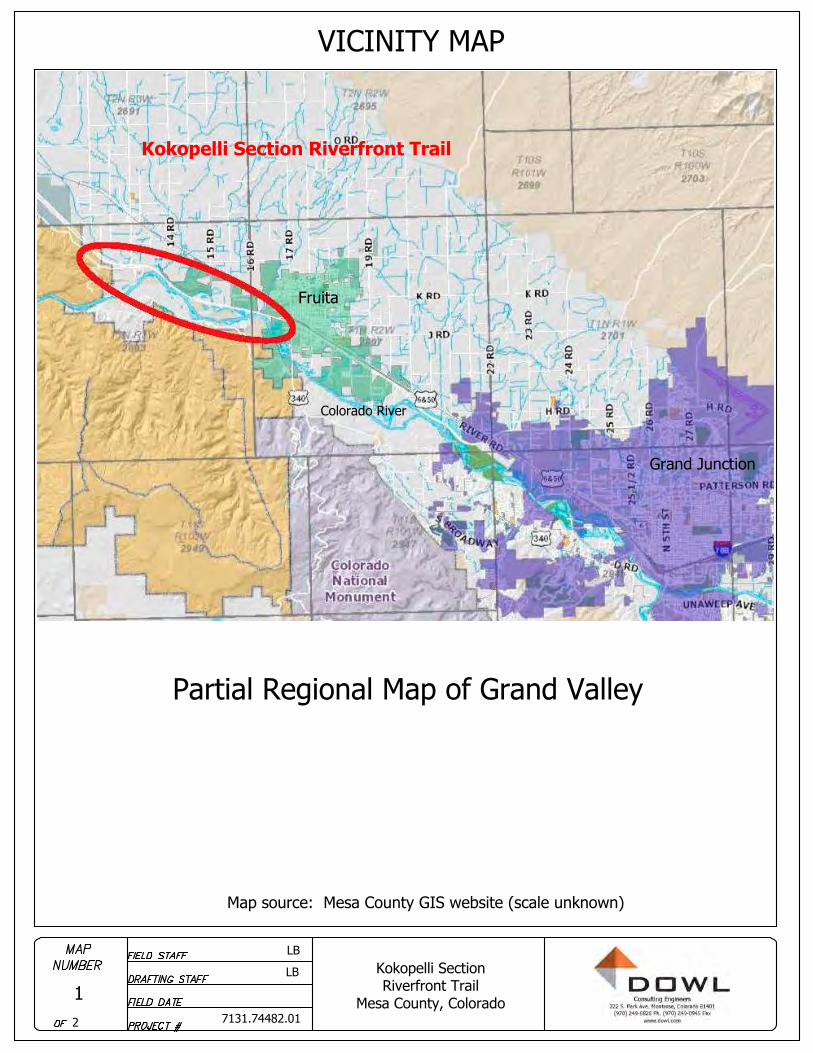
VICINITY MAP
Kokopelli Section Riverfront Trail
Mesa County, Colorado
LB
LB
7131.74482.01
12
Map source: Mesa County GIS website (scale unknown)
Partial Regional Map of Grand Valley
Kokopelli Section Riverfront Trail
Fruita
Grand Junction
Colorado River
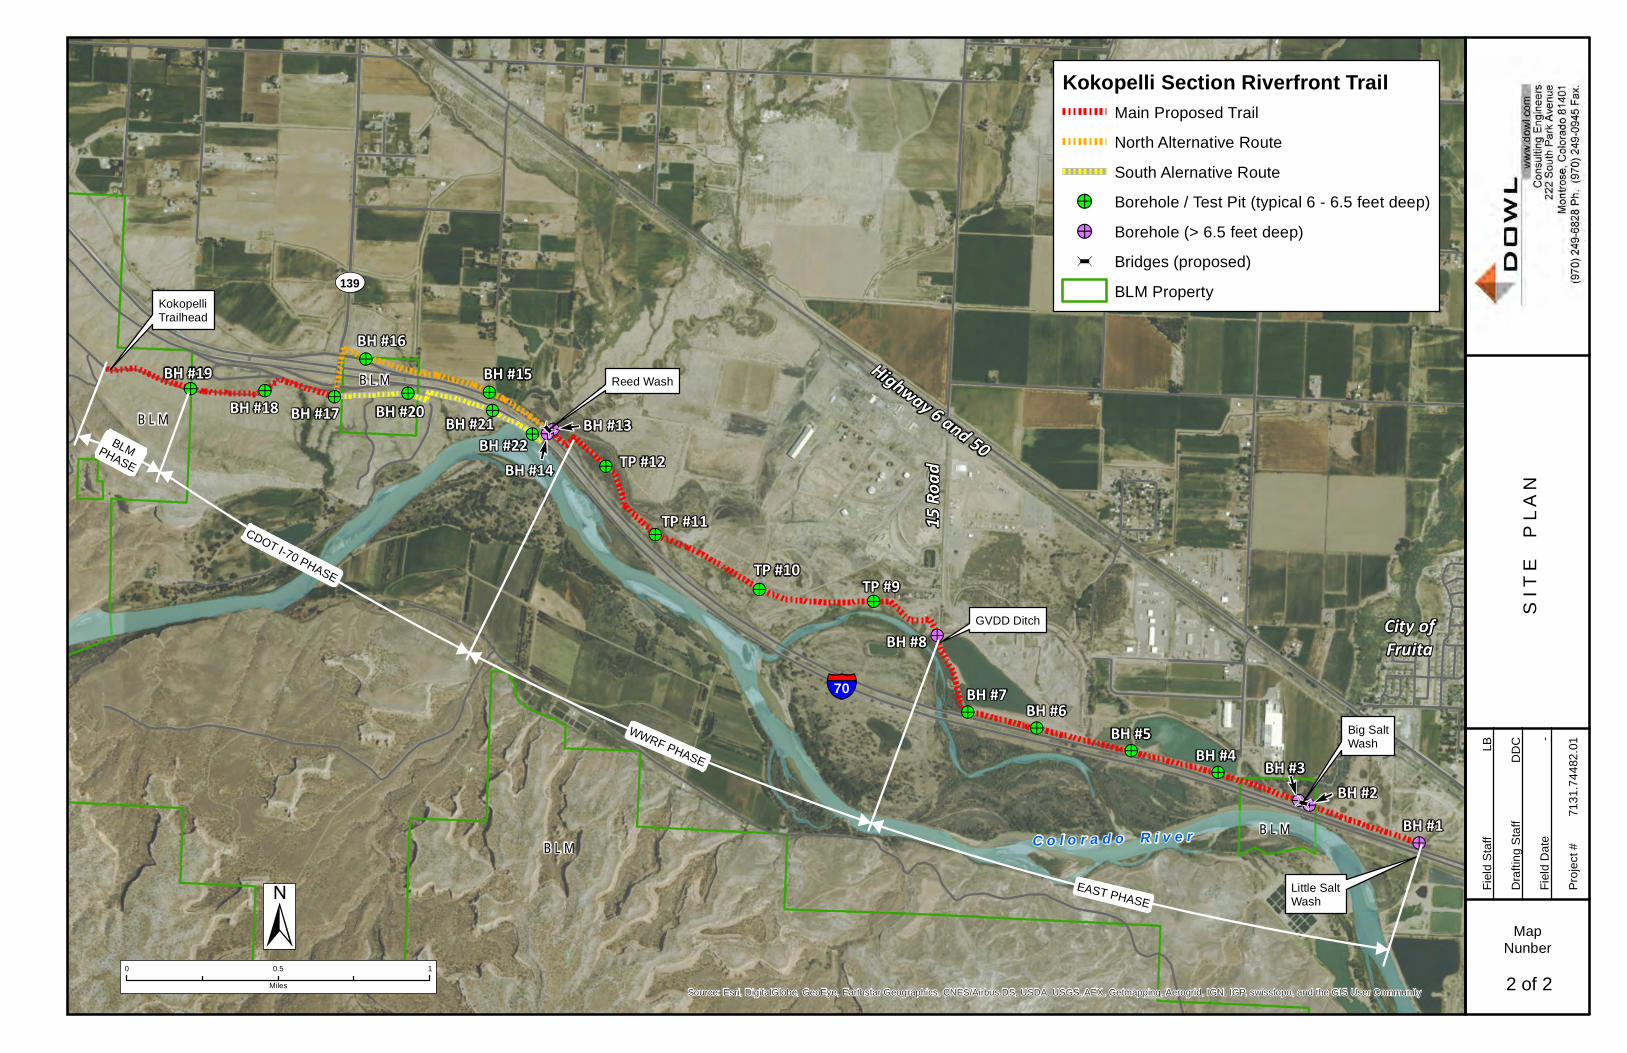
!>!>
!>!>
!>
!>
!>
!>!>
!>!>!>
!>
!>
!>
!>
!>
!>
!>!>
!>
!>
à
à
B L MBH #1
BH #2BH #3BH #4
BH #5BH #6BH #7
BH #8
TP #9TP #10
TP #11
TP #12BH #13
BH #22
BH #15BH #16
BH #20BH #17BH #18BH #19
BH #21
C o l o r a d o R i v e r
§̈¦70
UV139
Highway 6 and 50
City ofFruita
15 Ro
adLittle SaltWash
#
#
#
CDOT I-70 PHASE
#
# BLMPHASE
WWRF PHASE
EAST PHASE
# ##
BH #14
EE
E
E
B L M
Reed Wash
Big SaltWash
B L M
B L M
KokopelliTrailhead
GVDD Ditch
Source: Esri, DigitalGlobe, GeoEye, Earthstar Geographics, CNES/Airbus DS, USDA, USGS, AEX, Getmapping, Aerogrid, IGN, IGP, swisstopo, and the GIS User Community
0 10.5
Miles
±
S I T
E
P L
A N
Kokopelli Section Riverfront TrailMain Proposed Trail
North Alternative Route
South Alernative Route
!> Borehole / Test Pit (typical 6 - 6.5 feet deep)
!> Borehole (> 6.5 feet deep)
à Bridges (proposed)
BLM Property
MapNunber
2 of 2
Fiel
d S
taff
Dra
fting
Sta
ff
Fiel
d D
ate
Proj
ect #
LB
DD
C -
7131
.744
82.0
1
TEST HOLE LOGS
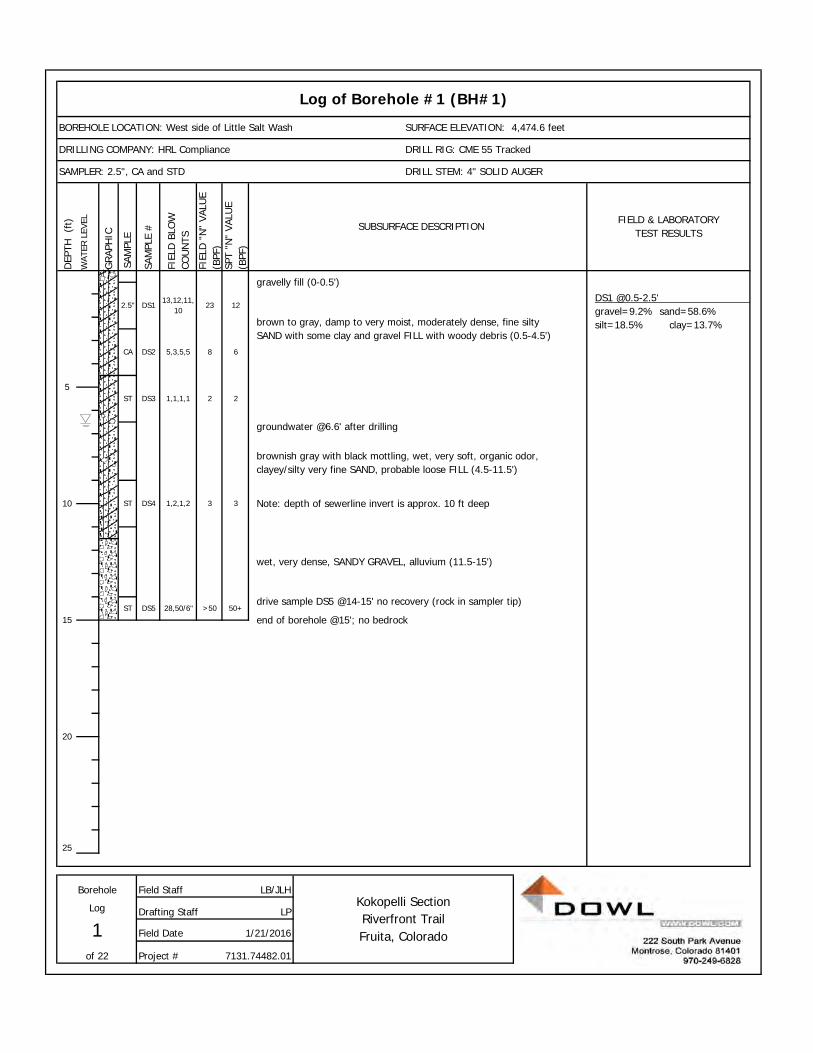
DEP
TH
(ft)
WAT
ER L
EVEL
GRA
PHIC
SAM
PLE
#
FIEL
D B
LOW
CO
UN
TS
FIEL
D "
N"
VALU
E (B
PF)
SPT
"N"
VALU
E (B
PF)
25
LB/JLH
LP
BOREHOLE LOCATION: West side of Little Salt Wash SURFACE ELEVATION: 4,474.6 feet
Log of Borehole #1 (BH#1)
DRILLING COMPANY: HRL Compliance DRILL RIG: CME 55 Tracked
DS1 @0.5-2.5' gravel=9.2% sand=58.6% silt=18.5% clay=13.7%
gravelly fill (0-0.5')
2.5" DS1
SAMPLER: 2.5", CA and STD DRILL STEM: 4" SOLID AUGER
SAM
PLE
SUBSURFACE DESCRIPTIONFIELD & LABORATORY
TEST RESULTS
6
5ST DS3 1,1,1,1 2
brown to gray, damp to very moist, moderately dense, fine silty SAND with some clay and gravel FILL with woody debris (0.5-4.5')
13,12,11,10
23 12
CA DS2 5,3,5,5 8
10 3ST 1,2,1,2 3DS4
1550+ST DS5 28,50/6" >50
drive sample DS5 @14-15' no recovery (rock in sampler tip)
20
1 Field Date 1/21/2016
of 22 Project # 7131.74482.01
Borehole Field StaffKokopelli Section Riverfront Trail Fruita, Colorado
Log Drafting Staff
2
brownish gray with black mottling, wet, very soft, organic odor, clayey/silty very fine SAND, probable loose FILL (4.5-11.5')
wet, very dense, SANDY GRAVEL, alluvium (11.5-15')
end of borehole @15'; no bedrock
groundwater @6.6' after drilling
Note: depth of sewerline invert is approx. 10 ft deep
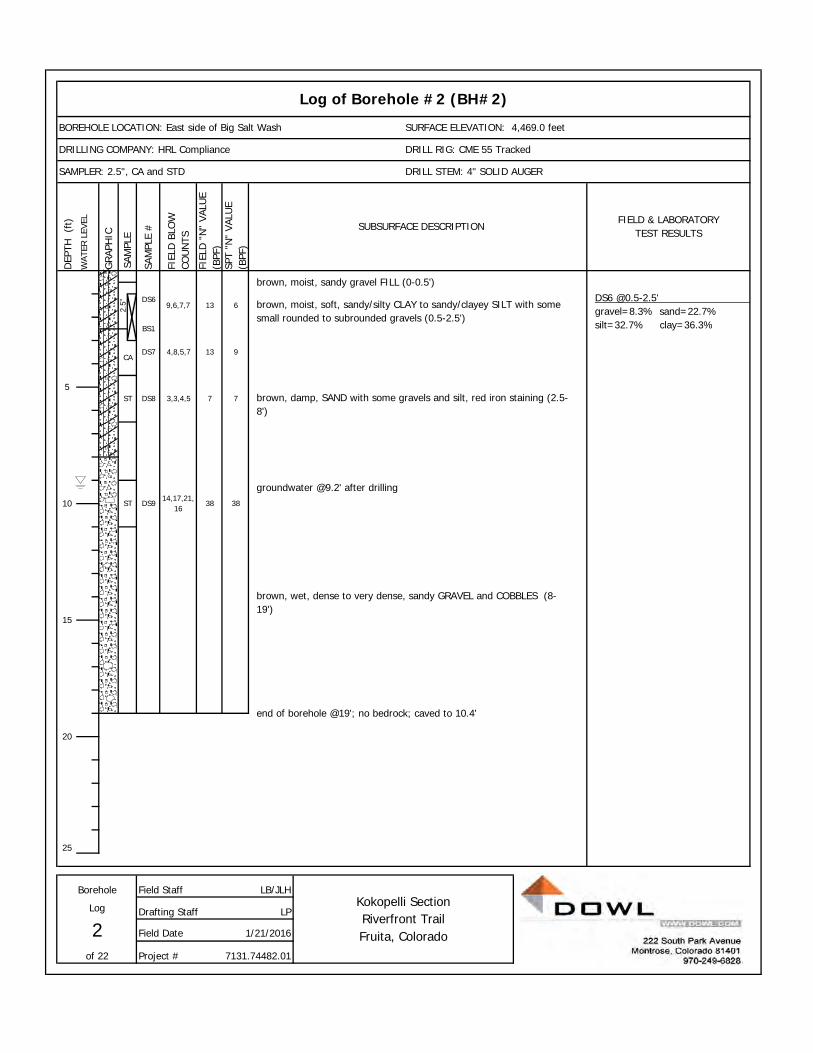
DEP
TH
(ft)
WAT
ER L
EVEL
GRA
PHIC
SAM
PLE
#
FIEL
D B
LOW
CO
UN
TS
FIEL
D "
N"
VALU
E (B
PF)
SPT
"N"
VALU
E (B
PF)
25
LB/JLH
LP
Log of Borehole #2 (BH#2)
DRILLING COMPANY: HRL Compliance DRILL RIG: CME 55 Tracked
SAMPLER: 2.5", CA and STD DRILL STEM: 4" SOLID AUGER
BOREHOLE LOCATION: East side of Big Salt Wash SURFACE ELEVATION: 4,469.0 feetSA
MPL
E
SUBSURFACE DESCRIPTIONFIELD & LABORATORY
TEST RESULTS
9,6,7,7 13 6DS6 @0.5-2.5' gravel=8.3% sand=22.7% silt=32.7% clay=36.3%
brown, moist, sandy gravel FILL (0-0.5')
DS6
BS1
4,8,5,7 13
DS914,17,21,
16
5ST DS8 3,3,4,5
38
7
2.5"
CADS7
20
15
10 ST
Borehole Field StaffKokopelli Section Riverfront Trail Fruita, Colorado
Log Drafting Staff
2 Field Date 1/21/2016
of 22 Project # 7131.74482.01
brown, wet, dense to very dense, sandy GRAVEL and COBBLES (8-19')
end of borehole @19'; no bedrock; caved to 10.4'
brown, moist, soft, sandy/silty CLAY to sandy/clayey SILT with some small rounded to subrounded gravels (0.5-2.5')
38
9
7 brown, damp, SAND with some gravels and silt, red iron staining (2.5-8')
groundwater @9.2' after drilling
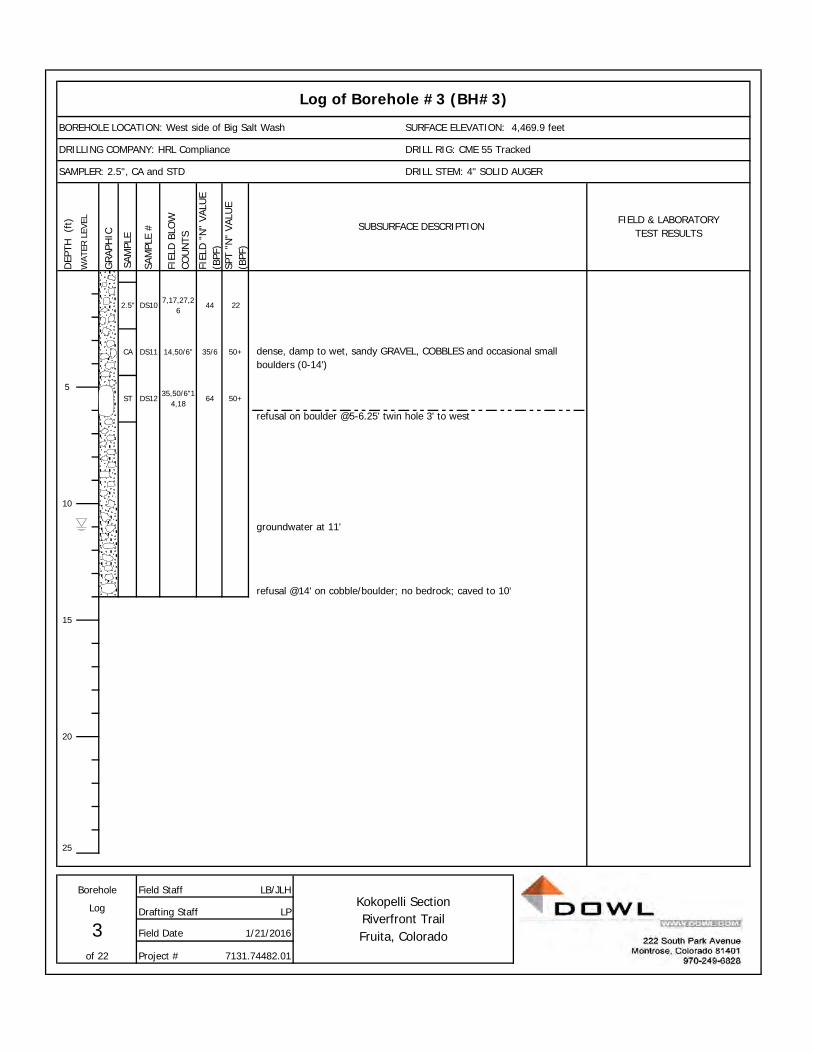
DEP
TH
(ft)
WAT
ER L
EVEL
GRA
PHIC
SAM
PLE
#
FIEL
D B
LOW
CO
UN
TS
FIEL
D "
N"
VALU
E (B
PF)
SPT
"N"
VALU
E (B
PF)
25
LB/JLH
LP
BOREHOLE LOCATION: West side of Big Salt Wash SURFACE ELEVATION: 4,469.9 feet
Log of Borehole #3 (BH#3)
DRILLING COMPANY: HRL Compliance DRILL RIG: CME 55 Tracked
2.5" DS10
SAMPLER: 2.5", CA and STD DRILL STEM: 4" SOLID AUGER
SAM
PLE
SUBSURFACE DESCRIPTIONFIELD & LABORATORY
TEST RESULTS
7,17,27,26
44 22
CA DS11 14,50/6" 35/6 50+
groundwater at 11'
dense, damp to wet, sandy GRAVEL, COBBLES and occasional small boulders (0-14')
10
50+5
ST DS1235,50/6"1
4,1864
15
20
3 Field Date
Log Drafting Staff
of 22 Project # 7131.74482.01
Borehole Field Staff
1/21/2016
refusal @14' on cobble/boulder; no bedrock; caved to 10'
refusal on boulder @5-6.25' twin hole 3' to west
Kokopelli Section Riverfront Trail Fruita, Colorado
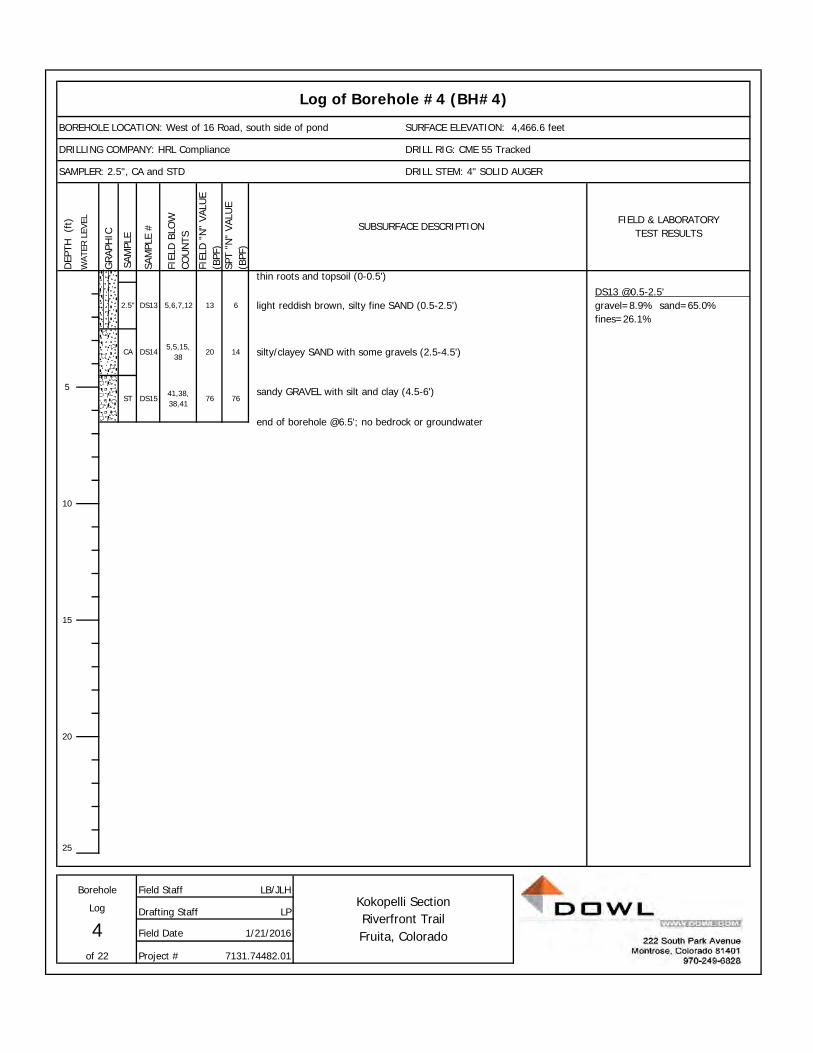
DEP
TH
(ft)
WAT
ER L
EVEL
GRA
PHIC
SAM
PLE
#
FIEL
D B
LOW
CO
UN
TS
FIEL
D "
N"
VALU
E (B
PF)
SPT
"N"
VALU
E (B
PF)
25
LB/JLH
LP
BOREHOLE LOCATION: West of 16 Road, south side of pond SURFACE ELEVATION: 4,466.6 feet
DS13 @0.5-2.5' gravel=8.9% sand=65.0% fines=26.1%
Log of Borehole #4 (BH#4)
DRILLING COMPANY: HRL Compliance DRILL RIG: CME 55 Tracked
thin roots and topsoil (0-0.5')
2.5" DS13
SAMPLER: 2.5", CA and STD DRILL STEM: 4" SOLID AUGER
SAM
PLE
SUBSURFACE DESCRIPTIONFIELD & LABORATORY
TEST RESULTS
5,6,7,12 13
CA DS145,5,15,
3820
5ST DS15
41,38, 38,41
76 76
14
light reddish brown, silty fine SAND (0.5-2.5')
sandy GRAVEL with silt and clay (4.5-6')
end of borehole @6.5'; no bedrock or groundwater
silty/clayey SAND with some gravels (2.5-4.5')
6
20
15
10
Borehole Field StaffKokopelli Section Riverfront Trail Fruita, Colorado
Log Drafting Staff
4 Field Date 1/21/2016
of 22 Project # 7131.74482.01
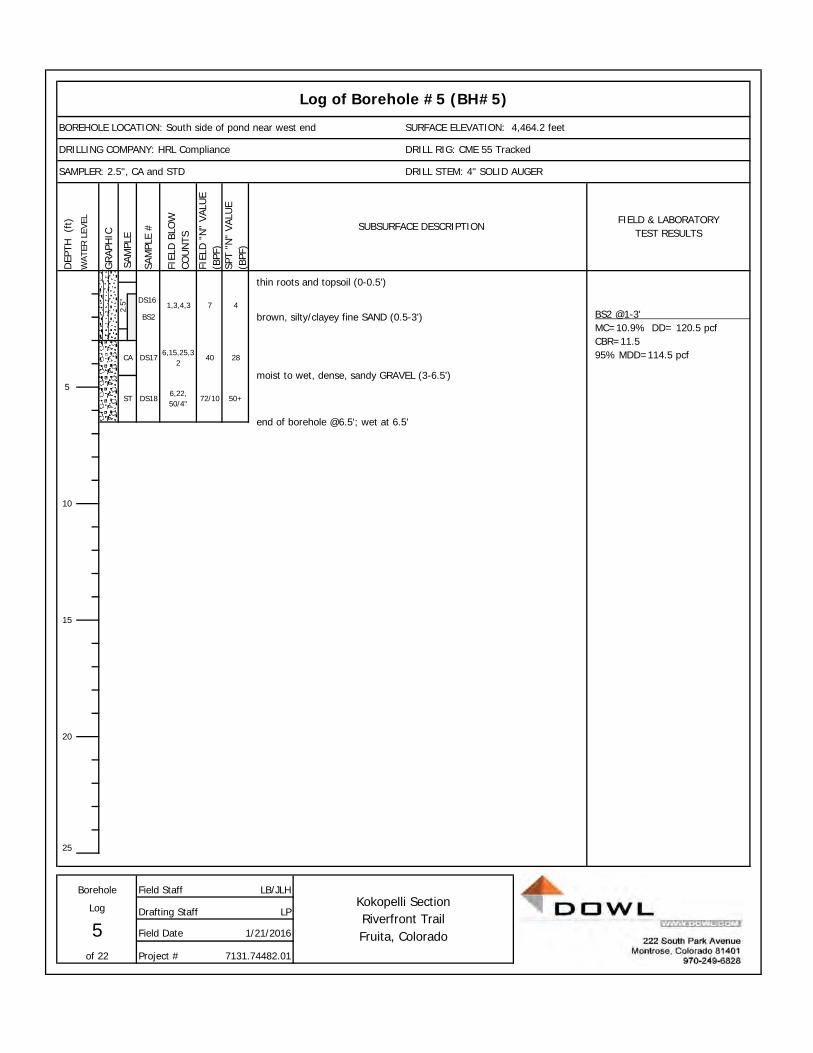
DEP
TH
(ft)
WAT
ER L
EVEL
GRA
PHIC
SAM
PLE
#
FIEL
D B
LOW
CO
UN
TS
FIEL
D "
N"
VALU
E (B
PF)
SPT
"N"
VALU
E (B
PF)
DS16
25
LB/JLH
LP
SAMPLER: 2.5", CA and STD DRILL STEM: 4" SOLID AUGER
BS2 @1-3' MC=10.9% DD= 120.5 pcf CBR=11.5 95% MDD=114.5 pcfCA DS17
6,15,25,32
40 28
SAM
PLE
SUBSURFACE DESCRIPTIONFIELD & LABORATORY
TEST RESULTS
1,3,4,3 7 4BS2
thin roots and topsoil (0-0.5')
BOREHOLE LOCATION: South side of pond near west end SURFACE ELEVATION: 4,464.2 feet
Log of Borehole #5 (BH#5)
DRILLING COMPANY: HRL Compliance DRILL RIG: CME 55 Tracked
brown, silty/clayey fine SAND (0.5-3')
72/10 50+
10
2.5"
5ST
moist to wet, dense, sandy GRAVEL (3-6.5')
DS186,22, 50/4"
end of borehole @6.5'; wet at 6.5'
5 Field Date 1/21/2016
of 22 Project # 7131.74482.01
Log Drafting Staff
Field Staff
20
15
BoreholeKokopelli Section Riverfront Trail Fruita, Colorado

DEP
TH
(ft)
WAT
ER L
EVEL
GRA
PHIC
SAM
PLE
#
FIEL
D B
LOW
CO
UN
TS
FIEL
D "
N"
VALU
E (B
PF)
SPT
"N"
VALU
E (B
PF)
25
LB/JLH
LP
thin roots (0-0.5')
BOREHOLE LOCATION: South of SE corner of triangular pond SURFACE ELEVATION: 4,467.6 feet
DS19 @0.5-2.5' (CL-ML) LL=24 PL=17 PI=7 gravel=0.0% sand=42.4% silt=34.3% clay=23.3%
Log of Borehole #6 (BH#6)
DRILLING COMPANY: HRL Compliance DRILL RIG: CME 55 Tracked
2.5" DS19
SAMPLER: 2.5", CA and STD DRILL STEM: 4" SOLID AUGER
SAM
PLE
SUBSURFACE DESCRIPTIONFIELD & LABORATORY
TEST RESULTS
12,21,25,28
46 23
CA DS2011,13,10,
1123
13
end of borehole @6.5'
16
20
15
10
5ST DS21 4,5,8,10 13
light brown, mod dense, silty/clayey fine SAND; salts present (0.5-6.5')
Borehole Field StaffKokopelli Section Riverfront Trail Fruita, Colorado
Log Drafting Staff
6 Field Date 1/21/2016
of 22 Project # 7131.74482.01
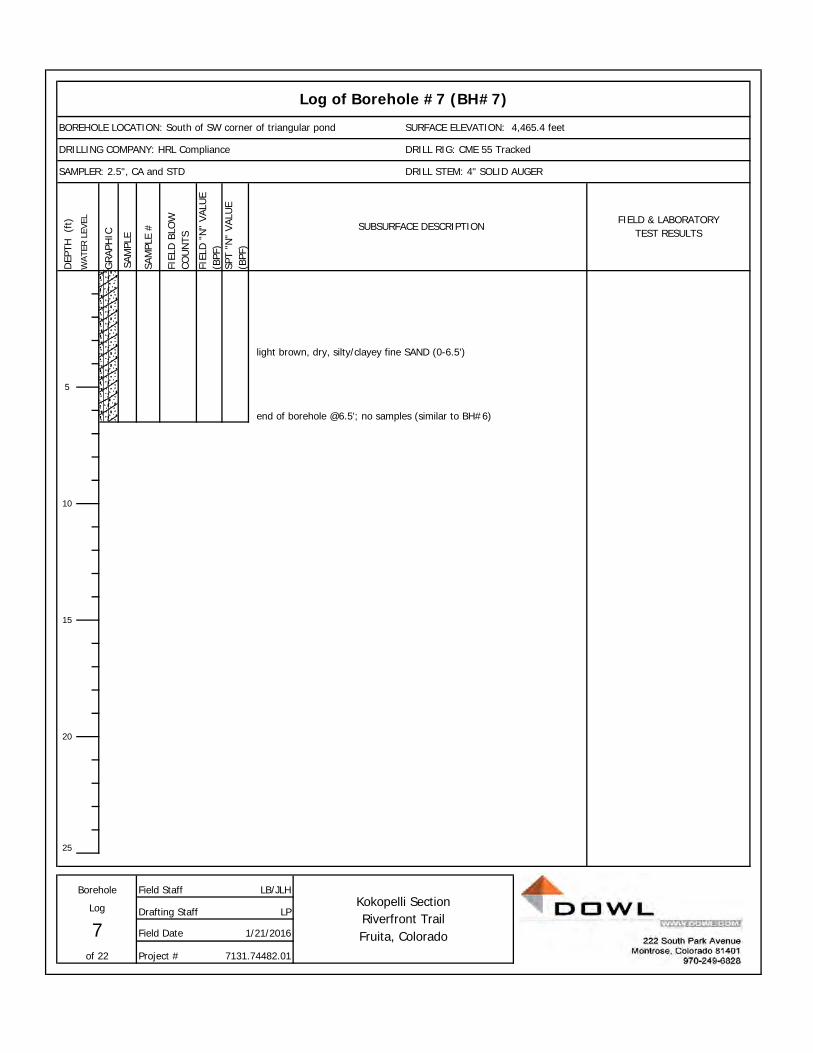
DEP
TH
(ft)
WAT
ER L
EVEL
GRA
PHIC
SAM
PLE
#
FIEL
D B
LOW
CO
UN
TS
FIEL
D "
N"
VALU
E (B
PF)
SPT
"N"
VALU
E (B
PF)
25
LB/JLH
LP
Log of Borehole #7 (BH#7)
DRILLING COMPANY: HRL Compliance DRILL RIG: CME 55 Tracked
SAMPLER: 2.5", CA and STD DRILL STEM: 4" SOLID AUGER
BOREHOLE LOCATION: South of SW corner of triangular pond SURFACE ELEVATION: 4,465.4 feetSA
MPL
E
SUBSURFACE DESCRIPTIONFIELD & LABORATORY
TEST RESULTS
end of borehole @6.5'; no samples (similar to BH#6)
5
light brown, dry, silty/clayey fine SAND (0-6.5')
20
15
10
Borehole Field StaffKokopelli Section Riverfront Trail Fruita, Colorado
Log Drafting Staff
7 Field Date 1/21/2016
of 22 Project # 7131.74482.01
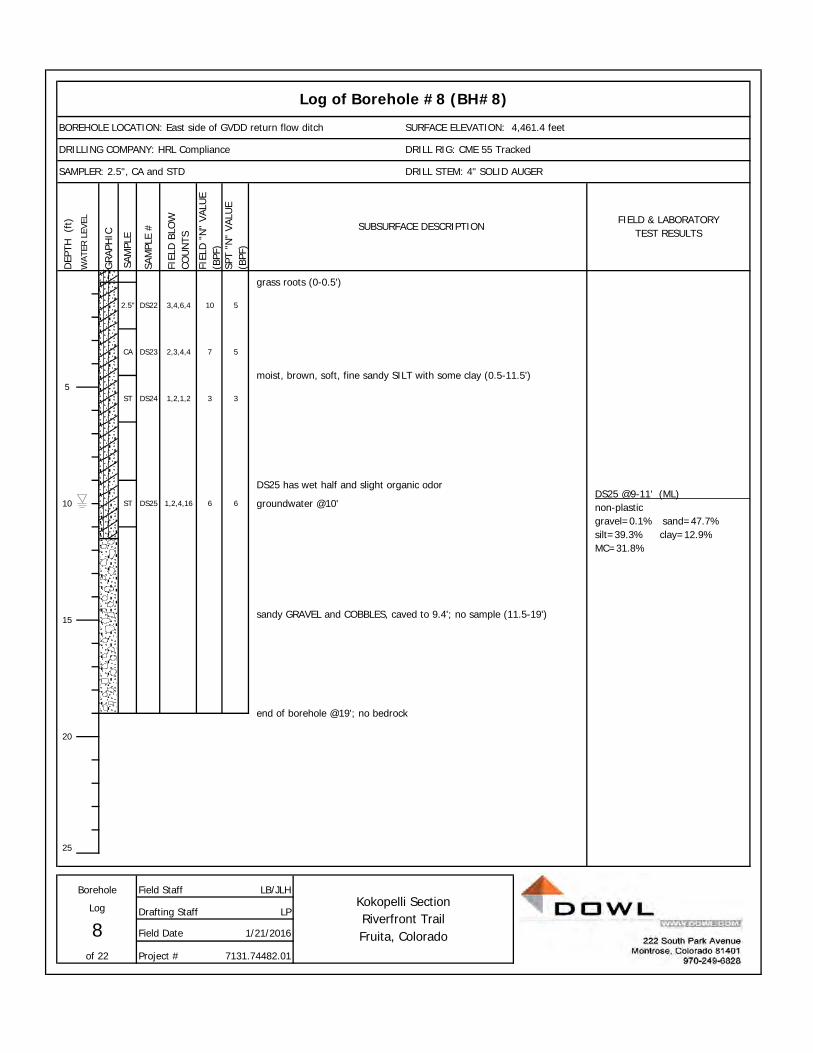
DEP
TH
(ft)
WAT
ER L
EVEL
GRA
PHIC
SAM
PLE
#
FIEL
D B
LOW
CO
UN
TS
FIEL
D "
N"
VALU
E (B
PF)
SPT
"N"
VALU
E (B
PF)
25
LB/JLH
LPKokopelli Section Riverfront Trail Fruita, Colorado
SAM
PLE
SUBSURFACE DESCRIPTIONFIELD & LABORATORY
TEST RESULTS
ST DS25 groundwater @10'
end of borehole @19'; no bedrock
sandy GRAVEL and COBBLES, caved to 9.4'; no sample (11.5-19')
DS25 has wet half and slight organic odor
grass roots (0-0.5')
DS25 @9-11' (ML) non-plastic gravel=0.1% sand=47.7% silt=39.3% clay=12.9% MC=31.8%
3
DS23
DS22
DS24
5
moist, brown, soft, fine sandy SILT with some clay (0.5-11.5')
3,4,6,4 10
1,2,4,16 6 6
5
3
2,3,4,4
1,2,1,2
7
Log of Borehole #8 (BH#8)
DRILLING COMPANY: HRL Compliance
SAMPLER: 2.5", CA and STD
DRILL RIG: CME 55 Tracked
DRILL STEM: 4" SOLID AUGER
BOREHOLE LOCATION: East side of GVDD return flow ditch SURFACE ELEVATION: 4,461.4 feet
Log
8of 22
Field Staff
Drafting Staff
Field Date
Project # 7131.74482.01
1/21/2016
Borehole
15
20
2.5"
CA
ST5
10
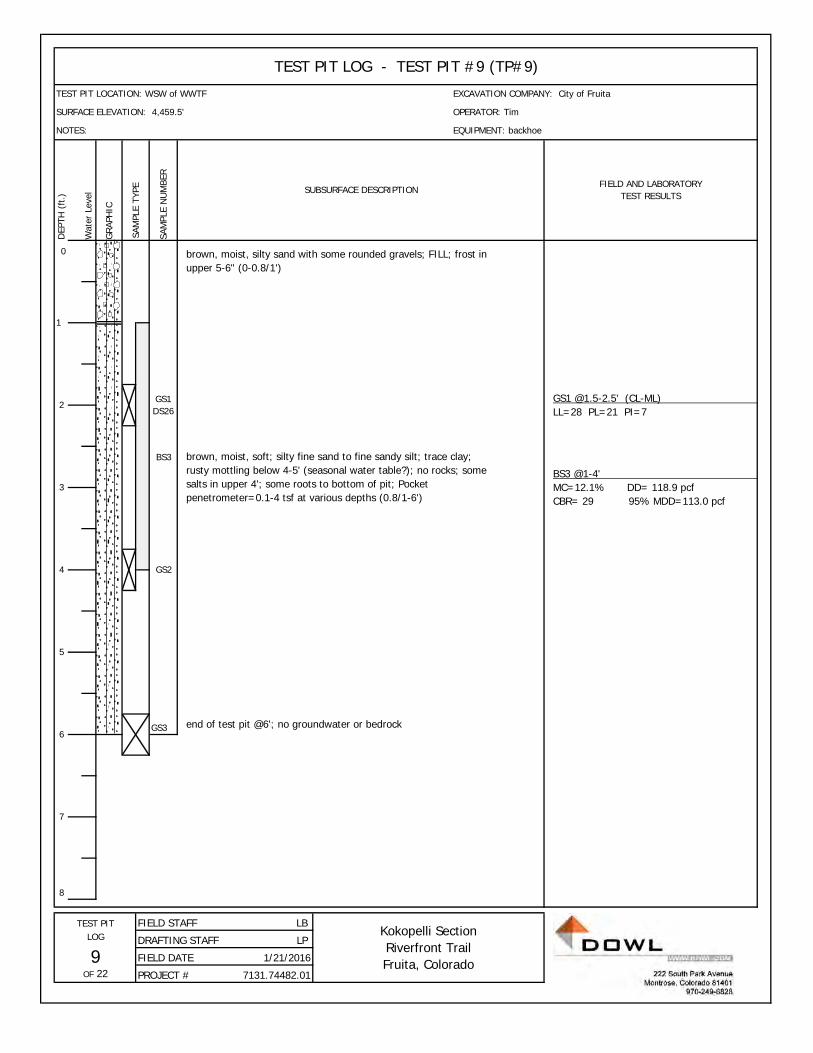
DEP
TH (
ft.)
Wat
er L
evel
GRA
PHIC
SAM
PLE
NU
MBE
R
0
BS3
GS3
FIELD STAFF LB
DRAFTING STAFF LP
FIELD DATE
PROJECT #
end of test pit @6'; no groundwater or bedrock
7
8
TEST PIT
1/21/2016
Kokopelli Section Riverfront Trail Fruita, Colorado
7131.74482.01
3
4
5
OF 22
LOG
9
6
1
2
TEST PIT LOG - TEST PIT #9 (TP#9)
SAM
PLE
TYPE SUBSURFACE DESCRIPTION
FIELD AND LABORATORY TEST RESULTS
TEST PIT LOCATION: WSW of WWTF
SURFACE ELEVATION: 4,459.5'
NOTES:
EXCAVATION COMPANY: City of Fruita
OPERATOR: Tim
EQUIPMENT: backhoe
brown, moist, silty sand with some rounded gravels; FILL; frost in upper 5-6" (0-0.8/1')
brown, moist, soft; silty fine sand to fine sandy silt; trace clay; rusty mottling below 4-5' (seasonal water table?); no rocks; some salts in upper 4'; some roots to bottom of pit; Pocket penetrometer=0.1-4 tsf at various depths (0.8/1-6')
GS1 DS26
GS2
GS1 @1.5-2.5' (CL-ML) LL=28 PL=21 PI=7
BS3 @1-4' MC=12.1% DD= 118.9 pcf CBR= 29 95% MDD=113.0 pcf
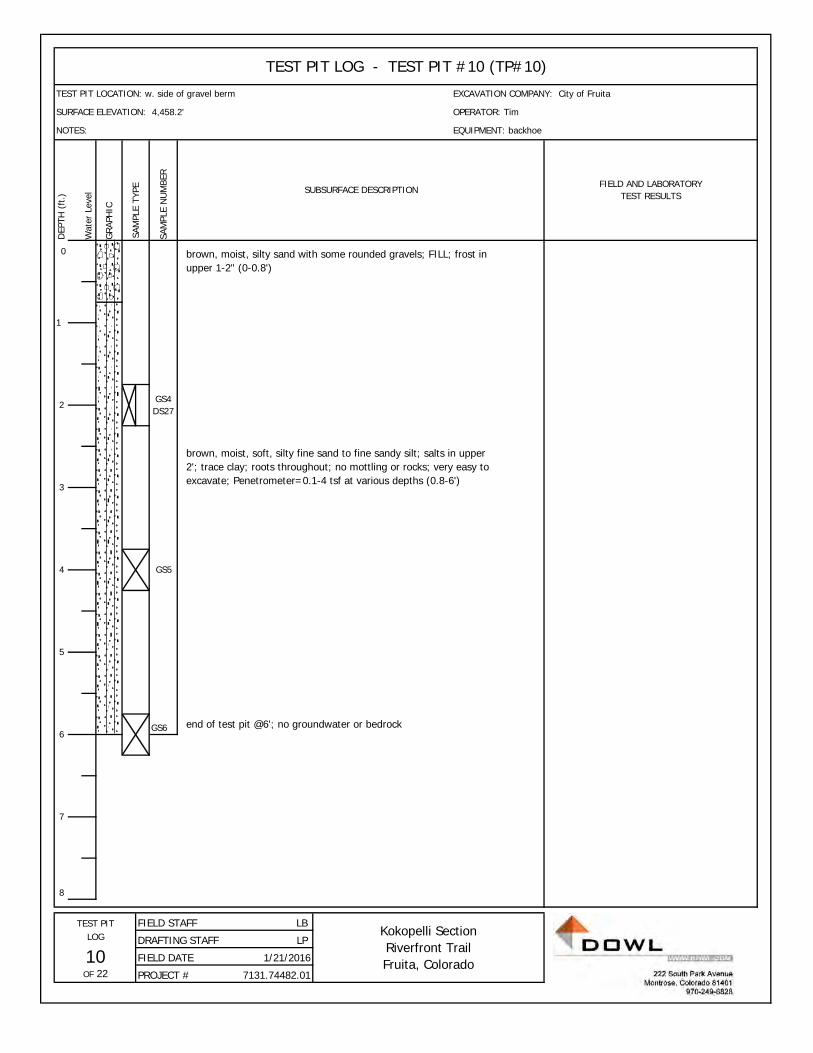
DEP
TH (
ft.)
Wat
er L
evel
GRA
PHIC
SAM
PLE
NU
MBE
R
0
GS6
FIELD STAFF LB
DRAFTING STAFF LP
FIELD DATE
PROJECT #
TEST PITKokopelli Section Riverfront Trail Fruita, Colorado
LOG
10 1/21/2016OF 22 7131.74482.01
7
8
6end of test pit @6'; no groundwater or bedrock
5
brown, moist, soft, silty fine sand to fine sandy silt; salts in upper 2'; trace clay; roots throughout; no mottling or rocks; very easy to excavate; Penetrometer=0.1-4 tsf at various depths (0.8-6')
4 GS5
GS4 DS27
3
1
brown, moist, silty sand with some rounded gravels; FILL; frost in upper 1-2" (0-0.8')
2
NOTES: EQUIPMENT: backhoeSA
MPL
E TY
PE SUBSURFACE DESCRIPTIONFIELD AND LABORATORY
TEST RESULTS
TEST PIT LOG - TEST PIT #10 (TP#10)
TEST PIT LOCATION: w. side of gravel berm EXCAVATION COMPANY: City of Fruita
SURFACE ELEVATION: 4,458.2' OPERATOR: Tim
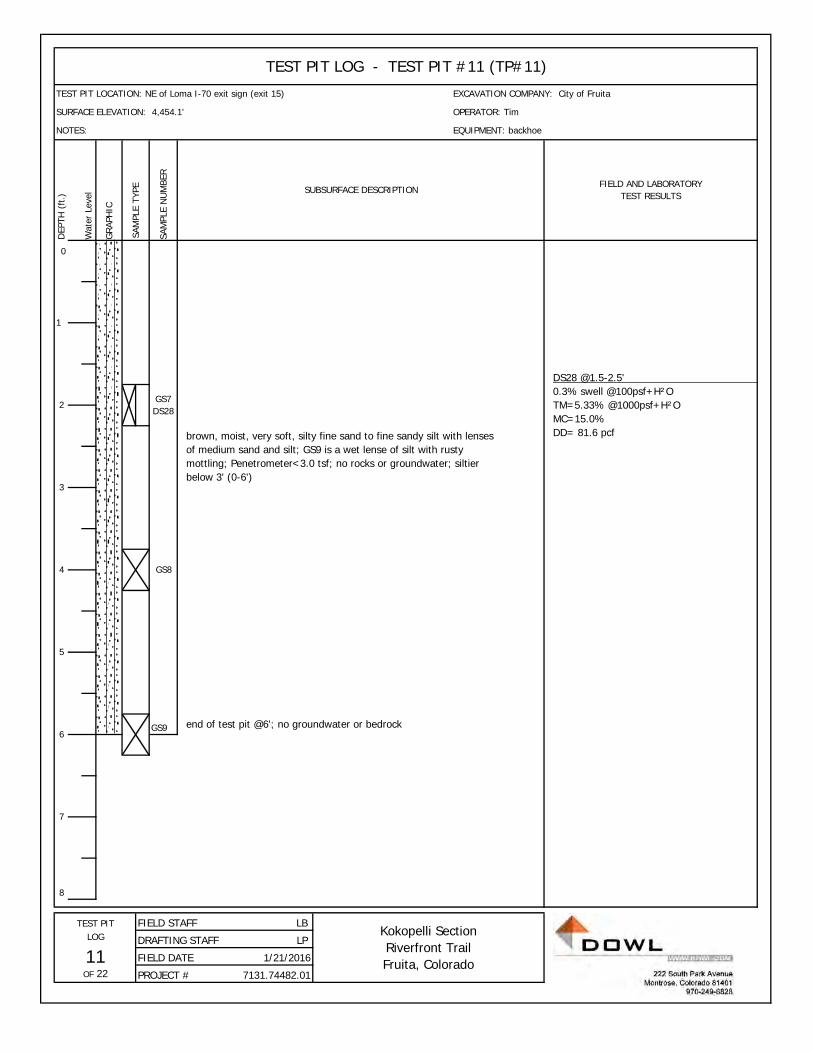
DEP
TH (
ft.)
Wat
er L
evel
GRA
PHIC
SAM
PLE
NU
MBE
R
0
GS9
FIELD STAFF LB
DRAFTING STAFF LP
FIELD DATE
PROJECT #
brown, moist, very soft, silty fine sand to fine sandy silt with lenses of medium sand and silt; GS9 is a wet lense of silt with rusty mottling; Penetrometer<3.0 tsf; no rocks or groundwater; siltier below 3' (0-6')
DS28 @1.5-2.5' 0.3% swell @100psf+H²O TM=5.33% @1000psf+H²O MC=15.0% DD= 81.6 pcf
TEST PITKokopelli Section Riverfront Trail Fruita, Colorado
LOG
11 1/21/2016OF 22 7131.74482.01
7
8
6end of test pit @6'; no groundwater or bedrock
5
4 GS8
GS7 DS28
3
1
2
NOTES: EQUIPMENT: backhoeSA
MPL
E TY
PE SUBSURFACE DESCRIPTIONFIELD AND LABORATORY
TEST RESULTS
TEST PIT LOG - TEST PIT #11 (TP#11)
TEST PIT LOCATION: NE of Loma I-70 exit sign (exit 15) EXCAVATION COMPANY: City of Fruita
SURFACE ELEVATION: 4,454.1' OPERATOR: Tim
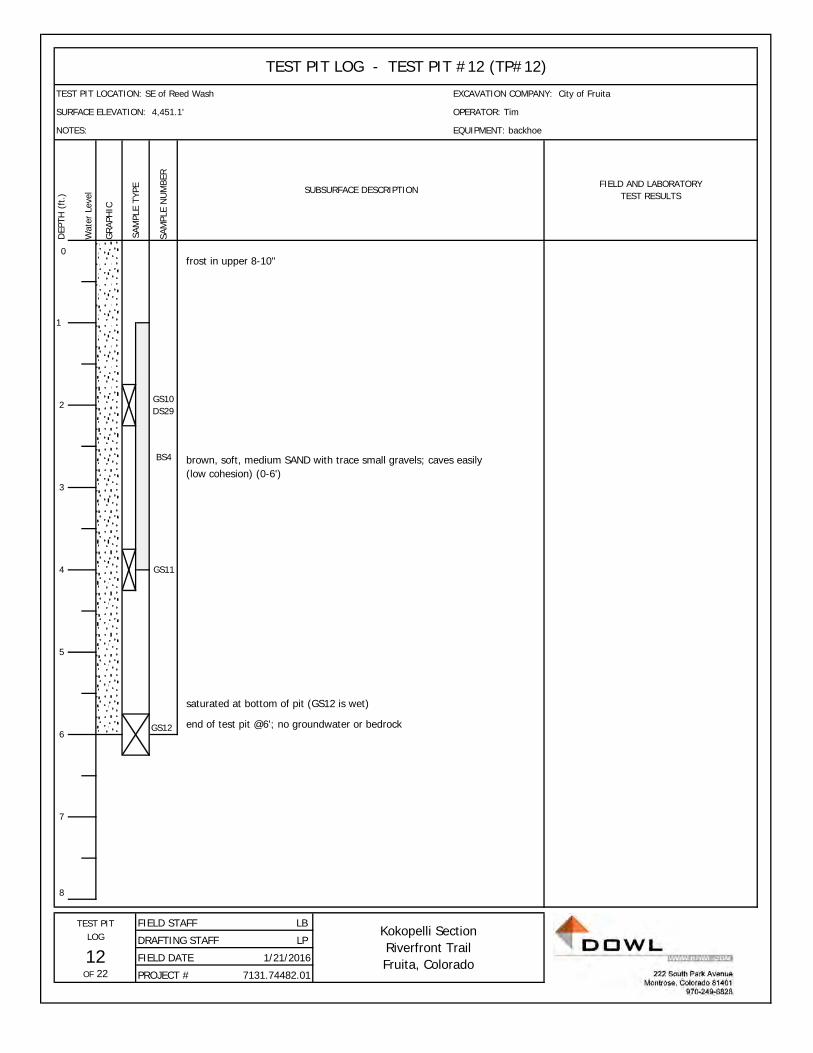
DEP
TH (
ft.)
Wat
er L
evel
GRA
PHIC
SAM
PLE
NU
MBE
R
0
BS4
GS12
FIELD STAFF LB
DRAFTING STAFF LP
FIELD DATE
PROJECT #
saturated at bottom of pit (GS12 is wet)
GS11
TEST PITKokopelli Section Riverfront Trail Fruita, Colorado
LOG
12 1/21/2016OF 22 7131.74482.01
7
8
6end of test pit @6'; no groundwater or bedrock
5
GS10 DS29
3
brown, soft, medium SAND with trace small gravels; caves easily (low cohesion) (0-6')
4
1
frost in upper 8-10"
2
NOTES: EQUIPMENT: backhoeSA
MPL
E TY
PE SUBSURFACE DESCRIPTIONFIELD AND LABORATORY
TEST RESULTS
TEST PIT LOG - TEST PIT #12 (TP#12)
TEST PIT LOCATION: SE of Reed Wash EXCAVATION COMPANY: City of Fruita
SURFACE ELEVATION: 4,451.1' OPERATOR: Tim
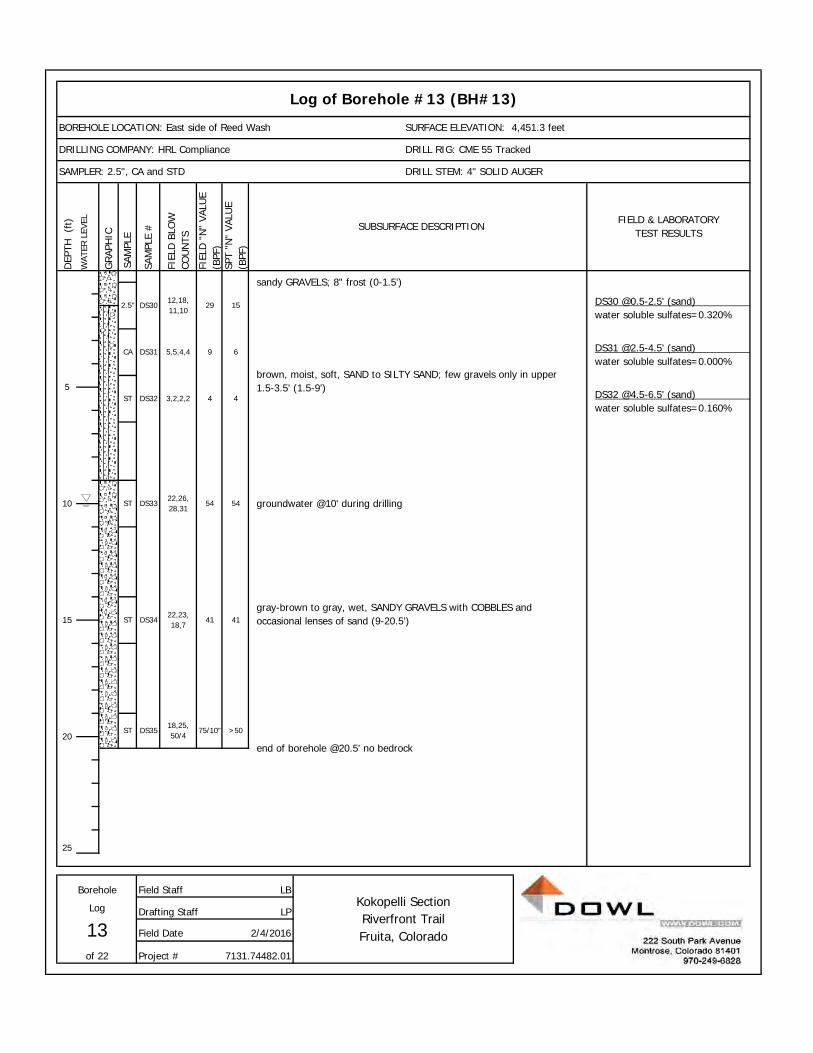
DEP
TH
(ft)
WAT
ER L
EVEL
GRA
PHIC
SAM
PLE
#
FIEL
D B
LOW
CO
UN
TS
FIEL
D "
N"
VALU
E (B
PF)
SPT
"N"
VALU
E (B
PF)
25
LB
LP
sandy GRAVELS; 8" frost (0-1.5')
DS30 @0.5-2.5' (sand) water soluble sulfates=0.320%
DS31 @2.5-4.5' (sand) water soluble sulfates=0.000%
DS32 @4.5-6.5' (sand) water soluble sulfates=0.160%
brown, moist, soft, SAND to SILTY SAND; few gravels only in upper 1.5-3.5' (1.5-9')
SURFACE ELEVATION: 4,451.3 feet
12,18, 11,10
Log of Borehole #13 (BH#13)
DRILLING COMPANY: HRL Compliance DRILL RIG: CME 55 Tracked
SAMPLER: 2.5", CA and STD DRILL STEM: 4" SOLID AUGER
SAM
PLE
SUBSURFACE DESCRIPTIONFIELD & LABORATORY
TEST RESULTS
29 152.5" DS30
BOREHOLE LOCATION: East side of Reed Wash
5ST DS32 3,2,2,2
CA DS31 5,5,4,4 9 6
54 54
4 4
groundwater @10' during drilling
ST DS331022,26, 28,31
>50
15
ST DS3518,25, 50/4
ST DS3422,23, 18,7
41 41gray-brown to gray, wet, SANDY GRAVELS with COBBLES and occasional lenses of sand (9-20.5')
end of borehole @20.5' no bedrock
Kokopelli Section Riverfront Trail Fruita, Colorado
Log Drafting Staff
13 Field Date 2/4/2016
of 22 Project # 7131.74482.01
Borehole Field Staff
2075/10"
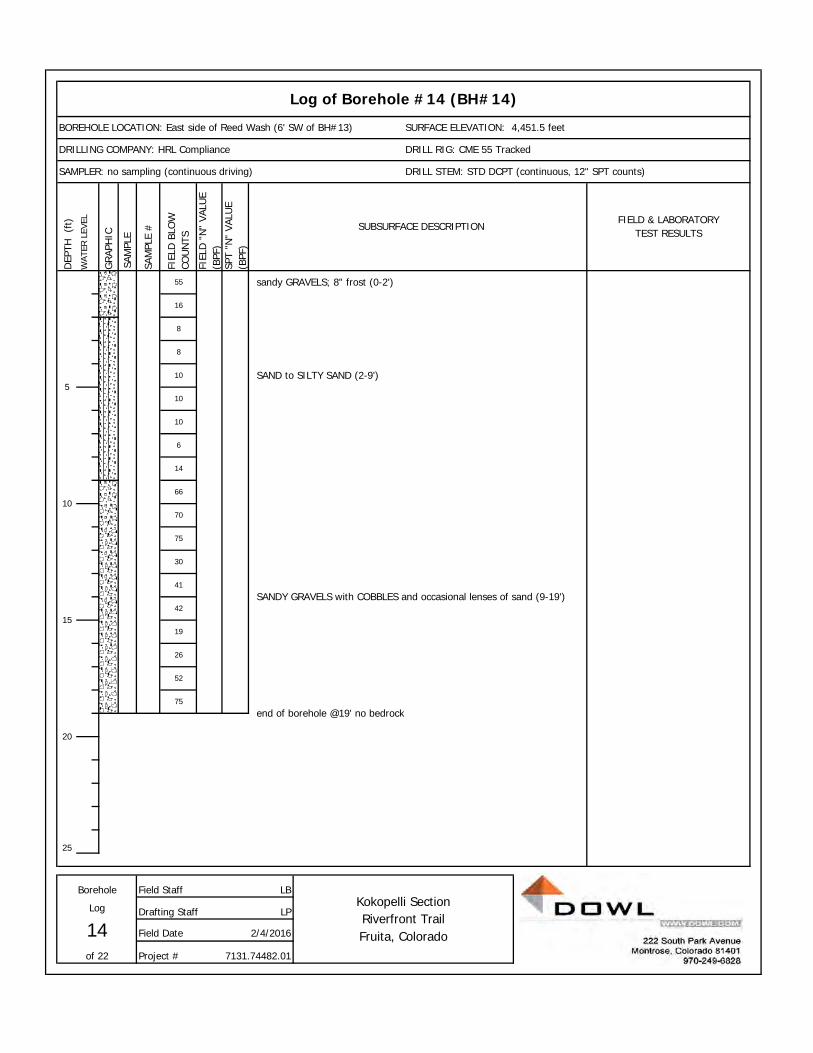
DEP
TH
(ft)
WAT
ER L
EVEL
GRA
PHIC
SAM
PLE
#
FIEL
D B
LOW
CO
UN
TS
FIEL
D "
N"
VALU
E (B
PF)
SPT
"N"
VALU
E (B
PF)
25
LB
LP
Log of Borehole #14 (BH#14)
DRILLING COMPANY: HRL Compliance DRILL RIG: CME 55 Tracked
SAMPLER: no sampling (continuous driving) DRILL STEM: STD DCPT (continuous, 12" SPT counts)
BOREHOLE LOCATION: East side of Reed Wash (6' SW of BH#13) SURFACE ELEVATION: 4,451.5 feetSA
MPL
E
SUBSURFACE DESCRIPTIONFIELD & LABORATORY
TEST RESULTS
SAND to SILTY SAND (2-9')
16
sandy GRAVELS; 8" frost (0-2')
8
10
510
10
6
14
66
70
20
15
42SANDY GRAVELS with COBBLES and occasional lenses of sand (9-19')
52
75
end of borehole @19' no bedrock
Borehole Field StaffKokopelli Section Riverfront Trail Fruita, Colorado
Log Drafting Staff
14 Field Date 2/4/2016
of 22 Project # 7131.74482.01
55
8
10
75
30
41
19
26

DEP
TH
(ft)
WAT
ER L
EVEL
GRA
PHIC
SAM
PLE
#
FIEL
D B
LOW
CO
UN
TS
FIEL
D "
N"
VALU
E (B
PF)
SPT
"N"
VALU
E (B
PF)
25
LB
LP
Log of Borehole #15 (BH#15)
DRILLING COMPANY: HRL Compliance DRILL RIG: CME 55 Tracked
SAMPLER: 2.5", CA and STD DRILL STEM: 4" SOLID AUGER
BOREHOLE LOCATION: North side I-70 before Loma off-ramp SURFACE ELEVATION: 4,493.9 feet
SUBSURFACE DESCRIPTIONFIELD & LABORATORY
TEST RESULTS
24
SAM
PLE
brown, dry, clayey/silty FINE SAND; salts (0-6.5')
6" frost
8,12, 12,13
1724
5
122.5"
CA
ST
DS36
DS37
DS38
12,10, 14,12
9,12, 9,8
21 21
10
20
Borehole Field StaffKokopelli Section Riverfront Trail Fruita, Colorado
Log Drafting Staff
15 Field Date 2/4/2016
of 22
15
Project # 7131.74482.01
end of borehole @6.5'; no groundwater or bedrock
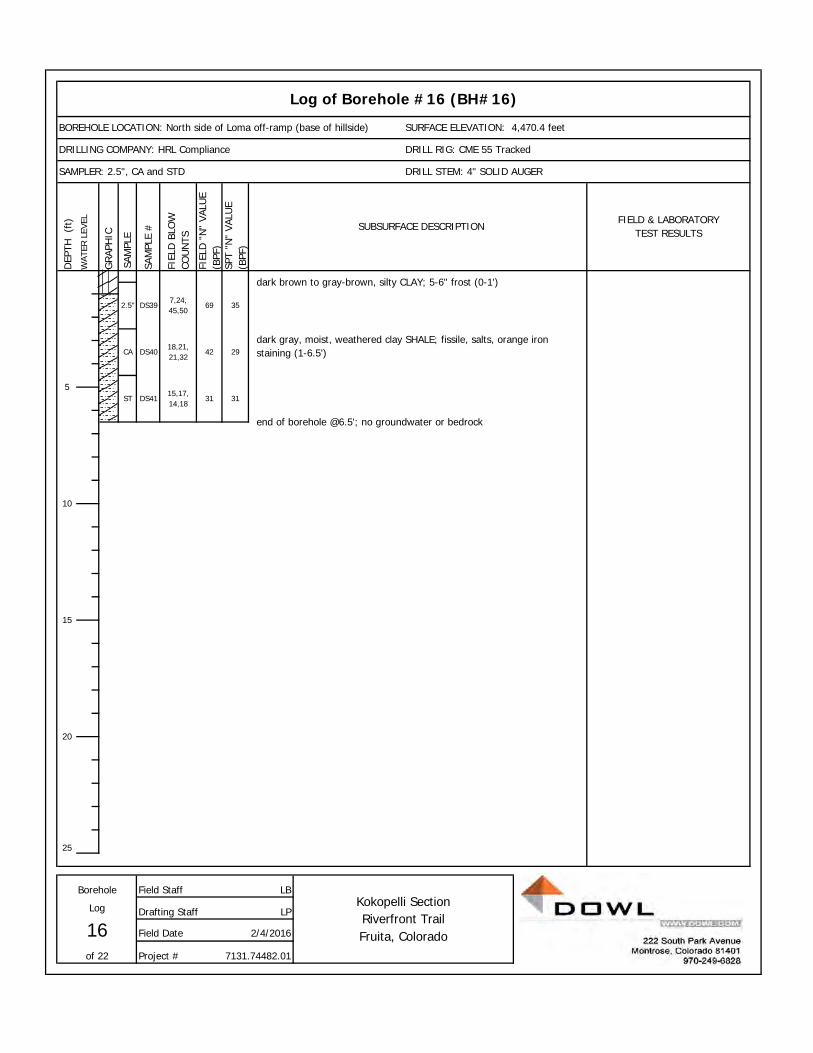
DEP
TH
(ft)
WAT
ER L
EVEL
GRA
PHIC
SAM
PLE
#
FIEL
D B
LOW
CO
UN
TS
FIEL
D "
N"
VALU
E (B
PF)
SPT
"N"
VALU
E (B
PF)
25
LB
LP
Log of Borehole #16 (BH#16)
DRILLING COMPANY: HRL Compliance DRILL RIG: CME 55 Tracked
BOREHOLE LOCATION: North side of Loma off-ramp (base of hillside) SURFACE ELEVATION: 4,470.4 feet
SAMPLER: 2.5", CA and STD DRILL STEM: 4" SOLID AUGER
SAM
PLE
SUBSURFACE DESCRIPTIONFIELD & LABORATORY
TEST RESULTS
dark brown to gray-brown, silty CLAY; 5-6" frost (0-1')
CA DS4018,21, 21,32
42 29dark gray, moist, weathered clay SHALE; fissile, salts, orange iron staining (1-6.5')
35DS397,24, 45,50
69
20
15
10
2.5"
5ST DS41
15,17, 14,18
31 31
end of borehole @6.5'; no groundwater or bedrock
Borehole Field StaffKokopelli Section Riverfront Trail Fruita, Colorado
Log Drafting Staff
Field Date 2/4/2016
of 22 Project # 7131.74482.01
16
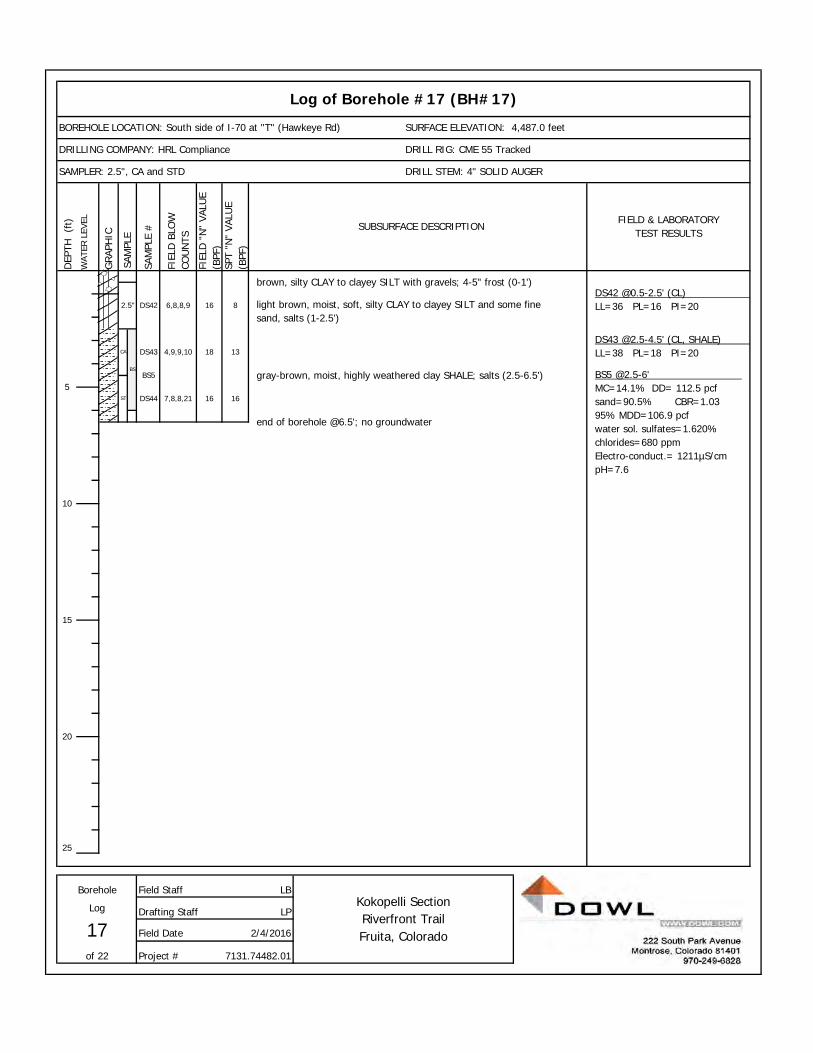
DEP
TH
(ft)
WAT
ER L
EVEL
GRA
PHIC
SAM
PLE
#
FIEL
D B
LOW
CO
UN
TS
FIEL
D "
N"
VALU
E (B
PF)
SPT
"N"
VALU
E (B
PF)
25
LB
LP
SUBSURFACE DESCRIPTIONFIELD & LABORATORY
TEST RESULTS
Log of Borehole #17 (BH#17)
DRILLING COMPANY: HRL Compliance DRILL RIG: CME 55 Tracked
BOREHOLE LOCATION: South side of I-70 at "T" (Hawkeye Rd) SURFACE ELEVATION: 4,487.0 feet
DRILL STEM: 4" SOLID AUGER
2.5" DS42
SAMPLER: 2.5", CA and STD
BS
6,8,8,9 16 8
18 13
57,8,8,21
brown, silty CLAY to clayey SILT with gravels; 4-5" frost (0-1')
light brown, moist, soft, silty CLAY to clayey SILT and some fine sand, salts (1-2.5')
SAM
PLE
15
10
end of borehole @6.5'; no groundwater
20
Borehole Field StaffKokopelli Section Riverfront Trail Fruita, Colorado
Log Drafting Staff
17 Field Date 2/4/2016
of 22 Project # 7131.74482.01
CA
ST
DS43
DS44
BS5
16 16
4,9,9,10
gray-brown, moist, highly weathered clay SHALE; salts (2.5-6.5')
DS42 @0.5-2.5' (CL) LL=36 PL=16 PI=20
DS43 @2.5-4.5' (CL, SHALE) LL=38 PL=18 PI=20
BS5 @2.5-6' MC=14.1% DD= 112.5 pcf sand=90.5% CBR=1.03 95% MDD=106.9 pcf water sol. sulfates=1.620% chlorides=680 ppm Electro-conduct.= 1211µS/cm pH=7.6
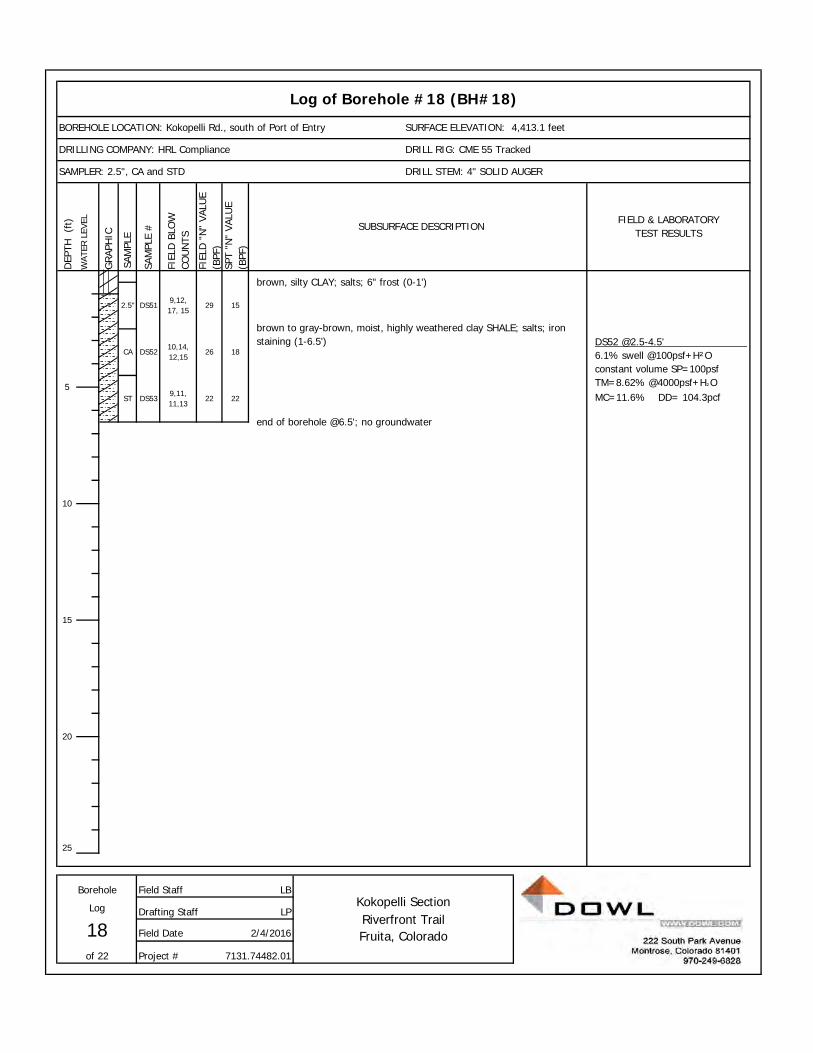
DEP
TH
(ft)
WAT
ER L
EVEL
GRA
PHIC
SAM
PLE
#
FIEL
D B
LOW
CO
UN
TS
FIEL
D "
N"
VALU
E (B
PF)
SPT
"N"
VALU
E (B
PF)
25
LB
LP
DS52 @2.5-4.5' 6.1% swell @100psf+H²O constant volume SP=100psf TM=8.62% @4000psf+H²O MC=11.6% DD= 104.3pcf
5
15
10
end of borehole @6.5'; no groundwater
Log of Borehole #18 (BH#18)
DRILLING COMPANY: HRL Compliance DRILL RIG: CME 55 Tracked
2.5" DS51
SAMPLER: 2.5", CA and STD DRILL STEM: 4" SOLID AUGER
SAM
PLE
SUBSURFACE DESCRIPTIONFIELD & LABORATORY
TEST RESULTS
BOREHOLE LOCATION: Kokopelli Rd., south of Port of Entry
22ST
15
brown, silty CLAY; salts; 6" frost (0-1')
brown to gray-brown, moist, highly weathered clay SHALE; salts; iron staining (1-6.5')
of 22 Project # 7131.74482.01
SURFACE ELEVATION: 4,413.1 feet
9,12, 17, 15
29
22
DS5210,14, 12,15
26 18CA
DS539,11, 11,13
20
Borehole Field StaffKokopelli Section Riverfront Trail Fruita, Colorado
Log Drafting Staff
18 Field Date 2/4/2016

DEP
TH
(ft)
WAT
ER L
EVEL
GRA
PHIC
SAM
PLE
#
FIEL
D B
LOW
CO
UN
TS
FIEL
D "
N"
VALU
E (B
PF)
SPT
"N"
VALU
E (B
PF)
25
LB
LP
SURFACE ELEVATION: 4,437.6 feet
6,10, 13,12
23 12
CA
8,10, 14,11
24
Log of Borehole #19 (BH#19)
DRILLING COMPANY: HRL Compliance DRILL RIG: CME 55 Tracked
2.5" DS54
SAMPLER: 2.5", CA and STD DRILL STEM: 4" SOLID AUGER
SAM
PLE
SUBSURFACE DESCRIPTIONFIELD & LABORATORY
TEST RESULTS
BOREHOLE LOCATION: Top of ridge at BLM boundary (fenceline)
brown, silty CLAY; abundant slats (0-1')
brown to gray-brown, moist, highly weathered clay SHALE; salts; iron staining (1-6.5')
end of borehole @6.5'; no groundwater
20
15
10
245
ST DS56
DS556,12, 11,11
23 16
Borehole Field StaffKokopelli Section Riverfront Trail Fruita, Colorado
Log Drafting Staff
19 Field Date 2/4/2016
of 22 Project # 7131.74482.01
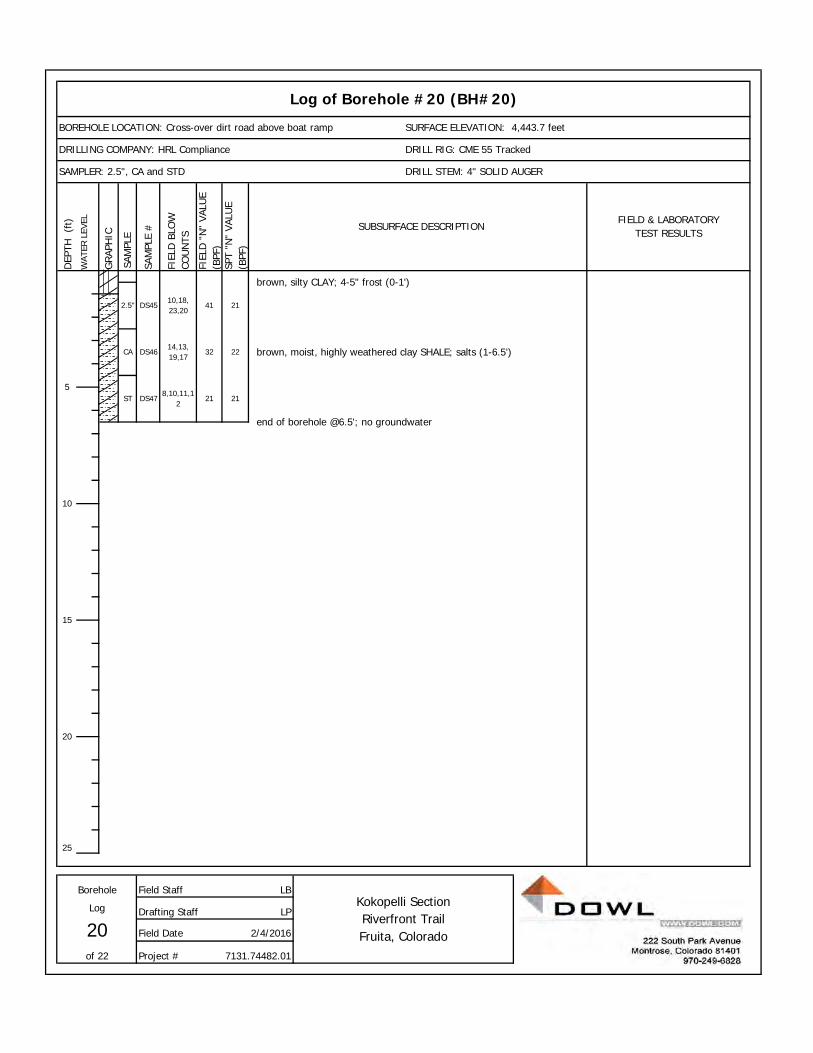
DEP
TH
(ft)
WAT
ER L
EVEL
GRA
PHIC
SAM
PLE
#
FIEL
D B
LOW
CO
UN
TS
FIEL
D "
N"
VALU
E (B
PF)
SPT
"N"
VALU
E (B
PF)
25
LB
LP
brown, silty CLAY; 4-5" frost (0-1')
end of borehole @6.5'; no groundwater
BOREHOLE LOCATION: Cross-over dirt road above boat ramp SURFACE ELEVATION: 4,443.7 feet
SAMPLER: 2.5", CA and STD DRILL STEM: 4" SOLID AUGER
SAM
PLE
SUBSURFACE DESCRIPTIONFIELD & LABORATORY
TEST RESULTS
8,10,11,12
21 21
Log of Borehole #20 (BH#20)
DRILLING COMPANY: HRL Compliance DRILL RIG: CME 55 Tracked
brown, moist, highly weathered clay SHALE; salts (1-6.5')CA DS4614,13, 19,17
2.5" DS45
32 22
10,18, 23,20
41 21
10
5ST DS47
Field Staff
15
20
20 Field Date
Kokopelli Section Riverfront Trail Fruita, Colorado
Log Drafting Staff
2/4/2016
of 22 Project # 7131.74482.01
Borehole
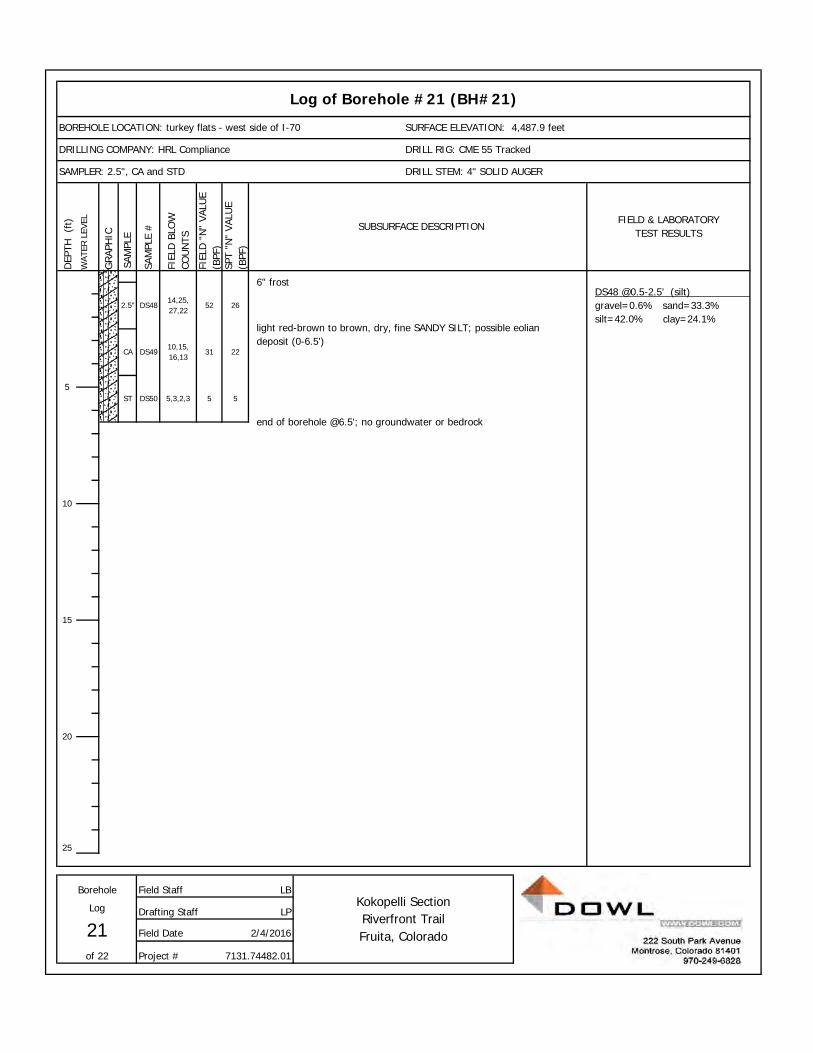
DEP
TH
(ft)
WAT
ER L
EVEL
GRA
PHIC
SAM
PLE
#
FIEL
D B
LOW
CO
UN
TS
FIEL
D "
N"
VALU
E (B
PF)
SPT
"N"
VALU
E (B
PF)
25
LB
LP
BOREHOLE LOCATION: turkey flats - west side of I-70 SURFACE ELEVATION: 4,487.9 feet
SAMPLER: 2.5", CA and STD DRILL STEM: 4" SOLID AUGER
SAM
PLE
SUBSURFACE DESCRIPTIONFIELD & LABORATORY
TEST RESULTS
Log of Borehole #21 (BH#21)
DRILLING COMPANY: HRL Compliance DRILL RIG: CME 55 Tracked
CA DS4910,15, 16,13
2.5" DS48
31 22
14,25, 27,22
52 26
DS48 @0.5-2.5' (silt) gravel=0.6% sand=33.3% silt=42.0% clay=24.1%
light red-brown to brown, dry, fine SANDY SILT; possible eolian deposit (0-6.5')
5,3,2,3 5 5
end of borehole @6.5'; no groundwater or bedrock
Borehole Field Staff
15
20
10
5ST DS50
Log Drafting Staff
2/4/2016
Kokopelli Section Riverfront Trail Fruita, Colorado
of 22 Project # 7131.74482.01
21 Field Date
6" frost
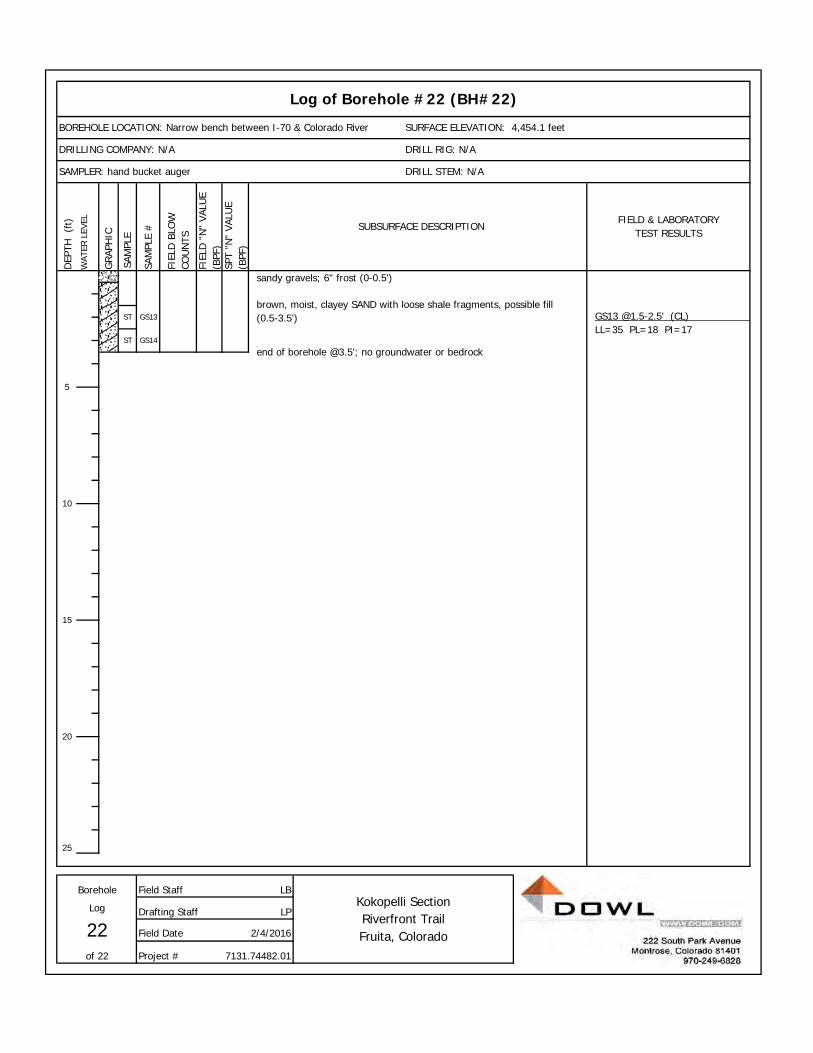
DEP
TH
(ft)
WAT
ER L
EVEL
GRA
PHIC
SAM
PLE
#
FIEL
D B
LOW
CO
UN
TS
FIEL
D "
N"
VALU
E (B
PF)
SPT
"N"
VALU
E (B
PF)
25
LB
LP
ST
ST
GS14
GS13
22 Field Date 2/4/2016
of 22 Project # 7131.74482.01
Borehole Field StaffKokopelli Section Riverfront Trail Fruita, Colorado
Log Drafting Staff
20
15
10
5
end of borehole @3.5'; no groundwater or bedrock
Log of Borehole #22 (BH#22)
DRILLING COMPANY: N/A DRILL RIG: N/A
SAMPLER: hand bucket auger DRILL STEM: N/A
SAM
PLE
SUBSURFACE DESCRIPTIONFIELD & LABORATORY
TEST RESULTS
BOREHOLE LOCATION: Narrow bench between I-70 & Colorado River SURFACE ELEVATION: 4,454.1 feet
brown, moist, clayey SAND with loose shale fragments, possible fill (0.5-3.5') GS13 @1.5-2.5' (CL)
LL=35 PL=18 PI=17
sandy gravels; 6" frost (0-0.5')
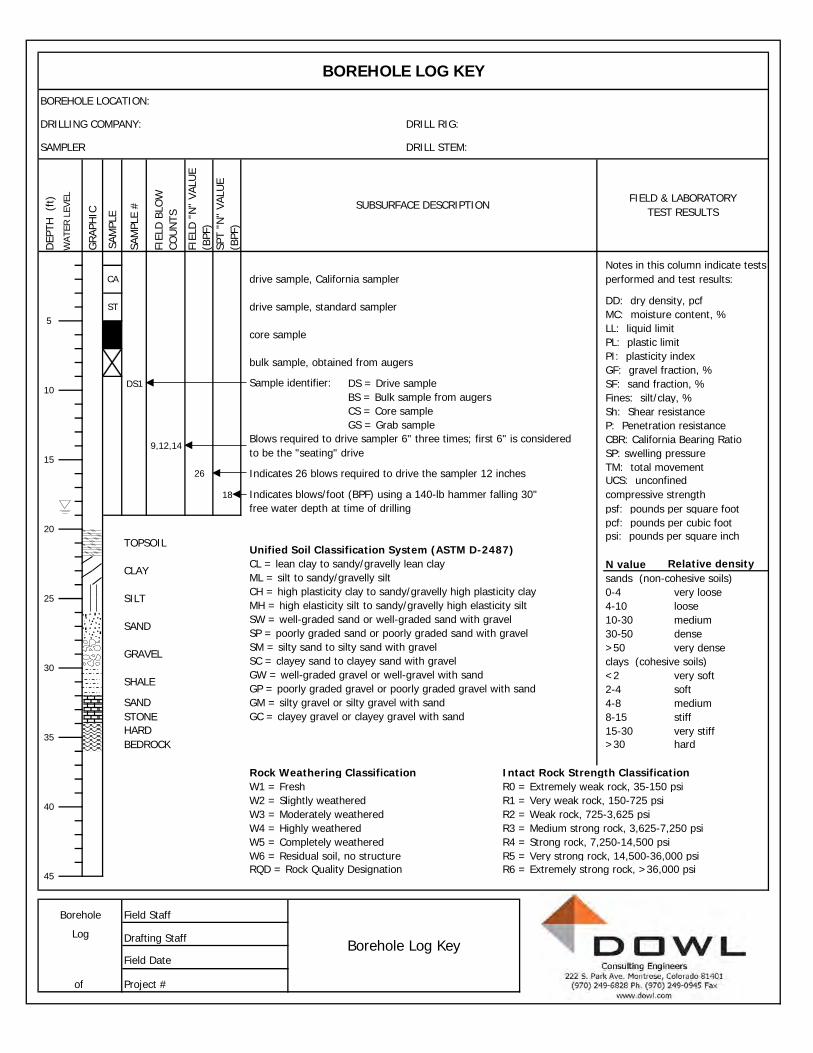
DEP
TH
(ft)
WAT
ER L
EVEL
GR
APH
IC
SAM
PLE
#
FIEL
D B
LOW
CO
UN
TS
FIEL
D "
N"
VALU
E (B
PF)
SPT
"N"
VALU
E (B
PF)
DD: dry density, pcfMC: moisture content, %LL: liquid limitPL: plastic limitPI: plasticity indexGF: gravel fraction, %
DS1 SF: sand fraction, %Fines: silt/clay, %Sh: Shear resistanceP: Penetration resistanceCBR: California Bearing RatioSP: swelling pressureTM: total movement
18
psf: pounds per square footpcf: pounds per cubic foot
N valuesands (non-cohesive soils)0-4 very loose4-10 loose10-30 medium30-50 dense>50 very denseclays (cohesive soils)<2 very soft2-4 soft4-8 medium8-15 stiff15-30 very stiff
Rock Weathering Classification Intact Rock Strength ClassificationW1 = Fresh R0 = Extremely weak rock, 35-150 psiW2 = Slightly weathered R1 = Very weak rock, 150-725 psiW3 = Moderately weathered R2 = Weak rock, 725-3,625 psiW4 = Highly weathered R3 = Medium strong rock, 3,625-7,250 psiW5 = Completely weathered R4 = Strong rock, 7,250-14,500 psiW6 = Residual soil, no structure R5 = Very strong rock, 14,500-36,000 psi
SP = poorly graded sand or poorly graded sand with gravel
GS = Grab sample
SM = silty sand to silty sand with gravel
26
9,12,14
TOPSOIL
CLAY
Blows required to drive sampler 6" three times; first 6" is considered to be the "seating" drive
CL = lean clay to sandy/gravelly lean clayML = silt to sandy/gravelly siltCH = high plasticity clay to sandy/gravelly high plasticity clayMH = high elasticity silt to sandy/gravelly high elasticity siltSW = well-graded sand or well-graded sand with gravel
CS = Core sample
Sample identifier:
drive sample, standard sampler
Notes in this column indicate tests performed and test results:
BS = Bulk sample from augers
core sample
bulk sample, obtained from augers
DS = Drive sample
BOREHOLE LOG KEY
BOREHOLE LOCATION:
DRILLING COMPANY: DRILL RIG:
20
15
10
5
SAMPLER DRILL STEM:
SAM
PLE
SUBSURFACE DESCRIPTIONFIELD & LABORATORY
TEST RESULTS
CA drive sample, California sampler
ST
25
GRAVEL
SHALE
SILT
SAND
45RQD = Rock Quality Designation
40
35
30
SAND STONE
SC = clayey sand to clayey sand with gravel
R6 = Extremely strong rock, >36,000 psi
hard>30
GC = clayey gravel or clayey gravel with sand
GW = well-graded gravel or well-gravel with sandGP = poorly graded gravel or poorly graded gravel with sandGM = silty gravel or silty gravel with sand
HARD BEDROCK
Borehole Field Staff
Log Drafting Staff
Field Date
of Project #
Borehole Log Key
UCS: unconfined compressive strength
Relative density
psi: pounds per square inch
Indicates blows/foot (BPF) using a 140-lb hammer falling 30"free water depth at time of drilling
Indicates 26 blows required to drive the sampler 12 inches
Unified Soil Classification System (ASTM D-2487)
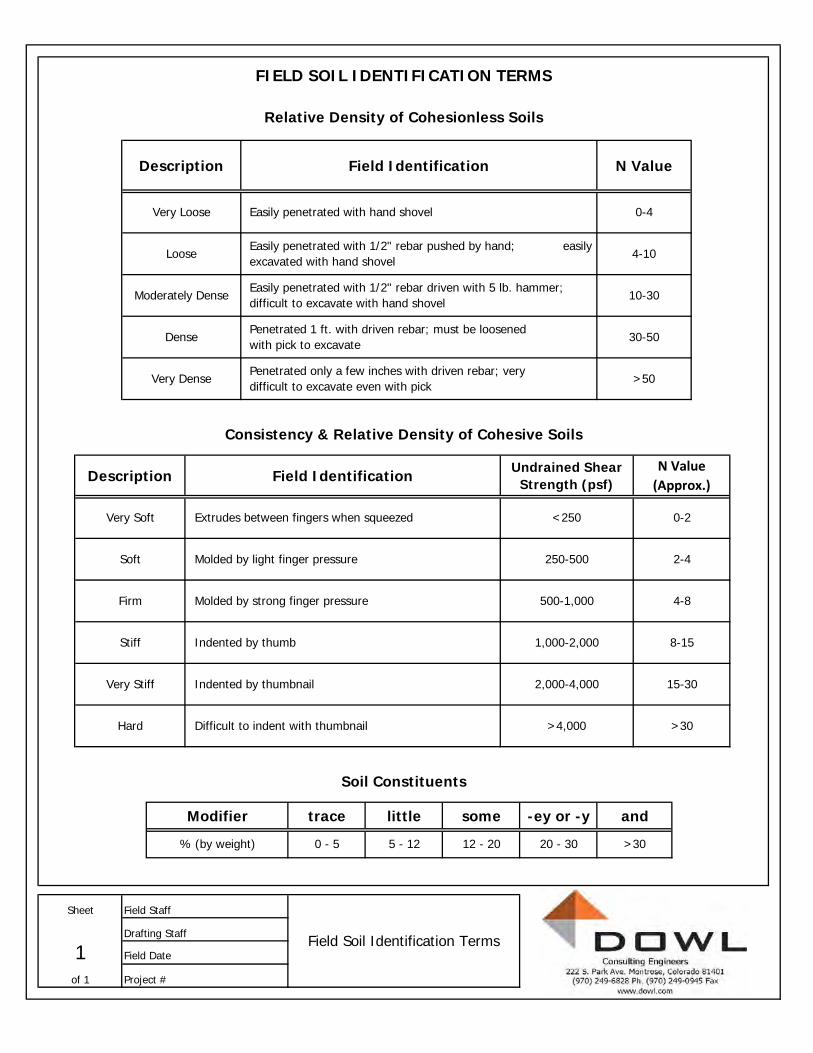
Penetrated 1 ft. with driven rebar; must be loosened with pick to excavate
Penetrated only a few inches with driven rebar; very difficult to excavate even with pick
Relative Density of Cohesionless Soils
Consistency & Relative Density of Cohesive Soils
0-4
4-10
10-30
30-50
>50
Easily penetrated with hand shovel
Easily penetrated with 1/2" rebar pushed by hand; easily excavated with hand shovel
Easily penetrated with 1/2" rebar driven with 5 lb. hammer; difficult to excavate with hand shovel
Field Identification N Value
Moderately Dense
Very Loose
250-500
500-1,000
1,000-2,000
2,000-4,000
>4,000
0-2
2-4
4-8
8-15
15-30
Firm
Stiff
Very Stiff
Hard
>30
Modifier trace little some -ey or -y and
% (by weight) 0 - 5 5 - 12 12 - 20 20 - 30
Soil Constituents
Dense
Very Dense
Drafting Staff
1 Field Date
of 1 Project #
Sheet Field Staff
Field Soil Identification Terms
Undrained Shear Strength (psf)
Loose
Description
FIELD SOIL IDENTIFICATION TERMS
Difficult to indent with thumbnail >30
N Value (Approx.)
Very Soft Extrudes between fingers when squeezed <250
Molded by light finger pressure
Molded by strong finger pressure
Indented by thumb
Indented by thumbnail
Description Field Identification
Soft

LABORATORY GRAPHICS
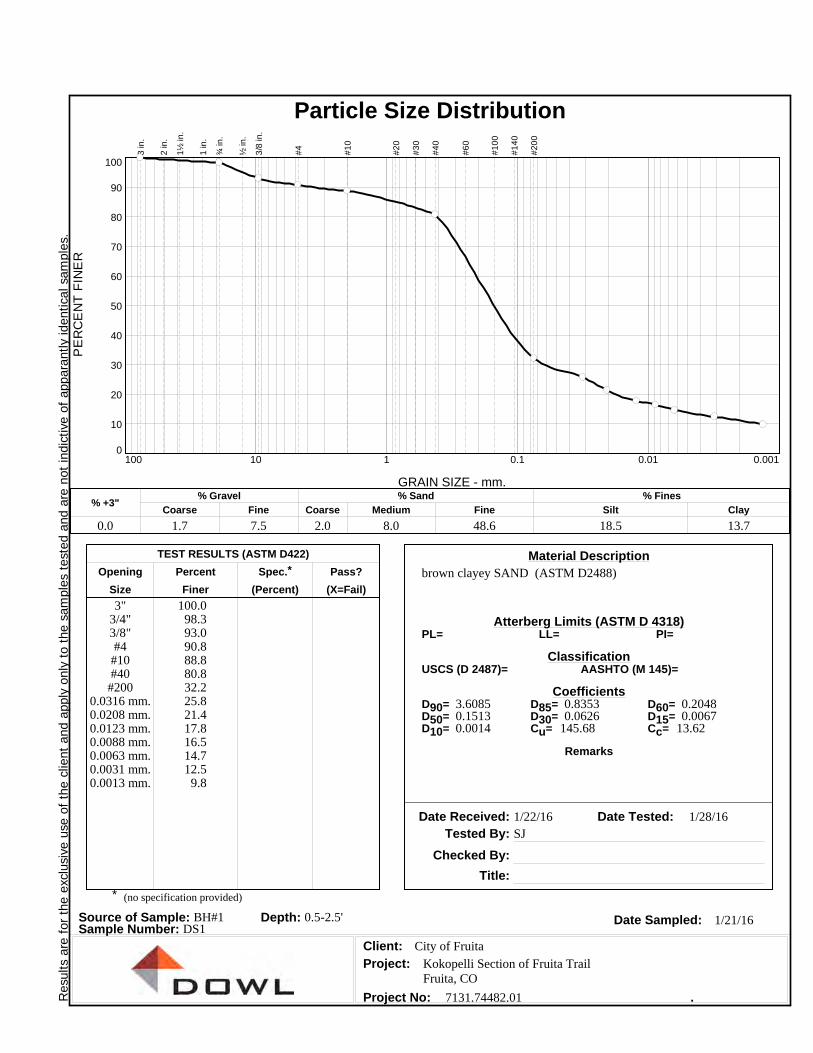
Resu
lts
are
fo
r th
e e
xclu
sive
use
of
the
clie
nt
and
ap
ply
only
to
the s
am
ple
s te
sted
and a
re n
ot
ind
ictive
of
app
ara
ntly
iden
tica
l sa
mp
les.
(no specification provided)*
PL= LL= PI=
USCS (D 2487)= AASHTO (M 145)=
D90= D85= D60=D50= D30= D15=D10= Cu= Cc=
Remarks
brown clayey SAND (ASTM D2488)
3"3/4"3/8"#4
#10#40
#2000.0316 mm.0.0208 mm.0.0123 mm.0.0088 mm.0.0063 mm.0.0031 mm.0.0013 mm.
100.098.393.090.888.880.832.225.821.417.816.514.712.5
9.8
3.6085 0.8353 0.20480.1513 0.0626 0.00670.0014 145.68 13.62
1/22/16 1/28/16
SJ
1/21/16
City of Fruita
Kokopelli Section of Fruita TrailFruita, CO
7131.74482.01
Material Description
Atterberg Limits (ASTM D 4318)
Classification
Coefficients
Date Received: Date Tested:
Tested By:
Checked By:
Title:
Date Sampled:Source of Sample: BH#1 Depth: 0.5-2.5'Sample Number: DS1
Client:
Project:
Project No: .
TEST RESULTS (ASTM D422)
Opening Percent Spec.* Pass?
Size Finer (Percent) (X=Fail)
PE
RC
EN
T F
INE
R
0
10
20
30
40
50
60
70
80
90
100
GRAIN SIZE - mm.
0.0010.010.1110100
% +3"Coarse
% Gravel
Fine Coarse Medium
% Sand
Fine Silt
% Fines
Clay
0.0 1.7 7.5 2.0 8.0 48.6 18.5 13.7
3 in
.
2 in
.
1½
in.
1 in
.
¾ in
.
½ in
.
3/8
in.
#4
#1
0
#2
0
#3
0
#4
0
#6
0
#1
00
#1
40
#2
00
Particle Size Distribution
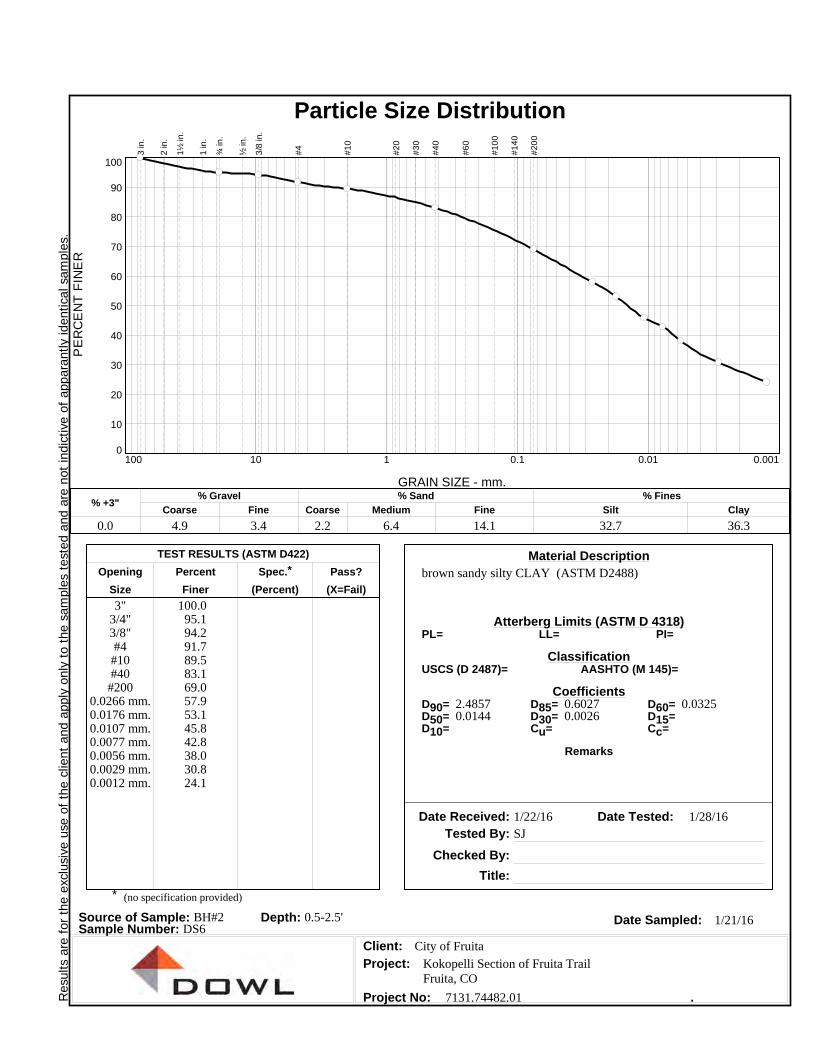
Resu
lts
are
fo
r th
e e
xclu
sive
use
of
the
clie
nt
and
ap
ply
only
to
the s
am
ple
s te
sted
and a
re n
ot
ind
ictive
of
app
ara
ntly
iden
tica
l sa
mp
les.
(no specification provided)*
PL= LL= PI=
USCS (D 2487)= AASHTO (M 145)=
D90= D85= D60=D50= D30= D15=D10= Cu= Cc=
Remarks
brown sandy silty CLAY (ASTM D2488)
3"3/4"3/8"#4
#10#40
#2000.0266 mm.0.0176 mm.0.0107 mm.0.0077 mm.0.0056 mm.0.0029 mm.0.0012 mm.
100.095.194.291.789.583.169.057.953.145.842.838.030.824.1
2.4857 0.6027 0.03250.0144 0.0026
1/22/16 1/28/16
SJ
1/21/16
City of Fruita
Kokopelli Section of Fruita TrailFruita, CO
7131.74482.01
Material Description
Atterberg Limits (ASTM D 4318)
Classification
Coefficients
Date Received: Date Tested:
Tested By:
Checked By:
Title:
Date Sampled:Source of Sample: BH#2 Depth: 0.5-2.5'Sample Number: DS6
Client:
Project:
Project No: .
TEST RESULTS (ASTM D422)
Opening Percent Spec.* Pass?
Size Finer (Percent) (X=Fail)
PE
RC
EN
T F
INE
R
0
10
20
30
40
50
60
70
80
90
100
GRAIN SIZE - mm.
0.0010.010.1110100
% +3"Coarse
% Gravel
Fine Coarse Medium
% Sand
Fine Silt
% Fines
Clay
0.0 4.9 3.4 2.2 6.4 14.1 32.7 36.3
3 in
.
2 in
.
1½
in.
1 in
.
¾ in
.
½ in
.
3/8
in.
#4
#1
0
#2
0
#3
0
#4
0
#6
0
#1
00
#1
40
#2
00
Particle Size Distribution
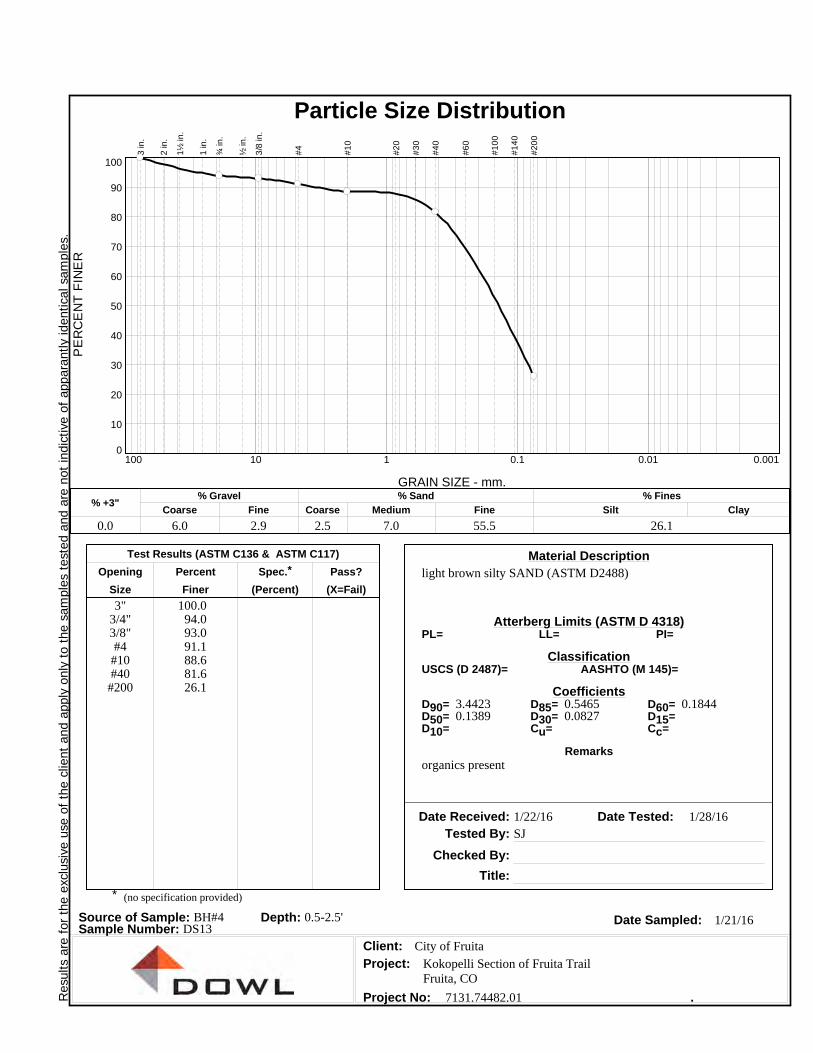
Resu
lts
are
fo
r th
e e
xclu
sive
use
of
the
clie
nt
and
ap
ply
only
to
the s
am
ple
s te
sted
and a
re n
ot
ind
ictive
of
app
ara
ntly
iden
tica
l sa
mp
les.
(no specification provided)*
PL= LL= PI=
USCS (D 2487)= AASHTO (M 145)=
D90= D85= D60=D50= D30= D15=D10= Cu= Cc=
Remarks
light brown silty SAND (ASTM D2488)
3"3/4"3/8"#4
#10#40
#200
100.094.093.091.188.681.626.1
3.4423 0.5465 0.18440.1389 0.0827
organics present
1/22/16 1/28/16
SJ
1/21/16
City of Fruita
Kokopelli Section of Fruita TrailFruita, CO
7131.74482.01
Material Description
Atterberg Limits (ASTM D 4318)
Classification
Coefficients
Date Received: Date Tested:
Tested By:
Checked By:
Title:
Date Sampled:Source of Sample: BH#4 Depth: 0.5-2.5'Sample Number: DS13
Client:
Project:
Project No: .
Test Results (ASTM C136 & ASTM C117)
Opening Percent Spec.* Pass?
Size Finer (Percent) (X=Fail)
PE
RC
EN
T F
INE
R
0
10
20
30
40
50
60
70
80
90
100
GRAIN SIZE - mm.
0.0010.010.1110100
% +3"Coarse
% Gravel
Fine Coarse Medium
% Sand
Fine Silt
% Fines
Clay
0.0 6.0 2.9 2.5 7.0 55.5 26.1
3 in
.
2 in
.
1½
in.
1 in
.
¾ in
.
½ in
.
3/8
in.
#4
#1
0
#2
0
#3
0
#4
0
#6
0
#1
00
#1
40
#2
00
Particle Size Distribution
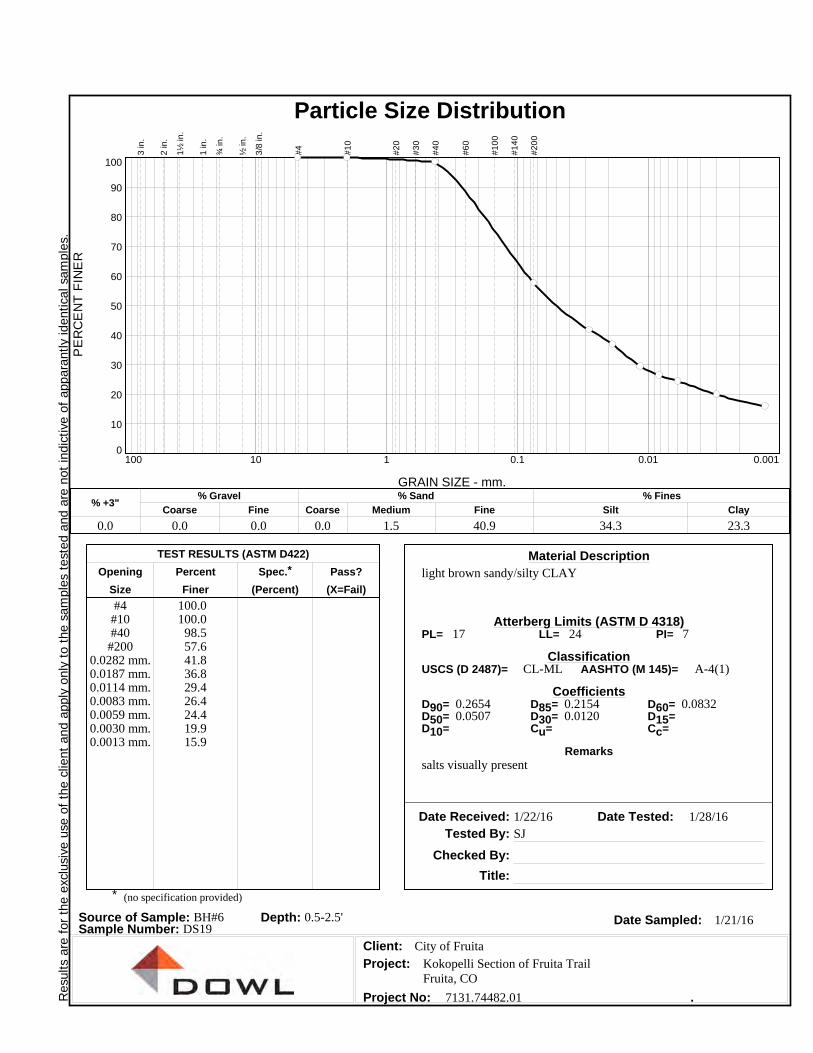
Resu
lts
are
fo
r th
e e
xclu
sive
use
of
the
clie
nt
and
ap
ply
only
to
the s
am
ple
s te
sted
and a
re n
ot
ind
ictive
of
app
ara
ntly
iden
tica
l sa
mp
les.
(no specification provided)*
PL= LL= PI=
USCS (D 2487)= AASHTO (M 145)=
D90= D85= D60=D50= D30= D15=D10= Cu= Cc=
Remarks
Material Description light brown sandy/silty CLAY
#4#10#40
#2000.0282 mm.0.0187 mm.0.0114 mm.0.0083 mm.0.0059 mm.0.0030 mm.0.0013 mm.
100.0100.0
98.557.641.836.829.426.424.419.915.9
17 24 7
CL-ML A-4(1)
0.2654 0.2154 0.08320.0507 0.0120
salts visually present
1/22/16 1/28/16
SJ
1/21/16
City of Fruita
Kokopelli Section of Fruita TrailFruita, CO
7131.74482.01
Atterberg Limits (ASTM D 4318)
Classification
Coefficients
Date Received: Date Tested:
Tested By:
Checked By:
Title:
Date Sampled:Source of Sample: BH#6 Depth: 0.5-2.5'Sample Number: DS19
Client:
Project:
Project No: .
TEST RESULTS (ASTM D422)
Opening Percent Spec.* Pass?
Size Finer (Percent) (X=Fail)
PE
RC
EN
T F
INE
R
0
10
20
30
40
50
60
70
80
90
100
GRAIN SIZE - mm.
0.0010.010.1110100
% +3"Coarse
% Gravel
Fine Coarse Medium
% Sand
Fine Silt
% Fines
Clay
0.0 0.0 0.0 0.0 1.5 40.9 34.3 23.3
3 in
.
2 in
.
1½
in.
1 in
.
¾ in
.
½ in
.
3/8
in.
#4
#1
0
#2
0
#3
0
#4
0
#6
0
#1
00
#1
40
#2
00
Particle Size Distribution
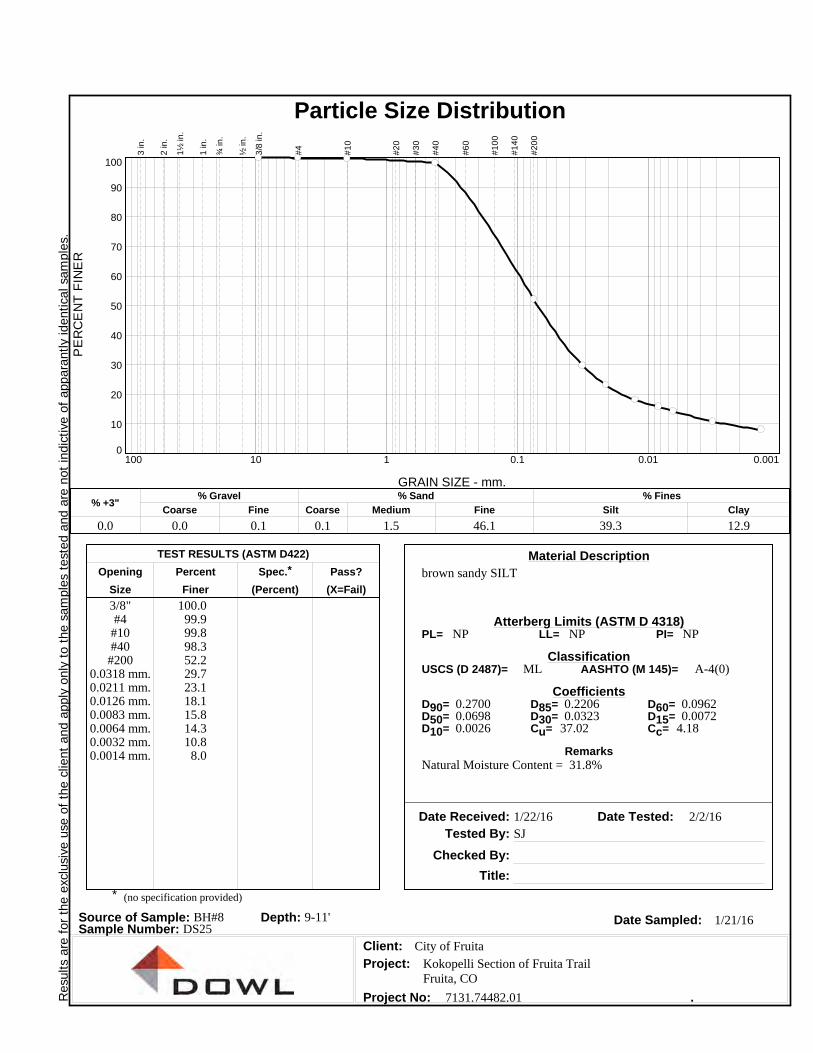
Resu
lts
are
fo
r th
e e
xclu
sive
use
of
the
clie
nt
and
ap
ply
only
to
the s
am
ple
s te
sted
and a
re n
ot
ind
ictive
of
app
ara
ntly
iden
tica
l sa
mp
les.
(no specification provided)*
PL= LL= PI=
USCS (D 2487)= AASHTO (M 145)=
D90= D85= D60=D50= D30= D15=D10= Cu= Cc=
Remarks
brown sandy SILT
3/8"#4
#10#40
#2000.0318 mm.0.0211 mm.0.0126 mm.0.0083 mm.0.0064 mm.0.0032 mm.0.0014 mm.
100.099.999.898.352.229.723.118.115.814.310.8
8.0
NP NP NP
ML A-4(0)
0.2700 0.2206 0.09620.0698 0.0323 0.00720.0026 37.02 4.18
Natural Moisture Content = 31.8%
1/22/16 2/2/16
SJ
1/21/16
City of Fruita
Kokopelli Section of Fruita TrailFruita, CO
7131.74482.01
Material Description
Atterberg Limits (ASTM D 4318)
Classification
Coefficients
Date Received: Date Tested:
Tested By:
Checked By:
Title:
Date Sampled:Source of Sample: BH#8 Depth: 9-11'Sample Number: DS25
Client:
Project:
Project No: .
TEST RESULTS (ASTM D422)
Opening Percent Spec.* Pass?
Size Finer (Percent) (X=Fail)
PE
RC
EN
T F
INE
R
0
10
20
30
40
50
60
70
80
90
100
GRAIN SIZE - mm.
0.0010.010.1110100
% +3"Coarse
% Gravel
Fine Coarse Medium
% Sand
Fine Silt
% Fines
Clay
0.0 0.0 0.1 0.1 1.5 46.1 39.3 12.9
3 in
.
2 in
.
1½
in.
1 in
.
¾ in
.
½ in
.
3/8
in.
#4
#1
0
#2
0
#3
0
#4
0
#6
0
#1
00
#1
40
#2
00
Particle Size Distribution
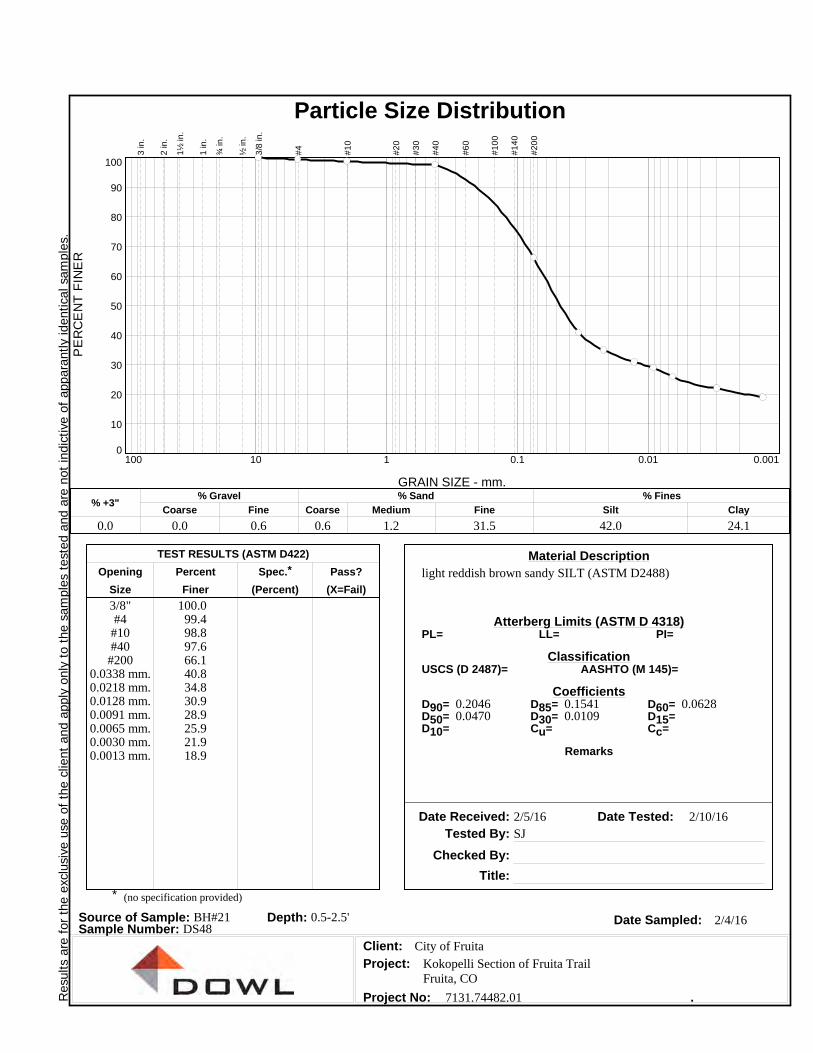
Resu
lts
are
fo
r th
e e
xclu
sive
use
of
the
clie
nt
and
ap
ply
only
to
the s
am
ple
s te
sted
and a
re n
ot
ind
ictive
of
app
ara
ntly
iden
tica
l sa
mp
les.
(no specification provided)*
PL= LL= PI=
USCS (D 2487)= AASHTO (M 145)=
D90= D85= D60=D50= D30= D15=D10= Cu= Cc=
Remarks
light reddish brown sandy SILT (ASTM D2488)
3/8"#4
#10#40
#2000.0338 mm.0.0218 mm.0.0128 mm.0.0091 mm.0.0065 mm.0.0030 mm.0.0013 mm.
100.099.498.897.666.140.834.830.928.925.921.918.9
0.2046 0.1541 0.06280.0470 0.0109
2/5/16 2/10/16
SJ
2/4/16
City of Fruita
Kokopelli Section of Fruita TrailFruita, CO
7131.74482.01
Material Description
Atterberg Limits (ASTM D 4318)
Classification
Coefficients
Date Received: Date Tested:
Tested By:
Checked By:
Title:
Date Sampled:Source of Sample: BH#21 Depth: 0.5-2.5'Sample Number: DS48
Client:
Project:
Project No: .
TEST RESULTS (ASTM D422)
Opening Percent Spec.* Pass?
Size Finer (Percent) (X=Fail)
PE
RC
EN
T F
INE
R
0
10
20
30
40
50
60
70
80
90
100
GRAIN SIZE - mm.
0.0010.010.1110100
% +3"Coarse
% Gravel
Fine Coarse Medium
% Sand
Fine Silt
% Fines
Clay
0.0 0.0 0.6 0.6 1.2 31.5 42.0 24.1
3 in
.
2 in
.
1½
in.
1 in
.
¾ in
.
½ in
.
3/8
in.
#4
#1
0
#2
0
#3
0
#4
0
#6
0
#1
00
#1
40
#2
00
Particle Size Distribution
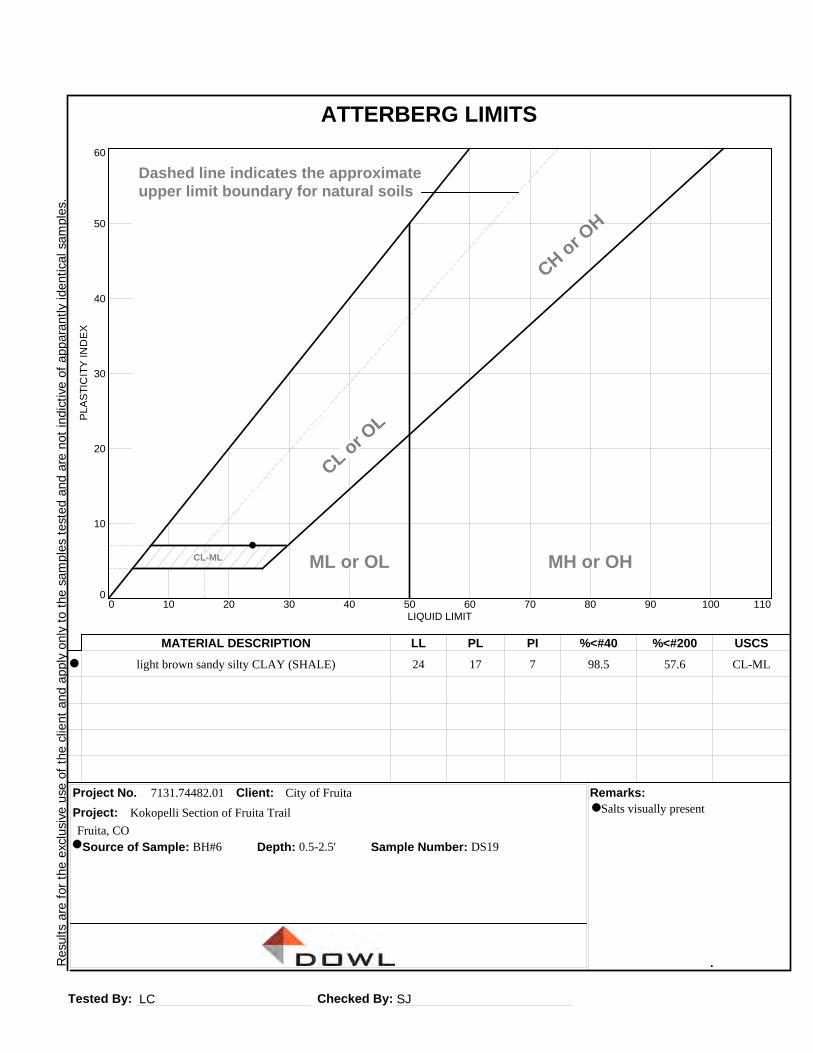
Resu
lts
are
fo
r th
e e
xclu
sive
use
of
the
clie
nt
and
ap
ply
only
to
the s
am
ple
s te
sted
and a
re n
ot
ind
ictive
of
app
ara
ntly
iden
tica
l sa
mp
les.
Tested By: LC Checked By: SJ
light brown sandy silty CLAY (SHALE) 24 17 7 98.5 57.6 CL-ML
7131.74482.01 City of Fruita
MATERIAL DESCRIPTION LL PL PI %<#40 %<#200 USCS
Project No. Client: Remarks:
Project:
.
Source of Sample: BH#6 Depth: 0.5-2.5' Sample Number: DS19
PL
AS
TIC
ITY
IN
DE
X
0
10
20
30
40
50
60
LIQUID LIMIT0 10 20 30 40 50 60 70 80 90 100 110
CL-ML
CL or O
L
CH or O
H
ML or OL MH or OH
Dashed line indicates the approximateupper limit boundary for natural soils
4
7
ATTERBERG LIMITS
Salts visually presentKokopelli Section of Fruita Trail
Fruita, CO
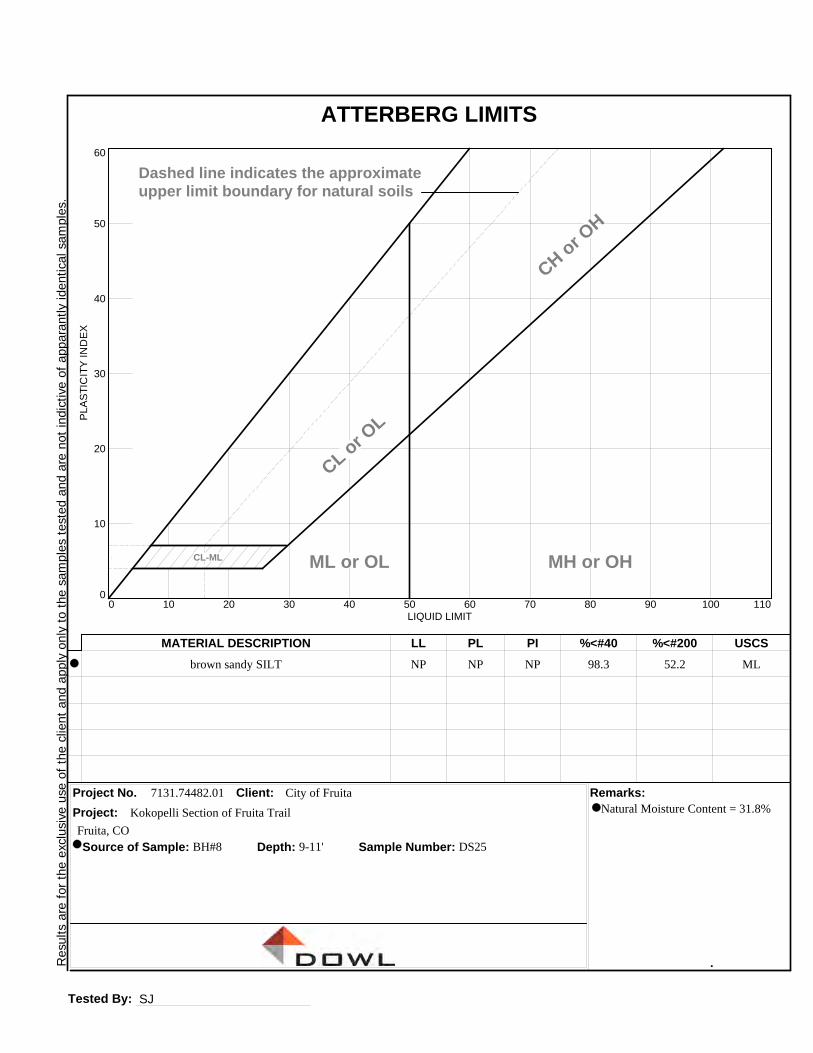
Resu
lts
are
fo
r th
e e
xclu
sive
use
of
the
clie
nt
and
ap
ply
only
to
the s
am
ple
s te
sted
and a
re n
ot
ind
ictive
of
app
ara
ntly
iden
tica
l sa
mp
les.
Tested By: SJ
brown sandy SILT NP NP NP 98.3 52.2 ML
7131.74482.01 City of Fruita
MATERIAL DESCRIPTION LL PL PI %<#40 %<#200 USCS
Project No. Client: Remarks:
Project:
.
Source of Sample: BH#8 Depth: 9-11' Sample Number: DS25
PL
AS
TIC
ITY
IN
DE
X
0
10
20
30
40
50
60
LIQUID LIMIT0 10 20 30 40 50 60 70 80 90 100 110
CL-ML
CL or O
L
CH or O
H
ML or OL MH or OH
Dashed line indicates the approximateupper limit boundary for natural soils
4
7
ATTERBERG LIMITS
Natural Moisture Content = 31.8%Kokopelli Section of Fruita Trail
Fruita, CO
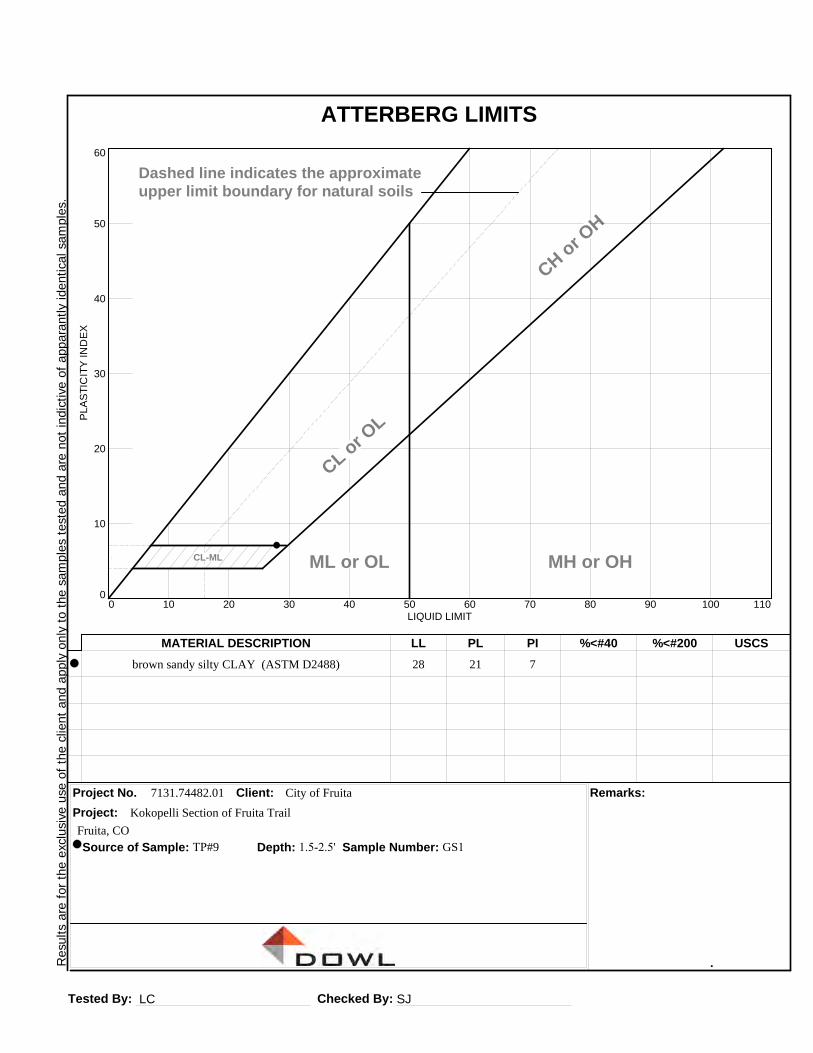
Resu
lts
are
fo
r th
e e
xclu
sive
use
of
the
clie
nt
and
ap
ply
only
to
the s
am
ple
s te
sted
and a
re n
ot
ind
ictive
of
app
ara
ntly
iden
tica
l sa
mp
les.
Tested By: LC Checked By: SJ
brown sandy silty CLAY (ASTM D2488) 28 21 7
7131.74482.01 City of Fruita
MATERIAL DESCRIPTION LL PL PI %<#40 %<#200 USCS
Project No. Client: Remarks:
Project:
.
Source of Sample: TP#9 Depth: 1.5-2.5' Sample Number: GS1
PL
AS
TIC
ITY
IN
DE
X
0
10
20
30
40
50
60
LIQUID LIMIT0 10 20 30 40 50 60 70 80 90 100 110
CL-ML
CL or O
L
CH or O
H
ML or OL MH or OH
Dashed line indicates the approximateupper limit boundary for natural soils
4
7
ATTERBERG LIMITS
Kokopelli Section of Fruita Trail
Fruita, CO
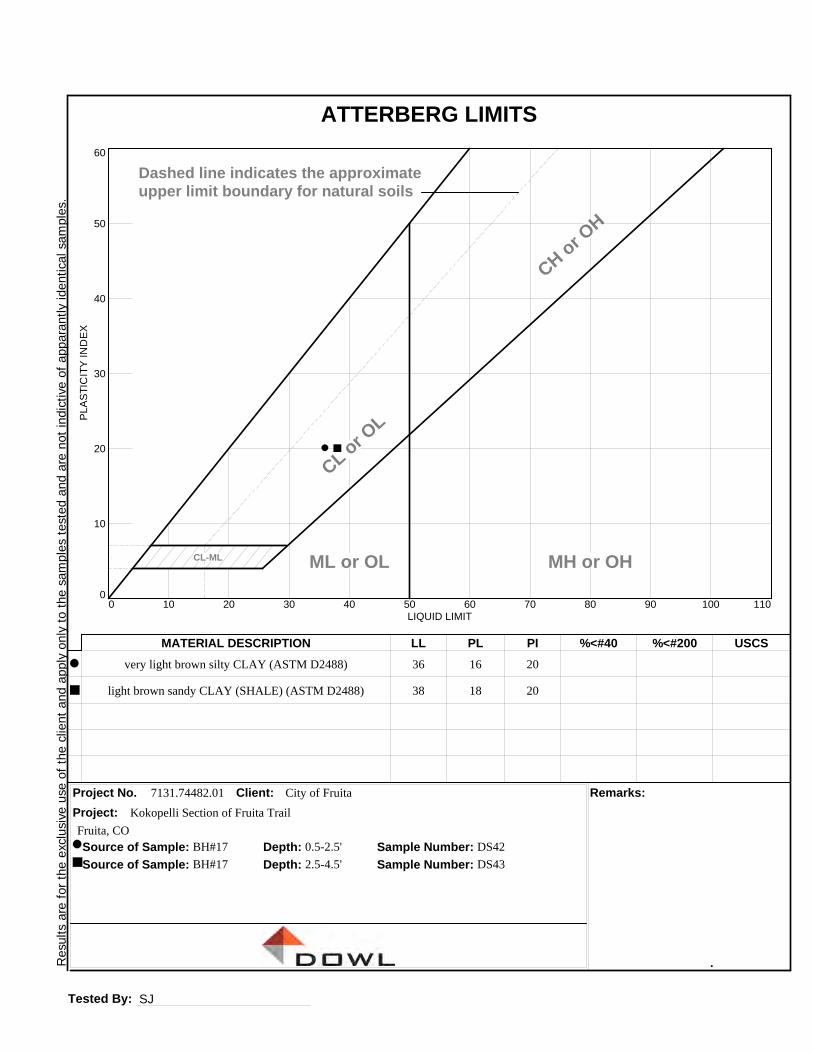
Resu
lts
are
fo
r th
e e
xclu
sive
use
of
the
clie
nt
and
ap
ply
only
to
the s
am
ple
s te
sted
and a
re n
ot
ind
ictive
of
app
ara
ntly
iden
tica
l sa
mp
les.
Tested By: SJ
very light brown silty CLAY (ASTM D2488) 36 16 20
light brown sandy CLAY (SHALE) (ASTM D2488) 38 18 20
7131.74482.01 City of Fruita
MATERIAL DESCRIPTION LL PL PI %<#40 %<#200 USCS
Project No. Client: Remarks:
Project:
.
Source of Sample: BH#17 Depth: 0.5-2.5' Sample Number: DS42
Source of Sample: BH#17 Depth: 2.5-4.5' Sample Number: DS43
PL
AS
TIC
ITY
IN
DE
X
0
10
20
30
40
50
60
LIQUID LIMIT0 10 20 30 40 50 60 70 80 90 100 110
CL-ML
CL or O
L
CH or O
H
ML or OL MH or OH
Dashed line indicates the approximateupper limit boundary for natural soils
4
7
ATTERBERG LIMITS
Kokopelli Section of Fruita Trail
Fruita, CO
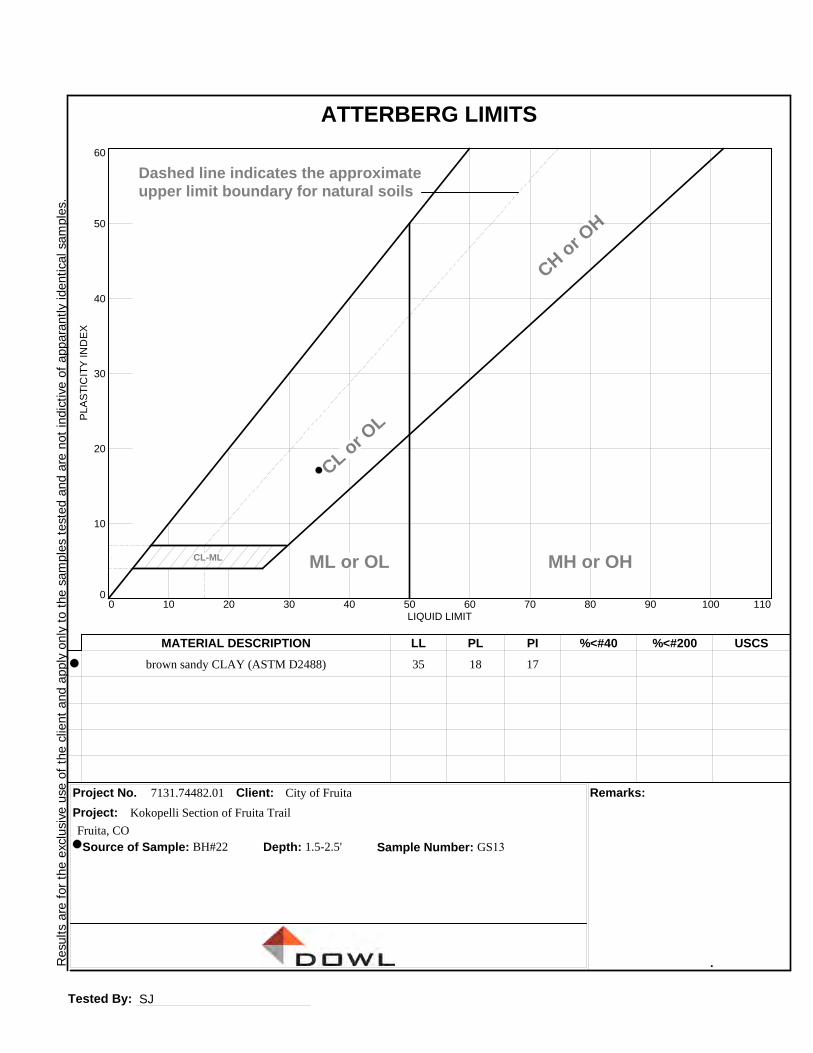
Resu
lts
are
fo
r th
e e
xclu
sive
use
of
the
clie
nt
and
ap
ply
only
to
the s
am
ple
s te
sted
and a
re n
ot
ind
ictive
of
app
ara
ntly
iden
tica
l sa
mp
les.
Tested By: SJ
brown sandy CLAY (ASTM D2488) 35 18 17
7131.74482.01 City of Fruita
MATERIAL DESCRIPTION LL PL PI %<#40 %<#200 USCS
Project No. Client: Remarks:
Project:
.
Source of Sample: BH#22 Depth: 1.5-2.5' Sample Number: GS13
PL
AS
TIC
ITY
IN
DE
X
0
10
20
30
40
50
60
LIQUID LIMIT0 10 20 30 40 50 60 70 80 90 100 110
CL-ML
CL or O
L
CH or O
H
ML or OL MH or OH
Dashed line indicates the approximateupper limit boundary for natural soils
4
7
ATTERBERG LIMITS
Kokopelli Section of Fruita Trail
Fruita, CO
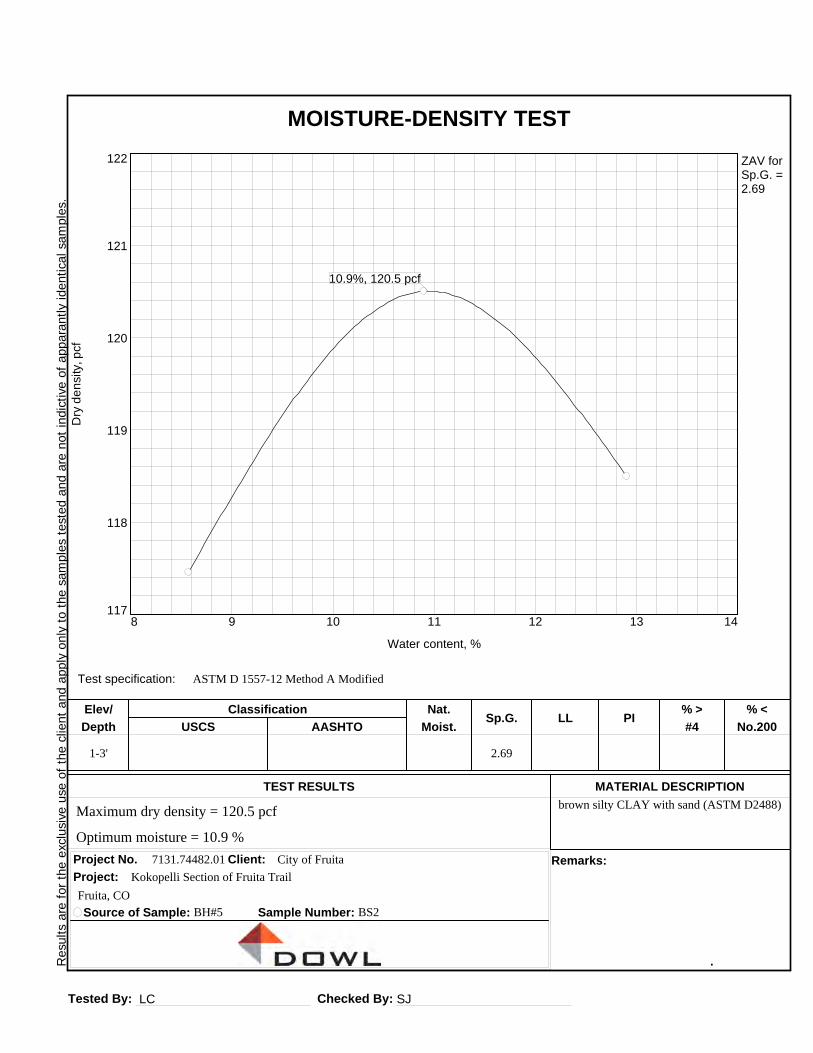
Resu
lts
are
fo
r th
e e
xclu
sive
use
of
the
clie
nt
and
ap
ply
only
to
the s
am
ple
s te
sted
and a
re n
ot
ind
ictive
of
app
ara
ntly
iden
tica
l sa
mp
les.
Tested By: LC Checked By: SJ
MOISTURE-DENSITY TEST
Dry
de
nsi
ty, p
cf
117
118
119
120
121
122
Water content, %
8 9 10 11 12 13 14
10.9%, 120.5 pcf
ZAV forSp.G. =2.69
Test specification: ASTM D 1557-12 Method A Modified
1-3' 2.69
brown silty CLAY with sand (ASTM D2488)
7131.74482.01 City of Fruita
Elev/ Classification Nat.Sp.G. LL PI
% > % <
Depth USCS AASHTO Moist. #4 No.200
TEST RESULTS MATERIAL DESCRIPTION
Project No. Client: Remarks:
Project:
Source of Sample: BH#5 Sample Number: BS2
.
Maximum dry density = 120.5 pcf
Optimum moisture = 10.9 %
Kokopelli Section of Fruita Trail
Fruita, CO
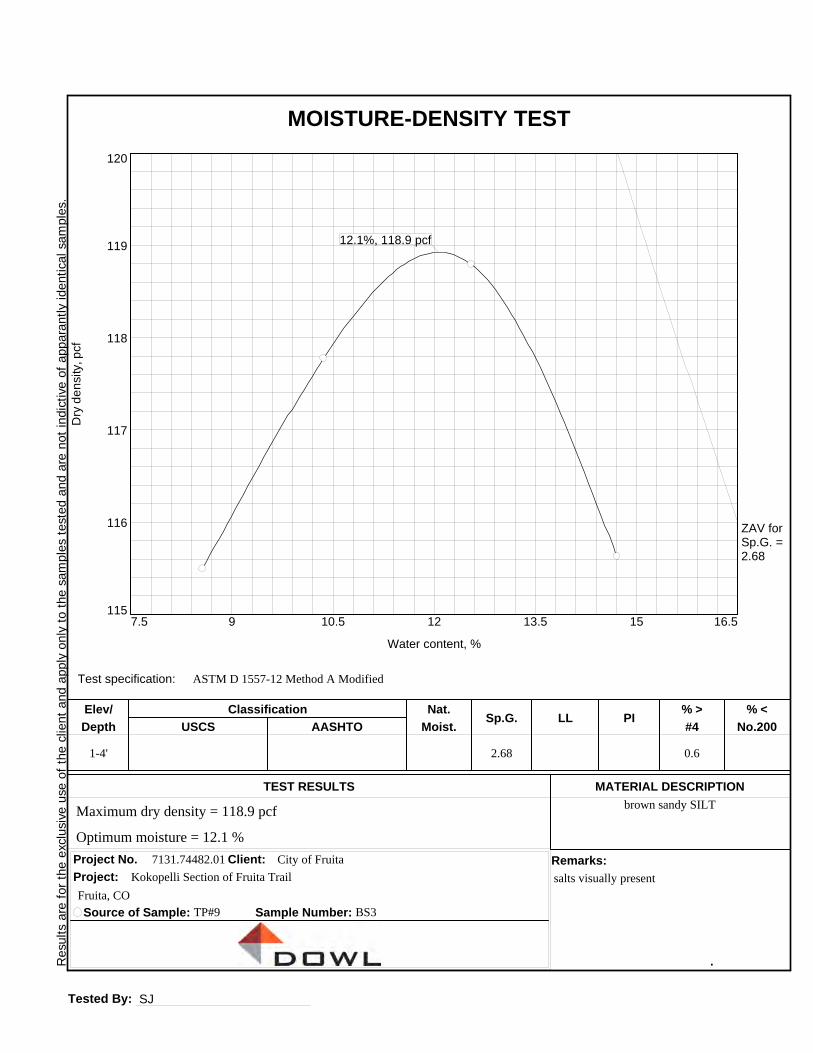
Resu
lts
are
fo
r th
e e
xclu
sive
use
of
the
clie
nt
and
ap
ply
only
to
the s
am
ple
s te
sted
and a
re n
ot
ind
ictive
of
app
ara
ntly
iden
tica
l sa
mp
les.
Tested By: SJ
MOISTURE-DENSITY TEST
Dry
de
nsi
ty, p
cf
115
116
117
118
119
120
Water content, %
7.5 9 10.5 12 13.5 15 16.5
12.1%, 118.9 pcf
ZAV forSp.G. =2.68
Test specification: ASTM D 1557-12 Method A Modified
1-4' 2.68 0.6
brown sandy SILT
7131.74482.01 City of Fruita
salts visually present
Elev/ Classification Nat.Sp.G. LL PI
% > % <
Depth USCS AASHTO Moist. #4 No.200
TEST RESULTS MATERIAL DESCRIPTION
Project No. Client: Remarks:
Project:
Source of Sample: TP#9 Sample Number: BS3
.
Maximum dry density = 118.9 pcf
Optimum moisture = 12.1 %
Kokopelli Section of Fruita Trail
Fruita, CO
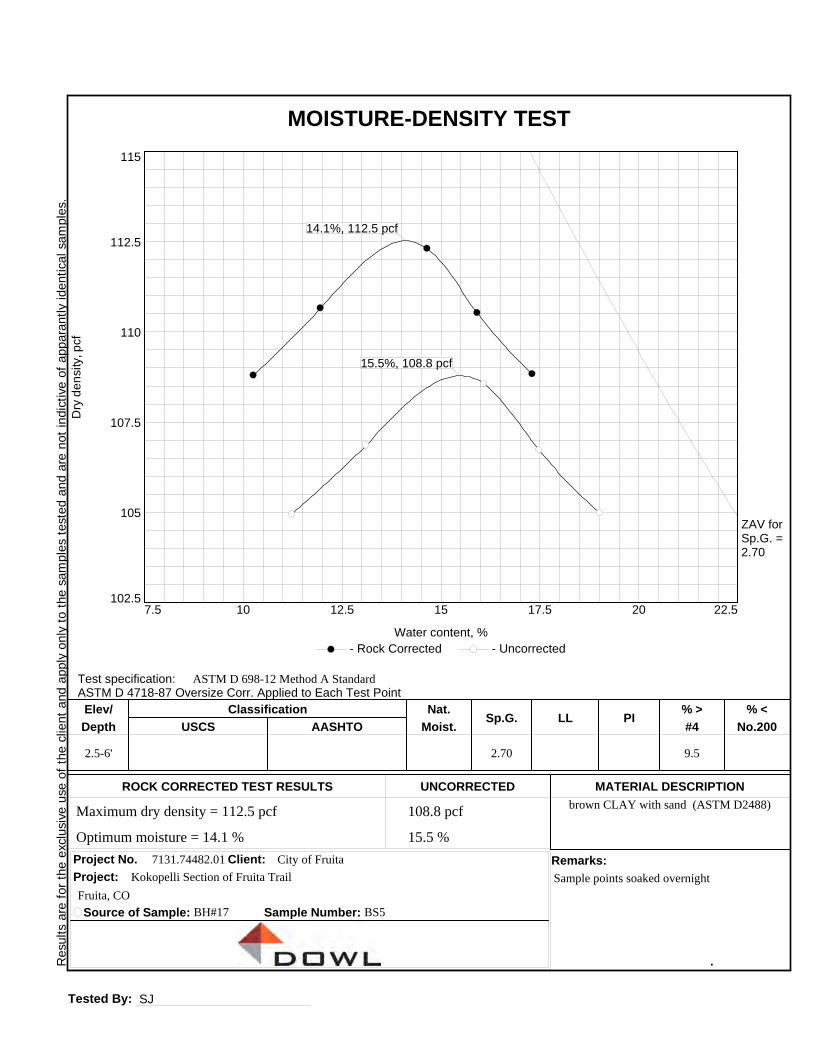
Resu
lts
are
fo
r th
e e
xclu
sive
use
of
the
clie
nt
and
ap
ply
only
to
the s
am
ple
s te
sted
and a
re n
ot
ind
ictive
of
app
ara
ntly
iden
tica
l sa
mp
les.
Tested By: SJ
MOISTURE-DENSITY TEST
Dry
de
nsi
ty, p
cf
102.5
105
107.5
110
112.5
115
Water content, %
- Rock Corrected - Uncorrected
7.5 10 12.5 15 17.5 20 22.5
14.1%, 112.5 pcf
15.5%, 108.8 pcf
ZAV forSp.G. =2.70
Test specification:ASTM D 4718-87 Oversize Corr. Applied to Each Test Point
ASTM D 698-12 Method A Standard
2.5-6' 2.70 9.5
brown CLAY with sand (ASTM D2488)
7131.74482.01 City of Fruita
Sample points soaked overnight
Elev/ Classification Nat.Sp.G. LL PI
% > % <
Depth USCS AASHTO Moist. #4 No.200
ROCK CORRECTED TEST RESULTS UNCORRECTED MATERIAL DESCRIPTION
Project No. Client: Remarks:
Project:
Source of Sample: BH#17 Sample Number: BS5
.
108.8 pcf Maximum dry density = 112.5 pcf
15.5 % Optimum moisture = 14.1 %
Kokopelli Section of Fruita Trail
Fruita, CO
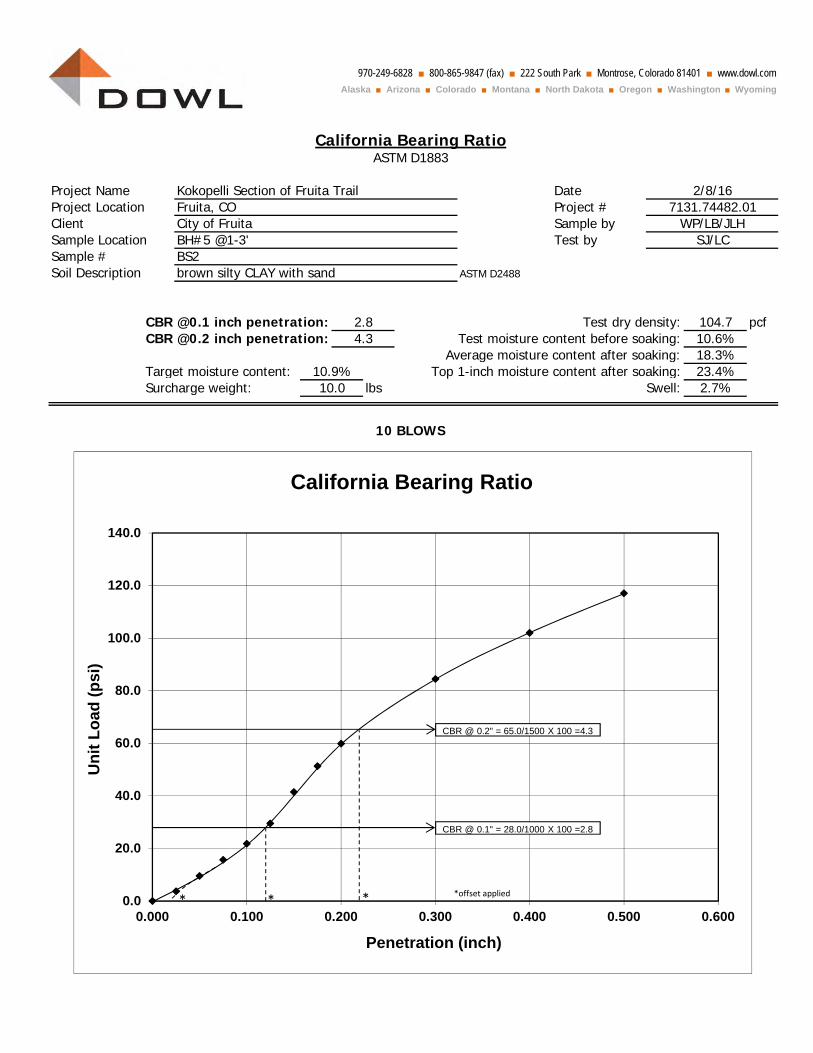
970-249-6828 ■ 800-865-9847 (fax) ■ 222 South Park ■ Montrose, Colorado 81401 ■ www.dowl.comAlaska ■ Arizona ■ Colorado ■ Montana ■ North Dakota ■ Oregon ■ Washington ■ Wyoming
Project Name DateProject Location Project #Client Sample bySample Location Test bySample #Soil Description ASTM D2488
CBR @0.1 inch penetration: pcfCBR @0.2 inch penetration:
Target moisture content:Surcharge weight: lbs 2.7%
Test dry density:Test moisture content before soaking:
Average moisture content after soaking:
104.710.6%18.3%23.4%
2.84.3
10.9%
10 BLOWS
Swell:10.0Top 1-inch moisture content after soaking:
2/8/167131.74482.01
WP/LB/JLHSJ/LC
City of FruitaBH#5 @1-3'BS2brown silty CLAY with sand
California Bearing RatioASTM D1883
Kokopelli Section of Fruita TrailFruita, CO
0.0
20.0
40.0
60.0
80.0
100.0
120.0
140.0
0.000 0.100 0.200 0.300 0.400 0.500 0.600
Uni
t Loa
d (p
si)
Penetration (inch)
California Bearing Ratio
*offset applied***
CBR @ 0.1" = 28.0/1000 X 100 =2.8
CBR @ 0.2" = 65.0/1500 X 100 =4.3
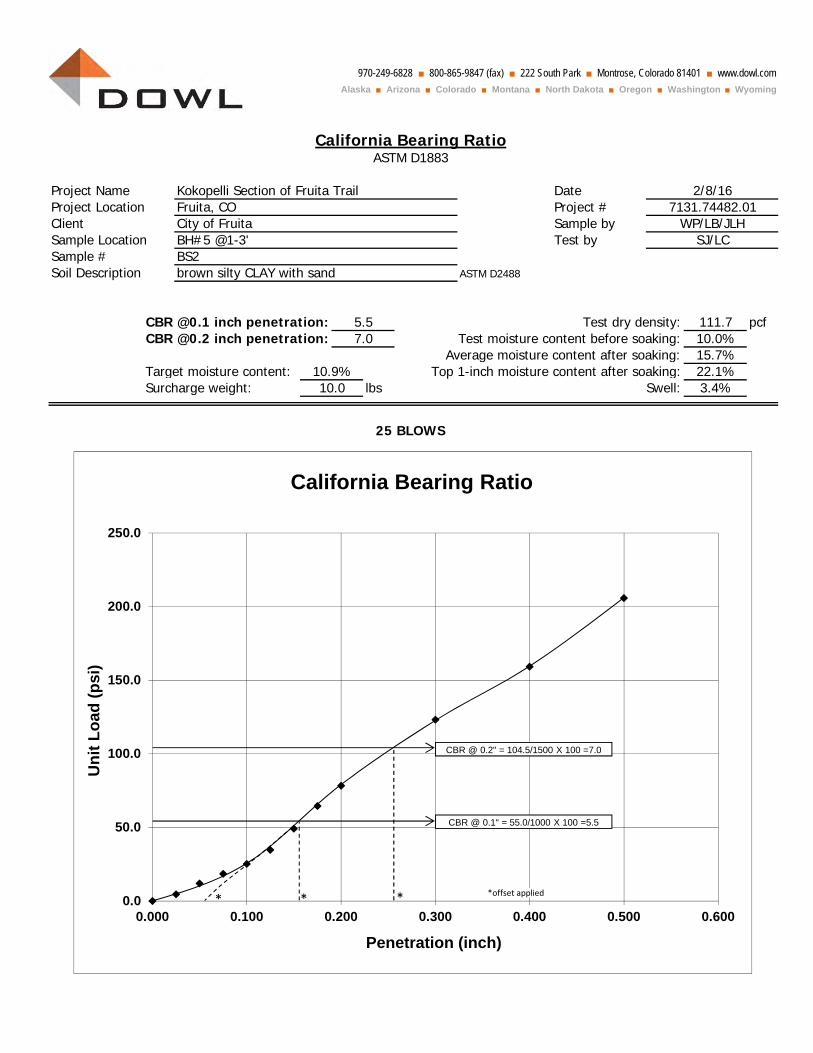
970-249-6828 ■ 800-865-9847 (fax) ■ 222 South Park ■ Montrose, Colorado 81401 ■ www.dowl.comAlaska ■ Arizona ■ Colorado ■ Montana ■ North Dakota ■ Oregon ■ Washington ■ Wyoming
Project Name DateProject Location Project #Client Sample bySample Location Test bySample #Soil Description ASTM D2488
CBR @0.1 inch penetration: pcfCBR @0.2 inch penetration:
Target moisture content:Surcharge weight: lbs
California Bearing RatioASTM D1883
Kokopelli Section of Fruita Trail
City of FruitaBH#5 @1-3'BS2brown silty CLAY with sand
2/8/167131.74482.01
WP/LB/JLHSJ/LC
Fruita, CO
5.57.0
10.9%
25 BLOWS
Swell:10.0Top 1-inch moisture content after soaking:
3.4%
Test dry density:Test moisture content before soaking:
Average moisture content after soaking:
111.710.0%15.7%22.1%
0.0
50.0
100.0
150.0
200.0
250.0
0.000 0.100 0.200 0.300 0.400 0.500 0.600
Uni
t Loa
d (p
si)
Penetration (inch)
California Bearing Ratio
CBR @ 0.1" = 55.0/1000 X 100 =5.5
CBR @ 0.2" = 104.5/1500 X 100 =7.0
*offset applied** *
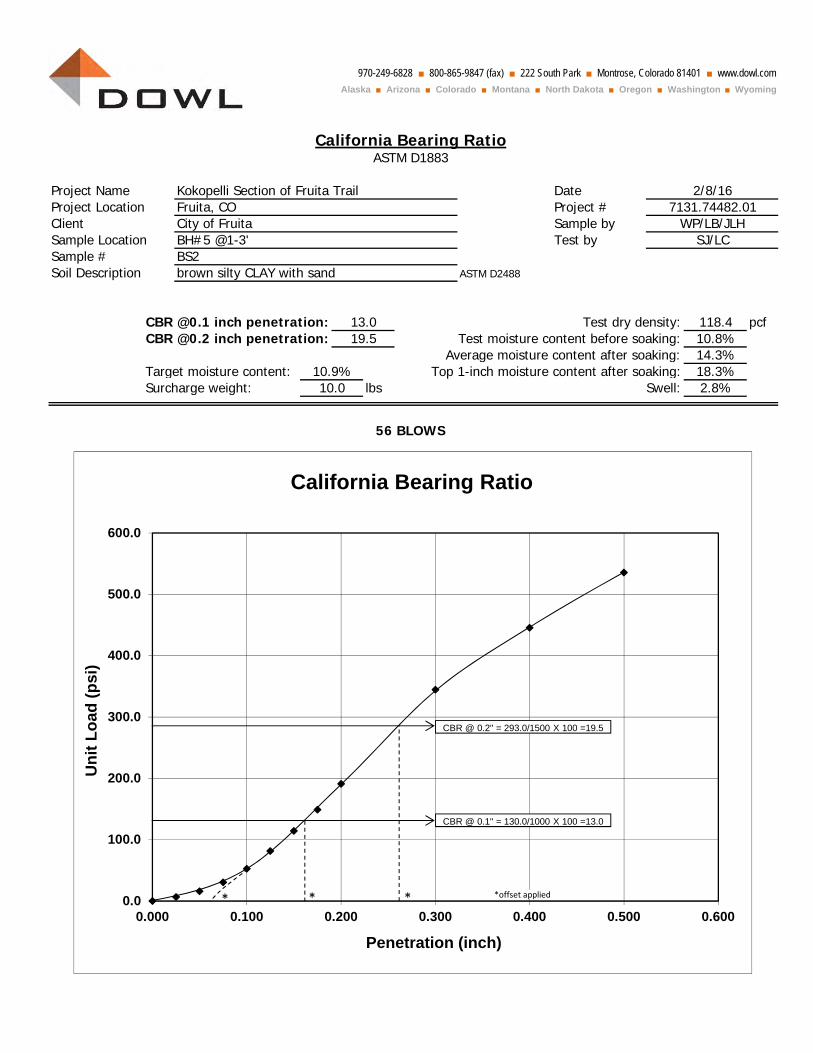
970-249-6828 ■ 800-865-9847 (fax) ■ 222 South Park ■ Montrose, Colorado 81401 ■ www.dowl.comAlaska ■ Arizona ■ Colorado ■ Montana ■ North Dakota ■ Oregon ■ Washington ■ Wyoming
Project Name DateProject Location Project #Client Sample bySample Location Test bySample #Soil Description ASTM D2488
CBR @0.1 inch penetration: pcfCBR @0.2 inch penetration:
Target moisture content:Surcharge weight: lbs 2.8%
Test dry density:Test moisture content before soaking:
Average moisture content after soaking:
118.410.8%14.3%18.3%
13.019.5
10.9%
56 BLOWS
Swell:10.0Top 1-inch moisture content after soaking:
2/8/167131.74482.01
WP/LB/JLHSJ/LC
City of FruitaBH#5 @1-3'BS2brown silty CLAY with sand
California Bearing RatioASTM D1883
Kokopelli Section of Fruita TrailFruita, CO
0.0
100.0
200.0
300.0
400.0
500.0
600.0
0.000 0.100 0.200 0.300 0.400 0.500 0.600
Uni
t Loa
d (p
si)
Penetration (inch)
California Bearing Ratio
CBR @ 0.1" = 130.0/1000 X 100 =13.0
CBR @ 0.2" = 293.0/1500 X 100 =19.5
*offset applied** *
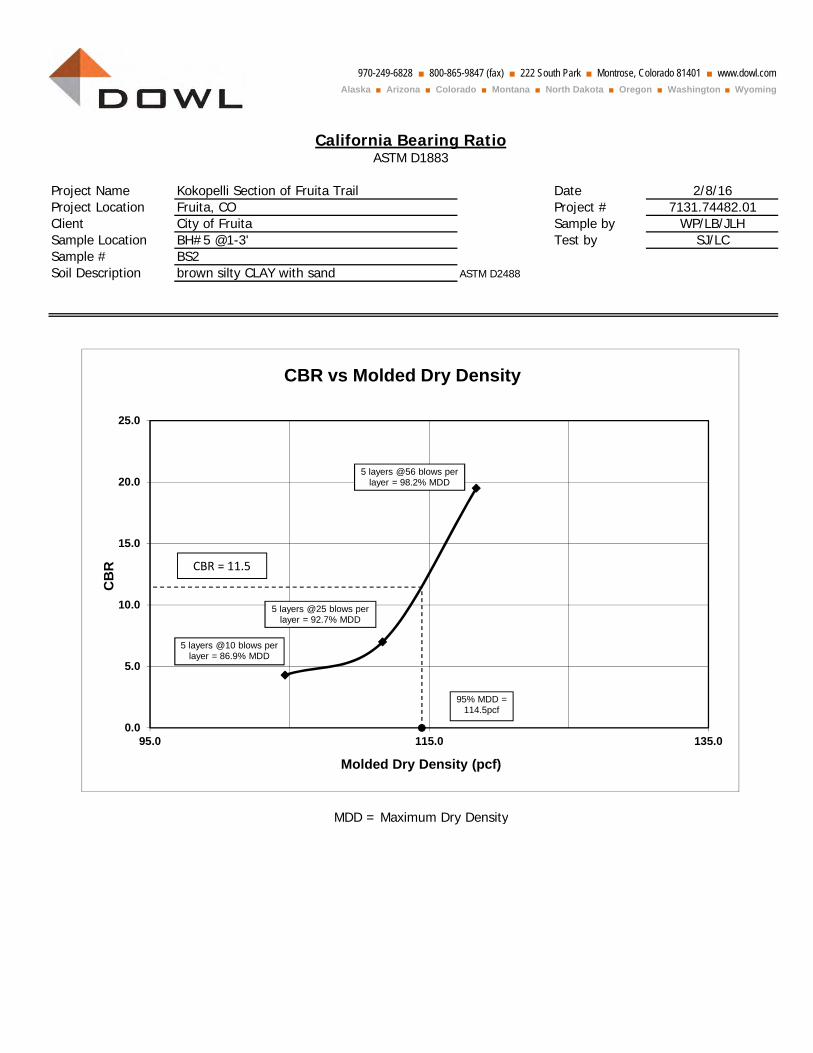
970-249-6828 ■ 800-865-9847 (fax) ■ 222 South Park ■ Montrose, Colorado 81401 ■ www.dowl.comAlaska ■ Arizona ■ Colorado ■ Montana ■ North Dakota ■ Oregon ■ Washington ■ Wyoming
Project Name DateProject Location Project #Client Sample bySample Location Test bySample #Soil Description ASTM D2488
MDD = Maximum Dry Density
California Bearing RatioASTM D1883
Kokopelli Section of Fruita Trail
City of FruitaBH#5 @1-3'BS2brown silty CLAY with sand
2/8/167131.74482.01
WP/LB/JLHSJ/LC
Fruita, CO
0.0
5.0
10.0
15.0
20.0
25.0
95.0 115.0 135.0
CB
R
Molded Dry Density (pcf)
CBR vs Molded Dry Density
CBR = 11.5
5 layers @10 blows per layer = 86.9% MDD
5 layers @25 blows per layer = 92.7% MDD
5 layers @56 blows per layer = 98.2% MDD
95% MDD = 114.5pcf
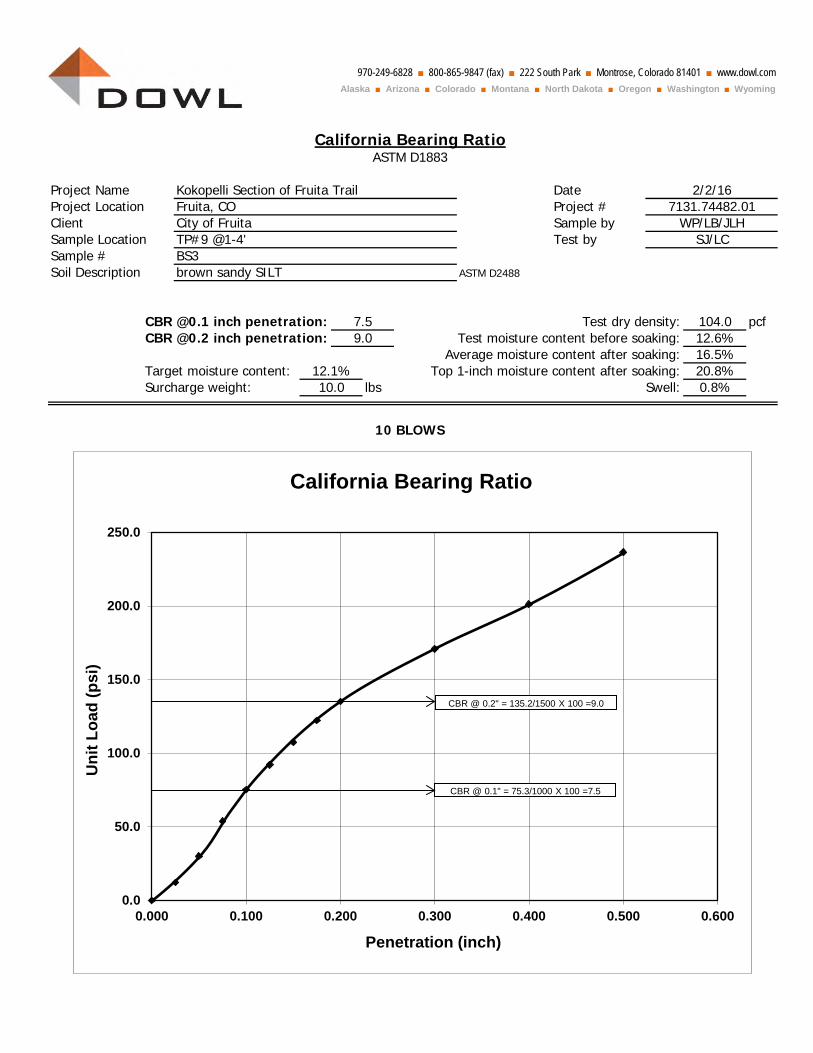
970-249-6828 ■ 800-865-9847 (fax) ■ 222 South Park ■ Montrose, Colorado 81401 ■ www.dowl.comAlaska ■ Arizona ■ Colorado ■ Montana ■ North Dakota ■ Oregon ■ Washington ■ Wyoming
Project Name DateProject Location Project #Client Sample bySample Location Test bySample #Soil Description ASTM D2488
CBR @0.1 inch penetration: pcfCBR @0.2 inch penetration:
Target moisture content:Surcharge weight: lbs
BS3brown sandy SILT
California Bearing RatioASTM D1883
Kokopelli Section of Fruita TrailFruita, CO
2/2/167131.74482.01
WP/LB/JLHSJ/LC
City of FruitaTP#9 @1-4'
7.59.0
12.1%
10 BLOWS
Swell:10.0Top 1-inch moisture content after soaking:
0.8%
Test dry density:Test moisture content before soaking:
Average moisture content after soaking:
104.012.6%16.5%20.8%
0.0
50.0
100.0
150.0
200.0
250.0
0.000 0.100 0.200 0.300 0.400 0.500 0.600
Uni
t Loa
d (p
si)
Penetration (inch)
California Bearing Ratio
CBR @ 0.1" = 75.3/1000 X 100 =7.5
CBR @ 0.2" = 135.2/1500 X 100 =9.0
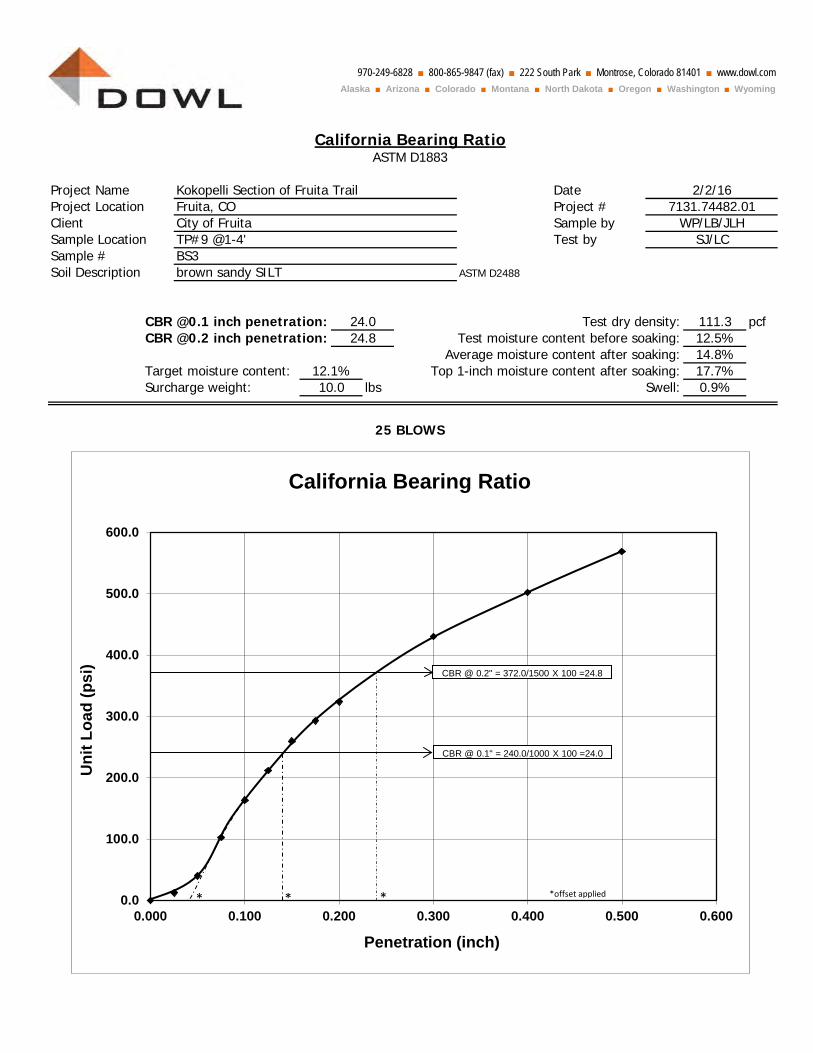
970-249-6828 ■ 800-865-9847 (fax) ■ 222 South Park ■ Montrose, Colorado 81401 ■ www.dowl.comAlaska ■ Arizona ■ Colorado ■ Montana ■ North Dakota ■ Oregon ■ Washington ■ Wyoming
Project Name DateProject Location Project #Client Sample bySample Location Test bySample #Soil Description ASTM D2488
CBR @0.1 inch penetration: pcfCBR @0.2 inch penetration:
Target moisture content:Surcharge weight: lbs 0.9%
Test dry density:Test moisture content before soaking:
Average moisture content after soaking:
111.312.5%14.8%17.7%
24.024.8
12.1%
25 BLOWS
Swell:10.0Top 1-inch moisture content after soaking:
BS3brown sandy SILT
2/2/167131.74482.01
WP/LB/JLHSJ/LC
Fruita, CO
California Bearing RatioASTM D1883
Kokopelli Section of Fruita Trail
City of FruitaTP#9 @1-4'
0.0
100.0
200.0
300.0
400.0
500.0
600.0
0.000 0.100 0.200 0.300 0.400 0.500 0.600
Uni
t Loa
d (p
si)
Penetration (inch)
California Bearing Ratio
CBR @ 0.1" = 240.0/1000 X 100 =24.0
CBR @ 0.2" = 372.0/1500 X 100 =24.8
* * * *offset applied
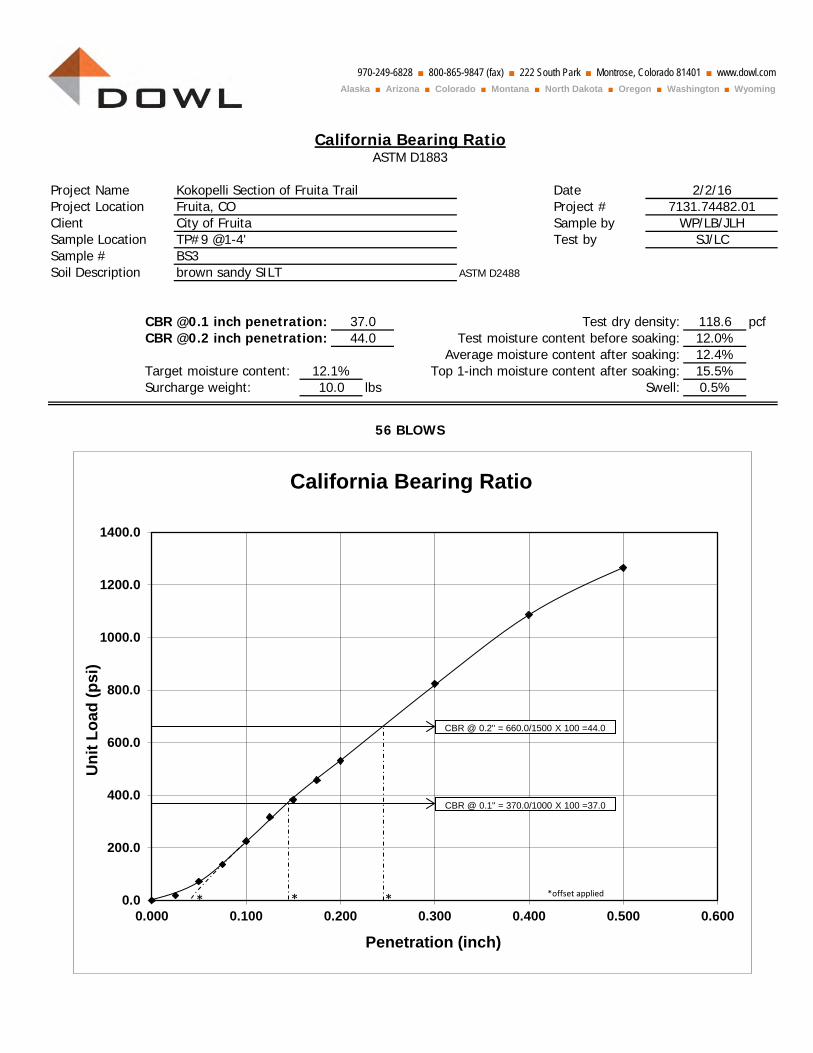
970-249-6828 ■ 800-865-9847 (fax) ■ 222 South Park ■ Montrose, Colorado 81401 ■ www.dowl.comAlaska ■ Arizona ■ Colorado ■ Montana ■ North Dakota ■ Oregon ■ Washington ■ Wyoming
Project Name DateProject Location Project #Client Sample bySample Location Test bySample #Soil Description ASTM D2488
CBR @0.1 inch penetration: pcfCBR @0.2 inch penetration:
Target moisture content:Surcharge weight: lbs
brown sandy SILT
California Bearing RatioASTM D1883
Kokopelli Section of Fruita Trail 2/2/16Fruita, CO 7131.74482.01City of Fruita WP/LB/JLHTP#9 @1-4' SJ/LCBS3
37.0 Test dry density: 118.644.0 Test moisture content before soaking: 12.0%
56 BLOWS
Average moisture content after soaking: 12.4%12.1% Top 1-inch moisture content after soaking: 15.5%10.0 Swell: 0.5%
0.0
200.0
400.0
600.0
800.0
1000.0
1200.0
1400.0
0.000 0.100 0.200 0.300 0.400 0.500 0.600
Uni
t Loa
d (p
si)
Penetration (inch)
California Bearing Ratio
CBR @ 0.1" = 370.0/1000 X 100 =37.0
CBR @ 0.2" = 660.0/1500 X 100 =44.0
*offset applied * * *
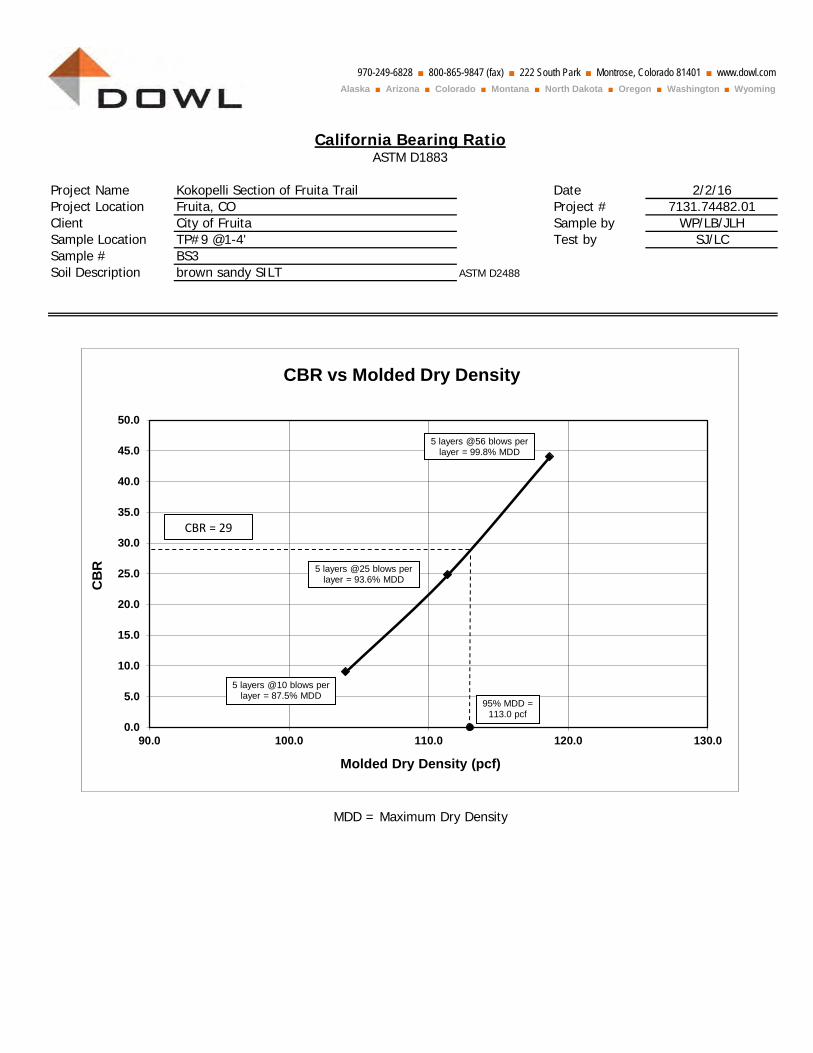
970-249-6828 ■ 800-865-9847 (fax) ■ 222 South Park ■ Montrose, Colorado 81401 ■ www.dowl.comAlaska ■ Arizona ■ Colorado ■ Montana ■ North Dakota ■ Oregon ■ Washington ■ Wyoming
Project Name DateProject Location Project #Client Sample bySample Location Test bySample #Soil Description ASTM D2488
MDD = Maximum Dry Density
BS3brown sandy SILT
2/2/167131.74482.01
WP/LB/JLHSJ/LC
Fruita, CO
California Bearing RatioASTM D1883
Kokopelli Section of Fruita Trail
City of FruitaTP#9 @1-4'
0.0
5.0
10.0
15.0
20.0
25.0
30.0
35.0
40.0
45.0
50.0
90.0 100.0 110.0 120.0 130.0
CB
R
Molded Dry Density (pcf)
CBR vs Molded Dry Density
CBR = 29
5 layers @10 blows per layer = 87.5% MDD
5 layers @25 blows per layer = 93.6% MDD
5 layers @56 blows per layer = 99.8% MDD
95% MDD = 113.0 pcf
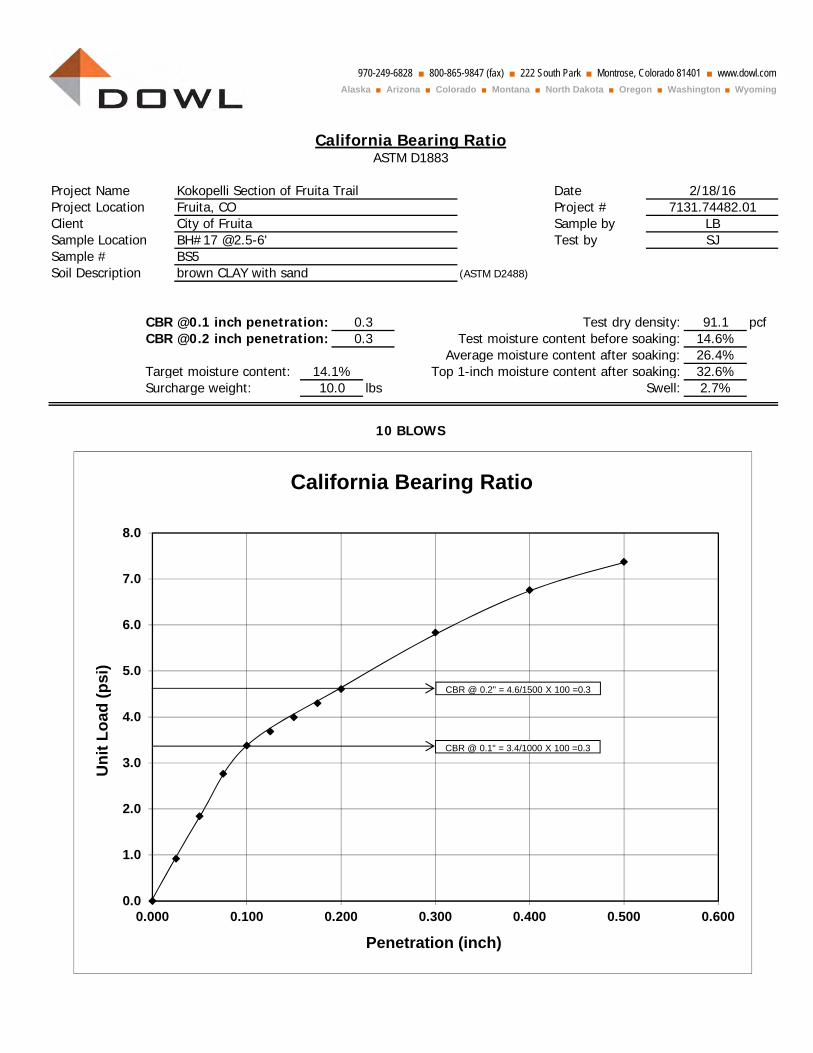
970-249-6828 ■ 800-865-9847 (fax) ■ 222 South Park ■ Montrose, Colorado 81401 ■ www.dowl.comAlaska ■ Arizona ■ Colorado ■ Montana ■ North Dakota ■ Oregon ■ Washington ■ Wyoming
Project Name DateProject Location Project #Client Sample bySample Location Test bySample #Soil Description (ASTM D2488)
CBR @0.1 inch penetration: pcfCBR @0.2 inch penetration:
Target moisture content:Surcharge weight: lbs 2.7%
Test dry density:Test moisture content before soaking:
Average moisture content after soaking:
91.114.6%26.4%32.6%
0.30.3
14.1%
10 BLOWS
Swell:10.0Top 1-inch moisture content after soaking:
2/18/167131.74482.01
LBSJ
City of FruitaBH#17 @2.5-6'BS5brown CLAY with sand
California Bearing RatioASTM D1883
Kokopelli Section of Fruita TrailFruita, CO
0.0
1.0
2.0
3.0
4.0
5.0
6.0
7.0
8.0
0.000 0.100 0.200 0.300 0.400 0.500 0.600
Uni
t Loa
d (p
si)
Penetration (inch)
California Bearing Ratio
CBR @ 0.1" = 3.4/1000 X 100 =0.3
CBR @ 0.2" = 4.6/1500 X 100 =0.3
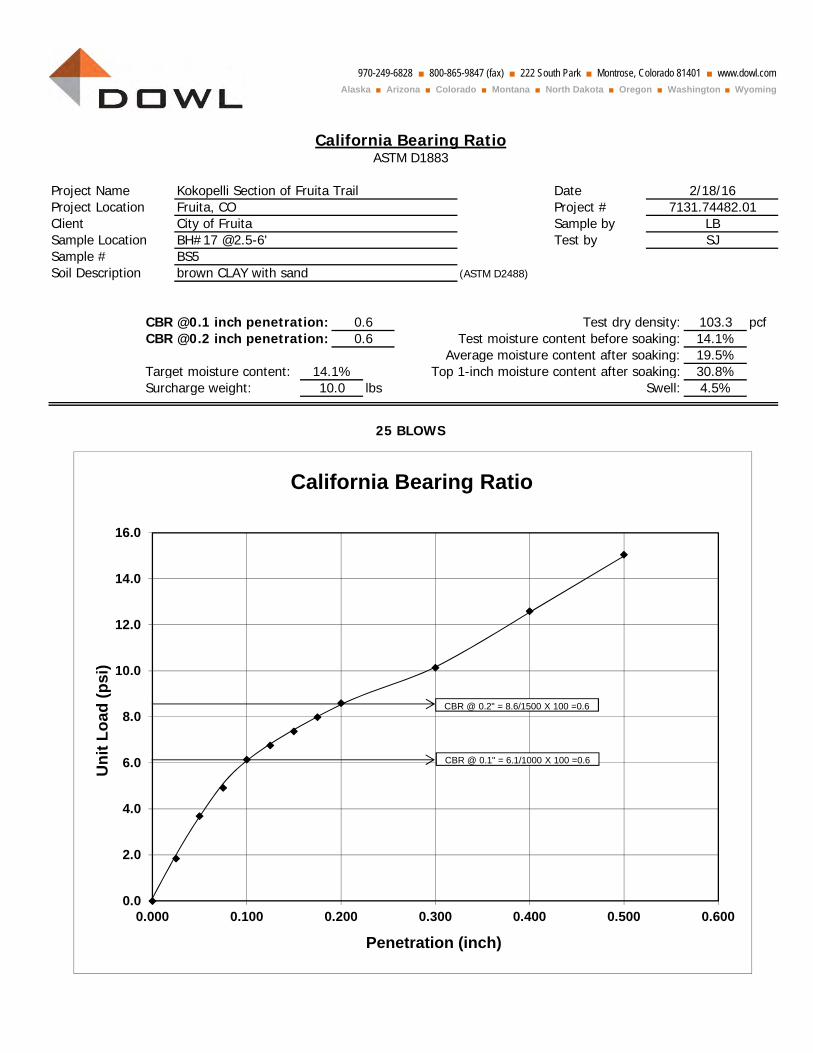
970-249-6828 ■ 800-865-9847 (fax) ■ 222 South Park ■ Montrose, Colorado 81401 ■ www.dowl.comAlaska ■ Arizona ■ Colorado ■ Montana ■ North Dakota ■ Oregon ■ Washington ■ Wyoming
Project Name DateProject Location Project #Client Sample bySample Location Test bySample #Soil Description (ASTM D2488)
CBR @0.1 inch penetration: pcfCBR @0.2 inch penetration:
Target moisture content:Surcharge weight: lbs
California Bearing RatioASTM D1883
Kokopelli Section of Fruita Trail
City of FruitaBH#17 @2.5-6'BS5brown CLAY with sand
2/18/167131.74482.01
LBSJ
Fruita, CO
0.60.6
14.1%
25 BLOWS
Swell:10.0Top 1-inch moisture content after soaking:
4.5%
Test dry density:Test moisture content before soaking:
Average moisture content after soaking:
103.314.1%19.5%30.8%
0.0
2.0
4.0
6.0
8.0
10.0
12.0
14.0
16.0
0.000 0.100 0.200 0.300 0.400 0.500 0.600
Uni
t Loa
d (p
si)
Penetration (inch)
California Bearing Ratio
CBR @ 0.1" = 6.1/1000 X 100 =0.6
CBR @ 0.2" = 8.6/1500 X 100 =0.6
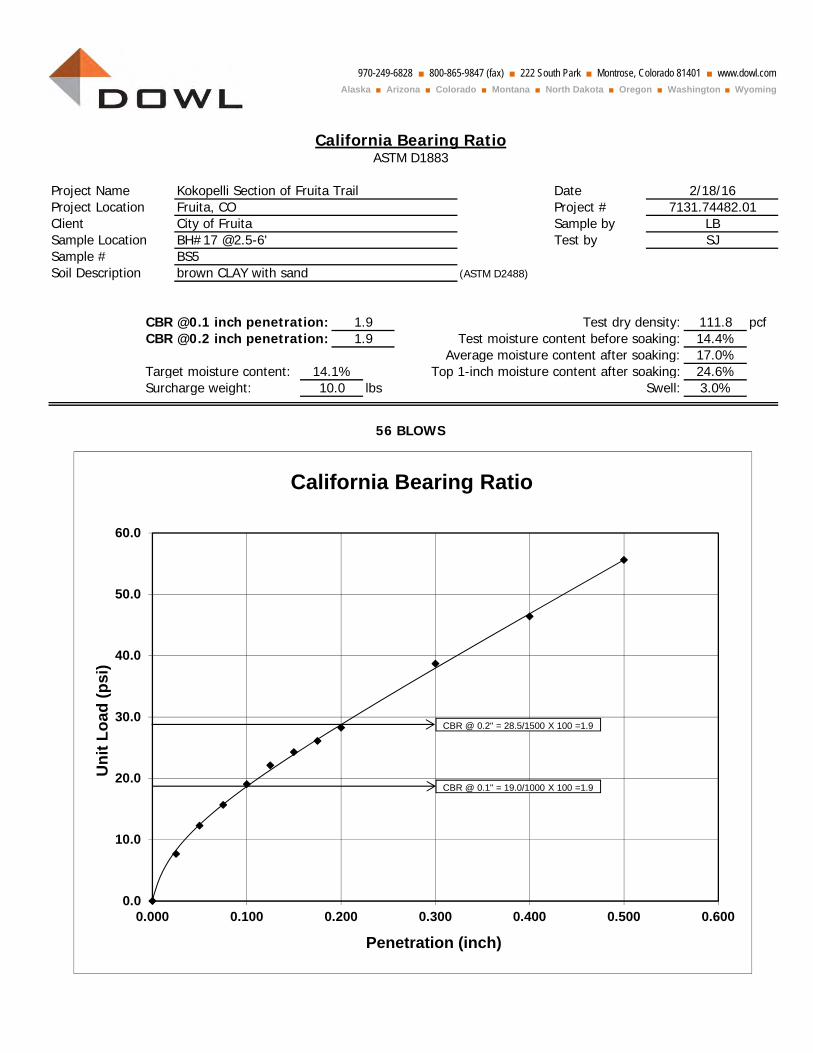
970-249-6828 ■ 800-865-9847 (fax) ■ 222 South Park ■ Montrose, Colorado 81401 ■ www.dowl.comAlaska ■ Arizona ■ Colorado ■ Montana ■ North Dakota ■ Oregon ■ Washington ■ Wyoming
Project Name DateProject Location Project #Client Sample bySample Location Test bySample #Soil Description (ASTM D2488)
CBR @0.1 inch penetration: pcfCBR @0.2 inch penetration:
Target moisture content:Surcharge weight: lbs 3.0%
Test dry density:Test moisture content before soaking:
Average moisture content after soaking:
111.814.4%17.0%24.6%
1.91.9
14.1%
56 BLOWS
Swell:10.0Top 1-inch moisture content after soaking:
2/18/167131.74482.01
LBSJ
City of FruitaBH#17 @2.5-6'BS5brown CLAY with sand
California Bearing RatioASTM D1883
Kokopelli Section of Fruita TrailFruita, CO
0.0
10.0
20.0
30.0
40.0
50.0
60.0
0.000 0.100 0.200 0.300 0.400 0.500 0.600
Uni
t Loa
d (p
si)
Penetration (inch)
California Bearing Ratio
CBR @ 0.1" = 19.0/1000 X 100 =1.9
CBR @ 0.2" = 28.5/1500 X 100 =1.9
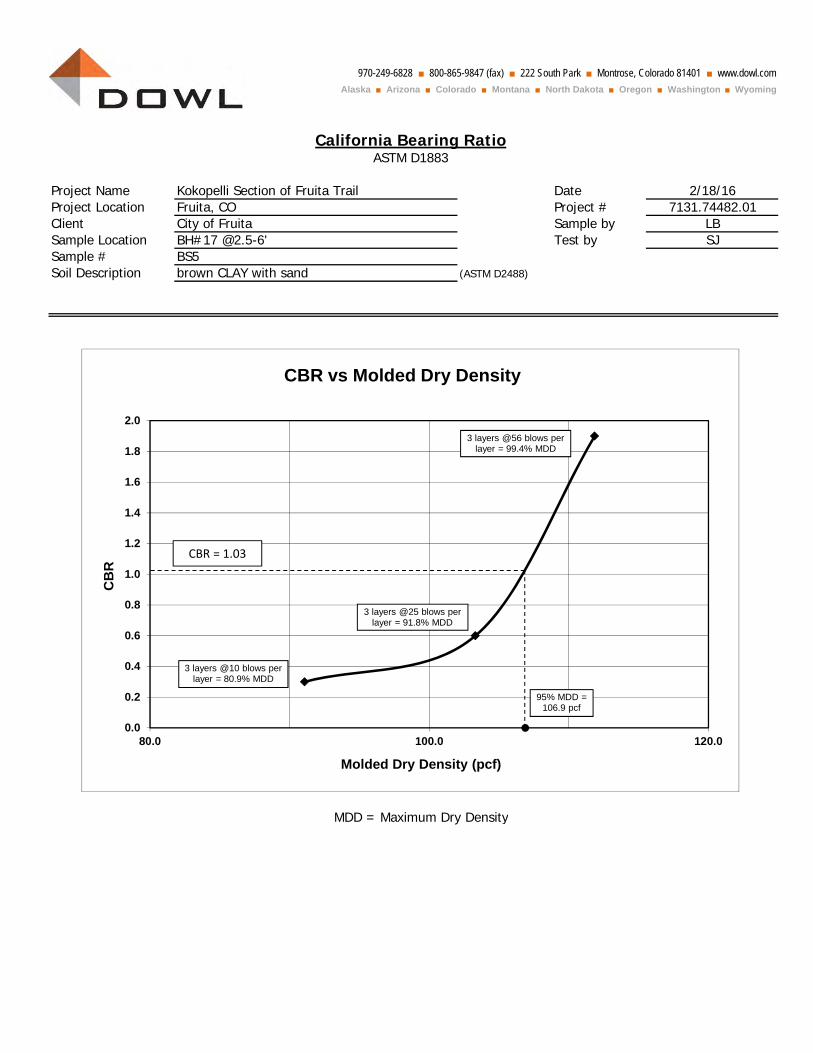
970-249-6828 ■ 800-865-9847 (fax) ■ 222 South Park ■ Montrose, Colorado 81401 ■ www.dowl.comAlaska ■ Arizona ■ Colorado ■ Montana ■ North Dakota ■ Oregon ■ Washington ■ Wyoming
Project Name DateProject Location Project #Client Sample bySample Location Test bySample #Soil Description (ASTM D2488)
MDD = Maximum Dry Density
California Bearing RatioASTM D1883
Kokopelli Section of Fruita Trail
City of FruitaBH#17 @2.5-6'BS5brown CLAY with sand
2/18/167131.74482.01
LBSJ
Fruita, CO
0.0
0.2
0.4
0.6
0.8
1.0
1.2
1.4
1.6
1.8
2.0
80.0 100.0 120.0
CB
R
Molded Dry Density (pcf)
CBR vs Molded Dry Density
CBR = 1.03
3 layers @10 blows per layer = 80.9% MDD
3 layers @25 blows per layer = 91.8% MDD
3 layers @56 blows per layer = 99.4% MDD
95% MDD = 106.9 pcf
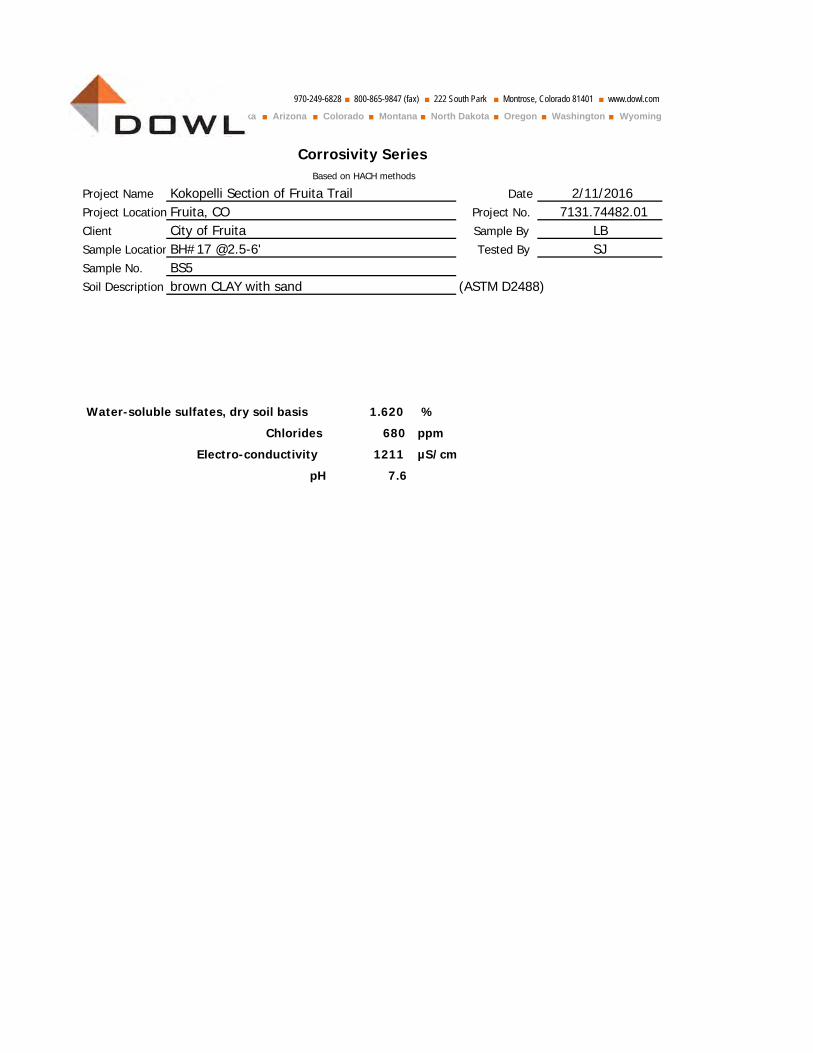
970-249-6828 ■ 800-865-9847 (fax) ■ 222 South Park ■ Montrose, Colorado 81401 ■ www.dowl.comAlaska ■ Arizona ■ Colorado ■ Montana ■ North Dakota ■ Oregon ■ Washington ■ Wyoming
Project Name Kokopelli Section of Fruita Trail DateProject Location Fruita, CO Project No.Client City of Fruita Sample BySample LocationBH#17 @2.5-6' Tested BySample No. BS5Soil Description brown CLAY with sand (ASTM D2488)
Water-soluble sulfates, dry soil basis %
Chlorides ppm
Electro-conductivity µS/cm
pH
Corrosivity SeriesBased on HACH methods
7.6
1.620
680
2/11/20167131.74482.01
LBSJ
1211
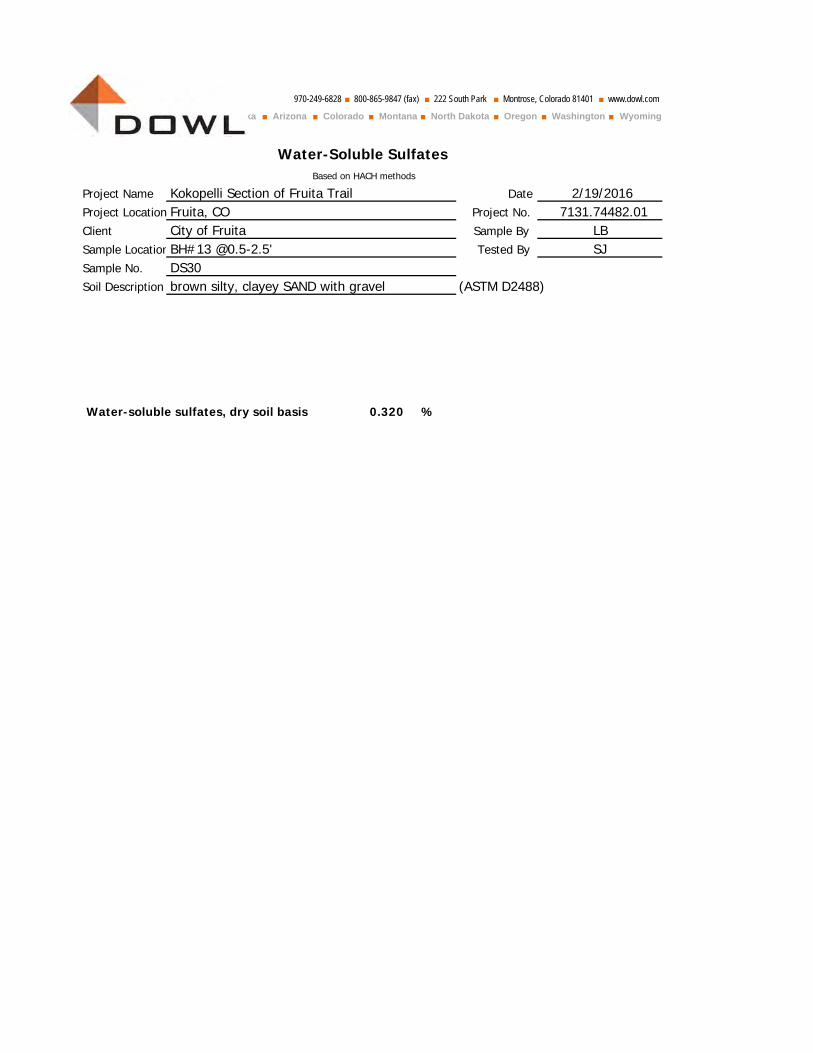
970-249-6828 ■ 800-865-9847 (fax) ■ 222 South Park ■ Montrose, Colorado 81401 ■ www.dowl.comAlaska ■ Arizona ■ Colorado ■ Montana ■ North Dakota ■ Oregon ■ Washington ■ Wyoming
Project Name Kokopelli Section of Fruita Trail DateProject Location Fruita, CO Project No.Client City of Fruita Sample BySample LocationBH#13 @0.5-2.5' Tested BySample No. DS30Soil Description brown silty, clayey SAND with gravel (ASTM D2488)
Water-soluble sulfates, dry soil basis %
Water-Soluble SulfatesBased on HACH methods
2/19/20167131.74482.01
LBSJ
0.320

970-249-6828 ■ 800-865-9847 (fax) ■ 222 South Park ■ Montrose, Colorado 81401 ■ www.dowl.comAlaska ■ Arizona ■ Colorado ■ Montana ■ North Dakota ■ Oregon ■ Washington ■ Wyoming
Project Name Kokopelli Section of Fruita Trail DateProject Location Fruita, CO Project No.Client City of Fruita Sample BySample LocationBH#13 @2.5-4.5' Tested BySample No. DS31Soil Description brown silty SAND (ASTM D2488)
Water-soluble sulfates, dry soil basis %
Water-Soluble SulfatesBased on HACH methods
2/19/20167131.74482.01
LBSJ
0.000
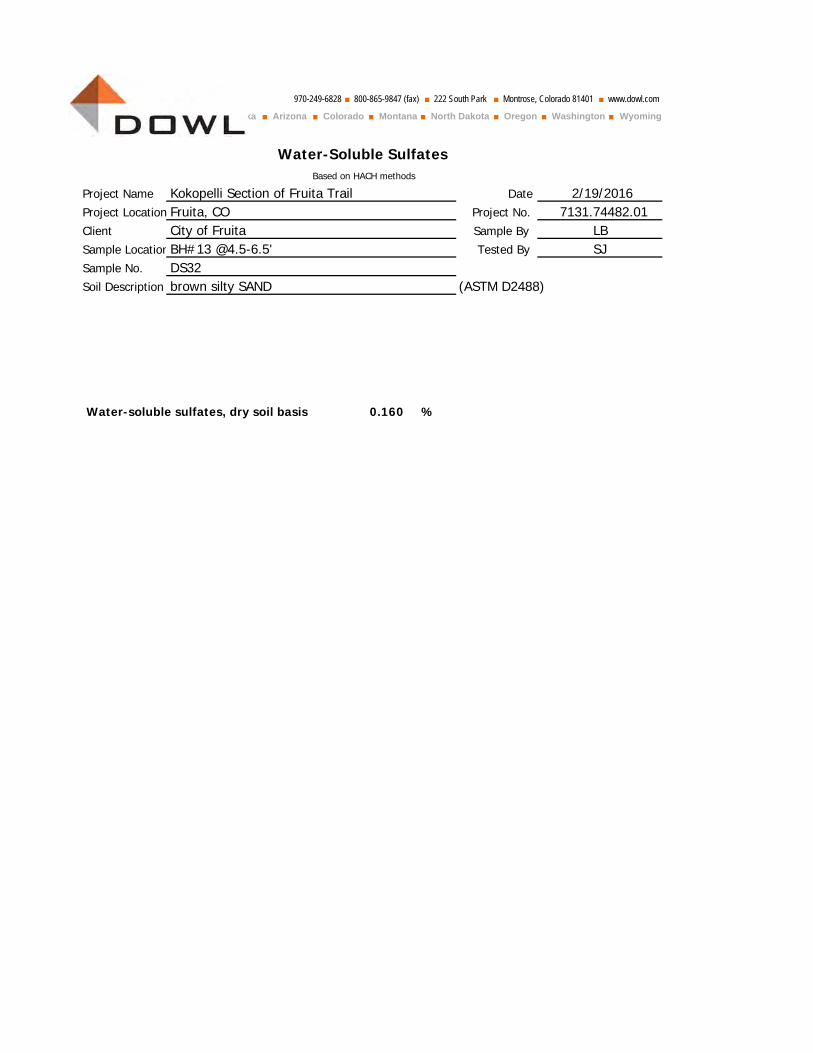
970-249-6828 ■ 800-865-9847 (fax) ■ 222 South Park ■ Montrose, Colorado 81401 ■ www.dowl.comAlaska ■ Arizona ■ Colorado ■ Montana ■ North Dakota ■ Oregon ■ Washington ■ Wyoming
Project Name Kokopelli Section of Fruita Trail DateProject Location Fruita, CO Project No.Client City of Fruita Sample BySample LocationBH#13 @4.5-6.5' Tested BySample No. DS32Soil Description brown silty SAND (ASTM D2488)
Water-soluble sulfates, dry soil basis %
Water-Soluble SulfatesBased on HACH methods
2/19/20167131.74482.01
LBSJ
0.160
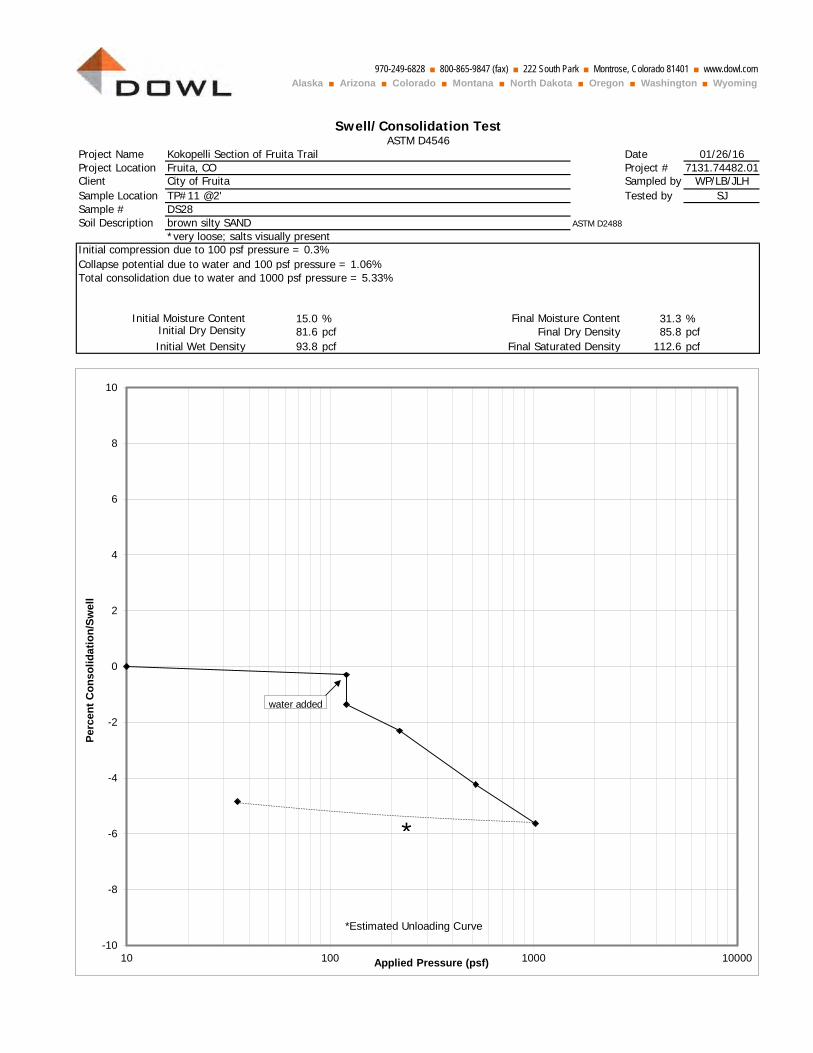
970-249-6828 ■ 800-865-9847 (fax) ■ 222 South Park ■ Montrose, Colorado 81401 ■ www.dowl.comAlaska ■ Arizona ■ Colorado ■ Montana ■ North Dakota ■ Oregon ■ Washington ■ Wyoming
Project Name Kokopelli Section of Fruita Trail Date 01/26/16Project Location Fruita, CO Project # 7131.74482.01Client City of Fruita Sampled by WP/LB/JLHSample Location TP#11 @2' Tested by SJSample # DS28Soil Description brown silty SAND ASTM D2488
*very loose; salts visually presentInitial compression due to 100 psf pressure = 0.3%Collapse potential due to water and 100 psf pressure = 1.06%Total consolidation due to water and 1000 psf pressure = 5.33%
Initial Moisture Content 15.0 % Final Moisture Content 31.3 % Initial Dry Density 81.6 pcf Final Dry Density 85.8 pcf Initial Wet Density 93.8 pcf Final Saturated Density 112.6 pcf
Swell/Consolidation TestASTM D4546
-10
-8
-6
-4
-2
0
2
4
6
8
10
10 100 1000 10000
Perc
ent C
onso
lidat
ion/
Swel
l
Applied Pressure (psf)
water added
*
*Estimated Unloading Curve
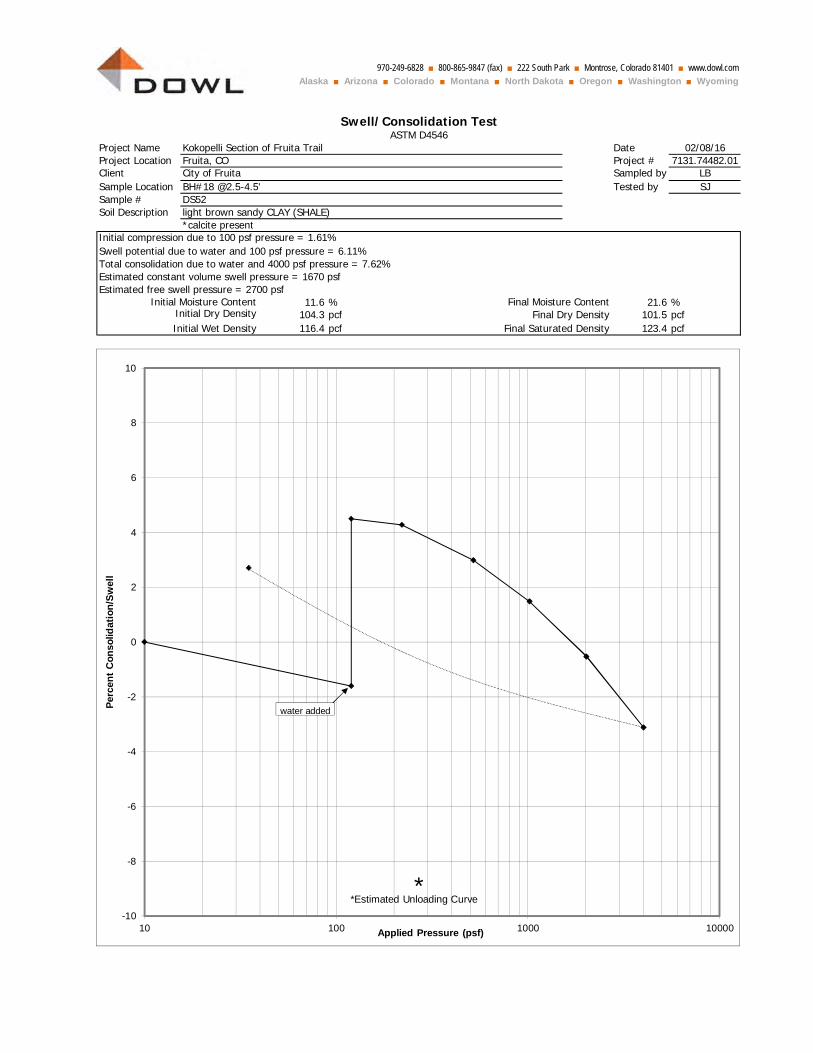
970-249-6828 ■ 800-865-9847 (fax) ■ 222 South Park ■ Montrose, Colorado 81401 ■ www.dowl.comAlaska ■ Arizona ■ Colorado ■ Montana ■ North Dakota ■ Oregon ■ Washington ■ Wyoming
Project Name Kokopelli Section of Fruita Trail Date 02/08/16Project Location Fruita, CO Project # 7131.74482.01Client City of Fruita Sampled by LBSample Location BH#18 @2.5-4.5' Tested by SJSample # DS52Soil Description light brown sandy CLAY (SHALE)
*calcite present Initial compression due to 100 psf pressure = 1.61%Swell potential due to water and 100 psf pressure = 6.11%Total consolidation due to water and 4000 psf pressure = 7.62%Estimated constant volume swell pressure = 1670 psfEstimated free swell pressure = 2700 psf
Initial Moisture Content 11.6 % Final Moisture Content 21.6 % Initial Dry Density 104.3 pcf Final Dry Density 101.5 pcf Initial Wet Density 116.4 pcf Final Saturated Density 123.4 pcf
Swell/Consolidation TestASTM D4546
-10
-8
-6
-4
-2
0
2
4
6
8
10
10 100 1000 10000
Perc
ent C
onso
lidat
ion/
Swel
l
Applied Pressure (psf)
water added
**Estimated Unloading Curve
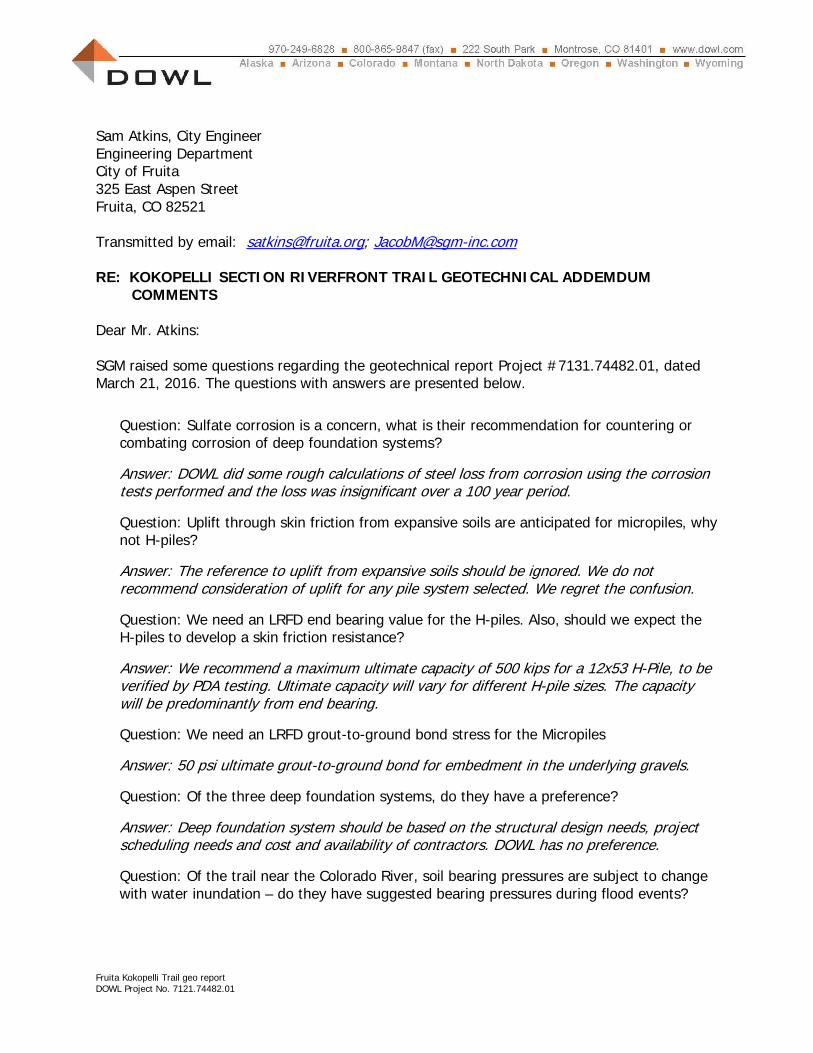
Sam Atkins, City Engineer Engineering Department City of Fruita 325 East Aspen Street Fruita, CO 82521 Transmitted by email: [email protected]; [email protected] RE: KOKOPELLI SECTION RIVERFRONT TRAIL GEOTECHNICAL ADDEMDUM
COMMENTS Dear Mr. Atkins: SGM raised some questions regarding the geotechnical report Project #7131.74482.01, dated March 21, 2016. The questions with answers are presented below.
Question: Sulfate corrosion is a concern, what is their recommendation for countering or combating corrosion of deep foundation systems?
Answer: DOWL did some rough calculations of steel loss from corrosion using the corrosion tests performed and the loss was insignificant over a 100 year period.
Question: Uplift through skin friction from expansive soils are anticipated for micropiles, why not H-piles?
Answer: The reference to uplift from expansive soils should be ignored. We do not recommend consideration of uplift for any pile system selected. We regret the confusion.
Question: We need an LRFD end bearing value for the H-piles. Also, should we expect the H-piles to develop a skin friction resistance?
Answer: We recommend a maximum ultimate capacity of 500 kips for a 12x53 H-Pile, to be verified by PDA testing. Ultimate capacity will vary for different H-pile sizes. The capacity will be predominantly from end bearing.
Question: We need an LRFD grout-to-ground bond stress for the Micropiles
Answer: 50 psi ultimate grout-to-ground bond for embedment in the underlying gravels.
Question: Of the three deep foundation systems, do they have a preference?
Answer: Deep foundation system should be based on the structural design needs, project scheduling needs and cost and availability of contractors. DOWL has no preference.
Question: Of the trail near the Colorado River, soil bearing pressures are subject to change with water inundation – do they have suggested bearing pressures during flood events?
Fruita Kokopelli Trail geo report DOWL Project No. 7121.74482.01
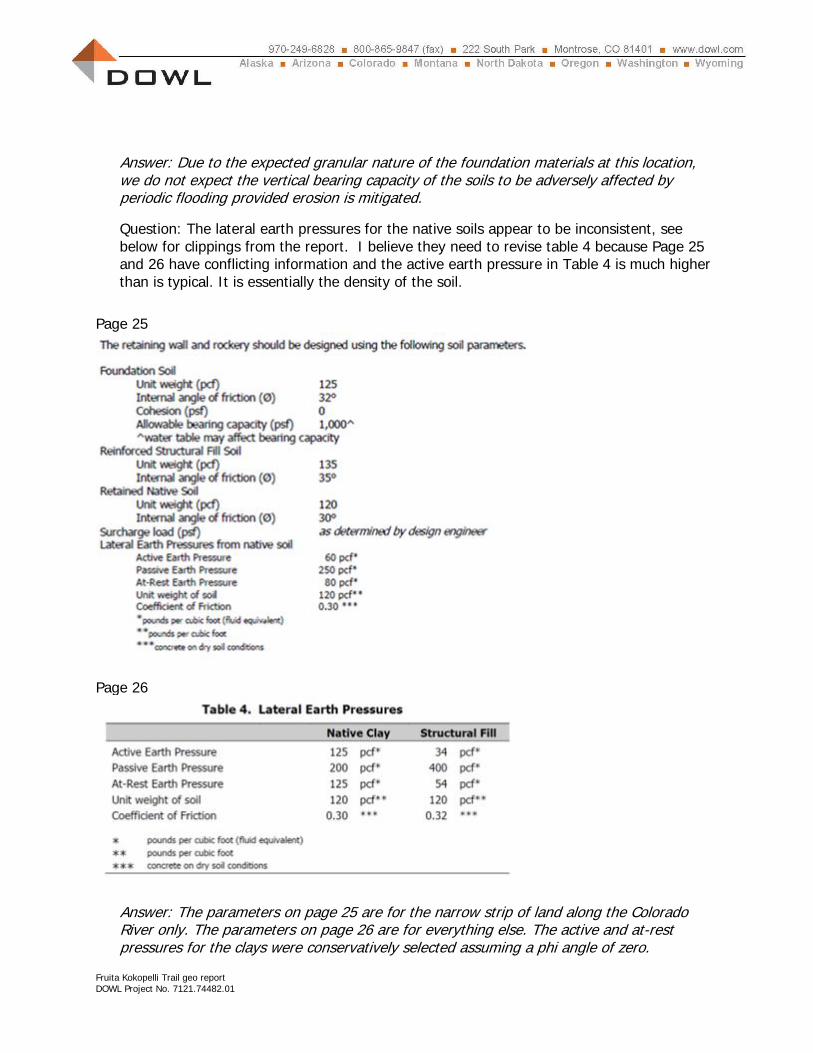
Answer: Due to the expected granular nature of the foundation materials at this location, we do not expect the vertical bearing capacity of the soils to be adversely affected by periodic flooding provided erosion is mitigated.
Question: The lateral earth pressures for the native soils appear to be inconsistent, see below for clippings from the report. I believe they need to revise table 4 because Page 25 and 26 have conflicting information and the active earth pressure in Table 4 is much higher than is typical. It is essentially the density of the soil.
Page 25
Page 26
Answer: The parameters on page 25 are for the narrow strip of land along the Colorado River only. The parameters on page 26 are for everything else. The active and at-rest pressures for the clays were conservatively selected assuming a phi angle of zero.
Fruita Kokopelli Trail geo report DOWL Project No. 7121.74482.01

We trust that this transmittal answers SGM’s questions adequately. If you have any additional questions or require clarification, please contact the undersigned by email [email protected] or telephone 970-497-8827. Respectfully submitted, DOWL Wayne Pandorf, PE Sr. Geotechnical Engineer
Fruita Kokopelli Trail geo report DOWL Project No. 7121.74482.01