kof arbeitspapiere/working papers
TRANSCRIPT

econstorMake Your Publications Visible.
A Service of
zbwLeibniz-InformationszentrumWirtschaftLeibniz Information Centrefor Economics
Hollenstein, Heinz
Working PaperDeterminants of the adoption of information and communicationtechnologies (ICT): An empirical analysis based on firm-level datafor the Swiss business sector
KOF Working Papers, No. 60
Provided in Cooperation with:KOF Swiss Economic Institute, ETH Zurich
Suggested Citation: Hollenstein, Heinz (2002) : Determinants of the adoption of information andcommunication technologies (ICT): An empirical analysis based on firm-level data for the Swissbusiness sector, KOF Working Papers, No. 60, ETH Zurich, KOF Swiss Economic Institute,Zurich
This Version is available at:http://hdl.handle.net/10419/50903
Standard-Nutzungsbedingungen:
Die Dokumente auf EconStor dürfen zu eigenen wissenschaftlichenZwecken und zum Privatgebrauch gespeichert und kopiert werden.
Sie dürfen die Dokumente nicht für öffentliche oder kommerzielleZwecke vervielfältigen, öffentlich ausstellen, öffentlich zugänglichmachen, vertreiben oder anderweitig nutzen.
Sofern die Verfasser die Dokumente unter Open-Content-Lizenzen(insbesondere CC-Lizenzen) zur Verfügung gestellt haben sollten,gelten abweichend von diesen Nutzungsbedingungen die in der dortgenannten Lizenz gewährten Nutzungsrechte.
Terms of use:
Documents in EconStor may be saved and copied for yourpersonal and scholarly purposes.
You are not to copy documents for public or commercialpurposes, to exhibit the documents publicly, to make thempublicly available on the internet, or to distribute or otherwiseuse the documents in public.
If the documents have been made available under an OpenContent Licence (especially Creative Commons Licences), youmay exercise further usage rights as specified in the indicatedlicence.
www.econstor.eu

KonjunkturforschungsstelleSwiss Institute forBusiness Cycle Research
Heinz Hollenstein
Determinants of the Adoption ofInformation and CommunicationTechnologies (ICT)
An Empirical Analysis Based on Firm-level Datafor the Swiss Business Sector
No. 60, July 2002


Paper presented at the DRUID Summer Conference on"Industrial Dynamics of the New and Old Economy - who is embracing whom?"
Copenhagen/Elsinore 6-8 June 2002
Determinants of the Adoption of Information and CommunicationTechnologies (ICT)
An Empirical Analysis Based on Firm-level Data for the Swiss Business Sector
Heinz Hollenstein
Swiss Federal Institute of Technology, Institute for Business Cycle Research (KOF), ZurichAustrian Institute of Economic Research (WIFO), Vienna
Abstract
The paper investigates empirically the decision of firms to adopt Information and Communica-tion Technologies (ICT) based on a comprehensive specification of a „rank model“ of technologyadoption (complemented by “epidemic effects”) using firm-level data for the Swiss businesssector. The explanatory variables include numerous dimensions of (anticipated) benefits fromand costs of technology adoption allowing for uncertainty as well as for information and adjust-ment costs. Moreover, the size-dependence of the adoption decision is studied in detail. Themodel yields a quite robust pattern of explanation across estimates with different adoption vari-ables (time period of adoption of specific ICT elements, intensity of use of ICT). Finally, an ex-tended version of the model explores the role workplace organisation plays as a determinant ofthe adoption of ICT.
Keywords: Technology Adoption, Information and Communication Technology (ICT), RankModel of Adoption, Size-dependence of Adoption Decisions, Workplace Organi-sation and Adoption of ICT
JEL Codes: L2, O31, O33
Dr. Heinz HollensteinSwiss Federal Institute of TechnologyInstitute for Business Cycle ResearchWeinbergstrasse 35CH-8092 Zurich, Switzerland
Phone: +41-1 / 632 53 29Fax: +41-1 / 632 10 42e-mail: [email protected]


- 1 -
1. INTRODUCTION
It is not only the generation of new technology but also, and perhaps even to a higher extent, itsdiffusion throughout the economy which affects productivity growth at the macro-level. Pilat andLee (2001), for example, show that to capture the benefits of „Information and CommunicationTechnologies“ (ICT) it is not necessary to dispose of an ICT producing sector. Timely diffusionof new technology or, from the firm’s point of view, its adoption is a key element to securingeconomic growth. It is thus not surprising that technology policy stresses the importance of thefirms‘ capacity to absorb and successfully apply technological knowledge. From this perspective,understanding the factors determining technology adoption becomes highly relevant also fromthe policy point of view.
This paper investigates the adoption of ICT in the Swiss business sector based on data collectedin a survey we conducted in autumn 2000. We dispose of firm-specific information on ICT use(e.g. time period of adoption of nine technology elements, share of employees using specifictechnologies, range of application of Internet and Intranet respectively, objectives of and obsta-cles to the adoption of ICT, etc.). Moreover, we got information referring to various structuralcharacteristics of the firm (size, industry affiliation, human resources, etc.) as well as a largenumber of variables pertaining to workplace organisation which may (potentially) serve as de-terminants of the adoption decision.
The aim of the paper is to explain the timing and intensity of the adoption of ICT well as of cer-tain elements of this bundle of technologies such as Internet, E-commerce, etc.. The investigationis primarily based on a „rank model“ of technology diffusion, which, in explaining inter-firmdifferences of adoption time and intensity, emphasises differences among firms with respect tothe profitability potential of technology adoption arising from the heterogeneity of firms. In ad-dition, we take into account information spillovers from users to non-users which are the mainelement of the “epidemic model” of technology diffusion; see Karshenas and Stoneman (1995) orGeroski (2000) for a survey of diffusion models.
In this study we apply a slightly modified version of a model of adoption we used in earlier workdealing with the introduction of “Advanced Manufacturing Technologies” (Arvanitis and Hollen-stein, 2001). Its main characteristic is a more comprehensive modelling of „rank effects“ than itis the case in most other empirical models. In explaining technology adoption we consider anumber of factors which gained attention only recently in empirical work. Firstly, (anticipated)profitability, the core factor determining adoption, is specified by taking account of many dimen-sions of benefits from as well as costs of adoption (for a similar approach see Baldwin and Ra-fiquzzaman, 1998). To this end we use information on the relevance of specific objectives of andobstacles to the adoption of ICT as assessed by the firms themselves. In this way, we take ac-count of information and adjustment costs (which, according to the survey of Karshenas andStoneman (1995), have been neglected in most analyses) as well as of anticipated benefits andrelated uncertainties as perceived by the firms. Secondly, in order to clarify the role of firm size,a variable used in almost every study of technology adoption, we proceed in two ways: on the

- 2 -
one hand, we use firm size as an independent explanatory factor (in this case it covers size-specific variables not explicitly modelled such as, for example, economies of scope); on the otherhand, we take account of the interaction of firm size with other explanatory variables (size-dependence of the model); the latter is explored by estimating the adoption model separately forsmall and large firms to see whether the driving forces behind adoption differ between the twosize classes. Thirdly, we explore the role of workplace organisation in determining the adoptionof ICT which seems to have a positive impact on productivity, not only directly (see e.g. Ichniov-ski et al., 1997; Murphy, 2002) but also indirectly through an increase of the propensity to adoptICT conceptualised as a complementary factor (see e.g. Breshnahan et al, 2002). Finally, we es-timate the postulated model with several types of adoption measures as dependent variables (e.g.time period and intensity of the adoption of specific elements of ICT, intensity of ICT use in gen-eral) in order to separate robust from shaky relationships and to identify differences in the patternof explanation for the various types of adoption variables. We expect, for example, that the firstuse of Internet (a basic element of ICT with a broad range of application) is driven by somewhatdifferent forces than the introduction of E-commerce whose profitability potential varies acrossfirms and industries to a larger extent (see e.g. OECD, 2000).
The broadly defined concept of profitability allows to identify bottlenecks of the diffusion pro-cess such as, for example, ICT-related manpower deficiencies, which may be addressed by policymeasures. Moreover, information deficiencies or lack of finance may be a problem for smallfirms but not for large ones; therefore, size-specific model estimates may show whether policy, ifnecessary at all, needs to be differentiated by firm size.
The set-up of the paper is as follows: Section 2 gives for the Swiss business sector a brief de-scription of the diffusion profile of the elements of ICT considered in this paper. The theoreticalbackground of the analysis and the specification of the empirical model are presented in Section3 and 4 respectively, followed by some information on data and method (Section 5). The empiri-cal estimates are found in Section 6. Finally, we summarise and assess the main findings, indi-cate some directions for future research and draw some policy conclusions.
2. DIFFUSION OF ICT IN THE SWISS BUSINESS SECTOR
Table 1 contains some information on the time path of adoption of nine elements of ICT in theSwiss business sector. The diffusion rate in 2003 (percentage of firms using a certain technologyin the year 2000 or planning to use it till 2003) and diffusion velocity (increase of the percentageof firms using a certain ICT element in the period 1994-2003) varies quite strongly among thesetechnologies.
For example, the degree of diffusion of PC’s being already an „old“ technology was quite high in1994 and increased since then (compared to other ICT elements), „only“ by 55%. On the otherhand, „new“ technologies, in particular Internet and related technologies (E-mail, Intranet, Extra-net), were used by a very small fraction of firms in the mid-nineties, but this share „exploded“ inthe second half of the last decade. The growth of the diffusion rate, as planned by the surveyed
- 3 -
firms for the period 2000/2003, will slow down for most ICT elements primarily reflecting thehigh level of diffusion already reached in 2000. In the years to come, diffusion will thus primar-ily take place within rather than across firms.
A characterisation of the various technology elements according to the criteria „diffusion rate“and „velocity of diffusion“ leads to the following mapping: technologies with high diffusionrates are PC’s (with low velocity) as well as E-mail and Internet (very high velocity); ICT ele-ments with a medium diffusion rate are LAN/WAN, EDI, Laptop and to some extent also DigitalAssistants (high velocity, particularly EDI), and, finally, technologies with a low diffusion rateare Intranet and Extranet (very high velocity).
These tendencies vary by firm size, strongly in case of network technologies (EDI, LAN/WAN,Intranet, Extranet), not very pronounced for other ICT elements. There are also differencesamong industrial sectors with „modern“ service industries (business services, R&D/IT firms,banking/insurance) and high-tech manufacturing taking the lead; low-tech manufacturing and„traditional services“ are in a medium position whereas the construction sector is clearly laggingin this respect. Compared to other countries, diffusion of ICT in Switzerland (business sector) ishigh: It ranks behind the USA and Scandinavia, but (together with the Netherlands) is clearlyahead of other European countries (see Arvanitis and Hollenstein, 2002, based on varioussources such as OECD, 2001).
3. THEORETICAL BACKGROUND
The main objective of this section is to formulate an equation explaining the decision to adoptICT based on a set of mainly firm-specific factors determining the profitability of new techno-logy. Within the general conceptual framework proposed by Karshenas and Stoneman (1995) ourapproach belongs rather to the category of „rank models“ emphasising the heterogeneity of firmsas determinant of inter-firm diffusion patterns, although we also take into account, to some ex-tent, epidemic effects. In the rank model, it is assumed that potential users of a new technologydiffer from each other in important dimensions so that some firms obtain a greater return fromnew technology than others do. The larger the net advantage resulting from the technology adop-tion, the stronger the tendency to adopt early and intensively.
We distinguish several groups of factors which potentially influence (positively or negatively) afirm’s profitability from adopting new technology and therefore the decision to introduce it at acertain time. A first one includes a set of anticipated benefits of new technology such as savingsof inputs, general efficiency gains, higher flexibility, improvement of product quality, etc., invarious ways (see e.g. Brynjolfsson and Hitt, 2000; OECD, 2000; Lucking et al., 2001): ICT mayreduce capital needs through, for example, lower inventory requirements, or it may save labour ingeneral or substitute for specific labour skills (e.g. sales staff, low-skill workers). It may increasethe efficient use of inputs in general (making use of the increased scope for flexible and decen-tralised work organisation). Moreover, it may lead to higher product quality at large in variousways (e.g. increased product variety and convenience, supply of complementary services). To

- 4 -
mention is also the potential of reducing transaction costs, for example, by improving relation-ships to suppliers of material, components, capital and labour, as well as the consumer-orientation. For this group of variables we expect a positive influence on the adoption decision,i.e. early and/or intensive use of the new technology is favoured.
A second category of variables, which are negatively related to adoption, refers to anticipatedbarriers to the adoption of new technology. We identify five main types of such hindrances: un-favourable financial conditions (e.g. liquidity constraints, large investment requirements, etc.);human capital restrictions (e.g. lack of ICT specialists, multi-skilled workers); information andknowledge barriers reflecting, for example, uncertainties with respect to the performance or thefuture development of ICT; organisational and managerial barriers (e.g. resistance to new tech-nology within the firm; insufficient awareness of managers of the potential gains of ICT) and,finally, sunk cost barriers which refer to the substitution costs firms have to incur in order to in-troduce the new technology, for example, in case of insufficient compatibility of ICT with exist-ing equipment or organisation.1
The firm’s ability to absorb knowledge from external sources and exploit them for its own inno-vative activities is another major determinant of innovation performance in general and of tech-nology adoption in particular. There are mainly two aspects of a firm’s absorptive capacity fornew technologies: firstly, the firm’s overall ability to assess technological opportunities in (oraround) its fields of activity in terms of products and production techniques which depends pri-marily of the endowment with human and knowledge capital (Cohen and Levinthal, 1989); sec-ondly, learning effects that may arise from earlier use of ICT or a predecessor of a specific ICTelement which embodies constituent elements of later applied, more advanced vintage; evidencefor the importance of learning effects is presented, for example, by Colombo and Mosconi(1995), McWilliams and Zilberman (1996) or Arvanitis and Hollenstein (2001). Both elementsof absorptive capacity should be positively related to early and intensive use of ICT.
Whereas these aspects of absorptive capacity are specifically related to internal conditions, thestandard epidemic model of technology diffusion stresses information spillovers from users tonon-users (“external learning”) in a more general way; various brands of this approach are dis-cussed, for example, in Geroski (2000). The epidemic model basically states that a firm’s pro-pensity to adopt a technology at a certain point in time is positively influenced by the present (orlagged) degree of its diffusion in the economy as a whole or by the proportion of adopters in theindustry or sector to which the specific firm belongs to.
Firm size and firm age are two explanatory variables which are used in most studies of adoptionbehaviour (see Karshenas and Stoneman, 1995). In this investigation, we only include firm size,since the theoretical arguments with respect to the role of firm age are not conclusive: positiveimpact on adoption in case of older firms reflecting specific (technological) experience vs. a
1 See e.g. Cainarca et al. (1990) or Link and Kapur (1994) for a treatment of these aspects based on the case of
flexible manufacturing systems, or the results of a survey on obstacles to the adoption of E-commerce (WITSA,2000).

- 5 -
negative effect for this category of firms due to lower adjustment costs in younger companieswith a more up-to-date capital stock (see Dunne, 1994).2 As already mentioned, the role of firmsize, which is expected to be positively related to adoption, is studied in some detail in this paper.Firm size plays a special role: one the one hand, it may prove to be an independent (additional)determinant of adoption, in which case it stands for firm-specific effects not explicitly modelled(capacity to absorb risks related to future ICT developments, economies of scale in E-commerce,access to capital markets, etc.); on the other hand, it may function as a proxy for variables of themodel when it is strongly correlated with them (size-dependence of the model). We shall accountfor both of these aspects at different stages of the empirical analysis.
The adoption of ICT may also be affected by (product) market conditions under which firms areoperating, particularly the competitive pressure they are exposed to. In those markets wherecompetition is fiercer, demand elasticities can be expected to be higher because of the existenceof close substitutes, thus driving firms to innovative activity or rapid technology adoption (seee.g. Majumdar and Venkataraman, 1993).3 In case of (small) open economies like Switzerlandinternational competition is a particularly effective way of forcing firms to adopt the most effi-cient way of producing or to temporarily evade competitive pressure through innovative prod-ucts; for empirical evidence, see Bertschek (1995) and, specifically for ICT (i.e. E-selling),Bertschek and Fryges (2002).
In large parts of theoretical literature, market concentration is taken to reflect competitive pres-sure. Game-theoretic models (e.g. Reinganum (1981) show that the impact of market structureupon the schedule of adoption dates depends critically on the difference of profit rates precedingand following adoption. However, this type of models does not come up with unambiguous re-sults (see the review of Reinganum, 1989), and the empirical evidence is very mixed (seeKarshenas and Stoneman, 1995). In addition, in case of a small open economy the usual meas-ures of concentration referring to the home market are not very helpful. Therefore, rather thanexplicitly including market structure as a determinant of ICT adoption, we assume that it is cap-tured by industry dummies.
Industry dummies are also used to represent two other factors influencing adoption time and in-tensity: on the demand side, favourable market prospects may exert a positive impact on theadoption of new technology because it enhances the financial room of manoeuvre of the firm; onthe supply side, (technological) opportunities determining extent and limits of the use of ICTmight vary quite strongly across industries (although there certainly are also some firm-specificdifferences in this respect). The theoretical arguments put forward so far will serve to specify thebasic model of the empirical analysis.
2 In addition, since firm size and firm age are negatively correlated, it is difficult to get reliable empirical results.3 In accordance to this line of reasoning, we have proxied in an earlier study on the determinants of innovative
activity competitive pressure through the intensity of price and non-price competition on the product market andpostulated a positive relationship to innovative activity (see Arvanitis and Hollenstein, 1994). We applied thesame argument in an analysis of the adoption of „Advanced Manufacturing Technologies“ (Arvanitis and Hollen-stein, 2001).

- 6 -
The last decade saw an impressive increase of adoption not only of ICT but also of new workpractices. It is thus not surprising that the investigation of the impact of the two factors on vari-ables such as efficiency and productivity, labour and skill demand, etc. has become a prominentfield of research. One type of studies tried to establish a direct link between organisationalchange and productivity growth (see e.g. Ichniovski et al., 1997; Black and Lynch, 2000). Simi-larly, there has been much research devoted to the analysis of the (direct) relationship of ICT andproductivity, particularly at the macro- or meso-level (among many others, see e.g. Jorgensonand Stiroh, 2000; Jorgenson, 2001; Colecchia and Schreyer, 2001); examples at the micro-levelare Lichtenberg (1995), Brynjolfsson and Hitt (1995) or Greenan and Mairesse (1996). Somerecent studies stressed the complementarity of the adoption of new models of workplace organi-sation and the introduction or a more intensive use of ICT. In this view, investments in ICT aremore productive if accompanied by suitable organisational innovations, and the productivity ofadjustments of workplace organisation is higher if it is supported by investments in ICT (see e.g.Breshnahan et al., 2002; Brynjolfsson and Hitt, 2000; Bertschek and Kaiser, 2001; McKinsey,2001).4 Against this background, we formulate an extended model of ICT adoption which com-plements the basic approach by variables representing (the change of) workplace organisation.
4. EMPIRICAL MODEL
4.1 Adoption Variable
The database (see Section 5) allows to construct various adoption variables; a first category ofmeasures refers to the time period of adoption of ICT, a second one to the intensity of use of ICTat a given point in time.
We dispose of information on five time periods of adoption for the nine ICT elements listed inTable 1. In addition, there is information on the actual and planned use of the Internet for variousobjectives (E-sales, E-procurement, etc.). We shall present results for two variables (see Table 2).The first one refers to the adoption of Internet (INTERNET) which is specified as a variable withfive response levels ranging from value 4 for the earliest adoption period (up to 1994) to value 0for firms not even planning adoption up to 2003.5 The second variable represents the adoption ofInternet-based selling (ESALES); it has three response levels with value 2 representing adoptionin the time period up to the year 2000, value 1 for 2001-2003 (planned use) and zero for “no usetill 2003”.
To construct a variable for adoption intensity, we used information on the within-firm diffusionof certain technologies (PC’s, Internet, Intranet) as well as on the diffusion rate of the variouselements of ICT. We present again results for two variables (see Table 2). Firstly, we calculated afour level ordinal measure of the overall ICT intensity (ICTINT), defined as the number of ICT
4 An open question is whether complementarity is contemporaneous, or whether one of the two factors is lagging.
Breshnahan et al. (2002), for example, assumes that workplace organisation is fixed in the short run whereas theuse of ICT can be adjusted quite quickly.
5 Estimates with an alternative number of response levels, e.g. three or four responses, yielded very similar results.

- 7 -
elements (as listed in Table 1)6 already in use in the year 2000: intensity level 3 in case of 7 to 9ICT elements, level 2 for 5-6 technologies, level 1 for 3 to 4 items and level 0 if less technologies(0 included) have been introduced. The second intensity variable refers to the intensity of use ofInternet measured by the proportion of employees regularly working with this technology in theyear 2000; this variable (NETUSE) is also measured on an ordinal scale since the surveyed firmsreported estimates on the share of Internet workers based on five categories (up to 20%, 21-40%,41-60%, 61-80%, 81-100% of employment). Adding the non-users we get an ordinal variablewith six response levels.
4.2 Determinants of ICT Adoption
Table 3a,b gives an overview on the empirical specification of the variables which reflect thevarious groups of factors determining technology adoption as set out in Section 3. The first set ofvariables refers to the objectives of ICT adoption which are interpreted as proxies for anticipatedrevenue increases (benefits) due to the use of new technology. This interpretation can be justifiedon ground of evidence on the impact of the use of ICT on the firms’ efficiency (based on theirassessments measured on a five-point Likert scale with a value range of “highly negative contri-bution to efficiency” (value -2) up to “strong increase of efficiency” (value 2). Not less than 61%of the surveyed firms report positive effects, whereas only 1% see a negative impact of ICTadoption on overall efficiency. The three metric variables listed in Table 3a under the heading„objectives” are factor scores resulting from a principal component factor analysis of 13 objec-tives of the use of ICT included in the questionnaire (for details on the factor solution see TableA.1 in the Appendix).7 The first factor (MARKET) is related to anticipated benefits on the reve-nue side; in addition to higher sales in general, ICT is expected to yield benefits from higherquality, more variety, the supply of complementary services, stronger presence at the market andstronger customer-orientation. The second factor (COST) is related to cost reduction in generaland, more specifically, to advantages to be gained from improving internal communication anddecisionmaking as well as optimising production processes. This factor is, to some extent, relatedto workplace organisation, which is treated separately in the extended version of the model. Thethird factor (INPUT) covers anticipated advantages from improving external relationships on theinput side (labour market, co-operation with suppliers) as well as with respect to technology. Forthese three variables, which cover to a large extent the benefits expected from the use of ICT asproposed by literature (see Section 3), we expect to find a positive influence on the adoptionvariables.
6 We decided to rescale the count data information (0 up to 9 technologies) into ordered categories (ordinal vari-
ables) because of the non-equivalence of the elements (not each additional ICT element is of the same impor-tance: e.g. PC vs. Extranet). Although this problem of non-equivalence cannot be definitely solved it is muchweakened by reducing the 9 counts to 4 ordinal groups.
7 The main characteristics of the factor solution are quite independent from the procedures used for factor extrac-tion (principal component vs. maximum likelihood) and rotation (varimax vs. equamax). The final factor solutionas presented in Table A.1 accounts for 58% of total variance which is quite satisfactory.
- 8 -
Secondly, the model covers all five categories of obstacles to the adoption of ICT we identifiedin Section 3 (see Table 3a). They should lead to late and less intensive adoption (negative sign).A first variable (NOUSE) captures the fact that in some instances there is hardly a “real poten-tial” for using ICT. The other four variables reflecting impediments to the use of ICT are againthe result of a principal component factor analysis (for details of the four-factor solution, whichis based on the firm’s assessment of the relevance of 12 obstacles to adoption and explains 65%of the variance, see Table A.2 in the Appendix). The four metric variables, with the exception ofthe factor standing for problems of financing ICT investments (INVCOST), can be interpreted,primarily, as proxies for uncertainties, information problems and adjustment costs related to theintroduction of ICT (variables KNOWHOW, TECH, COMPAT). They thus capture determinantsof adoption which are neglected in most studies treating this topic (see Karshenas and Stoneman,1995).
The firm’s ability to absorb knowledge from external sources, which we expect to be positivelyrelated to early and intensive adoption, is captured by three variables measuring the availabilityof human and knowledge capital (see Table 3a): EDUC, the share of employees with qualifica-tions at the tertiary level, is a general measure of the firm’s ability to assess technological op-portunities and to use external knowledge for own innovative activities. INNOPD, a dichoto-mous measure indicating whether a firm launched product innovations in a three years referenceperiod (1998-2000), is used to take into account the finding of Cohen and Levinthal (1979) ac-cording to which internal innovative activity is a precondition for successfully using externalknowledge. The third variable we employ to capture absorptive capacity is more directly linkedwith ICT: we use the share of employees which, in a reference year (1999), attended ICT-oriented training courses (TRAINING) as a proxy for the firm’s specific knowledge in ICT; sinceknowledge required to mastering ICT is rapidly changing, a variable reflecting investment inICT-specific training is probably a suitable measure.8 Since some training is necessary when ICTis introduced, this variable is not strictly exogenous reflecting the already mentioned comple-mentarity hypothesis of Breshnahan et al. (2002).
It is not easy to find suitable proxies for measuring learning from previous vintages of ICT in across-section framework. Variables which measure learning in the field of ICT in general, suchas, for example, the intensity of use of PC’s at an early stage, are problematic since they are de-termined by similar factors as measures reflecting ICT intensity at a later stage. Therefore, weexplored the role of learning only in one specific case where an earlier and a later vintage oftechnology are clearly linked: we hypothesise that experience with electronic data interchange(EDI), measured by the dummy variable EDI97 (adoption of EDI in 1997 or in earlier years),favours adoption of E-selling (although adjustment costs incurred by the substitution of Internet-based selling for the use of EDI work in the opposite direction). “External learning” through in-formation spillovers (“epidemic effects”) is represented by the ICT diffusion rate at industry
8 We do not dispose of information with respect to the share of high- or medium-skilled workers with a degree or
certificate in the field of ICT.

- 9 -
level; the percentage share of firms which are, in the year 1997, more ICT-intensive than the av-erage-firm of the industry the company belongs to (EPIDINT) is used in explaining the time pe-riod of adoption of Internet and the two variables measuring ICT intensity in the year 2000(lagged epidemic effect). In case of E-selling, where, in our dataset, the first adoption period re-fers to 1998/2000, “epidemic” effects are proxied by the industry-specific diffusion rate in 2000(EPIDSALE; contemporaneous effect).
Firm size (S) is measured by dummy variables related to five size classes based on the number ofemployees with large firms (500 and more employees) as reference group. In this specification, anegative sign stands for positive size effects. An alternative specification of firm size based onthe number of employees and its square yielded very similar results.
International competition on the product market as an incentive to engage in ICT is proxied bythe firm’s export propensity, i.e. the sales share of exported goods and services. We use a speci-fication with a linear as well as a quadratic term (variables X, X2) assuming that the export shareis positively related to the adoption rate up to a certain level beyond which no further impact is tobe expected.9
As a last element of the basic version of our empirical model, we include 15 industry dummies(see Table 3a) which should capture differences with respect to technological opportunities(more scope for ICT in knowledge-based industries), demand prospects (e.g. high growth rates insome service industries), market structure and other not explicitly specified factors determining afirm’s propensity to adopt ICT.
The extended model includes as additional variables various elements of workplace organisationas well as some measures of organisational change related to the period 1995-2000 (see Table3b). Firstly, we take into account three types of (new) work practices, i.e. teamworking (TEAM),job rotation (ROTATE) and multi-skilling (MSKILL). The first two variables measure the diffu-sion within the firm of teamworking and job rotation respectively on an six-point ordinal scale(“very common practice” to “does not exist”). MSKILL represents the degree of diversity oftasks an “average worker” performs (5-point scale; “very high” to “very low”). We expect thatthe existence of these work practices are a favourable environment for early and intensive adop-tion of ICT. Similarly, a high degree of worker’s participation in decisionmaking is assumed toimpact positively on the adoption of ICT. To get a measure of the role of workers in decision-making, we conducted a principal component factor analysis of 7 dimensions of work for whichthe surveyed firms assessed the balance of decisionmaking power between managers and workers(5-point scale ranging from “manager decides alone” up to “decision is the sole responsibility ofthe worker”). This analysis (for details see Table A.3 in the Appendix) yielded two factors, thefirst one (variable PRODDEC) pertaining to dimensions of work which are related to the pro-duction process (design of work process, distribution of tasks among workers, etc.), the second
9 In earlier work, we used the number of principal competitors at world scale as a measure of international compe-
tition (see e.g. Arvanitis and Hollenstein, 1994, 2001); this information, however, is not available in the datasetused in this study.

- 10 -
one (USERDEC) primarily related to customer-oriented tasks (regular contact with customers,contact with clients in case of complaints). Two additional variables reflect the process of de-centralising decisionmaking power within a firm during the second half of the nineties:DELCOMP gives information whether there has been an increase of delegation of decisionmak-ing power towards the workers (yes/no), FLAT stands for a flattening of the hierarchical structure(yes/no); both variables are expected to favour adoption of ICT. Alternatively, using a procedureproposed by Breshnahan et al. (2002), we constructed a compound measure of new workplaceorganisation (ORG) by adding-up the standardised values of TEAM, ROTATION, MSKILL,PRODDEC, USERDEC, DELCOMP and FLAT.
5. DATA AND METHOD
The analysis is based on firm data of the Swiss business sector collected in a survey we con-ducted in autumn 2000. The available information is to a large extent qualitative in nature(nominal or ordinal measures). The questionnaire yielded data on the time profile of the intro-duction of nine ICT elements, the intensity of use of ICT, the assessment of a number of objec-tives pursued by introducing ICT and the importance of factors impeding its application, the spe-cific use of ICT elements such as Internet or Intranet and the impact of ICT on efficiency andlabour requirements. Besides we got information on the adoption of new work practices (team-working, job rotation, distribution of decisionmaking power at the workplace, etc.) and trainingactivities, which presumably are relevant when a firm decides on the adoption of ICT. Finally,we dispose of information about structural characteristics of firms such as size, industry affilia-tion, propensity to export, human capital endowment, etc. which may also serve as determinantsof ICT adoption.
The questionnaire.10 has been addressed to a sample of 6717 firms with five or more employees,which covered the business sector of the economy (see Table A.6 in the Appendix). The samplehas been (disproportionally) stratified by 28 industries and three industry-specific firm sizeclasses with full coverage of large firms. The response rate of about 40% (2641 firms) is quitesatisfactory in view of the very demanding questionnaire. To correct for „unit“ non-response, weconducted a non-response analysis with 650 firms (response rate 94%). We found some selectiv-ity bias which has been corrected by a suitable weighting scheme (for the method used, seeDonzé, 1998). The structure of the dataset in terms of firm size and industry is, with a few ex-ceptions, very similar to that of the underlying sample (see Table A.6).
“Item” non-response is another problem of survey data. The usual procedure of dropping obser-vations with incomplete data may produce biased estimates of means, proportions and regressioncoefficients. To solve this problem, we used the „multiple imputation“ procedure (see Rubin,1987); the details of this method as applied in the present case, as well as its robustness aredocumented and discussed in Donzé (1998). By substituting imputed values for missing ones wecould avoid a loss of observations. 10 The questionnaire can be downloaded from www.kof.gess.ethz.ch.
- 11 -
Since the dependent variables of the adoption model are measured on an ordinal scale (three tosix ordinally scaled response levels), the ordered probit procedure is an appropriate method forestimating the adoption equations.
6. EMPIRICAL RESULTS
6.1 Time Period and Intensity of ICT Adoption
Time period of ICT adoption
The estimation results for the time period of adoption of two elements of ICT, i.e. Internet (vari-able INTERNET) and Internet-based selling (ESALES), using the basic model are presented inTable 4. As can be seen from the results for specification 1 (columns 1 and 5 respectively), withone exception (export propensity in case of ESALES), all categories of explanatory variablesdistinguished in Section 5, though not to the same extent, have a statistically significant impact.The overall fit of the model is satisfactory. The core of our adoption model is thus confirmed.
More specifically, we conclude that a multidimensional modelling of anticipated benefits andcosts of ICT adoption, a specific feature of our approach, does pay off. Among the anticipatedbenefits, those related to market- and customer-orientation (MARKET) are the most importantones in case of both dependent variables;11 it is not surprising that this is particularly pronouncedin case of ESALES. Cost- and input-related benefits (COSTRED, INPUT) are only relevant forexplaining the adoption of Internet. Among the obstacles to the adoption of these two ICT ele-ments, insufficient opportunities to benefit from an application (NOUSE) are an important factorin both cases. With regard to other obstacles, Internet and Internet-based selling are different: forthe former, investment costs and financial restrictions and, even more, knowledge problems (de-ficiencies with respect to qualified manpower, management as well as information problems) areimportant (INVCOST, KNOWHOW); in the latter case, we find a statistically significant (butunpredicted) positive sign for uncertainties with respect to technology and performance (TECH);this result could reflect the fact that E-selling has been characterised by particularly high uncer-tainties at an early stage of diffusion (see WITSA, 2000). We find no evidence for compatibilityproblems which imply high adjustment costs (COMPAT); these are presumably more importantif a whole bundle of ICT elements is introduced rather than a single element (see the results forICT intensity below). We also find, as predicted, that the various dimensions of absorptive ca-pacity as well as the propensity to export strongly stimulate early adoption of the Internet but notthat of E-selling (except variable INNOPD). This difference may be compensated for by thestrong effect we find, in case of ESALES, for information spillovers (“epidemic effects”) re-flecting a particularly strong pressure to keep up to competitors in case of this technology whichis more directly geared to the market than Internet (overriding the impact of absorptive capacity).In addition, “internal” learning” from the use of a predecessor technology (EDI) also plays animportant role in fostering early adoption of E-selling; this result implies that the adjustment
11 The coefficients of the variables measuring the objectives of ICT adoption can be directly compared since their
values are standardised; the same holds for the obstacles to adoption.

- 12 -
costs a firm incurs when it substitutes Internet-based selling for using EDI are lower than thebenefits to be captured from this change. In case of Internet, firm size dummies, with companiesemploying 500 or more persons as reference group, are negatively related to adoption (higherpropensity to adopt in case of large firms); however, beyond a threshold of 200 employees, nosize effects can be detected any more.
A closer look at these size effects based on a comparison of the results of specification 4 (no sizedummies) with those reported for specification 1 (size variables included) points to a certain in-teraction between firm size and some variables of the model. For example, when firm size is in-cluded in the model, the influence of anticipated benefits decreases; small firms expect thuslower benefits from adoption of Internet and E-selling than large ones what implies later adop-tion for this size-class. There is also some interaction with variables representing absorptive ca-pacity but it is somewhat ambiguous (see EDUC vs. INNOPD), and for learning from EDI(smaller impact when size is included implying higher experience effects in case of small firms).In spite of these interactions, the basic pattern of the results remains quite the same pointing tothe robustness of the rank and epidemic effects explicitly modelled in our approach. Interest-ingly, there is hardly any loss of explanatory power when firm size dummies are dropped. Hence,at least for these two adoption measures, there is no evidence for independent size effects whichwould cover effects not explicitly specified in the model; the results rather point to some size-dependence of the model which will be investigated later on (see Section 6.2).
Industry dummies (construction sector as reference group), which in many cases are statisticallysignificant, are strongly correlated with epidemic effects (compare specification 2 and 3). Sincethey are presumed to capture differences among industries with respect to market conditions andtechnological opportunities, this result is not surprising. The other explanatory variables as wellas the model fit are hardly influenced when industry variables are dropped, independent of theadoption variable used (see specification 1 vs. 2).
Intensity of use of ICT
Table 5 shows the results of estimations for two variables representing the intensity of use of ICTbased on an overall measure (ICTINT: number of ICT elements) and another one referring to theInternet (NETUSE: share of employees working with Internet). The structure of the table is thesame as that of Table 4 (specification 1 to 4 for both dependent variables). The pattern of expla-nation is similar for the two intensity variables. More importantly, it is also not much differentfrom that we found for the two variables representing the time period of adoption. However, theexplanatory power of the model explaining the intensity of adoption is higher, quite distinctly incase of the overall intensity ICTINT.
There are also some differences of the explanatory pattern between ICT intensity and that cap-turing the first use of ICT elements; this holds particularly true in case of ICTINT. Firstly, on thebenefit side of anticipated profitability, market- and customer-orientation is less important incase of both intensity variables, whereas cost-oriented factors are now more relevant. Secondly,among the obstacles to adoption, investment costs and funding restrictions are a bigger problem

- 13 -
indicating that in case of an already larger ICT infrastructure investment needs are increasing(transition to more complex, network-oriented technologies). Similarly, the lack of a potential touse these technologies is higher in case of intensity variables, again a plausible result; if the in-troduction of one ICT element is already not very promising, the more this holds true when amore intensive application of ICT is to be explained. We respect to knowledge and informationproblems, the comparison of intensity variables and the first use of ICT yields mixed result; thelargest negative impact we find refers to the intensity of use of the Internet, the lowest for theintroduction of E-selling. Thirdly, the capacity to absorb external knowledge is distinctly a moreimportant factor determining adoption when intensity measures are used as dependent variable;this result is plausible in view of the more complex problems to be solved when a large set ofICT elements has already been adopted (again: transition to more complex technologies likeIntranet, etc.). A similar argument holds for difficulties of compatibility which are, against ourprediction, positively correlated with ICT intensity; if the ICT infrastructure is already highlydeveloped, incompatibilities and high adjustment costs may be a more prominent obstacle than incase of ICT adoption from scratch. Fourthly, in case of the two intensity variables we find againsome interaction between firm size and some of the other explanatory variables (compare theresults of specification 1 including size dummies vs. 4 where these variables are dropped). How-ever, despite this interaction, and in clear contrast to the estimates explaining the time period ofadoption, the model fit in case of the overall measure of ICT intensity (but not regardingNETUSE, an intensity variable referring to a single technology variable) is significantly betterwhen size dummies are included. We find thus partial evidence for an independent impact offirm size (representing not explicitly specified influences).
6.2 Size-dependence of the Adoption Behaviour
As just mentioned, firm size is only partially an independent explanatory factor. However, wehave got more evidence of an interaction of firm size with other explanatory variables (size-dependence of the model). In the following, we explore the latter aspect by estimating the adop-tion model separately for small and large firms. In this way we shall see whether the drivingforces behind the adoption of ICT differ between the two size classes We use a threshold of 50employees to separate small from larger firms. This may appear low; however, one should takeinto account that the cut-off point of the sample in terms of firm size is very low (5 employees)and that the sample covers the service and the construction sector as well which are characterisedby a high number of small firms. In addition, it turned out that dummies referring to size classesbeyond 200 employees are insignificant. In view of the low threshold we use size dummieswithin the two size categories of firms with the same reference group as before (500 and moreemployees).
In Table 6, we present estimates differentiated by small and larger firms for the time period ofadoption of two ICT elements (Internet, E-selling) and two intensity variables (overall ICT inten-

- 14 -
sity, intensity of Internet use).12 For both size classes all categories of variables of the modelcontribute significantly to explaining adoption behaviour. The explanatory power of the model ishigher in case of small firms, particularly when the overall ICT intensity (and the first use ofInternet) is used as dependent variable.
Taking a closer look at the results reveals some differences between the two size classes withrespect to the role played by individual variables. Firstly, although anticipated benefits have thesame pattern of impact on ICT in qualitative terms there are some important differences withrespect to the magnitude of the parameters (as already mentioned, these can be directly comparedsince the variables are standardised). In general, market- and customer-orientation (MARKET)and, even more, input-related benefits (e.g. supplier-relations) are of particular relevance in caseof small firms. Considering the obstacles to adoption the differences are larger, in the first in-stance in case of ICT intensity. Whereas the variable NOUSE (lack of a potential to using ICT) isa bigger problem for small firms, the opposite is true with regard to the costs of the technology aswell as human and knowledge capital deficiencies (information and management problems; lackof qualified persons). These size-specific differences with respect to the expected net benefits(“revenues net of “costs”, i.e. obstacles) seem to be consistent with the more complex nature ofICT in case of larger firms which more often operate near to the technological frontier and themore urgent need to get a quick return on investments in ICT in small companies (either noadoption at all or adoption directly oriented towards input and output markets ). However, we donot get a clear size-specific pattern in case of the ability to absorb external knowledge; the differ-ences are not the same for the three variables representing absorptive capacity, and they vary tosome extent across the four dependent variables. In contrast, there are some differences with re-spect to the relevance of competition as a factor forcing firms to adopt ICT: exposure to foreigncompetition is a more important driver of adoption for small firms than for larger ones; thisseems plausible since the differences with respect to export propensity are much smaller amonglarge firms. Similarly, epidemic effects are stronger in case of small firms for three out of fouradoption variables; only in case of Internet-based selling, larger firms seem to feel a strongerpressure to follow suit their competitors (variable EPIDSALE).
In view of these (mostly) plausible results, this type of analysis seems to be an appropriate in-strument to uncover systematic differences of adoption behaviour of firms belonging to differentsize classes. This procedure complements the (more traditional) analysis of size-effects based onparameter estimates for firm size included as a separate variable in an adoption model (“inde-pendent size-effects”).13
12 Estimates with three firm size classes (less than 20, 20 to 99, 100 and more employees) yielded similar results.13 For an alternative procedure, i.e. estimation of size-specific parameters for each explanatory variables in a single
equation framework, see Arvanitis (1997). Experience shows that this method leads to very similar results asseparate estimates for size-specific subsamples.

- 15 -
6.3 The Role of Workplace Organisation
Organisational change increases productivity directly and, in particular, when it is complementedwith the use of ICT and accompanied by training measures (see Breshnahan et al., 2002). There-fore, one may expect that the adoption of new work practices contributes to intensify the use ofICT (or to adopt it at an early point in time). The extended model of adoption, as specified inSection 3, takes account of this proposition.
Table 7 shows estimations for this extended model using the intensity of use of ICT as dependentvariable (ICTINT). Since our survey yielded information about organisational matters only forfirms with at least 20 employees (against a threshold of 5 employees in the rest of the survey) wedispose of a reduced dataset of 1667 firms as against 2641 observations in the original sample.14
Therefore, to start with, we re-estimated the basic model explaining ICTINT (see column 1). Thepattern of explanation is more or less the same as based on the larger sample with some (small)differences easily to be explained: by dropping very small firms variables such as NOUSE (noreal potential to use ICT) or X (propensity to export) loose some of their explanatory power. Cor-respondingly, the model fit is slightly lower reflecting the fact that the model performs particu-larly well in case of small firms (see Section 6.2).
Next we estimated the model where the basic specification is complemented with organisationalvariables, either based on various elements of new workplace organisation (column 3: team-working, job rotation, multi-skilling, degree of decentralised decisionmaking in production andin contact with users, tendency of decentralising decisionmaking and of flattening hierarchicalstructures during 1995 and 2000), or based on an aggregate measure developed from these or-ganisational elements (column 2: ORG4; for details of the variable specification see Table 3b).As can be seen from the two equations, both types of organisational variables exert a statisticallysignificant influence on ICT adoption. Among the individual organisational elements, team-working, decentralised decisionmaking at the workplace and lowering hierarchical layers are therelevant dimensions of workplace organisation in explaining the use of ICT.
However, as revealed by comparing equation 2 and 3 respectively with equation 1, adding or-ganisational variables to the basic model does hardly improve explanatory power. A closer lookat the pattern of explanation shows that including organisational variables reduces, to some ex-tent, the impact of the proxies for human and knowledge capital (absorptive capacity) as well asof firm size. We find, indeed, highly significant correlation coefficients (between 0.20 and 0.30)between these variables and “organisation”. Therefore, we dropped in a first step the three vari-ables representing human and knowledge capital (EDUC, TRAINING, INNOPD) and, in a sec-ond step, also the firm size dummies. This exercise, as equations 4 and 5 show, leads to a sub-stantial increase of the parameter measuring the impact of workplace organisation (ORG4) from
14 2% of the firms of the final data set answered the questionnaire although they employed less than 20 persons in
2000; since they had a larger staff according to the census data of 1998 on which the sample was based on, theyalso participated at this part of the survey. For this reason we inserted a dummy S1 also in the extended versionof a model.

- 16 -
0.21 to 0.31 and 0.35 respectively; similarly, the coefficient of the objective variable COSTREDrepresenting also elements of workplace organisation (optimisation of the production process,improving decisionmaking, improving internal communication; see Table A1 in the Appendix)increases from 0.37 to 0.42 in equation 5 (with no change in equation 4). These results indicatethat organisation may interact with human capital as well as with ICT as put forward in recentwork mentioned above and in Section 3.
We are also confronted with the problem of endogeneity in estimating the equation of ICT adop-tion. A simple way to correct for endogeneity of ORG4, representing (the change of) workplaceorganisation is to introduce a lag between ORG4 and ICTINT. This procedure reflects the as-sumption made in Breshnahan et al. (2002) according to which organisational adjustments takelonger than changes of technology or human capital endowment. Organisation is considered as aquasi-fixed factor in the short run, whereas complementarity between the three factors involvedis characteristic for the longer run. Column 6 of Table 7 shows the result of an estimate where, asdependent variable, the intensity of use of ICT planned (expected) for the year 2003 replacesICTINT which refers to 2000; in this way, ORG4 is lagged by three years since it is related to theyear 2000 (and to changes in the period 1995-2000). The model fit of this specification is sub-stantially better than that of equation 2 (ICT intensity 2000, no lag of ORG4). However, the or-ganisation variable still does not add much to the explanatory power of the basic model. In thesame way as before, inclusion of lagged ORG4 reduces the coefficients of human and knowledgecapital as well as the impact of firm size. Organisation my thus interact with ICT (and humancapital) even if we take account of lagged effects.
A more fundamental way of taking account of such interactions is to look for evidence of thereverse causality, i.e. to investigate whether the adoption of ICT exerts an influence on (thechange of) workplace organisation. To this end, we specify an equation explaining the adoptionof new work practices where ICT is one of the explanatory variables. The structure of this “or-ganisation model” is the same as that of the “ICT model”; it is only the content of the two catego-ries of variables “anticipated benefits” (objectives of organisational change) and “adjustmentcosts” (obstacles to organisational innovations) which makes the difference. Information about anumber of dimensions of objectives of and obstacles to organisational change (stemming alsofrom our survey) are again condensed to a few variables using the technique of principal compo-nent factor analysis. As a result of this exercise, which is documented in the Appendix (Table A4and A5), we obtain two variables representing anticipated benefits of new work practices as wellas three factors depicting barriers to change of workplace organisation. Among the benefits, thevariable PERS represents the potential of exploiting previously untapped human resources byreorganising work (strengthening motivation, use of specific knowledge of workers, etc.), andCOSTLEX stands for the expected gains from reducing costs and enhancing organisational flexi-bility to adjust to exogenous changes. Insufficient readiness on the workers and management sideis one of the barriers preventing reorganisation (HUMAN). The others refer to difficulties en-countered in the adjustment process (e.g. slow speed of adjustment; variable ADJDIFF) and thecosts of organisational adjustments (ADJCOST). Another variable representing impediments to

- 17 -
organisational innovations, which we did not extract by use of factor analysis, is NONEED, ameasure of the absence of any necessity to changing organisational structures.
Table 8 shows the results of estimations of this model explaining the adoption of new workplaceorganisation with column 1 (equation without an ICT variable) as starting point. Anticipatedbenefits (but not impediments, with the exception of variable NONEED), human and knowledgecapital as well as firm size are the most important determinants of (the change of) workplaceorganisation. The results for the extended version of the “organisation model” where the basicspecification is complemented with a variable reflecting the intensity of use of ICT are presentedin column 2. It turns out that ICT exerts a statistically significant influence on the adoption ofnew work practices; however, as in the case of the ICT model, the extension hardly improves themodel fit because other variables of the model loose some of their explanatory power (firm sizeand, to a lesser extent, human and knowledge capital). We also note that the explanatory powerof the “organisation model” is substantially lower than that of the “ICT model”. Dropping thehuman and knowledge capital variables (column 4) and, additionally, firm size (column 5) pro-duces a strong increase of the coefficient of the ICT intensity (from 0.31 to 0.45 and 0.51 respec-tively), an indication of a significant interaction between ICT intensity, human capital and workorganisation. If ICT intensity is specified as a lagged variable (lag of 3 years) the model fit doesnot improve (column 3); endogeneity can thus not resolved in this way.
The results we gained from estimating the extended “organisation model” and those we foundwith the extended version of the “ICT model” point in the same direction: ICT intensity andworkplace organisation seem to interact; both directions of causality yield statistically significantresults. This finding is based on estimates in a single-equation framework and should be checkedby a simultaneous estimation; this procedure might also give a hint with respect to the relativemagnitude of the effects (in this respect the single-equation framework yields no reliable results).However, we would be quite surprised if simultaneous estimations would substantially the basicconclusion.15 We conclude that our results are in line with those of some recent studies whichfound that ICT, new workplace organisation and human capital are complementary factors toincrease the efficiency of production and the quality of products (see e.g. Breshnahan et al., 2002;Brynjolfsson and Hitt, 2000; Bertschek and Kaiser, 2001).
7. CONCLUSIONS
The adoption behaviour of Swiss firms in the field of ICT is characterised by a basic pattern ofexplanation which is quite robust across model estimations with different adoption variables. Allcategories of explanatory variables, though to a different extent, are relevant. Most important are(various dimensions of) anticipated benefits and costs of adoption, the firm’s ability to absorbknowledge from other firms and institutions, information spillovers between firms, experiencewith earlier vintages of a certain technology and (international) competitive pressure. In addition
15 Another extension would be the estimation of a simultaneous model where human and knowledge capital input
would also be considered as an endogenous variable.

- 18 -
to these firm-specific effects, there is also strong evidence for industry effects (with a higherprobability of adoption in some high-tech industries, modern services and trade) which, amongelse, reflect different technological opportunities. Moreover, there are some interesting differ-ences between the results for the various types of adoption variables (first use of specific ICTelements vs. measures of the intensity of ICT use), which in most cases seem plausible.
The results strongly confirm the usefulness of modelling anticipated profitability of technologyadoption in more detail than it is the case in most empirical models by taking account of a wholeset of cost and revenue components. It turns out that the adoption of ICT is not only a cost-reducing technology but has also a great potential to generating product innovations, increasingcustomer-orientation, etc.. In addition, it is shown that financial and know-how problems aremore important obstacles to adoption than technological uncertainties and switching costs.
The role of firm size, which belongs to the most prominent variables included in models of tech-nology adoption, is analysed in some detail. It turned out that firm size is an independent ex-planatory variable (covering size-specific variables not explicitly accounted for in the model)only in case of one of the four adoption measures we used (i.e. overall intensity of ICT use).However, the adoption model is shown to be size-dependent, i.e. firm size interacts with otherexplanatory variables. This specific feature of our approach of analysing size-effects is able touncover systematic differences of adoption behaviour of firms belonging to different size classes.For example, the analysis of anticipated benefits and costs of adoption shows that small firmschoose either to not engage in ICT at all or to strive at a quick return on ICT investments (strongcustomer- and supplier-orientation); large firms, since they operate nearer to the technologicalfrontier are more often impeded, compared to small ones, by information and knowledge defi-ciencies, management problems and a lack of specialists. Epidemic effects, i.e. information spill-overs between firms, are more important in case of small firms.
The analysis with an extended version of our model yielded strong evidence for the influentialrole played by workplace organisation for decisions to adopt ICT or to intensify their use. Team-working, decentralised decisionmaking and flattening hierarchical structures are the most rele-vant organisational dimensions favouring the adoption of ICT, whereas we did not find an impactof other elements of workplace organisation such as job rotation or multi-skilling. To circumventthe problem of endogeneity of workplace organisation as an explanatory variable, we introducedtime lags and investigated the reverse causality running from the adoption of ICT to the intro-duction of new work practices; we also found evidence for this relationship. Moreover, humanand knowledge capital turned out to be quite strongly correlated with the adoption of ICT as wellas with new workplace organisation. Our findings are in line with those of some recent studieswhich found that ICT, new workplace organisation and human capital are complementary factorsin strategies to increasing efficiency of production and quality of products.
Besides, the paper shows that the proposed model of adoption, which in its core has been devel-oped in an earlier study dealing with “Advanced Manufacturing Technologies” (Arvanitis andHollenstein, 2001), is useful for other technologies too. Moreover, it has been demonstrated that

- 19 -
an analysis of adoption behaviour may profit from the use of qualitative data reflecting firms‘assessments; in this way the database for empirical research can be substantially enlarged be-cause this type of information is much easier to collect. Future work should be directed, first, tofurther testing the usefulness of the proposed model of adoption (other technologies and coun-tries). Secondly, and more important, there is a need for additional in-depth studies of the impactof the adoption of ICT on firm performance; in particular, the hypothesis of complementarity ofICT, workplace organisation and human capital (Breshnahan et al., 2002; Brynjolfsson and Hitt,2000; Bertschek and Kaiser, 2001) should be investigated more thoroughly, e.g. in a simultane-ous equation framework.
As far as policy is concerned, the empirical results support rather a framework-oriented policydesign than a more activist policy orientation. The most important bottlenecks in introducing ICTand intensifying their use that can be reduced by policy measures are deficiencies of ICT-specificknowledge and a lack of specialists as well as corresponding information problems. Therefore,policy should strengthen, in the first place, the human capital infrastructure of the economy byintensifying (vocational) education at the secondary and tertiary level as well as recurrent train-ing. In addition, since ICT marks a fundamental change of the production system of practicallyall industries and in view of the significant role of learning effects it could be sensible to support(temporarily) ICT-specific training programmes oriented, in the first place, towards smaller com-panies in the early phase of adoption.
ReferencesArvanitis, S. (1997), The Impact of Firm Size on Innovative Activity - An Empirical Analysis Based on Swiss Firm
Data, Small Business Economics, 9, 473-490.Arvanits, S. and H. Hollenstein (1994), Demand and Supply Factors in Explaining the Innovative Activity of Swiss
Manufacturing Firms. An analysis based on input-, output- and market-oriented innovation indicators, Eco-nomics of Innovation and New Technology, 3, 15-30.
Arvanitis, S. and H. Hollenstein (2001), The Determinants of the Adoption of Advanced Manufacturing Technology.An Empirical Analysis Based on Firm-level Data for Swiss Manufacturing, Economics of Innovation and NewTechnology, 10, 377-414.
Arvanitis, S. and H. Hollenstein (2002), Die Wirtschaft in der Informationsgesellschaft, in: Schweiz. Bundesamt fürStatistik (Hrsg.), Informationsgesellschaft Schweiz: Standortbestimmung und Perspektiven, Neuchâtel.
Baldwin J.R. and M. Rafiquzzaman (1998), The Determinants of the Adoption Lag for Advanced ManufacturingTechnologies, Working Paper No. 117, Micro-Economic Analysis Division, Statistics Canada, Ottawa.
Bertschek, I. (1995), Product and Process Innovation as a Response to Increasing Imports and Foreign Direct In-vestment, Journal of Industrial Economics, 43(4), 341-357.
Bertschek, I. and H. Fryges (2002), The Adoption of Business-to-Business E-Commerce: Empirical Evidence forGerman Companies, Centre for European Economic Research, Discussion Paper No. 02-05, Mannheim.
Bertschek, I. and U. Kaiser (2001), Productivity Effects of Organizational Change: Microeconometric Evidence,Centre for European Economic Research, Discussion Paper No. 01-32, Mannheim
Black, S. and L. Lynch (2001), How to Compete: The Impact of Workplace Practices and Information Technologyon Productivity, Review of Economics and Statistics, 83(3), 434-445.
Bresnahan, T.F., Brynjolfsson, E. and L.M. Hitt (2002), Information Technology, Workplace Organisation, and theDemand for Skilled Labor: Firm-level Evidence, Quarterly Journal of Economics, 112(1), 339-376.
Brynjolfsson, E. and L.M. Hitt (1995), Information Technology as a Factor of Production: The Role of DifferencesAmong Firms, Economics of Innovation and New Technology, 3, 183-200.
Brynjolfsson, E. and L.M. Hitt (2000), Beyond Computation: Information Technology, Organizational Transforma-tion and Business Performance, Journal of Economic Perspectives, 14(4), 23-48.

- 20 -
Cainarca G.C., Colombo M.G. and S. Mariotti (1990), Firm Size and the Adoption of Flexible Automation, SmallBusiness Economics, 2(2), 129-140.
Cohen W.M. and D.A. Levinthal (1989), Innovation and Learning: The two Faces of R&D, Economic Journal,99(4), 569-596.
Colecchia, A. and P. Schreyer (2001), ICT Investment and Economic Growth in the 1990s: Is the United States aUnique Case? A Comparative Study of Nine OECD Countries, STI Working Papers 2001/7, OECD: Paris.
Colombo M. and R. Mosconi (1995), Complementarity and Cumulative Learning Effects in the Early Diffusion ofMultiple Technologies, Journal of Industrial Economics, 43(1), 13-48.
Donzé, L., (1998), Développement et entretien du “Panel d’entreprise” du KOF/ETHZ. Une étude méthodologique,Zurich, septembre (http://www.dplanet.ch/users/ldonze).
Dunne T. (1994), Plant Age and Technology Use in U.S. Manufacturing Industries, Rand Journal of Economics,25(3), 488-499.
Geroski, P. (2000), Models of Technology Diffusion, Research Policy, 29, 603-625.Greenan, N. and J. Mairesse (1996), Computers and Productivity in France: Some Evidence, NBER Working Paper
5836, Cambridge, MA.Ichniovski, C., Shaw, K. and G. Prennushi (1997), The Effects of Human Resource Management Practices on Pro-
ductivity, American Economic Review, 87(3), 291-313.Jorgenson, D.W. (2001), Information Technology and the U.S. Economy, American Economic Review, 91(1), 1-32.Jorgenson, D.W. and K.J. Stiroh (2000), Raising the Speed Limit: US Economic Growth in the Information Age,
Economics Department Working Papers No. 261, OECD: Paris.Karshenas M. and P. Stoneman (1995), Technological Diffusion, in: P. Stoneman (ed.), Handbook of the Economics
of Innovation and Technological Change, Oxford: Blackwell.Lichtenberg, F.R. (1995), The Output Contributions of Computer Equipment and Personal: A Firm-level Analysis,
Economics of Innovation and New Technology, 3, 201-217.Link A.N. and P. Kapur (1994), A Note on the Diffusion of Flexible Manufacturing Systems Technology, Econom-
ics Letters, 46, 357-362.Lucking-Reiley, D. and D.F. Spulber (2001): Business-to-Business Electronic Commerce, Journal of Economic
Perspectives, 15(1), 55-68.Majumdar S.K. and S. Venkataraman (1993), New Technology Adoption in US Telecommunications: The Role of
Competitive Pressures and Firm-level Inducements, Research Policy, 22, 521-536.McKinsey (2001), US Productivity Growth 1995-2000. Understanding the contribution of Information Technology
relative to other factors, McKinsey Global Institute, Washington, D.C., October.McWilliams B. and D. Zilberman (1996), Time of Technology Absorption and Learning by Using, Economics of
Innovation and New Technology, 4(2), 139-154.Murphy, M. (2002), Industry Issues: Organisational Change and Firm Performance, STI Working Papers 2002/14,
OECD: Paris.OECD (2000), The Economic an Social Impacts of Electronic Commerce: Preliminary Findings and Research
Agenda, Paris.OECD (2001), OECD Science, Technology and Industry Scoreboard 2001, Paris.Pilat, D. and F.C. Lee (2001), Productivity Growth in ICT-Producing and ICT-Using Industries: A Source of Growth
Differentials in the OECD?, STI Working Papers 2001/4, OECD: Paris.Reinganum J.F. (1981), Market Structure and the Diffusion of New Technology, Bell Journal of Economics, 12(2),
618-624.Reinganum J.F. (1989), The Timing of Innovation: Research, Development and Diffusion, in: R. Schmalensee and
R. Willig (eds.), Handbook of Industrial Organisation, Vol. 1, Elsevier Science Publishers, New York.Rubin, D.B., 1987, Multiple Imputation for Nonresponse in Surveys, New York: John Wiley & Sons.WITSA (2000), International Survey of E-Commerce 2000, The World Information Technology Services Alliance,
London.

- 21 -
Table 1: Adoption of Information and Communication Technologies (ICT)(Percentage of business sector firms having adopted a specific ICT element;2001-2003: planned adoption
Time Period of Adoption
Technology Element Up to1994
1995-1997
1998-2000
2001-2003
Digital assistants 7.2 16.2 32.6 38.4Laptop 12.0 27.1 46.2 50.2PC’s, Workstations, Terminals 60.4 80.2 93.8 94.6E-mail 3.0 23.2 86.1 90.2Internet 1.7 16.1 78.1 88.8EDI 5.2 15.7 40.1 50.9LAN/WAN 17.8 34.4 53.4 57.9Intranet 1.8 8.0 27.0 35.6Extranet 0.6 3.1 13.3 24.4
Weighted to account for deviations of the sample structure from that of the underlying population, fordifferent response rates by “size-industry cells” of the sample and for „unit“ non-response (see Donzé,1998).

- 22 -
Table 2: Specification of Adoption Variables
Variable Definition
Time period of ICT adoption (ordered categories)
INTERNET Time period of adoption of InternetUp to 1994 (value 4), 1995/1997 (value 3), 1998/2000 (value 2), planned for2001/2003 (value 1), not adopted (value 0)
ESALES Time period of adoption of E-sales1998/2000 (value 3), planned for 2001/2003 (value 2), not adopted (value 0)
Intensity of use of ICT (ordered categories)
ICTINT Overall intensity of ICT use in 2000Based on the number of ICT elements adopted up to 2000 (see Table 1):7-9 (value 3), 5-6 (value 2), 3-4 (value 1), less than 3 (value 0)
NETUSE Intensity of Internet use in 2000Six categories based on the percentage of employees using Internet in 2000:81-100% (value 5), 61-80% (value 4), 41-60% (value 3), 21-40% (value2),1-20% (value 1), 0% (value 0)

- 23 -
Table 3a: Basic Model: Specification of the Explanatory Variables
Variable Description Sign
Objectives of ICT adoption(Scores of a principal component factor analysis of the importance of 13 objectives of ICT adoption as as-sessed by firms on a 5-point Likert scale; see Table A1 in the Appendix)
MARKET Improving quality/variety, etc. of products, improving customer-relations,increasing market presence and sales
+
COSTRED Improving internal processes, communication, decisionmaking, reducingcosts
+
INPUT Improving position with respect to input factors (technology, suppliers ofinputs, labour)
+
Obstacles to ICT adoption(The first four variables are scores of a principal component factor analysis of the importance of 12 obstaclesto ICT adoption as assessed by firms on a 5-point Likert scale; see Table A2 in the Appendix)
INVCOST Technology too expensive, investment volume to large, lack of finance -KNOWHOW Lack of ICT personnel, information and management problems -TECH Technological uncertainties, performance of ICT not sufficient -COMPAT Insufficient compatibility with existing ICT and work organisation -NOUSE No potential to use ICT (firms’ assessments on a five-point scale) -
Human capital, absorptive capacityEDUC Share of employees with qualifications at the tertiary level (%) +TRAINING Share of employees having attended ICT-oriented training courses (%) +INNOPD Introduction of new products (yes/no) in the period 1998-2000 +
ExportX, X2 Sales share of exports (%) and its square + / ?
Firm sizeS 5 dummy variables based on the number of employees: S5-19, S20-49,
S50-99, S100-199, S200-499 (firms with 500 and more employees asreference group)
-
Epidemic effects (alternative measures depending on the variable to be explained)EPIDINT Share of firms (%) with above-average use of ICT in 1997 in the industry
the company is affiliated to (used for explaining INTER, ICTINT and NETUSE)+
EPIDSALE Share of firms (%) active in E-selling in the year 2000 in the industry thecompany is affiliated to (used for explaining ESALES)
+
ExperienceEDI EDI already in use in 1997 +
Industry affiliation15 dummies: food, textiles/clothing, wood/paper/printing, non-metallic minerals/base metals, metal prod-ucts, machinery/vehicles/electrical machinery, electronics/instruments/watchmaking, wholesale trade, retailtrade/personal services, hotels/restaurants, transport/telecommunication, banking/insurance, IT-/R&D services,business services (with energy/water/construction as reference group)
?

- 24 -
Table 3b: Extended Model: Specification of Explanatory Variables Related to WorkplaceOrganisation
Variable Description Sign
Elements of new work practicesTEAM Teamworking (6-point-scale: “very common practice”, ..., “does not exist”) +ROTATION Job rotation (6 point-scale: “very common practice”, ..., “does not exist”) +MSKILL Diversity of tasks performed by the “average worker” (5-point scale: “very
high”, ..., “very low”)+
Distribution of decisionmaking power(Scores of a principal component factor analysis of the distribution of decisionmaking power between man-ager and workers with respect to 7 dimensions of work as assessed by firms on a 5-point Likert scale; seeTable A3 in the Appendix)
PRODDEC Production-oriented dimensions of work +USERDEC Customer-oriented dimensions of work +
Decentralisation of decisionmaking since 1995DELCOMP Increasing delegation of decisionmaking to workers (yes/no) +FLAT Reduction of the number of hierarchical levels (yes/no) +
Alternatively, we use an aggregate measure of work organisationORG, ORG4 Sum of standardised values (mean 0, standard deviation 1) of TEAM,
ROTATION, MSKILL, PRODDEC, USERDEC, DELCOMP, FLAT;or rescaled into four ordinal categories (ORG4)
+

- 25 -
Table 4: Time Period of the Adoption of ICT (ordered probit estimates)
INTERNET ESALES
Explanatory Specification SpecificationVariable 1 2 3 4 1 2 3 4
InterceptsA1 2.32*** 2.16*** 3.25*** 1.49*** -1.91*** -1.79*** -1.46*** -2.47***
(.30) (.18) (.30) (.24) (.30) (.25) (.28) (.24)A2 1.31*** 1.14*** 2.24*** .496** -2.55*** -2.43*** -2.08*** -3.09***
(.29) (.18) (.29) (.23) (.29) (.25) (.28) (.24)A3 -2.57*** -2.72*** -1.61*** -3.27*** /// /// /// ///
(.30) (.19) (.30) (.24)A4 -5.21*** -5.31*** -4.24*** -5.86*** /// /// /// ///
(.32) (.24) (.32) (.28)
ObjectivesMARKET .334*** .325*** .349*** .328*** .547*** .551*** .569*** .548***
(.04) (.04) (.04) (.04) (.05) (.05) (.05) (.05)COSTRED .182*** .164*** .190*** .258*** -.048 -.057 -.032 -.003
(.04) (.04) (.04) (.04) (.05) (.05) (.05) (.05)INPUT .200*** .200*** .200*** .245*** .067 .063 .067 .100**
(.04) (.04) (.04) (.04) (.05) (.05) (.05) (.05)
ObstaclesINVCOST -.092** -.098** -.095** -.093** -.052 -.046 -.055 -.042
(.04) (.04) (.04) (.04) (.05) (.05) (.05) (.05)KNOWHOW -.131*** -.139*** -.126*** -.078* -.038 -.021 -.034 -.011
(.04) (.04) (.04) (.04) (.05) (.05) (.05) (.05)TECH .028 .023 .034 .065 .112** .111** .111** .133***
(.04) (.04) (.018 (.04) (.05) (.05) (.05) (.05)COMPAT .026 .016 .029 .032 .044 .048 .037 .027
(.04) (.04) (.04) (.04) (.05) (.05) (.05) (.05)NOUSE -.069* -.072* -.077** -.092** -.100** -.097** -.099** -.118***
(.04) (.04) (.04) (.04) (.05) (.05) (.05) (.05)
AbsorptiveCapacityEDUC .319** .558*** .405** .220** .100 .084 .122 .109
(.10) (.21) (.18) (.10) (.10) (.10) (.11) (.10)TRAINING .008*** .009*** .009*** .008*** .003 .002 .004 .003
(.00) (.00) (.00) (.00) (.00) (.00) (.00) (.00)INNOPD .298*** .288*** .321*** .394*** .274*** .281*** .290*** .339***
(.09) (.09) (.09) (.09) (.10) (.10) (.10) (.10)
ExportsX .027*** .027*** .028*** .031*** .007 .008 .005 .009
(.01) (.01) (.01) (.01) (.01) (.01) (.01) (.01)X2 -.000*** -.000*** -.000*** -.000*** -.000 -.000 -.000 -.000
(.00) (.00) (.00) (.06) (.00) (.00) (.00) (.00)
Firm SizeS5-19 -1.47*** -1.40*** -1.48*** /// -.971*** -.984*** -.990*** ///
(.19) (.19) (.19) (.20) (.20) (.20)
S20-49 -.488*** -.458*** -.493*** /// -.328*** -.316*** -.333*** ///

- 26 -
(.10) (.09) (.10) (.10) (.10) (.10)
S50-99 -.731*** -.651*** -.761*** /// -.410** -.398** -.407** ///(.20) (.20) (.20) (.21) (.21) (.21)
S100-199 -.584*** -.529*** -.629*** /// -.521** -.510** -.581*** ///(.20) (.20) (.20) (.21) (.21) (.21)
S200-499 -.308 -.248 -.344 /// -.244 -.258 -.292 ///(.22) (.21) (.22) (.22) (.22) (.22)
EpidemicEffectsEPIDINT .026*** .030*** /// .025*** /// /// /// ///
(.00) (.00) (.00)EPIDSALE /// /// /// /// .071*** .059*** /// .071***
(.01) (.01) (.01)
ExperienceEDI /// /// /// /// .315*** .295*** .357*** .375***
(.10) (.10) (.10) (.10)
IndustryDummies1 Food /// /// + ***2 Textiles /// ///3 Paper /// + ** /// + ***4 Chemicals /// /// + ***5 Base metals /// ///6 Metal prod. /// /// + **7 Machinery /// + *** /// + **8 Electronics /// + *** /// + **9 Wholesale tr. /// + *** /// + ***10 Retail trade /// /// + ***11 Hotels/Rest. + ** /// + * + ** /// + ***12 Trans./Tele. /// /// + ***13 Financial S. /// /// + ***14 IT/R&D-S. + *** /// + *** + *** ///15 Business S. + * /// + *** ///
N 2641 2641 2641 2641 2641 2641 2641 2641Slope test 241.8*** 171.9*** 243.0*** 188.0*** 124.6*** 101.8*** 121.8*** 98.0***McFadden R2 .144 .139 .139 .128 .122 .120 .113 .114% concordance 74.5 74.0 74.0 72.4 74.9 74.8 74.0 73.9
Each column includes the estimated parameters with standard errors in brackets. The statistical signifi-cance of the estimates is indicated with ***, ** and * representing the 1%, 5% and 10%-level respec-tively. In case of industry dummies we show only the signs and their statistical significance.
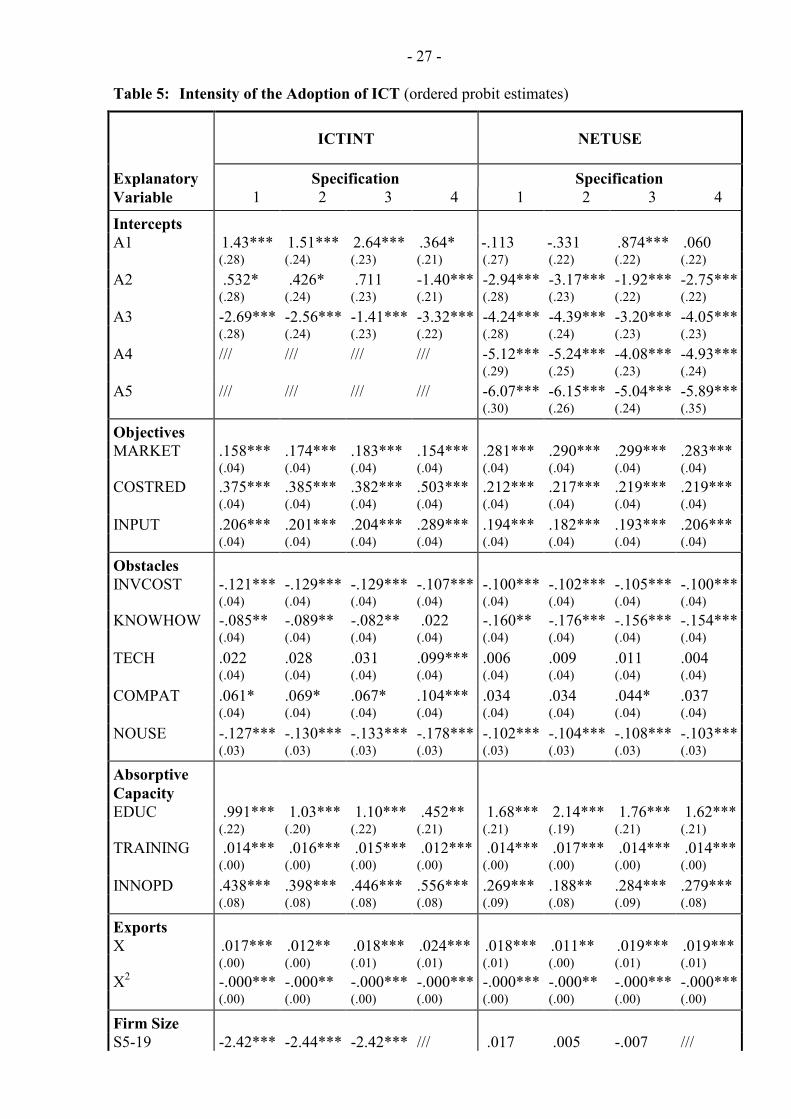
- 27 -
Table 5: Intensity of the Adoption of ICT (ordered probit estimates)
ICTINT NETUSE
Explanatory Specification SpecificationVariable 1 2 3 4 1 2 3 4
InterceptsA1 1.43*** 1.51*** 2.64*** .364* -.113 -.331 .874*** .060
(.28) (.24) (.23) (.21) (.27) (.22) (.22) (.22)A2 .532* .426* .711 -1.40*** -2.94*** -3.17*** -1.92*** -2.75***
(.28) (.24) (.23) (.21) (.28) (.23) (.22) (.22)A3 -2.69*** -2.56*** -1.41*** -3.32*** -4.24*** -4.39*** -3.20*** -4.05***
(.28) (.24) (.23) (.22) (.28) (.24) (.23) (.23)A4 /// /// /// /// -5.12*** -5.24*** -4.08*** -4.93***
(.29) (.25) (.23) (.24)A5 /// /// /// /// -6.07*** -6.15*** -5.04*** -5.89***
(.30) (.26) (.24) (.35)
ObjectivesMARKET .158*** .174*** .183*** .154*** .281*** .290*** .299*** .283***
(.04) (.04) (.04) (.04) (.04) (.04) (.04) (.04)COSTRED .375*** .385*** .382*** .503*** .212*** .217*** .219*** .219***
(.04) (.04) (.04) (.04) (.04) (.04) (.04) (.04)INPUT .206*** .201*** .204*** .289*** .194*** .182*** .193*** .206***
(.04) (.04) (.04) (.04) (.04) (.04) (.04) (.04)
ObstaclesINVCOST -.121*** -.129*** -.129*** -.107*** -.100*** -.102*** -.105*** -.100***
(.04) (.04) (.04) (.04) (.04) (.04) (.04) (.04)KNOWHOW -.085** -.089** -.082** .022 -.160** -.176*** -.156*** -.154***
(.04) (.04) (.04) (.04) (.04) (.04) (.04) (.04)TECH .022 .028 .031 .099*** .006 .009 .011 .004
(.04) (.04) (.04) (.04) (.04) (.04) (.04) (.04)COMPAT .061* .069* .067* .104*** .034 .034 .044* .037
(.04) (.04) (.04) (.04) (.04) (.04) (.04) (.04)NOUSE -.127*** -.130*** -.133*** -.178*** -.102*** -.104*** -.108*** -.103***
(.03) (.03) (.03) (.03) (.03) (.03) (.03) (.03)
AbsorptiveCapacityEDUC .991*** 1.03*** 1.10*** .452** 1.68*** 2.14*** 1.76*** 1.62***
(.22) (.20) (.22) (.21) (.21) (.19) (.21) (.21)TRAINING .014*** .016*** .015*** .012*** .014*** .017*** .014*** .014***
(.00) (.00) (.00) (.00) (.00) (.00) (.00) (.00)INNOPD .438*** .398*** .446*** .556*** .269*** .188** .284*** .279***
(.08) (.08) (.08) (.08) (.09) (.08) (.09) (.08)
ExportsX .017*** .012** .018*** .024*** .018*** .011** .019*** .019***
(.00) (.00) (.01) (.01) (.01) (.00) (.01) (.01)X2 -.000*** -.000** -.000*** -.000*** -.000*** -.000** -.000*** -.000***
(.00) (.00) (.00) (.00) (.00) (.00) (.00) (.00)
Firm SizeS5-19 -2.42*** -2.44*** -2.42*** /// .017 .005 -.007 ///

- 28 -
(.19) (.19) (.19) (.18) (.17) (.17)
S20-49 -.756*** -.777*** -.755*** /// .148* .122 .138 ///(.10) (.09) (.10) (.18) (.18) (.19)
S50-99 -1.05*** -1.12*** -1.08*** /// .324* .293 .287 ///(.20) (.19) (.20) (.19) (.18) (.18)
S100-199 -.449*** -.516*** -.506*** /// .100 .061 .050 ///(.20) (.20) (.20) (.19) (.18) (.19)
S200-499 -.037 -.110 -.071 /// .122 .097 .083 ///(.21) (.21) (.21) (.20) (.20) (.20)
EpidemicEffectsEPIDINT .035*** .033*** /// .031*** .027*** .036*** /// .027***
(.00) (.00) (.00) (.00) (.00) (.00)
IndustryDummies1 Food /// - ** ///2 Textiles /// - ** ///3 Paper /// + ** ///4 Chemicals /// -*** ///5 Base metals /// ///6 Metal prod. /// ///7 Machinery /// + *** - ** /// + **8 Electronics /// ...+ * - ** /// + ***9 Wholesale tr. /// + *** + *** /// + *** + ***10 Retail trade /// ///11 Hotels/Rest. - * /// - ** - *** ///12 Trans./Tele. /// + ** /// + ** + **13 Financial S. + *** /// + *** + *** /// + *** + ***14 IT/R&D-S. /// + *** + *** /// + *** + ***15 Business S. /// + *** - ** + *** /// + *** + ***
N 2641 2641 2641 2641 2641 2641 2641 2641Slope test 119.3*** 60.2** 120.7*** 103.7*** 466.4*** 355.7***464.3*** 293.5***McFadden R2 .212 .206 .204 .156 .147 .136 .143 .146% concordance 80.0 79.7 79.6 75.7 76.2 75.4 75.7 76.0
Each column includes the estimated parameters with standard errors in brackets. The statistical signifi-cance of the estimates is indicated with ***, ** and * representing the 1%, 5% and 10%-level respec-tively. In case of industry dummies we show only the signs and their statistical significance.

- 29 -
Table 6: Size Dependence of the Adoption of ICT (ordered probit estimates)
INTERNET ESALES ICTINT NETUSE
Explanatory Small Large Small Large Small Large Small LargeVariable Firms Firms Firms Firms Firms Firms Firms Firms
InterceptsA1 1.10*** 3.10*** -2.39*** -1.84*** -.321 1.75*** -.565* 1.10***
(.31) (.46) (.36) (.37) (.31) (.38) (.29) (.40)A2 .054 2.04*** -2.83*** -2.68*** -2.32*** -.300 -2.85*** -2.69***
(.31) (.43) (.36) (.37) (.31) (.37) (.30) (.41)A3 -3.65*** -2.28*** /// /// -4.53*** -2.43*** -4.18*** -3.98***
(.33) (.44) (.33) (.38) (.32) (.42)A4 -6.03*** -5.13*** /// /// /// /// -4.99*** -4.98***
(.38) (.48) (.32) (.43)A5 /// /// /// /// /// /// -5.85*** -6.18***
(.34) (.45)
ObjectivesMARKET .392*** .207*** .596*** .502*** .173*** .143*** .290*** .258***
(.05) (.07) (.07) (.07) (.05) (.06) (.05) (.06)COSTRED .146*** .124* -.019 -.095 .371*** .361*** .177*** .243***
(.05) (.07) (.07) (.08) (.05) (.06) (.05) (.07)INPUT .298*** .003 .045 -.094 .303*** .073*** .234*** .110*
(.05) (.07) (.07) (.07) (.05) (.06) (.05) (.06)
ObstaclesINVCOST -.080 -.127* -.062 -.051 -.069 -.212*** -.058 -.193***
(.05) (.07) (.07) (.07) (.05) (.06) (.05) (.06)KNOWHOW -.108** -.171** .075 -.127* -.056 -.138** -.175*** -.165***
(.05) (.07) (.07) (.07) (.05) (.06) (.05) (.06)TECH .046 -.024 .112* .112 .037 -.001 .036 .040
(.05) (.07) (.07) (.07) (.05) (.06) (.05) (.06)COMPAT .001 .033 .063 -.014 .069 .051 .062 -.011
(.05) (.07) (.07) (.07) (.05) (.06) (.05) (.06)NOUSE -.062 -.036 -.116* -.101* -.210* .011 -.106** -.072
(.05) (.06) (.07) (.07) (.05) (.05) (.04) (.06)
AbsorptiveCapacityEDUC 1.00*** .057 .360 .139 .586** 1.67*** 1.98*** .974***
(.29) (.11) (.37) (.12) (.27) (.39) (.26) (.37)TRAINING .007** .010*** .00*** .002 .015*** .012*** .014*** .015***
(.00) (.00) (.00) (.00) (.00) (.00) (.00) (.00)INNOPD .345*** .210* .344** .174 .424*** .463*** .230** .337**
(.12) (.15) (.15) (.15) (.11) (.13) (.11) (.14)
ExportsX .034*** .020** .013 .003*** .020*** .013* .025*** .007
(.01) (.01) (.01) (.01) (.01) (.01) (.01) (.01)X2 -.000*** -.000* -.000 -.000*** -.000** -.000* -.000** -.000
(.00) (.00) (.00) (.00) (.00) (.00) (.00) (.00)
Firm SizeS5-19 -.426*** /// -.285* /// -.902*** /// -.211** ///

- 30 -
(.12) (.15) (.11) (.11)
S20-49 /// /// /// /// /// /// /// ///
S50-99 /// -1.07*** /// -.483** /// -1.21*** /// .181(.22) (.21) (.20) (.20)
S100-199 /// -.834*** /// -.583*** /// -.583*** /// -.090(.22) (.22) (.20) (.21)
S200-499 /// -.527** /// -.295 /// -.128 /// -.011(.23) (.22) (.22) (.21)
EpidemicEffectsEPIDINT .025*** .023*** /// /// .043*** .026*** .030*** .024***
(.00) (.01) (.01) (.01) (.01) (.01)EPIDSALE /// /// .064*** .077*** /// /// /// ///
(.02) (.02)
ExperienceEDI /// /// .336*** .314** /// /// /// ///
(.15) (.14)
IndustryDummies1 Food2 Textiles3 Paper + **4 Chemicals5 Base metals6 Metal prod. + *7 Machinery8 Electronics + *9 Wholesale tr. + *** + *10 Retail trade + **11 Hotels/Rest. + ** + *12 Trans./Tele. + ***13 Financial S. + *** + *** + ***14 IT/R&D-S. + *** + ** + ** - ** + *** + ***15 Business S. + *** + ***
N 1489 1152 1489 1152 1489 1152 1489 1152Slope test 177.0*** 417.5*** 76.4*** 61.8*** 87.7*** 132.5*** 259*** 354.7McFadden R2 .152 .102 .134 .107 .206 .124 .164 .125% concordance 74.8 70.3 76.4 72.6 79.8 73.0 77.2 74.6
Each column includes the estimated parameters with standard errors in brackets. The statistical signifi-cance of the estimates is indicated with ***, ** and * representing the 1%, 5% and 10%-level respec-tively. In case of industry dummies we show only the signs and their statistical significance. Firms withless than 50 employees are considered as “small”, those with more employees as “large”.

- 31 -
Table 7: The Impact of Work Organisation on the Adoption of ICT(ordered probit estimates)
ICTINT
Explanatory 2000 2003Variable 1 2 3 4 5 6
OrganisationAggregatedORG4 /// .210*** /// .309*** .353*** .261***
(.05) (.05) (.04) (.05)
DesegregatedTEAM /// /// .130*** /// /// ///
(.03)ROTATION /// /// .022 /// /// ///
(.04)MSKILL /// /// -.065 /// /// ///
(.06)PRODEC /// /// .123** /// /// ///
(.05)USERDEC /// /// .041 /// /// ///
(.05)DELCOMP /// /// .044 /// /// ///
(.05)FLAT /// /// .250** /// /// ///
(.11)
ObjectivesMARKET .129*** .117** .127*** .134*** .131*** .230**
(.05) (.05) (.05) (.05) (.05) (.05)COSTRED .369*** .339*** .341*** .342*** .415*** .433***
(.05) (.05) (.05) (.05) (.05) (.05)INPUT .138*** .133*** .120** .184*** .188*** .236***
(.05) (.05) (.05) (.05) (.05) (.05)
ObstaclesINVCOST -.154*** -.160*** -.165*** -.167*** -.161*** -.014
(.05) (.05) (.05) (.05) (.05) (.05)KNOWHOW -.086* -.078 -.091* -.078* -.035 .007
(.05) (.05) (.05) (.05) (.05) (.05)TECH -.028 -.043 -.042 -.021 -.033 .020
(.05) (.05) (.05) (.05) (.05) (.05)COMPAT .039 .042 .045 .038 .067 .042
(.05) (.05) (.05) (.05) (.05) (.05)NOUSE -.047 -.049 -.049 -.089** -.131*** -.124***
(.04) (.04) (.04) (.04) (.04) (.04)
AbsorptiveCapacityEDUC 1.74*** 1.56*** 1.56*** /// /// 1.26***
(.32) (.33) (.33) (.36)TRAINING .013*** .011*** .011*** /// /// .020***
(.00) (.00) (.00) (.00)

- 32 -
INNOPD .470*** .432*** .415*** /// /// .426***(.10) (.10) (.10) (.11)
ExportsX .012* .013* .012** .017*** .019*** .019***
(.01) (.01) (.01) (.01) (.01) (.01)X2 -.000* -.000* -.000* -.000** -.000* -.000**
(.00) (.00) (.00) (.00) (.00) (.00)
Firm SizeS5-19 -1.83*** -1.74*** -1.61*** -1.59*** /// -1.97***
(.36) (.36) (.37) (.36) (.38)
S20-49 -1.59*** -1.52*** -1.44*** -1.61*** /// -1.69***(.20) (.20) (.20) (.20) (.23)
S50-99 -1.16*** -1.12*** -1.06*** -1.21*** /// -1.10***(.20) (.20) (.20) (.20) (.23)
S100-199 -.530*** -.482*** -.475** -.613*** /// -.427(.20) (.20) (.21) (.20) (.24)
S200-499 -.060 -.039 -.040 -.180 /// -.015(.22) (.22) (.21) (.21) (.26)
EpidemicEffectsEPIDINT .035*** .034*** .032*** .037*** .034*** .023***
(.00) (.00) (.00) (.00) (.00) (.00)
N 1667 1667 1667 1667 1667 1667Slope test 131.9*** 127.4*** 136.5*** 130.1*** 106.2*** 159.2***McFadden R2 .152 .157 .161 .140 .110 .20.0% concordance 75.4 75.6 76.1 74.1 71.1 78.4
Each column includes the estimated parameters with standard errors in brackets. The statis-tical significance of the estimates is indicated with ***, ** and * representing the 1%, 5%and 10%-level respectively. In case of industry dummies we show only the signs and theirstatistical significance. The results for intercepts and industry dummies are not reported inthe table.

- 33 -
Table 8: The Impact of the Adoption of ICT on Work Organisation(ordered probit estimates)
ORG4
Explanatory SpecificationVariable 1 2 3 4 5
ICTINT1997 /// /// .176*** /// ///
2000 /// .307*** /// .451*** .509***(.06) (.06) (.06)
ObjectivesPERS .412*** .392*** .409*** .444*** .438***
(.05) (.05) (.05) (.05) (.05)COSTFLEX .153*** .140*** .149*** .139*** .153***
(.05) (.05) (.05) (.05) (.05)
ObstaclesHUMAN .023 .017 .024 .007 .006
(.05) (.05) (.05) (.05) (.05)ADJDIFF -.003 -.017 -.000 -.043 -.027
(.05) (.05) (.05) (.05) (.05)ADJCOST -.084* -.082* -.082* -.080* -.086*
(.05) (.05) (.05) (.05) (.05)NONEED -.125*** -.125*** -.139*** -.134*** -.142***
(.04) (.04) (.04) (.04) (.04)
AbsorptiveCapacityEDUC 1.89*** 1.67*** 1.76*** /// ///
(.31) (.31) (.31)TRAINING .014*** .013*** .014*** /// ///
(.00) (.00) (.00)INNOPD .451*** .380*** .398*** /// ///
(.10) (.10) (.10)
ExportsX -.001 -.007 -.007 -.003 -.003
(.01) (.01) (.01) (.01) (.01)X2 .000 .000 .000 .000 .000
(.00) (.00) (.00) (.00) (.00)
Firm SizeS5-19 -1.02*** -.797** -.902*** -.686*** ///
(.35) (.35) (.35) (.35)
S20-49 -.830*** -.616*** -.739*** -.684*** ///(.19) (.19) (.19) (.19)
S50-99 -.610*** -.457** -.541*** -.557*** ///(.19) (.19) (.19) (.19) (.19)
S100-199 -.441** -.374* -.401** -.546** ///(.19) (.19) (.19) (.19)
S200-499 -.202 -.186 -.192 -.306 ///(.20) (.20) (.20) (.20)

- 34 -
N 1667 1667 1667 1667 1667Slope test 87.6** 85.7** 90.2** 79.1** 69.8**McFadden R2 .092 .098 .095 .075 .071% concordance 70.5 71.1 70.80 68.7 68.2
The variables representing objective of and obstacles to the adoption of new work practices arescores of two principal component factor analyses of the importance of 6 objective and 7 obsta-cles to organisational adjustments as assessed by firms on a 5-point Likert scale; see Tables A4and A5 in the Appendix. The variable NONEED represents the firms’ assessment on the neces-sity of changing the existing organisational structure.Each column includes the estimated parameters with standard errors in brackets. The statisticalsignificance of the estimates is indicated with ***, ** and * representing the 1%, 5% and 10%-level respectively. The results for intercepts and industry dummies are not reported in the table.

- 35 -
APPENDIX
Table A1: Factor Analysis of the Objectives of ICT Adoption(based on assessments of the respondents on a five-point Likert-scale)
Rotated Factor Pattern(Varimax)
Objectives Factor1 2 3
Improving product quality and variety .72Improving presence on the product market .72Increasing sales .71Improving customer-orientation .68Complementing products by new features (on-line payment, etc.) .65Optimisation of production process .81Improving decisionmaking .73Improving internal communication .64Reducing costs .63Improving attractiveness on the labour market .74Monitoring performance of employees .66Improving the technological position .41 .59Improving supplier-relationships .41 .49
Number of observations 2641Kaiser’s overall measure of sampling adequacy (MSA) .890Variance accounted for by the first three factors .578Root mean square off-diagonal residuals (RMSE) .075Variance accounted for by each factor 5.13 1.43 0.96Final communality estimate (total) 7.52
Characterisation of the three factors:(1) Improving market position (MARKET)(2) Reducing production costs (COSTRED)(3) Improving position on the input side: labour, technology, material/components (INPUT)
The table shows only factor loadings of 0.4 and higher.

- 36 -
Table A2: Factor Analysis of the Obstacles to ICT Adoption(based on assessments of the respondents on a five-point Likert-scale)
Rotated Factor Pattern(Varimax)
Obstacles Factor1 2 3 4
Investment volume to large .87Technology too expensive .86Current costs too high .76Lack of finance .71Resistance to new technology within the firm . .76ICT-related information problems .73Lack of qualified personnel ..72Insufficient attention of the management .69Technology not yet developed far enough .86Insufficient performance of ICT .85Insufficient compatibility with existing ICT systems .81Required adjustments of work organisation too large .77
Number of observations 2641Kaiser’s overall measure of sampling adequacy (MSA) .875Variance accounted for by the first four factors .723Root mean square off-diagonal residuals (RMSE) .061Variance accounted for by each factor 2.86 2.49 1.81 1.52Final communality estimate (total) 8.68
Characterisation of the four factors:(1) High investment costs (INVCOST)(2) Qualification and know-how problems (KNOWHOW)(3) Technological problems (TECH)(4) Compatibility problems (COMPAT)
The table shows only factor loadings of 0.4 and higher.

- 37 -
Table A3: Factor Analysis of the Variables Measuring the Distribution ofDecisionmaking Power between Workers and Management(based on assessments of the respondents on a five-point Likert-scalewith value 5 indicating decentralised decisionmaking))
DecisionmakingWith respect to
Rotated FactorPattern
(Varimax)
Factor1 2
Way of performing tasks .76Design of the work process .74Pace of work .71Distribution of tasks among the workers .59Contact with customers in case of complaints .89Regular contact with customers .85Problems arising in the production process .47
Number of observations 2641Kaiser’s overall measure of sampling adequacy (MSA) .780Variance accounted for by the first three factors .571Root mean square off-diagonal residuals (RMSE) .103Variance accounted for by each factor 2.15 1.85Final communality estimate (total) 4.00
Characterisation of the two factors:(1) Production-oriented dimensions of work (PR0DDEC)(2) Customer-oriented dimensions of work (USERDEC)
The table shows only factor loadings of 0.4 and higher.

- 38 -
Table A4: Factor Analysis of Objectives of the Adoption of New Work Practices(based on assessments of the respondents on a five-point Likert-scale)
Objectives
Rotated FactorPattern
(Varimax)
Factor1 2
Improving motivation of workers .81Making use of the specific knowledge of workers .86Shortening the process of decisionmaking .51Reducing costs .86Increasing flexibility of adjusting to the environment .66Improving quality .57
Number of observations 1667Kaiser’s overall measure of sampling adequacy (MSA) .783Variance accounted for by the first two factors .642Root mean square off-diagonal residuals (RMSE) .111Variance accounted for by each factor 2.09 1.76Final communality estimate (total) 3.85
Characterisation of the two factors:(1) Using untapped human resources (PERS)(2) Reducing costs and flexibility (COSTFLEX)
The table shows only factor loadings of 0.4 and higher.

- 39 -
Table A5: Factor Analysis of Obstacles to the Adoption of New Work Practices(based on assessments of the respondents on a five-point Likert-scale)
ObstaclesRotated Factor Pattern
(Varimax)
Factor1 2 3
Insufficient training of workers .79Insufficient attention of the management .73Resistance to new work practices within the firm .68Slow adjustment process .82Insufficient information on new forms of work organisation .75Problems of financing organisational adjustments .91High adjustment costs .65
Number of observations 1667Kaiser’s overall measure of sampling adequacy (MSA) .809Variance accounted for by the first two factors .686Root mean square off-diagonal residuals (RMSE) .107Variance accounted for by each factor 1.78 1.71 1.31Final communality estimate (total) 4.80
Characterisation of the three factors:(1) Insufficient preparity of personnel and management (HUMAN)(2) Difficulties of organisational adjustment (ADJDIFF)(3) Adjustment costs (ADJCOST)
The table shows only factor loadings of 0.4 and higher.

- 40 -
Table A6: Structure of the Sample and the Final Dataset
Sample Respondents Responserate
Industry N % N % (3)/(1)
Food, beverages 263 3.9 99 3.7 37.6Textiles 83 1.2 35 1.3 42.2Leather, clothing 50 0.7 21 0.8 42.0Wood (products) 119 1.8 46 1.7 38.7Paper (products) 69 1.0 34 1.3 49.3Printing, publishing 217 3.2 77 2.9 35.5Pharmaceuticals, chemicals 224 3.3 87 3.3 38.8Rubber, plastics 137 2.0 46 1.7 33.6Non-metallic minerals 126 1.9 45 1.7 35.7Metals 67 1.0 26 1.0 38.8Metalworking 427 6.4 181 6.9 42.4Machinery 520 7.7 205 7.8 39.4Electrical machinery 149 2.2 63 2.4 42.3Electronics, instruments 301 4.5 128 4.8 42.5Watchmaking 126 1.9 45 1.7 35.7Vehicles 64 1.0 25 0.9 39.1Other manufacturing 119 1.8 49 1.9 41.2Energy, water 80 1.2 38 1.4 47.5Construction 630 9.4 268 10.1 42.5Wholesale trade 628 9.3 246 9.3 39.2Retail trade (-14%) 519 7.7 176 6.7 33.9Hotels, restaurants (-27%) 411 6.1 118 4.5 28.7Transport/communication 415 6.2 164 6.2 39.5Banking/insurance (11%) 296 4.4 129 4.9 43.6Real estate 38 0.6 13 0.5 34.2IT and R&D services 116 1.7 52 2.0 44.8Business services (11%) 468 7.0 204 7.7 43.6Personal services 55 0.8 21 0.8 38.2
Total 6717 100.0 2641 100.0 39.3