knowlton's cactus (pediocactus knowltonii) · pediocactus knowltonii (knowlton’s cactus)...
TRANSCRIPT

Pediocactus knowltonii (Knowlton’s Cactus)
Summary Report
(Section 6, Segment 31, 2017)
Daniela Roth NM Energy, Minerals, & Natural Resources Department
Forestry Division Santa Fe, NM
Prepared for the
U.S. Fish & Wildlife Service, Region 2 Albuquerque, NM

2
INTRODUCTION Pediocactus knowltonii L. Benson (Knowlton's cactus) is one of the rarest cacti in the United States. It was discovered in 1958 by the late Fred Knowlton and named by Lyman Benson in 1961. It was listed endangered by U.S. Fish & Wildlife Service (USFWS) on October 29, 1979 (44 FR 62244). Pediocactus knowltonii is known to occur only at its type locality on a small hill of about 10 hectares in San Juan County, New Mexico, just south of the Colorado/New Mexico border above Navajo Lake. Searches of this region in New Mexico and adjacent Colorado have failed to locate additional natural populations. Shortly after its discovery, this population was repeatedly visited by cactus collectors to obtain plants for the succulent hobbyist trade. This population was severely impacted by the New Mexico Cactus and Succulent Society in 1960, which was under the mistaken perception that this site would be flooded by the newly constructed Navajo Reservoir (USFWS 1985). Field trips were organized to salvage the cacti from the type locality. Several thousand Pediocactus knowltonii plants were reportedly taken by this group of hobbyists (Paul Knight, personal communication, 1984). This rare cactus is available in the horticultural trade as plants or seeds from licensed commercial growers, which has relieved some of the collection pressures on the natural population. In an effort to protect the only natural population of this rare cactus, the original landowner (Public Service Company of New Mexico) donated the 10-hectare type locality to The Nature Conservancy (TNC). The TNC Sabo Preserve was subsequently fenced to exclude livestock. A few cacti (<50) occur on adjacent BLM land, which is also enclosed by a livestock-proof fence. A recovery plan was developed for Pediocactus knowltonii and approved by USFWS in March 1985. A reintroduction program into nearby suitable habitats was identified as the primary effort towards recovery of this species. Monitoring at the type locality was also initiated to obtain information on population dynamics and trends of the natural population for comparison to the reintroduction efforts. HABITAT AND POPULATION CHARACTERISTICS Pediocactus knowltonii habitat occurs on Tertiary alluvial deposits overlying the San Jose Formation. These deposits form rolling, gravelly hills covered with piñon pine (Pinus edulis), Rocky Mountain juniper (Juniperus scopulorum) and black sagebrush (Artemisia nova). A relatively dense soil cover of foliose lichen (Parmelia sp.) is an unusual aspect of the habitat. This cactus grows at about 6,200ft, in full sun or partial shade, between ancient river cobbles in the understory of sagebrush and conifers.

3
The only documented natural occupied habitat is the top and slopes of a single small hill within the TNC Sabo Preserve. There was speculation that the natural Pediocactus knowltonii population could have been as high as 100,000 plants in 1960, then was reduced by cactus collectors to only 1,000 plants by 1979 (USFWS 1985). The 1985 USFWS Recovery Plan estimated the single natural population at about 7,000 cacti. The first serious attempt to more accurately determine the number of plants at the Sabo Preserve was conducted in 1992, resulting in an estimate of about 12,000 individual cacti (Sivinski and McDonald 2007). Monitoring plot data show this population increasing through the late 1980s and early 1990s to a peak in 1994 at 17% higher than 1992. Therefore, the natural population was estimated at about 14,000 cacti in 1994 and has been gradually and steadily declining since then. In 2008 the monitoring plot data suggested a total population number of about 6,100 plants (Sivinski 2008). A full inventory of the Sabo Preserve documented approximately 3,500 plants total in 2015 (Roth 2015). Individual plants can become reproductive adults when they are 1.0 cm, or more, in diameter. Individual stems produce on average one or two flowers (Sivinski 2011). Flowering peaks in early May and fruits ripen in June. This small cactus has contractile roots, which can pull the entire plant below the soil surface during periods of severe drought. All Pediocactus knowltonii plants begin with a single-stem and most retain that morphology throughout their lives. However, plants that are damaged or buried for a long period will often become multi-stem plants. Approximately one-third of the natural population has 2-15 stems per plant. The average annual precipitation at Aztec National Monument (ca. 25 miles SW of the type locality) is approximately 11 inches, ranging from approximately 3 to 20 inches over a 97-year period (WRCC 2018) (Figure 1). The majority of rainfall arrives during late summer and winter

4
months. Pediocactus knowltonii is reproductively unusual for cacti since it initiates its flower primordia in the early autumn months, which over-winter as small buds. Therefore, spring flowering is greatly influenced by the condition of the plant during the previous growing season and the intervening winter months (Sivinski and McDonald 2007). The average winter precipitation (October – May) at Aztec NM was 6.6 inches between 1985 and 2017 (Figure 2).
Figure 1. Annual rainfall (inches) at Aztec Ruins National Monument, from
1985 through 2017.
Figure 2. Winter precipitation (October – May) at Aztec Ruins National Monument,
from 1985 through 2017.
5
METHODS
A. Monitoring Annual monitoring is conducted during the first 2 weeks of May at Type Locality/Natural Population:
1. the TNC Sabo Preserve (1986 to present) Transplant Sites:
2. the BLM #1 Transplant Site (1991 – present), 3. the BLM #1 Seed Plots Site (1994 – present).
Two additional transplant sites (Navajo #1 and #2) were established in 1985 and 1995 respectively. Both Navajo sites were unsuccessful in maintaining populations and were abandoned in 2007. Within monitoring plots individual cacti larger than 5 mm in diameter are tagged with numbered metal tags, then annually assessed for survival and vigor, plant diameter (mm) is measured and reproductive effort is recorded (# of flowers and fruits). Seedlings (< 5 mm in diameter) are recorded separately (not tagged and no diameter taken). Plants not found are recorded as missing (plant could not be located, 1st year), gone (plant could not be located for the second year), or dead (dead plant observed). Plants not observed for 3 consecutive years are considered dead. Newly found plants are tagged and measured along with the established cacti. Overall health of individual cacti is assessed by assigning a vigor rank (1 = excellent, 2 = good, 3 = fair, 4 = poor). B. 2015 Inventory TNC Sabo Preserve and Surveys in Suitable Habitat In May of 2015 a full inventory of the existing population was completed at the TNC Sabo Preserve by walking transects spaced approximately 2 – 5 m apart across the entire fenced area. All observed plants were counted using tally counters. Clusters of plants were documented with waypoints using a Garmin Montana GPS. Transects were recorded using the GPS Tracking function. In addition, suitable habitat in New Mexico was surveyed for undocumented populations within 5 miles of the type locality. Suitable habitat was primarily determined by using a habitat map provided by the BLM Farmington Field Office. Additional areas were surveyed within the focus area when habitat was deemed suitable in the field. Surveys were conducted during prime flowering season, during the first 2 weeks of May to maximize the potential for detection.

6
A. MONITORING
1. TNC Sabo Preserve - type locality, natural population dynamics
METHODS Twenty-four randomly selected circular monitoring plots (4 m diameter) were established in 1986 at the natural population of Pediocactus knowltonii in the TNC Sabo Preserve (type locality) (Olwell et al. 1987). The plots had all conditions of slope, aspect, soil type, and plant community associated with the small hill at the type locality. Only 11 of these plots contained Pediocactus knowltonii. One of these occupied plots (including rebar and tags) was removed by cactus poachers in 1996 (Sivinski 1996). Therefore, the final data set reported on consists of ten monitoring plots total. The center of each monitoring plot is marked by a rebar and an aluminum tag identifying the plot number. Each plant within an occupied plot is marked with a numbered metal tag held in the ground by a large nail. Most tags are reliably persistent; however, a few may be missing each year and some adult plants have, of necessity, been tagged again with a new number.
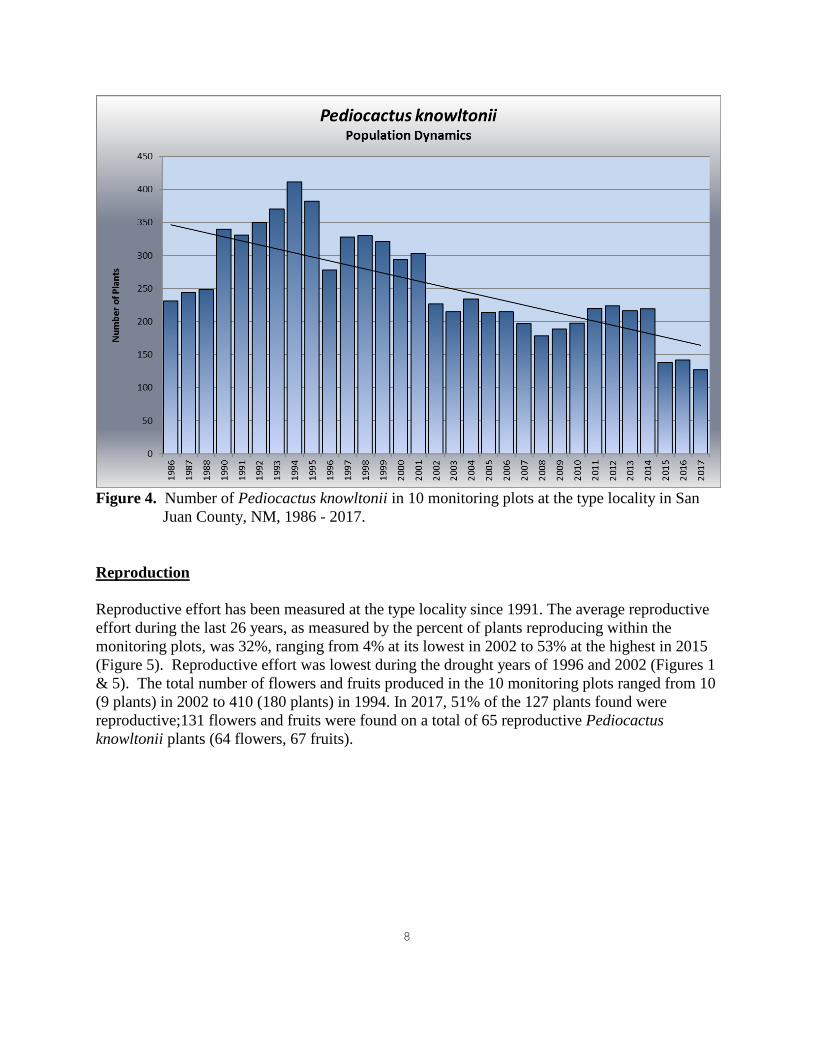
RESULTS Population Trend In 1989 monitoring was incomplete (only 5 of 11 plots were monitored) and was deleted from this analysis. In addition, 48 plants (all plot cacti) were poached between 1995 and 1996 from one of the monitoring plots. Therefore, data collected prior to 1996 from this plot was not included in this analysis. Overall, the number of juvenile and adult plants within the 10 monitoring plots at the type locality has been declining over the past 31 years and reached an all-time low in 2017 (Figure 4). Although the population trend initially increased by 78% between 1986 and1994, it has decreased since 1995 to a number significantly below the original 1986 density. Plant numbers fluctuated somewhat since 2008, but have been in overall decline and have dropped significantly in 2015 (37% over 2014 numbers), with only a slight increase documented in 2016, followed by an additional decline in 2017 (11% over 2016 numbers). The dry winter of 1995 to 1996 corresponded to a steep decline in plant numbers, which dropped by 27% within one year (Figures 2 & 4). The steep increase in plant numbers between 1996 and 1997 was considered an artifact of detection. Many cacti had pulled into the ground during the extreme drought year of 1996 and could not be accurately counted until 1997. Therefore, the trend between 1995 and 1997 might be more gradual than shown in Figure 4. A similar drought during 2001/2002 is considered the main cause of a steep decline in plant numbers in 2002 (Figures 2 & 4). The number of plants found in the monitoring plots decreased by 25% from 2001 to 2002 (Figure 4). Conversely, the sharp increase in the number of plants found in the monitoring plots in 1990

7
might reflect the establishment of seedlings during the unusually high rainfalls in the winter of 1986/1987. Seedlings are very small and may not be detected for several years after a germination event has occurred. In 2015, only 138 plants were found within the ten monitoring plots. This represents the sharpest decline in the number of plants documented since 1984 and a 37% decline from 2014 when 219 plants were found in the 10 monitoring plots. In 2017, only 127 live plants were found in the 10 monitoring plots, despite above average precipitation during the winter of 2016/2017 (Figure 2). The majority of plants were in excellent or good condition (Figure 3). These results are consistent with the 3 prior years of vigor assessment of live plants (Roth 2014, 2015, 2016).
Figure 3. 2017 vigor of Pediocactus knowltonii in 10 monitoring plots at the type locality in
San Juan County, NM.
8
Figure 4. Number of Pediocactus knowltonii in 10 monitoring plots at the type locality in San
Juan County, NM, 1986 - 2017. Reproduction
Reproductive effort has been measured at the type locality since 1991. The average reproductive effort during the last 26 years, as measured by the percent of plants reproducing within the monitoring plots, was 32%, ranging from 4% at its lowest in 2002 to 53% at the highest in 2015 (Figure 5). Reproductive effort was lowest during the drought years of 1996 and 2002 (Figures 1 & 5). The total number of flowers and fruits produced in the 10 monitoring plots ranged from 10 (9 plants) in 2002 to 410 (180 plants) in 1994. In 2017, 51% of the 127 plants found were reproductive;131 flowers and fruits were found on a total of 65 reproductive Pediocactus knowltonii plants (64 flowers, 67 fruits).

9
Figure 5. Percent of plants reproductive in 10 Pediocactus knowltonii monitoring plots in San
Juan County, NM, from 1991 to 2017.
Mortality and Recruitment Approximately 10 percent of the original 231 plants within the 10 monitoring plots were alive in 2013. However, following the sharp decline of plants in 2015, only 4% of the original tagged plants were alive after 30 years of monitoring. Since the majority of these survivors measured 10 mm or more in diameter in 1986 and were therefore at least several years old, it is estimated that individual Pediocactus knowltonii plants can live for at least 30 years in their natural habitat. Mortality and recruitment can fluctuate annually and among plots. The highest number of plants reported missing, gone, or dead since 2012 were recorded in 2015 (137 plants) and 2016 (110 plants). In 2017, 47 plants were rated missing, gone, or dead. Seedlings are small and are often not detected for several years following germination. Since we actively started recording seedlings in 2012, all have occurred in the plot with the highest density of mature cacti (Plot D). 10 new plants and 16 seedlings were documented in the 10 monitoring plots in 2017. All seedlings occurred in Plot D. Prolonged drought conditions and the associated lower levels of reproduction and recruitment are generally considered the likely driving force behind the decline of this population. In addition, dry conditions can cause an increase in rabbit and rodent attacks, which are frequently fatal. Conversely, increased precipitation can increase forage available to rodent and rabbit populations, thereby increasing reproduction and herbivory. Increased predation by herbivores is considered the primary reason for population declines in 2015. Significant predation mortality

10
was also documented in 2015 on Brack’s hardwall cactus (Sclerocactus cloverae ssp. brackii), another small rare cactus, which occurs in this region (Greenlee 2015, Roth 2015, Muldavin et al. 2016). Recruitment to this population is not consistent over time and many years can pass between episodes of significant germination and establishment. A great many seedlings were observed during the early- and mid-1990s, but relatively few new plants have been documented in the monitoring plots after 1995. The highest number of seedlings recorded was in 2017 (16 seedlings). It is likely that the germination and establishment of these seedlings are the result of the high rainfalls in 2015, or possibly the results of higher than average rainfall in the winter of 2016/2017. However, recruitment continues to lag significantly behind mortality in the natural population throughout the monitoring years. Stem Diameter and Size Class Distribution The mean diameter of the natural population fluctuates somewhat between years, but was lowest during the drought years of 1996 and 2002 (Table 2). In 2017, the mean diameter of Pediocactus knowltonii in the natural population was 1.84 cm, which is a insignificant increase from 2016 values (1.83 cm). The size class distribution at the type locality represents a normal population of all age classes including seedlings/juveniles, reproducing adults, and fewer large, older cacti (Figure 8). This value should remain fairly constant at the type locality unless there is a shift in the age class structure of the population due to a germination or mortality event. The majority of individuals are young, reproducing adults, with a diameter of 1.1 to 2.0 cm (36% in 2017) (Figure 8). In 2017 approximately 11% of all plants in the natural population were juvenile, non-reproducing plants less than 1.0 cm in diameter (excluding seedlings). All juveniles start out as single-stemmed plants, but by the time they are flowering adult size (1.0-1.5 cm), they may begin to develop multiple stems in response to disturbance (Table 1). As each individual ages, it is more and more likely to become multiple-stemmed. Therefore, the percentage of multi-stemmed individuals within a population can be an indicator of overall population age and disturbance levels. Individual stem diameter of multi-stemmed plants is not measured because they do not contribute to our understanding of age-class distribution. In general, approximately 30% of plants at the type locality are multi-stemmed. In 2017, 30% of live plants in the monitoring plots were multi stemmed.
2. TRANSPLANT SITES
METHODS A ten-mile radius south of the Pediocactus knowltonii type locality was searched in 1985 and again in 1991 for suitable habitats that are similar to the natural habitat of this species (Ecosphere 1985; Olwell et al. 1987, Sivinski 1992). Suitability criteria were cobbley substrates in piñon-juniper woodland with a dominant shrub component of black sagebrush. Two locations were selected as suitable reintroduction sites. One was located on Bureau of Land Management land

11
approximately two miles south of the type locality and another on Bureau of Reclamation land at Navajo Lake approximately 5 miles to the south. The reintroduction (transplant) program began in May 1985, when 250 stem cuttings were taken from multi-stem plants at the type locality (Olwell et al. 1987). These clones were taken to a greenhouse and grown in pots over the summer until fully rooted. One hundred fifty of these adult clones were planted at the transplant location adjacent to the Los Pinos arm of Navajo Lake, which is hereafter referred to as the Navajo #1 Site. They were planted in fall of 1985 in a grid pattern at two-meter intervals along 15 lines of ten plants each. This site was supplemented with another 102 cuttings planted on the south side of this grid in the early spring of 1995 (Sivinski 1995). These later transplants are in the same general area, but are referred to as the Navajo #2 Site. An additional 250 cuttings were taken in the spring of 1991 (Sivinski and Lightfoot 1992). Parent plants used for the 1991 cuttings were marked so that they could be monitored for any mortality that resulted from the stem cut. After removing a cutting from the base of each cactus, a small rock was placed against the wound and a number was assigned to the donor plant. This number was inscribed on an aluminum tag, which was anchored to the ground near the plant with a nail. In September 1991, a total of 149 five-month-old clones where planted on the BLM's Reese Canyon Area of Critical Environmental Concern (ACEC), which is referred to as the BLM #1 Site. This transplant effort differed from the Navajo Lake sites by method of planting and placement pattern. The Navajo Lake plants were transplanted with the rooting medium still attached to the roots. The BLM #1 transplants were entirely bare-root plantings. The BLM #1 Site contained three lines of fifty plants each and spaced two meters apart. Ten clusters of five plants (3-4 dm apart) were spaced at two-meter intervals along each line. The northern-most line is Line 1 and the southern-most Line 3: 1A-----1B-----1C-----1D-----1E-----1F-----1G-----1H-----1I-----1J 2A-----2B-----2C-----2D-----2E-----2F-----2G-----2H-----2I-----2J 3A-----3B-----3C-----3D-----3E-----3F-----3G-----3H-----3I-----3J Each five-plant cluster was arranged with the center plant being No. 1, the southern-most plant as No. 2, then clockwise to No. 5: 1A2 1A5 1A1 1A3 1A4 etc. These cacti do not all flower simultaneously. Therefore, the rationale for planting five-plant clusters was to increase the number of flowering plants in close proximity to one another and,

12
hopefully, increase the potential for pollination success and seed set. Since the original planting in 1991, new plants have established along the transect lines in various locations. The area along each of the 3 transect lines is searched annually for new recruits. As of 2015, each individual cactus above seedling stage (>5 mm in diameter) is tagged with a numbered metal tag.
RESULTS Impacts of Cloning Operations Unfortunately, 40 of the 250 aluminum tags placed with the parent plants in 1991 were torn away from their anchor nails (by wind?) and were lost. A total of 210 secure marker tags were relocated in May of 1992. Of these, 185 parent plants were still alive, resulting in a 12 percent rate of mortality from May 1991 to May 1992. During this same period of time, unmolested, multiple-stemmed cacti in adjacent study plots experienced a natural mortality rate of 12.9 percent (N= 101). Therefore, no increase in mortality resulted from the stem damage incurred during the cloning operation. Population Trend
1. Navajo #1 & #2 The Navajo #1 and #2 transplants slowly dwindled away, without significant recruitment. The entire transplant population catastrophically declined in the winter of 2005/2006, when rodent or rabbit predation killed most of the plants remaining at the Navajo Lake transplant location (Figure 6) (Sivinski 2006). At that time, this was the most severe level of predation observed at this location during the 20 years it had been monitored. Only 3 seedlings were found in the Navajo #1 & #2 transplant sites in the 20 years of monitoring. The first evidence of recruitment was a single seedling found in 2002 at the Navajo #1 site. This plant was an approximately 2-years old plant and was observed sixteen years after the first fruits were produced in this transplant population. Another two seedlings were observed at this location in 2003. By 2007 only 35 scattered individuals of the original 352 plants remained in the Navajo #1 and Navajo #2 transplant sites. Both sites were abandoned in 2007 (Sivinski 2007).
3. BLM #1 The transplanted population of 149 individuals slowly declined between 1991 and 2008 within the BLM #1 transplant site (Figure 6). During the first winter after the September 1991 planting, approximately one third of the cacti were frost-heaved from the ground (Sivinski and Lightfoot 1992). These plants were found lying on the surface in a desiccated condition and were immediately replanted in March 1992. Several factors may be responsible for this problem. Unlike the Navajo #1 & #2 sites, these cacti were planted bare-root and may have lacked the additional anchor of artificial potting soil. The late season planting also did not allow sufficient

13
time for root development prior to winter dormancy. Soils at the BLM #1 site also have a finer texture and retain water that could contribute to frost heaving. Fortunately, root development during the growing season of 1992 allowed the surviving plants to remain anchored in the soil during the following winters. The dry winter of 1995/1996 likely contributed to steep declines at all three transplant sites, as well as the type locality (Figures 2, 3 & 6). The BLM #1 transplant site was also seriously impacted by predation in 2006 and again in 2007. Several of the cacti damaged by rodents or rabbits in 2007 still had succulent caudices and were counted as living, but most of these were dead by 2008 (Figure 6). The BLM # 1 transplant site has been stable or is slightly increasing since 2008. Plants within this transplant site did not experience unprecedented mortality in 2015 and were not impacted by rodent predation, which decimated the type locality in 2015. In fact, the transplant population experienced a 23% increase in the number of plants over 2014 values. In 2017, 60 plants were recorded at the BLM #1 transplant site. Plants were largely rated in excellent or good condition (Figure 7). None were rated in poor condition. These results are consistent with the 3 prior years of vigor assessment of live plants (Roth 2014, 2015, 2016).
Figure 6. Total number of Pediocactus knowltonii plants at three transplant sites in San Juan
County, NM.

14
Figure 7. 2017 vigor of Pediocactus knowltonii at the BLM #1 transplant site in San Juan County, NM.
Stem Diameter and Size Class Distribution The mean diameter of Pediocactus knowltonii plants at the BLM transplant site steadily increased for the first 10 years after the original transplant in 1991, then stabilized between 2 and 2.5 cm, which was consistently larger than the mean diameter of plants in the natural population at the type locality through 2017 (Table 2). It fluctuates somewhat between years, but was lowest the during drought years of 1996 and 2002, which is consistent with results from the Navajo sites and the naturally occurring plants at the type locality. In 2017 the mean diameter of Pediocactus knowltonii at the BLM transplant site was 2.0 cm, which continues to be larger than the average diameter of plants at the type locality (1.84 cm) (Table 2). Many of the transplants at the Navajo and BLM transplant sites developed into multiple-stemmed plants as they aged (Table 1, Figure 8). The development of multi-stems is environmentally induced by stem damage or partial burial from sediment deposition. This characteristic has proved useful in recovery operations since these plants can be cloned by removing one of the heads to make separate plants. These clones can then be planted at other locations. When compared to the size class distribution at the type locality, size class distribution is skewed towards larger, older individuals and multi-headed plants (Figure 8). Twenty-six years after transplanting, the percentage of large and multi-stemmed individuals at the BLM #1 transplant site is highest (46%) among the three monitored populations (type locality, transplants, seed plots) while the percentage of small, juvenile individuals (< 2.0 cm in diameter) remains well below the type locality values, indicating an aging population with little recruitment (Table 1, Figure 8). This is also indicated in the larger mean diameter of single stemmed plants when compared to individuals at the type locality (Table 2).

15
Figure 8. Size class distribution of Pedicoactus knowltonii populations at the type locality, BLM seed plots, and BLM #1 transplant monitoring sites in 2017.

16
Table 1. Percentage of multi-stemmed Pediocactus knowltonii at the type locality and transplant populations from 1991 to 2017.
Year Type Locality Navajo #1 Navajo #2 BLM#1 1988 26.7 3.2 -- -- 1989 27.9 5.0 -- -- 1990 25.8 6.0 -- -- 1991 28.0 12.1 -- 0 1992 28.6 16.8 -- 1.0 1993 26.2 25.5 -- 2.0 1994 27.3 25.5 -- 3.5 1995 24.2 28.7 -- 2.1 1996 21.9 34.8 0 5.3 1997 24.5 41.2 0 4.3 1998 21.8 38.6 2.6 5.6 1999 22.7 45.6 4.1 7.4 2000 22.4 42.6 12.7 7.5 2001 27.4 49.2 16.0 8.8 2002 24.2 45.9 17.2 14.5 2003 26.0 50.1 21.2 13.4 2004 32.9 59.7 30.4 23.4 2005 31.3 59.6 31.4 24.2 2006 38.1 50.0 26.7 21.1 2007 30.5 -- -- 33.9 2008 29.8 -- -- 35.4 2009 29.6 -- -- 35.4 2010 30.8 -- -- 40.0 2011 29.1 -- -- 43.1 2012 32.1 -- -- 39.6 2013 31.5 -- -- 32.7 2014 28.3 -- -- 40.8 2015 27 -- -- 36 2016 28 -- -- 42 2017 30 -- -- 46

17
Table 2. Mean diameters (centimeters) of single-stemmed Pediocactus knowltonii at the type locality and transplant sites from 1991 to 2017.
Year Type Locality Navajo #1 Navajo #2 BLM #1
1991 1.33 (n=260) 1.52 (N=94) -- 1.14 (N=149)
1992 1.60 (n=273) 2.16 (N=89) -- 1.29 (N=137)
1993 1.58 (n=304) 2.79 (N=76) -- 1.85 (N=118)
1994 1.73 (n=333) 2.27 (N=73) -- 1.44 (N=110)
1995 1.52 (n=325) 2.37 (N=67) 1.13 (N=98) 1.60 (N=94)
1996 1.21 (n=217) 1.78 (N=45) 1.13 (N=76) 1.21 (N=76)
1997 1.44 (n=244) 2.27 (N=51) 1.49 (N=81) 1.64 (N=89)
1998 1.33 (n=258) 2.86 (N=46) 1.47 (N=74) 1.60 (N=85)
1999 1.44 (n=248) 2.26 (N=37) 1.55 (N=70) 1.78 (N=75)
2000 1.30 (n=228) 2.07 (N=39) 1.47 (N=62) 1.64 (N=74)
2001 1.54 (n=220) 2.24 (N=34) 1.65 (N=63) 2.08 (N=73)
2002 1.05 (n=172) 1.71 (N=33) 1.38 (N=58) 1.59 (N=59)
2003 1.33 (n=157) 1.96 (N=32) 1.57 (N=52) 1.74 (N=58)
2004 1.46 (n=154) 2.05 (N=26) 1.63 (N=39) 2.19 (N=49)
2005 1.56 (n=147) 2.50 (N=23) 2.26 (N=35) 2.51 (N=47)
2006 1.49 (n=133) 2.23 (N=10) 1.53 (N=11) 2.14 (N=45)
2007 1.56 (n=137) -- -- 2.34 (N=39)
2008 1.26 (n=133) -- -- 1.91 (N=31)
2009 1.48 (n=133) -- -- 2.14 (N=31)
2010 15.3 (n=140) -- -- 1.76 (N=40)
2011 1.58 (n=156) -- -- 2.47 (N=29)
2012 1.64 (n=151) -- -- 2.05 (N=33)
2013 1.58 (n=148) -- -- 2.00 (N=35)
2014 1.66 (n=156) -- -- 2.05 (N=29)
2015 1.87 (n=102) -- -- 1.98 (N=41)
2016 1.83 (N=102) -- -- 2.1 (N=35)
2017 1.84 (N=89) -- -- 2.0 (N=32)

18
Mortality and Recruitment Establishing a new population from cuttings cannot be considered a success until new cacti are becoming established from natural reproduction in sufficient numbers to offset mortality. Few new seedlings have been found at the transplant sites. New plants are difficult to find until they reach sufficient size to be readily seen by researchers. The first seedling was found in 2003 at the BLM #1 site, ten years after the first reproductive effort was recorded in this transplant population. Recruitment remained low until 2017, when 10 seedlings were recorded along the 3 transects. In 2017, only 1 new plant was located along the 3 transects, 4 plants were missing, 5 plants were found dead. Since 1986 only 37 cacti have been detected as new recruits to the BLM #1 transplant location (juveniles or adults). The 15 new plants recorded in 2015 were likely an artifact of enhanced surveys along the transects and tagging the individual cacti found. Transplanted populations have a lower percentage of juvenile plants (0.5 - 1.0 cm in diameter) and the highest percentage of large and multi-stemmed plants, indicating an aging population with little recruitment, despite the higher percentage of reproducing adults (Figure 8). Reproductive Effort Spring flowering of Pediocactus knowltonii is greatly influenced by the condition of the plant during the previous growing season and the intervening winter months. During the severe drought years of 1996 and 2002, less than 10% of the plants produced flowers and fruits at the type locality and transplant sites (Table 3). The percentage of reproductive plants within transplant populations has generally been higher than in the natural population at the type locality (Table 3). The highest percentage of reproductive plants for the BLM transplant site was 70% in 2011. The highest percentage of plants reproducing in the natural population was 59% (above 1 cm in diameter) in 2015. Transplants are cohorts of aging adults while the natural population contains a wider distribution of all age classes. Reproductive effort is highest among older, larger, and multi-headed plants than among juvenile & smaller plants. Even with the type locality data modified to exclude all single-stemmed, juvenile cacti < 1.0 cm in diameter, the percentage of reproductive individuals was higher among transplanted plants through 2013. However, over the past 5 years the percent of plants flowering at the type locality and the transplant locations was consistently within 5 %. In 2017, 56 flowers and 41 fruits were found on 35 plants (60 % of plants > 1cm). This is similar to the percentage of plants above 1 cm reproducing at the type locality in 2017 (58%).

19
Table 3. Number and percentage of Pediocactus knowltonii plants reproductive above 1 cm at the type locality and transplant sites from 1991 to 2017.
Year Type Locality Navajo #1 Navajo #2 BLM #1
1991 145 (47%) 52 (49%) -- --
1992 178 (51%) 59 (55%) -- --
1993 111 (31%) 25 (25%) -- 3 (2.4%)
1994 180 (44%) 42 (43%) -- 6 (5.5%)
1995 153 (42%) 52 (55%) -- 16 (17%)
1996 18 (8%) 12 (16%) 2 (3%) 8 (12%)
1997 111 (42%) 51 (60%) 12 (15%) 36 (39%)
1998 77 (30%) 25 (33%) 11 (14%) 35 (39%)
1999 43 (16%) 9 (13%) 4 (5%) 23 (28%)
2000 66 (29%) 23 (34%) 16 (23%) 23 (29%)
2001 93 (36%) 26 (42%) 30 (42%) 43 (54%)
2002 9 (6%) 0 (0%) 0 (0%) 3 (4%)
2003 66 (38%) 33 (52%) 29 (44%) 30 (45%)
2004 79 (38%) 30 (49%) 26 (46%) 40 (63%)
2005 72 (35%) 38 (67%) 31 (67%) 39 (63%)
2006 24 (12%) 3 (15%) 3 (20%) 19 (33%)
2007 33 (18%) -- -- 19 (32%)
2008 42 (27%) -- -- 24 (50%)
2009 41 (24%) -- -- 21 (44%)
2010 72 (39%) -- -- 30 (60%)
2011 63 (32%) -- -- 36 (70%)
2012 94 (47%) -- -- 29 (56%)
2013 101 (52%) -- -- 27 (55%)
2014 98 (51%) -- -- 22 (47%)
2015 73 (59%) -- -- 32 (55%)
2016 63 (51%) -- -- 28 (51%)
2017 65 (58%) 35 (60%)

20
3. SEED PLOTS
METHODS
Direct seeding to the soil was attempted outside the transplant grids at both the Navajo Lake and BLM locations in 1987 and 1994 respectively (Knight and Cully 1987; Sivinski 1994). Very little Pediocactus knowltonii seed could be obtained from the natural population because most seeds are immediately harvested by rodents (probably Peromyscus sp.) from the maturing fruits. Few fruits reach a mature stage of dehiscence before being opened and emptied by rodents. Therefore, the majority of seeds used in the two seeding trials were obtained from greenhouse-grown plants. In the fall of 1987, 288 seeds were planted at the Navajo Lake Seed Plot (Knight and Cully 1987). These were planted in one-meter grid intervals and at various depths at each grid point. A template was used that allowed seed placement in the three locations of 10 cm north, 10 cm south and 10 cm west of each grid point. In an effort to determine whether there was a difference in germination and establishment based on the location of the seed in the soil, two seeds were placed in each hole at a predetermined depth. At the south axis location, seeds were left on the surface and lightly covered with a coating of fine soil. West axis seeds were planted at 0.5 cm depth, and north axis seeds were planted 1 cm below the surface. Another seed plot was established at the BLM #1 site in January 1994 (Sivinski 1994). A total of 2,250 Pediocactus knowltonii seeds were purchased from a permitted vendor and planted in permanent plots. Each plot is a grid constructed with field fence laid flat on the ground and held in position with steel reinforcement rods. The mesh openings in the fence are 2x3 inches and a single seed was planted in each opening. There are three 4 x 15 foot lengths of fence, each with three different 4 x 5 foot treatments: No Treatment: Native vegetation with no disturbance; Brushed: Sagebrush clipped off at ground level, no surface disturbance; Cultivated: All brush and herbaceous vegetation removed by hoeing the soil. Each treatment within the three plot replications received 250 seeds. Seeds were planted at a depth of approximately 0.5 cm and a small amount of blasting sand was poured on each planting hole to control erosion. The purpose of seedbed treatment experiments was to determine whether seed germination and establishment differed between treatments and to get a better understanding of optimum germination and establishment requirements.

21
RESULTS Navajo Lake Seed Plot The Navajo Lake seed plot was monitored for germination every spring and autumn from 1988 to 1990 with no seedling being detected. The 1991 assessment was not entirely complete because of the observer's unfamiliarity with the plot layout. In May of 1992, eight Pediocactus knowltonii seedlings were located (Sivinski 1992). These seedlings appeared to be from 1-3 years of age. They were firmly established and represented all three planting depths. Although this sample is small, planting depths above 1 cm did not appear to make a difference in seedling establishment. Additional cacti continued to be found at this plot until 1997 for a total of 18 plants, which is a 6.25% establishment of 288 seeds planted (Sivinski 1997). Only 3 (17%) of these germinants remained as adult cacti in 2006 and no additional recruitment was observed in this plot between 1997 and 2006. This seed plot was abandoned in 2007 (Sivinski 2007). BLM Seed Plot Population Trend Six months after seeding 2,250 seeds a total of 12 seedlings were observed within the BLM seed plots (Table 4, Figure 9). The new seedlings were very tiny and most did not survive the unusually hot summer of 1994 (Sivinski 1995). Only 4 of the original 12 survived to be counted again in May 1995. A total of 69 new germinants were counted in the 1995 assessment. The seedlings were not readily visible during the severe drought year of 1996 and a complete assessment was not made during that year. Only 30 (39%) of the 1995 seedlings survived to be counted again in May of 1997 (Sivinski 1997). The remaining 42 of the 1997 seedlings were recent germinants. A total of 44 seedlings were observed in 1998 of which 20 were new germinants (Sivinski 1998). This represents a significant number (45%) of previous year's seedlings that failed to become established. The number of plants surviving in the plots and the number of new recruits increased through spring 2001. In 2002 there was a marked drop-off in the number of new recruits within the monitoring plots and has been comparatively low ever since (Figure 9). This was likely related to the drought of 2001/2002 in combination with an exhaustion of the artificially stocked seedbank (Figure 1). In 2017, 99 plants were found within all three seed plots (Figure 9). This represents a 14% increase in numbers over the 2016 results and is likely associated with germination and establishment in response to increased spring rainfall in 2015 and represents a recovery from the declines observed in 2015. The majority of plants were rated in excellent or good condition (Figure 10). Only one plant was rated in fair condition and none were found in poor condition. These results are consistent with the 3 prior years of vigor assessment of live plants (Roth 2014, 2015, 2016).

22
Recruitment The 2001 total of 92 cacti represents a 4.1% establishment of the 2,250 seeds planted. Since 2002, recruitment and establishment have been substantially less compared to previous years, with the largest number of new plants found in 2016, when 18 new plants were found in the three study plots, plus 4 seedlings (Figure 9). Eight of these 18 new plants were located outside of the plot perimeter and were likely overlooked in previous years. In 2017, 12 new plants were found, three of which were outside the study plots. In addition, 10 seedlings were documented, including one outside the plot. Five plants were reported missing and three were gone (presumed dead). No dead plants were found.
Figure 9. Number of Pediocactus knowltonii plants started from 2,250 seeds at 3 BLM seed
plots in San Juan County, NM.

23
Figure 10. 2017 vigor of Pediocactus knowltonii at 3 BLM seed plots in San Juan County, NM. Size Class Distribution and Stem Diameter Although analysis of diameter size class distribution of plants growing from seeds showed that 20 years after planting, the distribution of size classes was approaching the general distribution of a natural occurring populations, the percentage multi-stemmed individuals remains lowest in the seeded plots among the three monitored populations (21% in 2017) (Figure 8). In addition, seed plots continue to have the highest number of juvenile plants in the 0.5-1.0 cm size class. In 2017, 26% of documented plants were in the juvenile size class, which is significantly higher than those documented from the type locality (11%). Fifteen percent of all plants were in the 2.1-3.0 cm size class in 2017. Most plants (36%) remain in the young adult size class of 1.1 – 2.0 cm, which is consistent with results from the type locality populations. In 2017, the mean diameter of single stemmed Pediocactus knowltonii plants in all 3 BLM seed plots was 1.53 cm, which is significantly lower than the mean diameter of the type locality (1.84 cm). Reproductive Effort The first flowering plant was found in the monitoring plots in 2000, six years after seeding (Figure 11). The percentage of plants reproducing in the BLM seed plots increased steadily since and even surpassed the percentage of reproducing plants in the natural population between 2005 and 2011. In 2017, 19 flowers and 64 fruits were recorded from 43 reproductive individuals (Figure 11). The percent of plants reproductive was lower in the seed plots than in the natural population (43% and 51% respectively).

24
Figure 11. Percent of Pediocactus knowltonii plants reproducing at the natural population (type
locality) and the BLM Seed Plots from 1994 to 2017. Treatment Results In 2005, eleven years following seeding and plot treatment, an analysis of variance for the random block design of this experiment showed no significant differences in the number of plants between plot treatments (F=2.88 with 2 and 4 degrees of freedom)(Table 4)(Sivinski 2005). Seedbed preparation is unnecessary and will, in fact, increase soil erosion when seed plots are placed on a slope.

25
Table 4. Total number of Pediocactus knowltonii seedlings in three replicate plots at the BLM Seed Plot site. Each plot has No Treatment, Cultivated, and Brushed blocks.
No Treatment Cultivated Brushed 1994 8 2 2 1995 36 31 10 1997 26 23 23 1998 17 21 6 1999 24 23 16 2000 28 20 17 2001 38 30 25 2002 38 29 29 2003 40 28 29 2004 39 28 33 2005 42 29 32
B. 2015 INVENTORY AND SUITABLE HABITAT SURVEY
1. Habitat Survey The BLM Farmington Field Office provided GIS shape files mapping suitable habitat for Pediocactus knowltonii within 5 miles of the type locality at the Sabo Preserve, in New Mexico. Suitable habitats were identified within one mile on the west and east sides of the Los Pinos arm of Navajo Lake in New Mexico, primarily on BLM managed lands, but also containing some private lands and lands managed by the NM State Lands Office. In 2015, surveys for additional natural populations of Pediocactus knowltonii concentrated on BLM lands and some State lands, mostly located on the east side of the Los Pinos arm of Navajo Lake. Surveyed were areas on both sides of Los Pinos River on BLM lands, and areas not mapped as suitable, but deemed suitable from field observations. No new populations or individual plants were found during 4 days of surveys.
2. Inventory
The 2015 full inventory of the natural population counted a total of 3,445 individuals at the TNC Sabo Preserve. Recorded cacti included 2,048 plants tallied from clusters and recorded with individuals GPS waypoints, 1,258 individual cacti recorded with a tally counter, plus 139 individuals in the 10 monitoring plots. This represent a significant decline (73%) over the 1992 estimate of 12,000 plants. Although similar methods were used in determining the current population of Pediocactus knowltonii in 2015 as were used in 1992, and the survey area is well defined, it is likely that survey effort was lower in 1992 and that plants were estimated based on habitat area available and the number of plants counted in a series of belt transects. The 2015 inventory surveyed the entire fenced area along transect spaced approximately 2 – 5 m apart, with the aid of the Tracking

26
function on the GPS. Only portions of the Preserve are occupied habitat, primarily on the western and northern sides of the Preserve. However, since 1992 the number of plants inside the monitoring plots has declined by approximately 60%, with the most significant decline documented in 2015. The current estimate of the total number of plants in existence documents an even more precipitous decline (70%). The decline is likely due to a combination of factors acting on the natural population, including long-term drought impacts, seed and plant predation, some illegal collecting, and potential impacts from inbreeding depression resulting in low fecundity and therefore declining seed deposits into the seedbank. Insect and rodent or rabbit herbivory was documented on plants in 2015 and is thought to be the primary reason for declines observed (Figures 12 & 13). Mortality has consistently outpaced recruitment over the entire 31 years of monitoring.
Figure 12. Rodent or rabbit predation on Pediocactus knowltonii in 2015.
Figure 13. Possible caterpillar damage to Pediocactus knowltonii in 2015.

27
CONCLUSIONS Although the number of Pediocactus knowltonii plants in the monitoring plots fluctuates from year to year, the overall trend after 31 years of monitoring at the type locality is a slow decline and was especially pronounced in 2015. This trend is consistent with other species of Pediocactus monitored on the Colorado Plateau (Clark & Clark 2008, Hazelton 2011, Phillips & Phillips 2004, Roth 2008, USFWS 2012). Declining trends are largely attributed to prolonged drought impacts associated with global climate change. Climate change impacts may include changes in pollinator availability and therefore successful pollination among Pediocactus plants, increase in predation by beetles, rabbits, and rodents, desiccation, decreased reproductive effort and therefore decreased germination and establishment. In addition, climate change is expected to shift ecological functions and timing, including shifts in flowering time, vegetation community changes, and changes in pollinator and herbivore community composition. Increased mortalities may occur during years of higher than usual rainfall due to increased resource competition with seedlings of annual invasive species and increased predation by herbivores due to increases in their population numbers with the availability of additional forage. Although no invasive species were documented at the Sabo Preserve, increased predation is thought to be the primary cause of the decline 2015. The natural population increased in numbers during the late 1980s and early 1990s, and then gradually declined to the lowest point recorded in 2017. It was estimated that the peak population in 1994 would be about 14,000 cacti, if the 1992 estimate of 12,000 plants was accurate (USFWS 2010). By this same 1992 benchmark, the monitoring plot data suggested a total population of only 6,100 cacti in 2008 (Sivinski 2008). A thorough inventory of plants in 2015 found only about half that number at the Sabo Preserve. Additional surveys in suitable habitat to potentially document new natural populations were unsuccessful, supporting our current understanding that the total world population of Pediocactus knowltonii is restricted to one small hill, providing habitat for less than 3,500 plants. This decline is likely a combination of low reproduction and recruitment, influenced by ongoing long-term drought conditions, seed and plant predation from rodents, rabbits, and potentially insects. Other factors contributing to the decline might include small population size and associated inbreeding depression, pollinator availability and pollination success. One serious episode of cactus poaching was detected in 1996 when an entire monitoring plot and an undetermined number of cacti were removed from the natural population at the type locality. No further acts of vandalism have been identified since, although it continues to be a viable threat to Pediocactus knowltonii due to its collection value and overall rarity. After a steady decline of transplants over the initial 10-year period, followed by the loss of 2 transplant sites due to rodent predation, the BLM #1 transplant site appears stable. The multi-stem donor plants in the natural population did not suffer from the loss of a single stem. However, transplanted clones comprise an aging population with little recruitment. These plants are relatively long-lived for small cacti, but as they decline in numbers through time they are not being replaced by sufficient new recruits. The entire transplant population at Navajo Lake

28
suffered a catastrophic decline caused by rodent predation in 2006 and the transplant population was abandoned and judged a failed effort in 2007. The BLM #1 transplant population has also been declining through 2008, but appears to be stable or slightly increasing since. In 2015, the BLM # 1 transplant site was the only one of the three monitoring sites that did not show serious declines. As a matter of fact, the transplant sites showed an actual increase in plant numbers, with similar numbers for new plants and plants reported missing or gone. Although some new plants have been recorded since 1986, seedlings have rarely been documented and the transplant site continues to retain the lowest percentage of plants in the juvenile age class. Direct seeding into new locations is a viable alternative to transplanting adult clones. However, only about 5% of the seed becomes established as adult plants and they require a longer period to become reproductive than do transplanted clones. A large quantity of seed is required to ensure adequate germination and establishment. Recruitment from the seedbank remains highest in the seed plots, but in general, seed plot plants are moving towards a natural size class distribution similar to the natural population. After 7 years, the small population in the seed plots at the BLM #1 location was stable with recruitment roughly equal to mortality until 2007 and 2008 which had net declines in number of cacti. Slight increases in numbers from 2009 through 2012 appeared to constitute a small, but stable or growing, population. However, plant numbers dropped sharply in 2015. The subsequent increase in plant numbers and high number of seedlings may be the result of increased spring rainfall in 2015. The longevity of Pediocactus knowltonii seed in the soil seed bank is not known, but it seems likely that seed viability of the original seeds planted declined after 8 years in the ground. Although subsequent years’ recruits are likely supplemented by the offspring of reproductive cacti in the plots, the percentage of plants in the juvenile size class remains significantly higher in the seed plots over the natural population and transplanted populations. Although this could be an artifact of detection, it is possible that at least some of the original 1994 seeds may continue to contribute to the population of newly recruited individuals in the BLM seed plots. A seed bank viability study to establish how long seeds can persist in the soil in their natural environment would shed further light into our understanding of recruitment levels. In addition, it would be helpful to know what percentage of Pediocactus knowltonii seeds are viable and therefore contribute to the viability of the seed bank. If a large percentage of seeds are not viable, what is the cause? Lack of pollinators or pollination success? Inbreeding depression? Similarly, what percentage of seeds are carried off by seed predators and therefore become lost to the population? Whether establishing new populations of Pediocactus knowltonii by transplanting clones or direct seeding can be successfully accomplished has yet to be seen. Natural recruitment to these new populations has been an exceedingly slow process. Overall, it appears that direct seeding large quantities of seeds is more likely to succeed in establishing self-sustaining populations than those started from clones. A population viability analysis might shed some light on what constitutes a viable population and how many plants are needed for successfully establishing a new population. Seedlings have only been documented in one of 10 study plots in the natural population; the plot with the highest density of plants. Augmenting existing populations to increase pollination

29
success and seed production may be of benefit to all three population sites. After many years of studying the feasibility of transplanting clones and seeding plants directly into habitat we have some understanding of the complexities of establishing new populations. Low levels of recruitment combined with herbivory on plants and seeds appear to be the largest threats to the natural and experimental populations. Further studies are needed to understand the root causes low recruitment levels, including pollinators and pollination success studies, climate change impact studies, seed and seed bank viability studies, and genetic studies to analyze for potential deleterious effects caused by inbreeding depression.
ACKNOWLEDGEMENTS This report is carried forward from previous progress reports written by Bob Sivinski, former botanist for the NM State Forestry Division. Data collected by Bob Sivinski, Anne Cully, and Paul Knight from 1986-2011 were used to generate figures and tables to determine trends for this progress report. Numerous volunteers have assisted in the annual data collection process, including John Kendall, Marian Rohman, Sheila Williams, Laura Hudson, Nathan Brown, Bob Sivinski, and Sarah McCloskey. Funding for this project has been provided by the U.S. Fish and Wildlife Service, Region 2, Albuquerque, NM, through Section 6 Endangered Species grants, received through 2017.

30
RELEVANT LITERATURE Benson, L. 1961. A revision and amplification of Pediocactus I. Cactus and Succulent Journal
33:49-54. Clark, D. and T.O. Clark. 2008. Pediocactus winkleri monitoring in Capitol Reef National Park.
Unpublished report prepared for Capitol Reef National Park. 6 pp. Ecosphere Environmental Services. 1985. Endangered and threatened plant inventory:
Pediocactus knowltonii, distribution and habitat. Unpublished report prepared for the USDI Bureau of Land Management. 13 pp.
Greenlee, E. 2015. Presumable jackrabbit and rodent predation on Sclerocactus cloverae ssp.
brackii. Memorandum send to Daniela Roth, EMNRD – Forestry, by the NM Commissioner of Public Lands. January 26, 2015.
Hazelton, A. 2011. Fickeisen Plains Cactus (Pediocactus peeblesianus ssp. fickeiseniae).
Monitoring Report, Salt Trail Canyon monitoring site, 2006 – 2011. Unpublished report prepared for the Navajo Natural Heritage Program, Window Rock, AZ. 5 pp.
Knight, P. and A. Cully. 1987. Section 6 progress report: Pediocactus knowltonii. Submitted to
U.S. Fish & Wildlife Service, Region 2, Albuquerque, New Mexico. Olwell, P., A. Cully, P. Knight and S. Brack. 1987. Pediocactus knowltonii recovery efforts. In:
Conservation and Management of Rare and Endangered Plants. The California Native Plant Society, Sacramento, CA. pp. 519-522
Phillips, A. and B. Goodrich Phillips. 2004. Population dynamics of Peebles Navajo cactus
(Pediocactus peeblesianus var. peeblesianus): Summary of a twenty-year monitoring program.
Roth, D. 2008. Monitoring Report, Pediocactus bradyi, Marble Canyon, Coconino County,
AZ. Unpublished report prepared for the Navajo Natural Heritage Program. 9 pp. Roth, D. 2012. Pediocactus knowltonii (Knowlton’s Cactus). Summary Report (Section 6,
Segment 26). Unpublished report prepared for the U.S. Fish & Wildlife Service, Region 2, Albuquerque, NM. New Mexico Energy, Minerals & Natural Resources Department, Forestry Division, Santa Fe, NM. 25 pp.
Roth, D. 2013. Pediocactus knowltonii (Knowlton’s Cactus). Summary Report (Section 6,
Segment 27). Unpublished report prepared for the U.S. Fish & Wildlife Service, Region 2, Albuquerque, NM. New Mexico Energy, Minerals & Natural Resources Department, Forestry Division, Santa Fe, NM. 25 pp.
Roth, D. 2014. Pediocactus knowltonii (Knowlton’s Cactus). Summary Report (Section 6,

31
Segment 28). Unpublished report prepared for the U.S. Fish & Wildlife Service, Region 2, Albuquerque, NM. New Mexico Energy, Minerals & Natural Resources Department, Forestry Division, Santa Fe, NM. 27 pp.
Roth, D. 2015. Pediocactus knowltonii (Knowlton’s Cactus). Summary Report (Section 6,
Segment 29). Unpublished report prepared for the U.S. Fish & Wildlife Service, Region 2, Albuquerque, NM. New Mexico Energy, Minerals & Natural Resources Department, Forestry Division, Santa Fe, NM. 35 pp.
Roth, D. 2015. Brack’s cactus monitoring plots – site visit. Memorandum to Andrew Frederick,
EMNRD - Forestry Division. February 10, 2015. Roth, D. 2016. Pediocactus knowltonii (Knowlton’s Cactus). 30 Year Summary Report (Section
6, Segment 30). Unpublished report prepared for the U.S. Fish & Wildlife Service, Region 2, Albuquerque, NM. New Mexico Energy, Minerals & Natural Resources Department, Forestry Division, Santa Fe, NM. 36 pp.
Sivinski, R.C. and K. Lightfoot. 1992. Summary of Knowlton’s cactus (Pediocactus knowltonii)
recovery efforts. Unpublished report prepared for the U.S. Fish & Wildlife Service, Region 2, Albuquerque, NM. New Mexico Energy, Minerals & Natural Resources Department, Forestry Division, Santa Fe, NM. 10 pp.
Sivinski, R.C. 1994. Knowlton’s Cactus (Pediocactus knowltonii): Progress Report
(Section 6, Segment 8). Unpublished report prepared for the U.S. Fish & Wildlife Service, Region 2, Albuquerque, NM. New Mexico Energy, Minerals & Natural Resources Department, Forestry Division, Santa Fe, NM. 17 pp.
Sivinski, R.C. 1995. Knowlton’s Cactus (Pediocactus knowltonii): Progress Report
(Section 6, Segment 9). Unpublished report prepared for the U.S. Fish & Wildlife Service, Region 2, Albuquerque, NM. New Mexico Energy, Minerals & Natural Resources Department, Forestry Division, Santa Fe, NM. 10 pp.
Sivinski, R.C. 1996. Knowlton’s Cactus (Pediocactus knowltonii): Progress Report
(Section 6, Segment 10). Unpublished report prepared for the U.S. Fish & Wildlife Service, Region 2, Albuquerque, NM. New Mexico Energy, Minerals & Natural Resources Department, Forestry Division, Santa Fe, NM. 11 pp.
Sivinski, R.C. 1997. Knowlton’s Cactus (Pediocactus knowltonii): Progress Report
(Section 6, Segment 11). Unpublished report prepared for the U.S. Fish & Wildlife Service, Region 2, Albuquerque, NM. New Mexico Energy, Minerals & Natural Resources Department, Forestry Division, Santa Fe, NM. 11 pp.
Sivinski, R.C. 1998. Knowlton’s Cactus (Pediocactus knowltonii): Progress Report
(Section 6, Segment 12). Unpublished report prepared for the U.S. Fish & Wildlife Service, Region 2, Albuquerque, NM. New Mexico Energy, Minerals & Natural

32
Resources Department, Forestry Division, Santa Fe, NM. 11 pp. Sivinski, R.C. 2005. Knowlton’s Cactus (Pediocactus knowltonii): Progress Report (Section 6,
Segment 19). Unpublished report prepared for the U.S. Fish & Wildlife Service, Region 2, Albuquerque, NM. New Mexico Energy, Minerals & Natural Resources Department, Forestry Division, Santa Fe, NM. 13 pp.
Sivinski, R.C. 2006. Knowlton’s Cactus (Pediocactus knowltonii): Progress Report (Section 6,
Segment 20). Unpublished report prepared for the U.S. Fish & Wildlife Service, Region 2, Albuquerque, NM. New Mexico Energy, Minerals & Natural Resources Department, Forestry Division, Santa Fe, NM. 14 pp.
Sivinski, R.C. 2007. Knowlton’s Cactus (Pediocactus knowltonii): Progress Report (Section 6,
Segment 2). Unpublished report prepared for the U.S. Fish & Wildlife Service, Region 2, Albuquerque, NM. New Mexico Energy, Minerals & Natural Resources Department, Forestry Division, Santa Fe, NM. 14 pp.
Sivinski, R.C. 2011. Knowlton’s Cactus (Pediocactus knowltonii): Progress Report (Section 6,
Segment 25). Unpublished report prepared for the U.S. Fish & Wildlife Service, Region 2, Albuquerque, NM. New Mexico Energy, Minerals & Natural Resources Department, Forestry Division, Santa Fe, NM. 16 pp.
Sivinski, R.C. and C. McDonald. 2007. Knowlton’s cactus (Pediocactus knowltonii): Eighteen
years of monitoring and recovery actions. In: Barlow-Irick, P., J. Anderson and C. McDonald (tech. eds.) 2007. Southwestern rare and endangered plants: Proceedings of the fourth conference; March 22-26, 2004; Las Cruces, New Mexico. Proceedings. RMRS-P-48CD. Fort Collins, CO: U.S. Department of Agriculture, Forest Service, Rocky Mountain Research Station. p. 98-107
Muldavin E., R.C. Sivinski, M. East, Y. Chauvin, and M. Horner. 2016. Brack’s hardwall cactus
distribution, habitat, and status survey 2015. Natural Heritage New Mexico Report 390. Prepared for the Bureau of Land Management New Mexico State Office, Santa Fe, NM. 61 pp.
Western Regional Climate Center. 2018. Accessed via http://www.wrcc.dri.edu/cgi-
bin/cliMAIN.pl?nm0692 on March 12, 2018. U.S. Fish & Wildlife Service. 1985. Knowlton’s Cactus Recovery Plan. U.S. Fish & Wildlife
Service, Region 2, Albuquerque, NM. 53 pp. U.S. Fish & Wildlife Service. 2010. Knowlton’s Cactus (Pediocactus knowltonii). 5-Year
Review: Summary and Evaluation. U.S. Fish & Wildlife Service/NM Ecological Service Field Office, Albuquerque, NM. 16 pp.

33
U.S. Fish & Wildlife Service. 2012. Brady pincushion cactus (Pediocactus bradyi). 5-Year Review: Summary and Evaluation. U.S. Fish & Wildlife Service/AZ Ecological Service Field Office, Phoenix, AZ. 37 pp.