knowledge enabled location prediction of twitter users
TRANSCRIPT

1
Knowledge Enabled Location Prediction of Twitter Users
Presented at ESWC 2015, Slovenia, June 3, 2015
Krishnaprasad Thirunarayan
Pavan Kapanipathi
Revathy Krishnamurthy
Amit Sheth
[email protected] [email protected] [email protected] [email protected]
ESWC 2015
Kno.e.sis: Ohio Center of Excellence in Knowledge Enabled ComputingWright State University, Dayton, OH, USA
2
Background Knowledge can improve a machine’s ability to interpret text
City of Lights
ESWC 2015
3
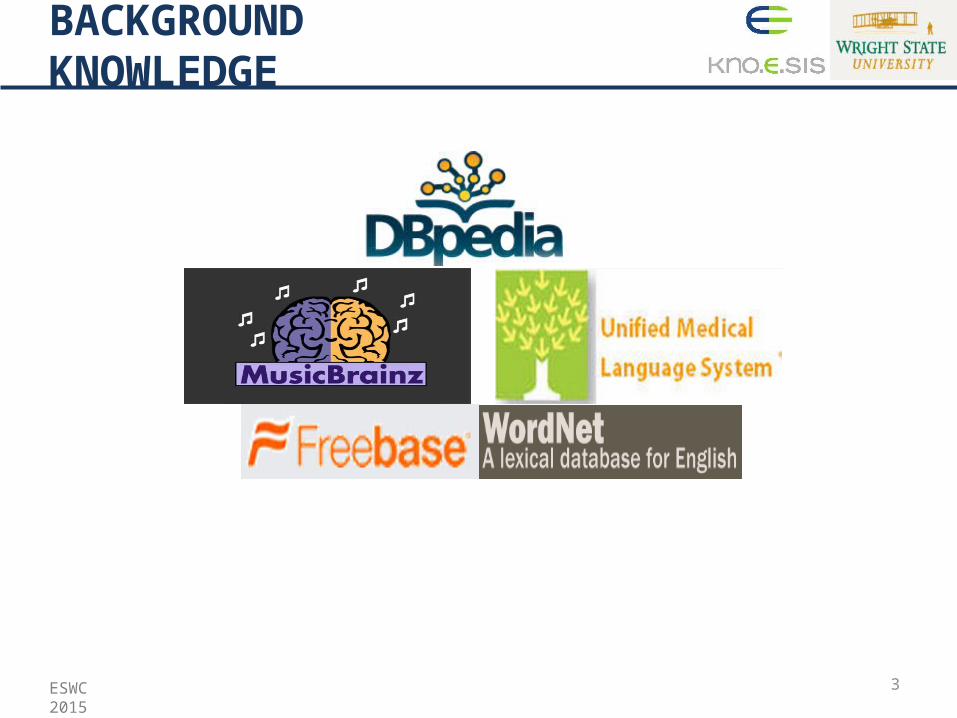
BACKGROUND KNOWLEDGE
ESWC 2015

4
Geographic footprint of a Twitter user
5
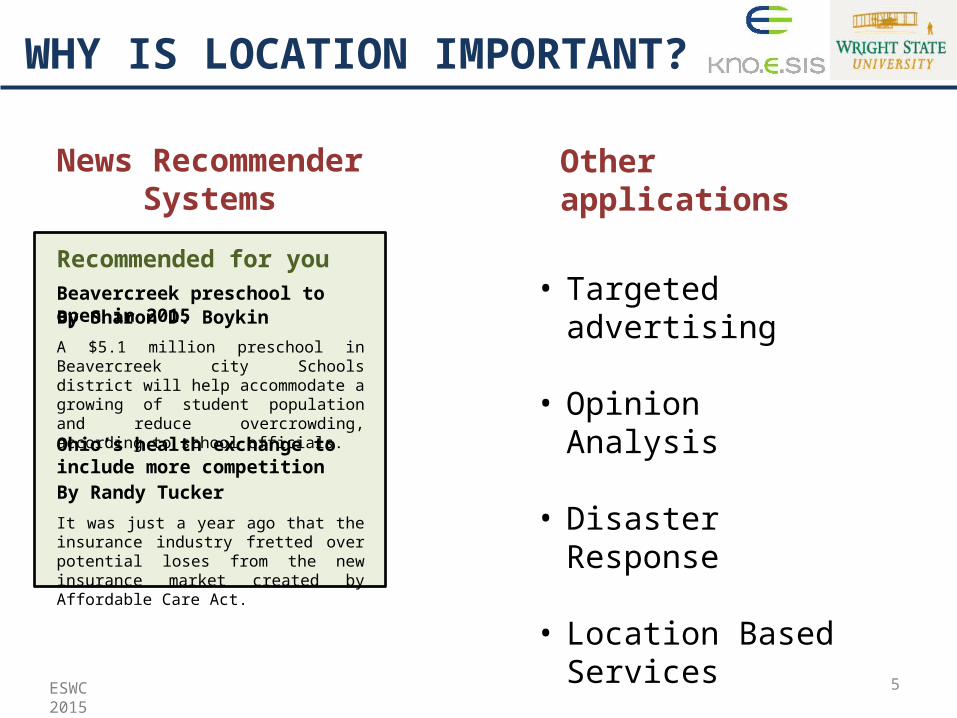
News RecommenderSystems
Beavercreek preschool to open in 2015By Sharon D. Boykin
A $5.1 million preschool in Beavercreek city Schools district will help accommodate a growing of student population and reduce overcrowding, according to school officials.
Ohio’s health exchange to include more competitionBy Randy Tucker
It was just a year ago that the insurance industry fretted over potential loses from the new insurance market created by Affordable Care Act.
Recommended for you
WHY IS LOCATION IMPORTANT?
• Targeted advertising
• Opinion Analysis
• Disaster Response
• Location Based Services
Other applications
ESWC 2015
6
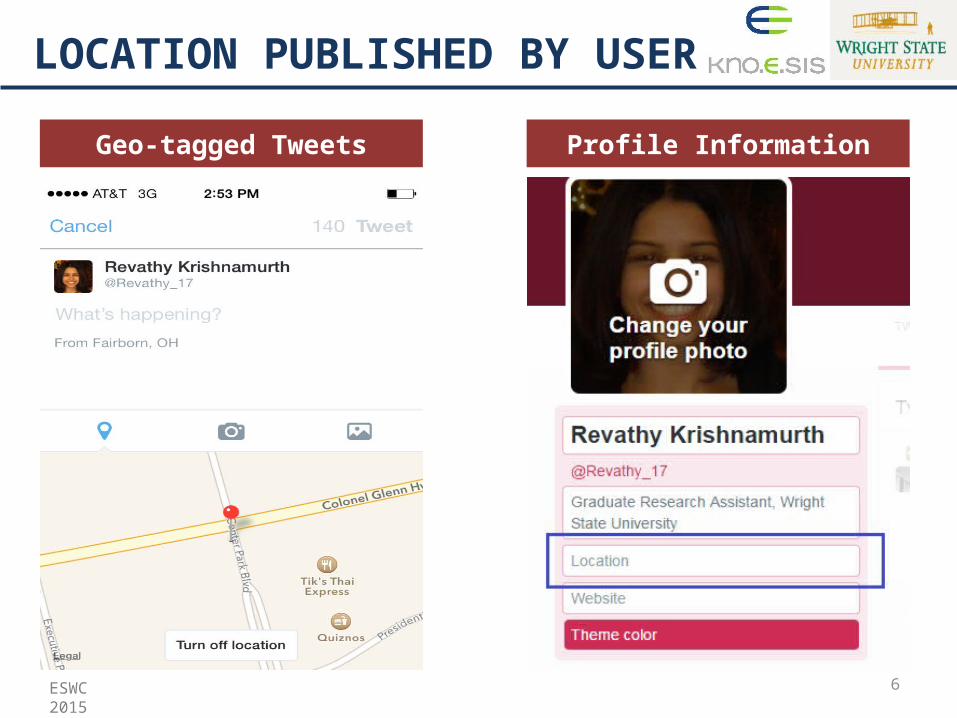
Geo-tagged Tweets Profile Information
LOCATION PUBLISHED BY USER
ESWC 2015
7
Geo-tagged Tweets Profile Information
LOCATION PUBLISHED BY USER
• Less than 4% of tweets contain geo-spatial tags
• ~4 out of 5 cases, location field in profile is either empty or contains invalid information such as “Justin Bieber’s heart,” even when present, it might be at state or nation level

8
Friends
LOCATION INFERENCE
Followees
Just drove around Golden Gate Park two times trying to get in
Cleveland Browns confuse me. When I give up on them, they actually show up to play.
Followers
Network based
Content based
ESWC 2015
9
CONTENT BASED APPROACHES
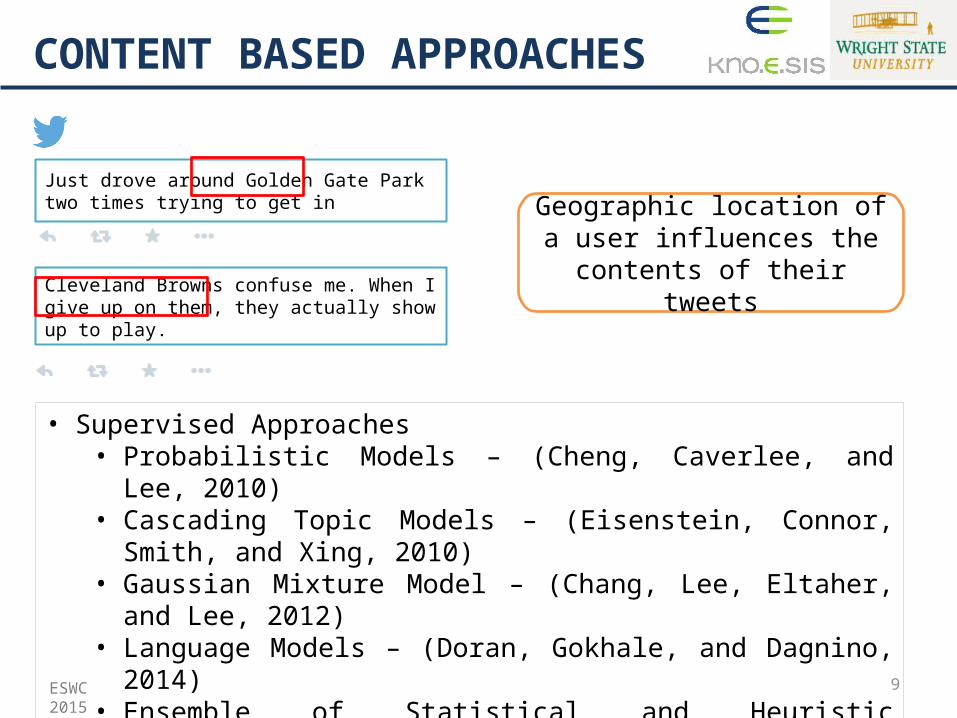
Just drove around Golden Gate Park two times trying to get in
Cleveland Browns confuse me. When I give up on them, they actually show up to play.
• Supervised Approaches • Probabilistic Models – (Cheng, Caverlee, and Lee, 2010)• Cascading Topic Models – (Eisenstein, Connor, Smith, and Xing, 2010)• Gaussian Mixture Model – (Chang, Lee, Eltaher, and Lee, 2012)• Language Models – (Doran, Gokhale, and Dagnino, 2014)• Ensemble of Statistical and Heuristic Classifiers – (Mahmud, Nichols,
and Drews, 2014)
Geographic location of a user influences the contents of their
tweets
ESWC 2015
10
PROBLEM STATEMENT
Predict the location of a Twitter user based on their tweets, by exploiting Wikipedia to create a location specific knowledgebase
ESWC 2015
11
KNOWLEDGE-BASE ENABLED APPROACH
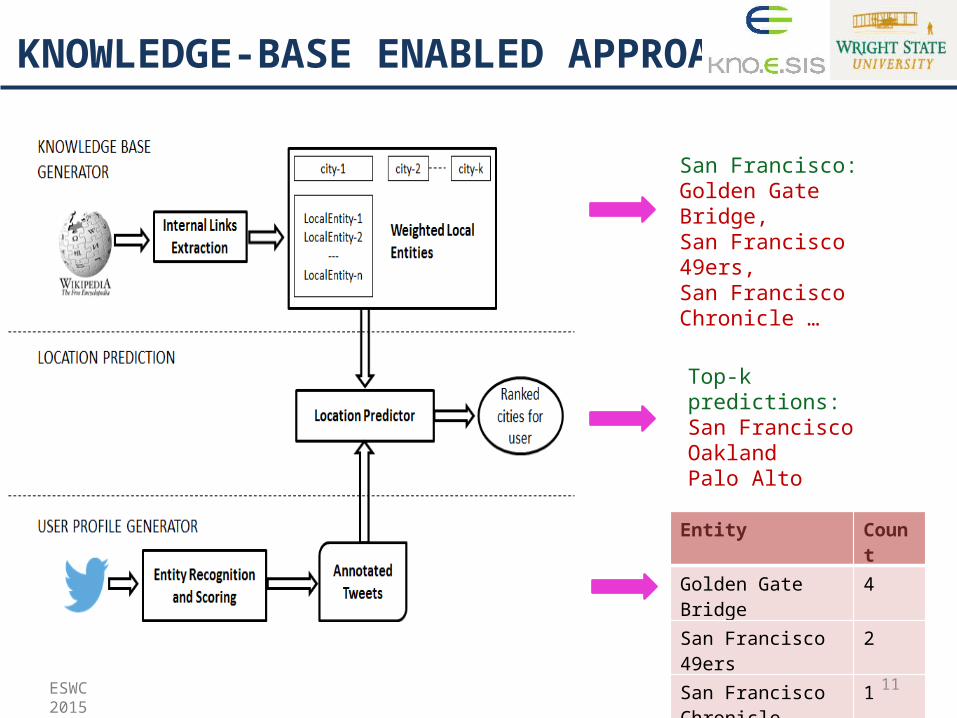
San Francisco:Golden Gate Bridge, San Francisco 49ers, San Francisco Chronicle …
Entity Count
Golden Gate Bridge 4
San Francisco 49ers 2
San Francisco Chronicle
1
Top-k predictions:San FranciscoOaklandPalo Alto
ESWC 2015

12
KNOWLEDGE BASE GENERATOR
Internal Links Extraction
LocalEntity-1LocalEntity-2
---LocalEntity-n
city-1 city-2 city-k
Weighted Local Entities
Entity Recognition and Scoring
Annotated Tweets
USER PROFILE GENERATOR
LOCATION PREDICTION
Location PredictorRanked
cities for user
KNOWLEDGE-BASE ENABLED APPROACH
ESWC 2015

13
SAN FRANCISCO NEW YORK CITY
HOUSTON
LOCAL ENTITIES
ESWC 2015
14
• Collaborative encyclopedia
• As of 2014, English Wikipedia has 4.6 million articles, 18 billion pages views and 500 million unique visitors per month.
• Category Structure • Used for document clustering, tweet classification,
personalization systems etc.
• Link Structure• Used for word sense disambiguation, semantic relatedness
between terms etc.
WIKIPEDIA
ESWC 2015

15
• We consider the internal links of location pages as Local Entities of the city
Local Entities of San Francisco
LOCAL ENTITIES
• While a city does not contain link to itself, we use the city as a local entity
ESWC 2015

16
ARE ALL ENTITIES EQUALLY LOCAL?
ESWC 2015

17
ARE ALL ENTITIES EQUALLY LOCAL?
ESWC 2015
San Francisco Chronicle
San Francisco ExaminerSF Weekly
CNN BBCAl Jazeera America

18
• Pointwise Mutual Information – standard measure of association between two variables
• Assumption is that higher is the localness of an entity with respect to the city, higher will be the statistical dependence between them
• Computed as:
where le is the local entity, c is the city, P(le,c) is the joint probability of occurrence of the city and the local entity in the Wikipedia dump, P(e) and P(c) are the individual probability of occurrence of the local entity and city respectively.
Association-based Measure
LOCALNESS MEASURE OF ENTITIES
ESWC 2015
19
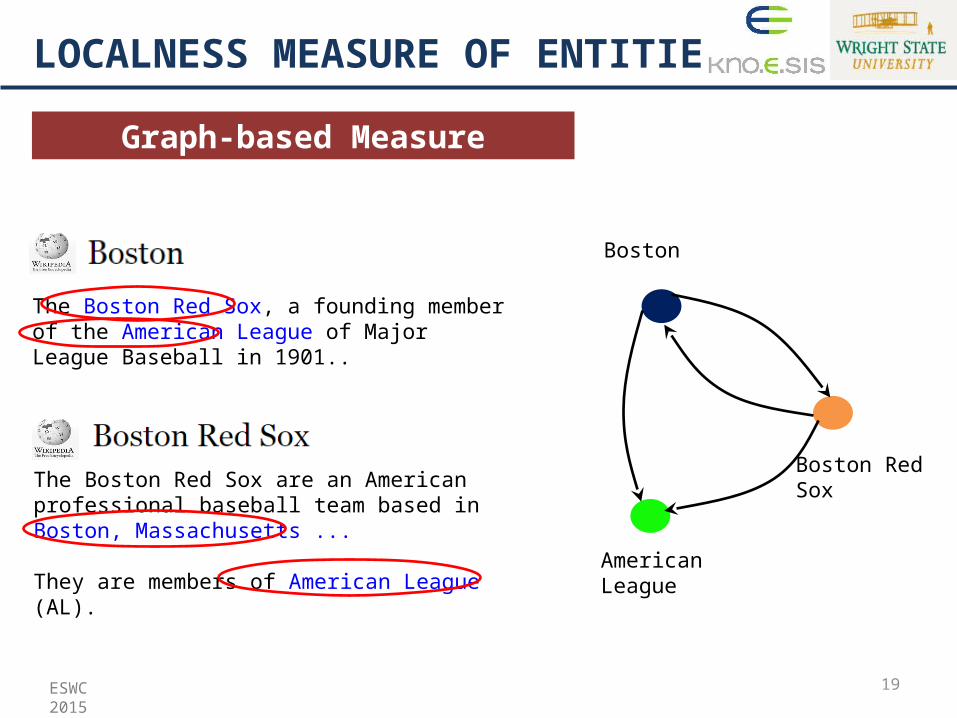
Graph-based Measure
LOCALNESS MEASURE OF ENTITIES
The Boston Red Sox, a founding member of the American League of Major League Baseball in 1901..
Boston Red SoxThe Boston Red Sox are an American professional baseball team based in Boston, Massachusetts ...
They are members of American League (AL).
Boston
American League
ESWC 2015
20
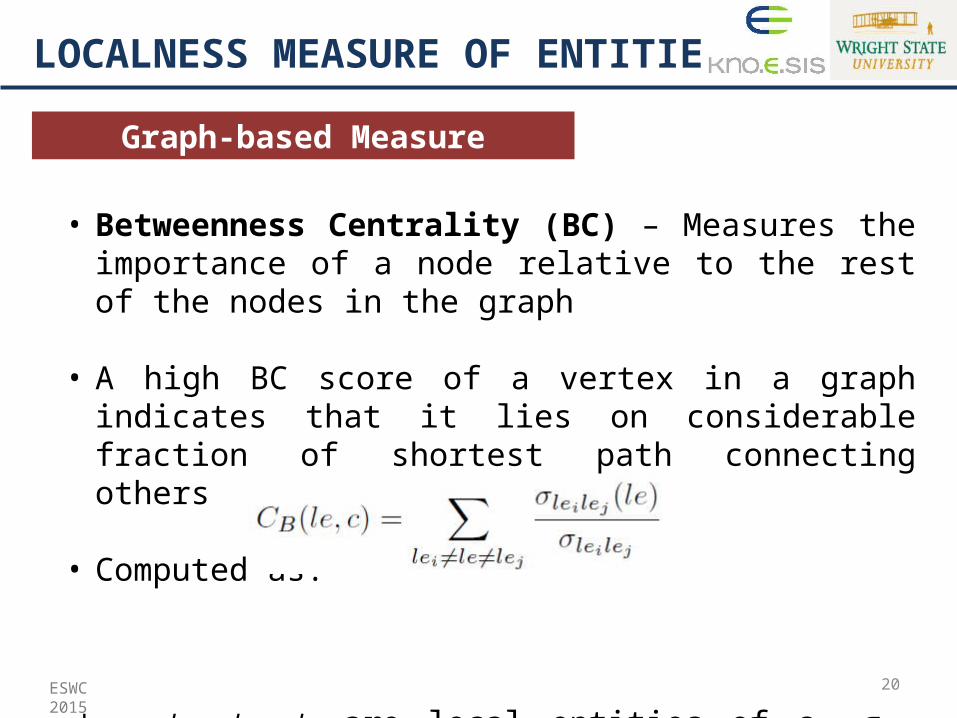
• Betweenness Centrality (BC) – Measures the importance of a node relative to the rest of the nodes in the graph
• A high BC score of a vertex in a graph indicates that it lies on considerable fraction of shortest path connecting others
• Computed as:
where lei, lej, le are local entities of c, σleilej represents the total number of shortest paths from lei to lej
Graph-based Measure
LOCALNESS MEASURE OF ENTITIES
ESWC 2015
21
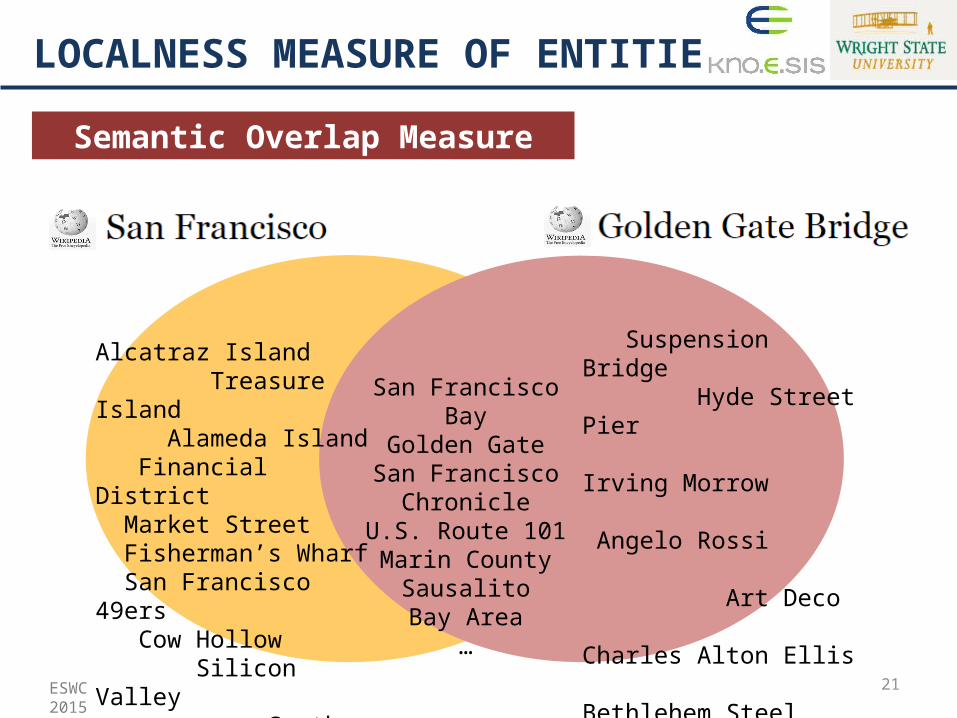
Alcatraz Island Treasure Island Alameda Island Financial District Market Street Fisherman’s Wharf San Francisco 49ers Cow Hollow Silicon Valley South Beach ….
Suspension Bridge Hyde Street Pier Irving Morrow Angelo Rossi Art Deco Charles Alton Ellis Bethlehem Steel Half Way to Hell ClubInternational Orange …
San Francisco BayGolden Gate
San Francisco ChronicleU.S. Route 101Marin County
SausalitoBay Area
…
Semantic Overlap Measure
LOCALNESS MEASURE OF ENTITIES
ESWC 2015
22
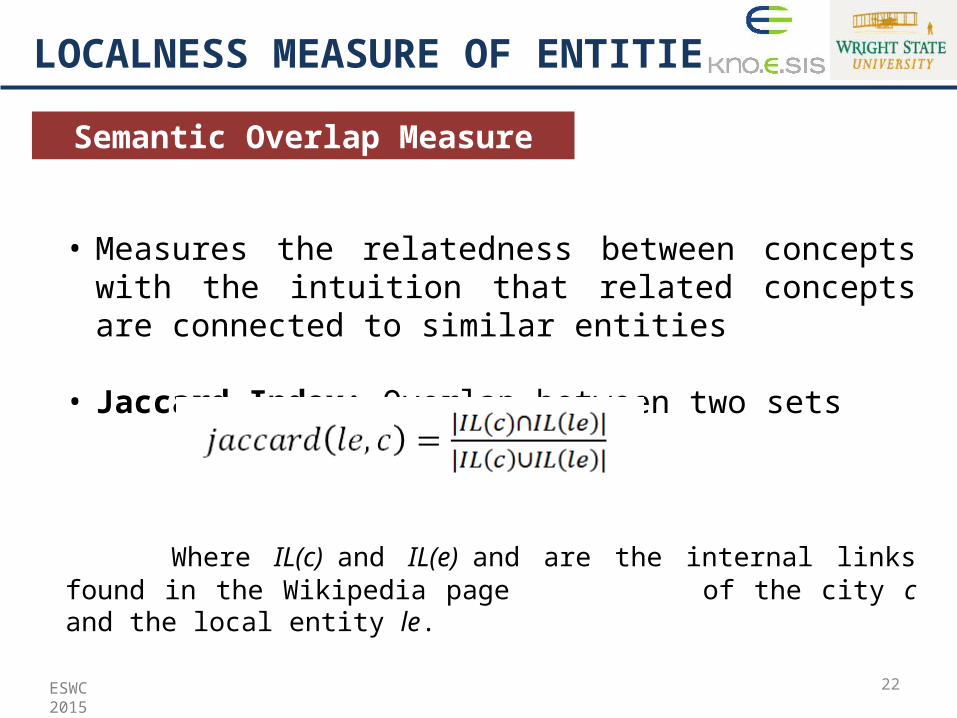
• Measures the relatedness between concepts with the intuition that related concepts are connected to similar entities
• Jaccard Index: Overlap between two sets
Where IL(c) and IL(e) and are the internal links found in the Wikipedia page of the city c and the local entity le.
Semantic Overlap Measure
LOCALNESS MEASURE OF ENTITIES
ESWC 2015

23
• Tversky Index: Asymmetric similarity measure between two sets
Where and are the internal links found in the Wikipedia page of the city and the local entity
• We choose = 0 and = 1
• For every entity in the page of a local entity not found in the page of the city, penalize the local entity
Semantic Overlap Measure
LOCALNESS MEASURE OF ENTITIES
ESWC 2015
24
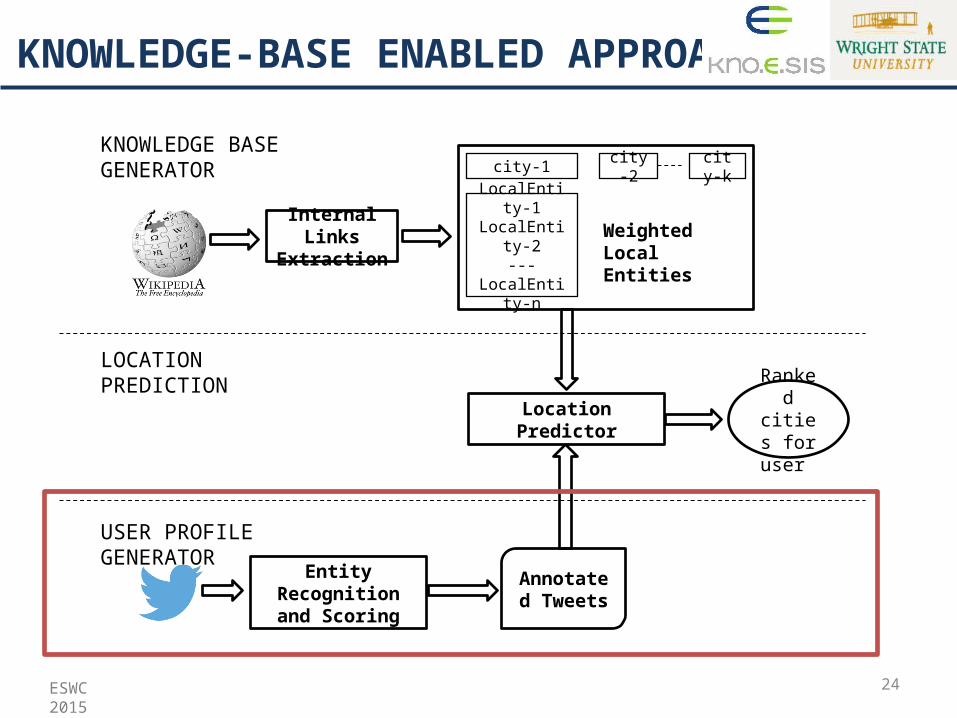
KNOWLEDGE BASE GENERATOR
Internal Links Extraction
LocalEntity-1LocalEntity-2
---LocalEntity-n
city-1 city-2 city-k
Weighted Local Entities
Entity Recognition and Scoring
Annotated Tweets
USER PROFILE GENERATOR
LOCATION PREDICTION
Location PredictorRanked
cities for user
KNOWLEDGE-BASE ENABLED APPROACH
ESWC 2015
25
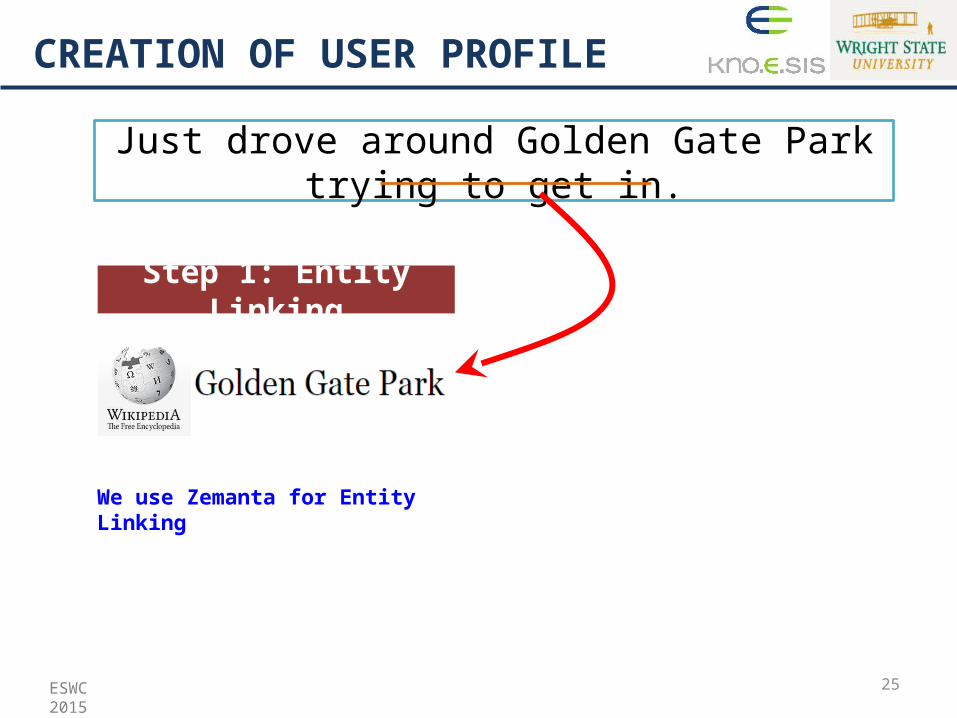
Step 1: Entity Linking
Just drove around Golden Gate Park trying to get in.
CREATION OF USER PROFILE
We use Zemanta for Entity Linking
ESWC 2015

26
Step 1: Entity Linking
Just drove around Golden Gate Park trying to get in.
CREATION OF USER PROFILE
Entity Count
Golden Gate Bridge 4
San Francisco 49ers 2
San Francisco Chronicle 1
Step 2: Entity Scoring
We use Zemanta for Entity Linking
ESWC 2015

27
KNOWLEDGE BASE GENERATOR
Internal Links Extraction
LocalEntity-1LocalEntity-2
---LocalEntity-n
city-1 city-2 city-k
Weighted Local Entities
Entity Recognition and Scoring
Annotated Tweets
USER PROFILE GENERATOR
LOCATION PREDICTION
Location PredictorRanked
cities for user
KNOWLEDGE-BASE ENABLED APPROACH
ESWC 2015
28
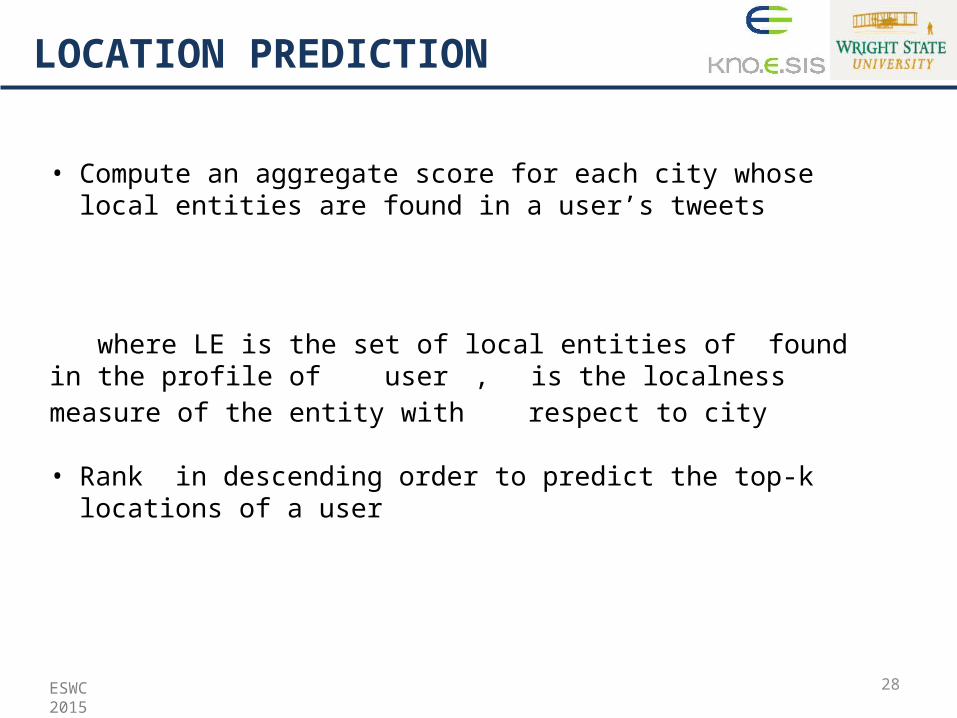
LOCATION PREDICTION
• Compute an aggregate score for each city whose local entities are found in a user’s tweets
where LE is the set of local entities of found in the profile of
user , is the localness measure of the entity with respect to city
• Rank in descending order to predict the top-k locations of a user
ESWC 2015
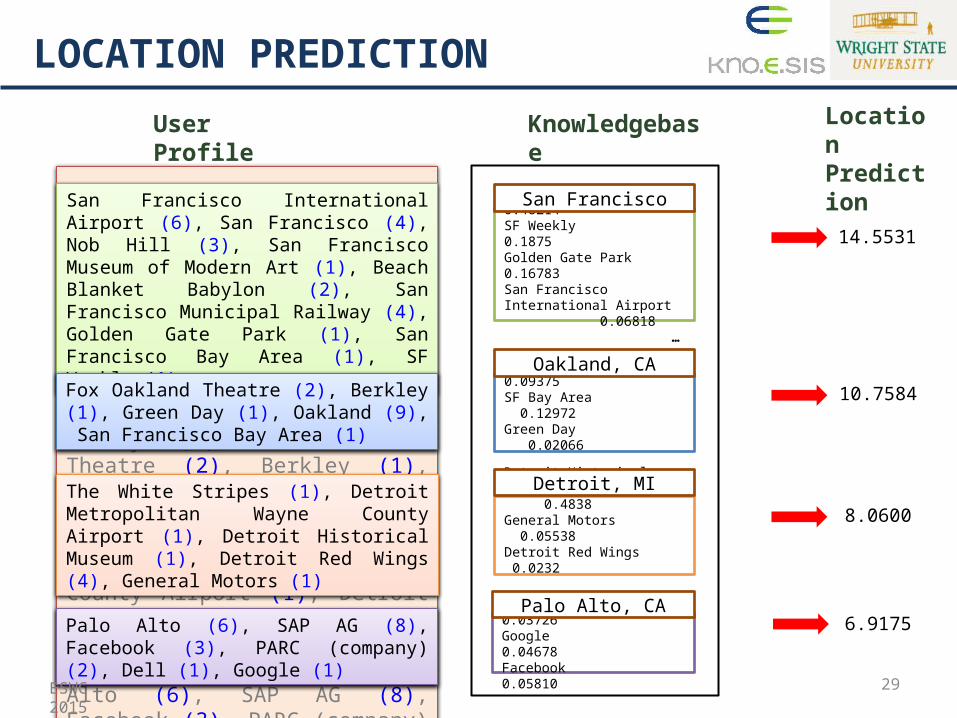
29
San Francisco International Airport (6), San Francisco (4), Nob Hill (3), San Francisco Museum of Modern Art (1), Beach Blanket Babylon (2), San Francisco Municipal Railway (4), Golden Gate Park (1), San Francisco Bay Area (1), SF Weekly (1), Fox Oakland Theatre (2), Berkley (1), Green Day (1), Oakland (9), San Francisco Bay Area (1), The White Stripes (1), Detroit Metropolitan Wayne County Airport (1), Detroit Historical Museum (1), Detroit Red Wings (4), General Motors (1), Palo Alto (6), SAP AG (8), Facebook (3), PARC (company) (2), Dell (1), Google (1), …
LOCATION PREDICTION
San Francisco International Airport (6), San Francisco (4), Nob Hill (3), San Francisco Museum of Modern Art (1), Beach Blanket Babylon (2), San Francisco Municipal Railway (4), Golden Gate Park (1), San Francisco Bay Area (1), SF Weekly (1)
14.5531
Fox Oakland Theatre (2), Berkley (1), Green Day (1), Oakland (9), San Francisco Bay Area (1)
10.7584
The White Stripes (1), Detroit Metropolitan Wayne County Airport (1), Detroit Historical Museum (1), Detroit Red Wings (4), General Motors (1)
8.0600
Palo Alto (6), SAP AG (8), Facebook (3), PARC (company) (2), Dell (1), Google (1)
6.9175
User Profile Knowledgebase Location Prediction
Nob Hill 0.48214SF Weekly 0.1875Golden Gate Park 0.16783San Francisco International Airport 0.06818 …
Fox Oakland Theatre 0.09375SF Bay Area 0.12972Green Day 0.02066 …
Detroit HistoricalMuseum 0.4838General Motors 0.05538Detroit Red Wings 0.0232 …
PARC (company) 0.03726Google 0.04678Facebook 0.05810
San Francisco
Oakland, CA
Detroit, MI
Palo Alto, CA
ESWC 2015

30
• All cities of United States with population > 5000 as published in census estimates of 2012
• 4,661 cities and 500714 local entities
Knowledge base
IMPLEMENTATION
Baseline
• Considers all local entities to be equally local to the city• Location prediction based only on frequency of entities
ESWC 2015
31
• Published by Cheng et al.
• Collected from September 2009 to January 2010.
• Contains 5119 active users from continental United States with approximately 1000 tweets per user.
• User’s location listed in the form of latitude and longitude.
Test Dataset
EVALUATION
ESWC 2015

32
• Error DistanceDistance between actual location of the user and the estimated location
• Average Error DistanceAverage of error distance of all users in the test dataset
• AccuracyPercentage of users predicted within 100 miles of their actual
location
Evaluation Metrics
EVALUATION
ESWC 2015
33
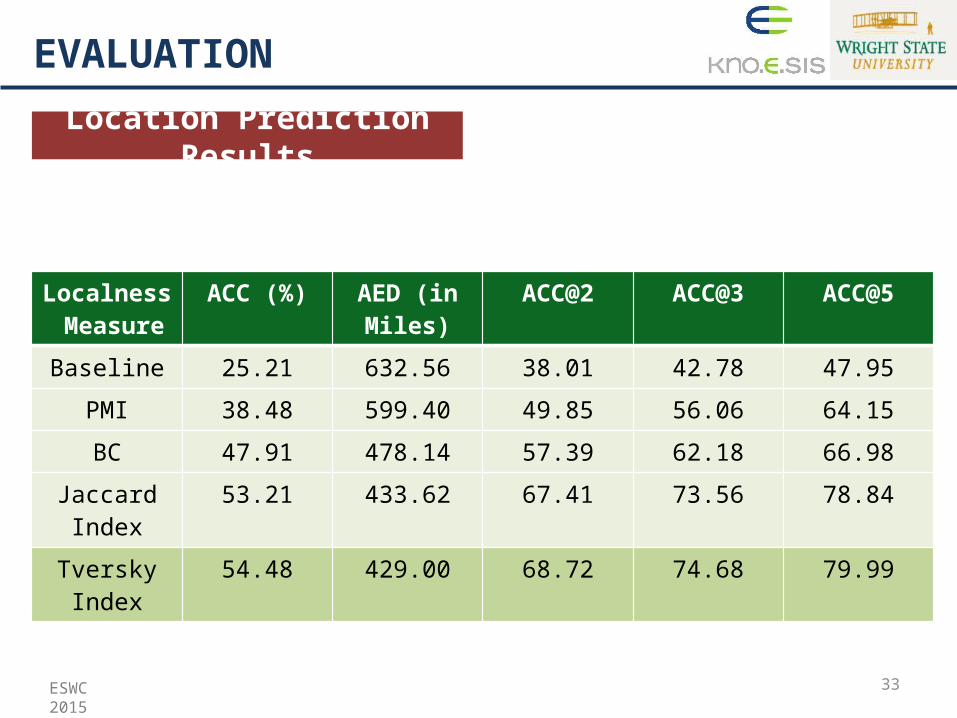
Location Prediction Results
EVALUATION
Localness Measure
ACC (%) AED (in Miles)
ACC@2 ACC@3 ACC@5
Baseline 25.21 632.56 38.01 42.78 47.95
PMI 38.48 599.40 49.85 56.06 64.15
BC 47.91 478.14 57.39 62.18 66.98
Jaccard Index 53.21 433.62 67.41 73.56 78.84
Tversky Index 54.48 429.00 68.72 74.68 79.99
ESWC 2015

34
EVALUATION
Localness Measure
ACC (%) AED (in Miles) ACC@2 ACC@3 ACC@5
Baseline 25.21 632.56 38.01 42.78 47.95
PMI 38.48 599.40 49.85 56.06 64.15BC 47.91 478.14 57.39 62.18 66.98
Jaccard Index 53.21 433.62 67.41 73.56 78.84
Tversky Index 54.48 429.00 68.72 74.68 79.99
• PMI is not normalized hence sensitive to the count of the occurrences of local entities in the Wikipedia corpus
• E.g. PMI of local entities of Glenn Rock, New Jersey is higher than those of San Francisco
ESWC 2015

35
EVALUATION
Localness Measure
ACC (%) AED (in Miles) ACC@2 ACC@3 ACC@5
Baseline 25.21 632.56 38.01 42.78 47.95
PMI 38.48 599.40 49.85 56.06 64.15
BC 47.91 478.14 57.39 62.18 66.98Jaccard Index 53.21 433.62 67.41 73.56 78.84
Tversky Index 54.48 429.00 68.72 74.68 79.99
• Does a good job of assigning low scores to common entities.• E.g. community college, National Weather Service, start up company
etc.
• Fails for entities with some relevance to the city but no distinguishing factor• E.g. IBM with respect to Endicott, New York
ESWC 2015

36
LOCALNESS MEASURE OF ENTITIES

37
EVALUATION
Localness Measure
ACC (%) AED (in Miles) ACC@2 ACC@3 ACC@5
Baseline 25.21 632.56 38.01 42.78 47.95
PMI 38.48 599.40 49.85 56.06 64.15
BC 47.91 478.14 57.39 62.18 66.98
Jaccard Index
53.21 433.62 67.41 73.56 78.84
Tversky Index 54.48 429.00 68.72 74.68 79.99
• Underperforms for local entities with fewer entities than the city• E.g. Eureka Valley and California with respect to San Francisco.
ESWC 2015
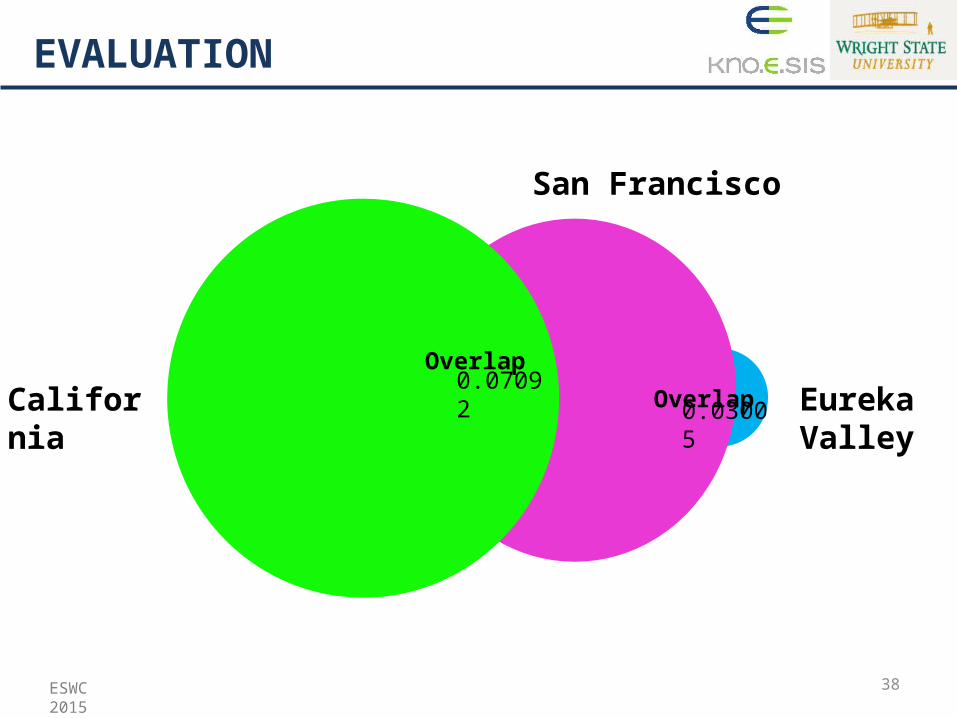
38
EVALUATION
California
San Francisco
Eureka Valley
0.03005
Overlap
Overlap
0.07092
ESWC 2015

39
EVALUATION
Localness Measure
ACC (%) AED (in Miles) ACC@2 ACC@3 ACC@5
Baseline 25.21 632.56 38.01 42.78 47.95
PMI 38.48 599.40 49.85 56.06 64.15
BC 47.91 478.14 57.39 62.18 66.98
Jaccard Index 53.21 433.62 67.41 73.56 78.84
Tversky Index
54.48 429.00 68.72 74.68 79.99
• Best performing localness measure• Overcomes the disadvantage of Jaccard Index.
• For example: We are able to assign higher localness to Eureka Valley (0.7096) than California (0.1270) with respect to San Francisco
ESWC 2015
40
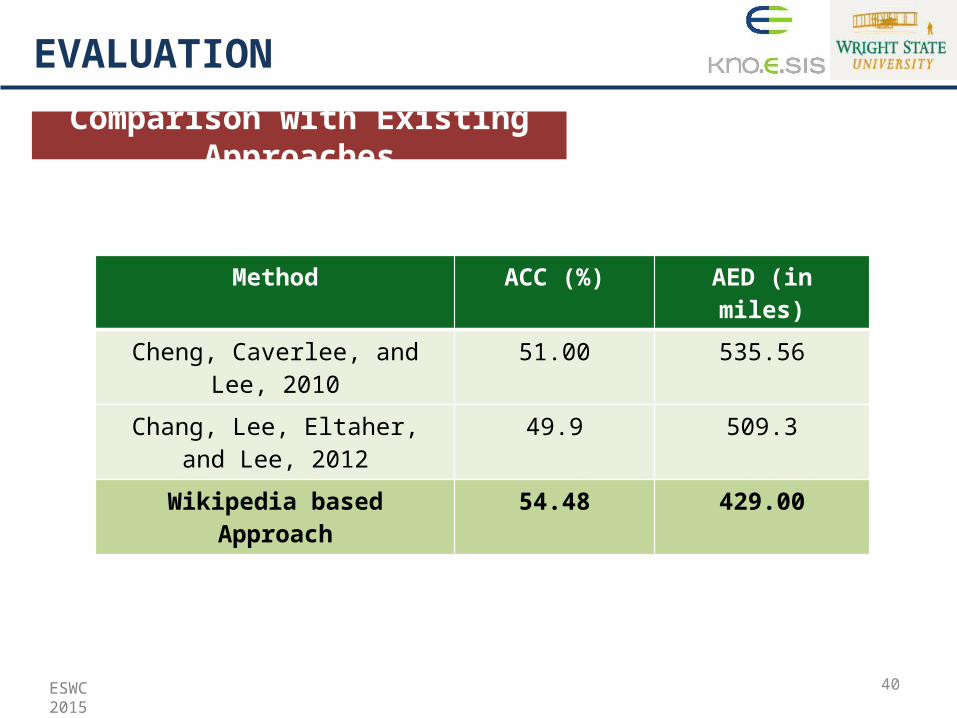
Comparison with Existing Approaches
EVALUATION
Method ACC (%) AED (in miles)
Cheng, Caverlee, and Lee, 2010 51.00 535.56
Chang, Lee, Eltaher, and Lee, 2012 49.9 509.3
Wikipedia based Approach 54.48 429.00
ESWC 2015
41
CONCLUSION
• Presented a crowd sourced knowledge based approach, that does not require geo-tagged tweets as a training dataset, to predict the location of a user
• Introduced the concept of Local Entities and preprocessed Wikipedia Hyperlink Graph to extract local entities for each city
• Investigated relatedness measures to establish the degree of association between a local entity and a city
• Evaluated the proposed approach against a benchmark dataset published by Cheng et al. For 5119 users, we are able to predict the location of 55% of users within 100 miles with an average error distance of 429 miles
ESWC 2015
42
FUTURE WORK
• Compute the confidence score of the prediction based on top-k cities and count of local entities in tweets
• Investigate other localness measures for score local entities
• Consider semantic types, categories of local entities and weight the contribution based on types
• Explore other knowledge bases such as Wikitravel and GeoNames
ESWC 2015

43
Thank you!
ESWC 2015
Paper at: http://www.knoesis.org/library/resource.php?id=2039 Contact: [email protected]@pavankaps

44
Top-k Accuracy
EVALUATION
ESWC 2015
45
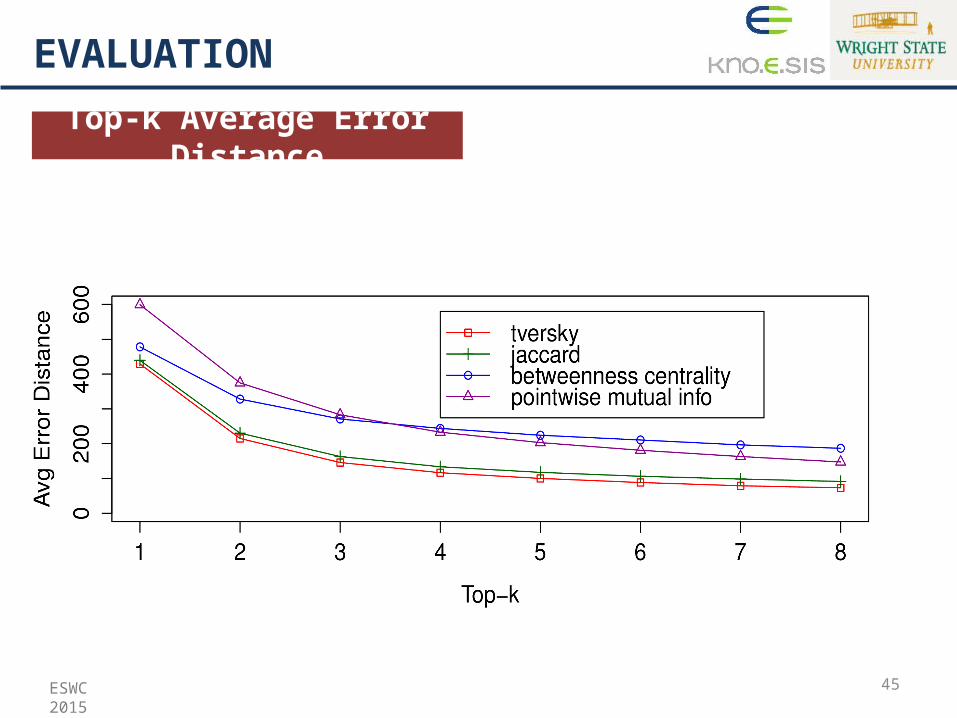
Top-k Average Error Distance
EVALUATION
ESWC 2015
46
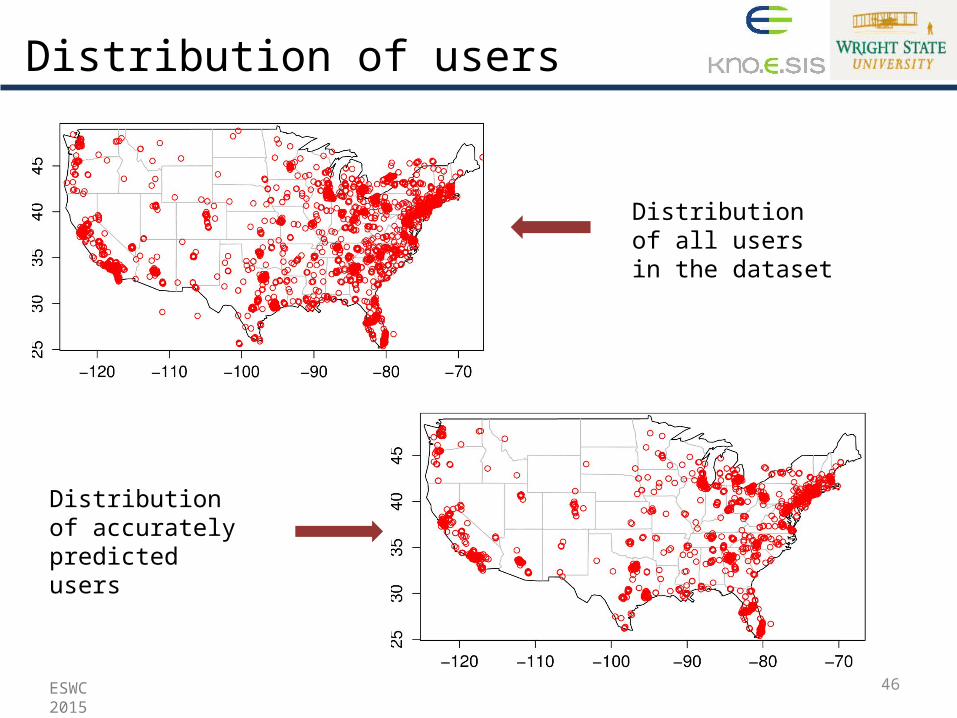
Distribution of all users in the dataset
Distribution of accurately predicted users
Distribution of users
ESWC 2015
47
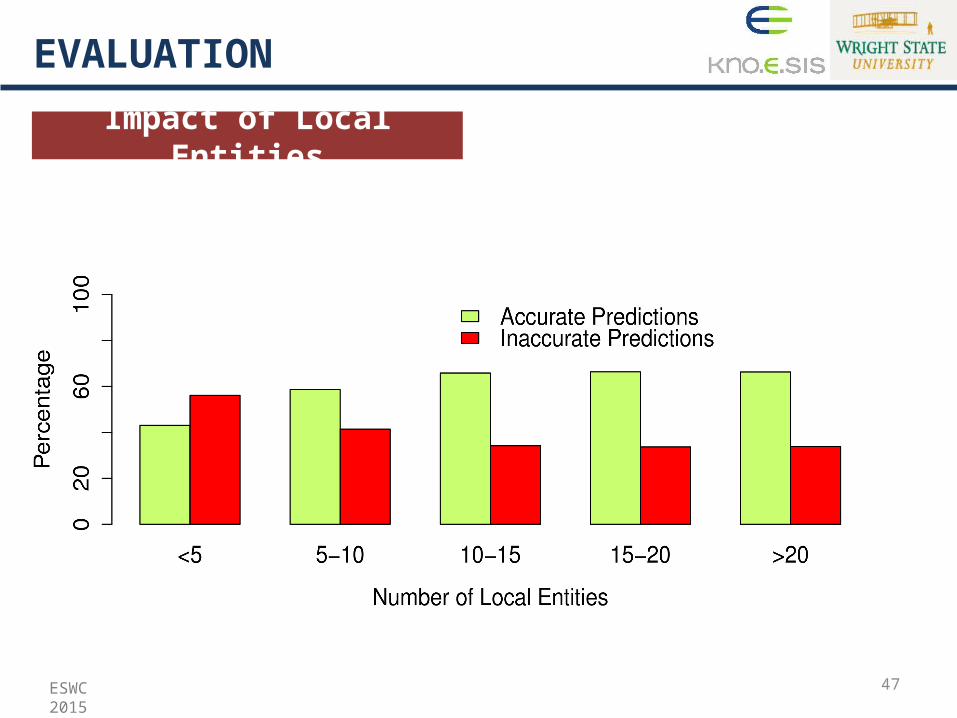
Impact of Local Entities
EVALUATION
ESWC 2015

48
Top 100 Cities
EVALUATION
• 2172 users from the dataset are from the top-100 most populated cities of United States
• 60% users predicted within 100 miles of their actual location
• 54% users predicted exactly at the city level
ESWC 2015