kisumu county integrated development …...i kisumu county integrated development plan | 2018 –...
TRANSCRIPT

i Kisumu County Integrated Development Plan | 2018 – 2022
KISUMU
COUNTY INTEGRATED DEVELOPMENT PLAN II,
2018-2022
Vision:
A peaceful and prosperous County where all citizens enjoy a high-
quality life and a sense of belonging.
Mission:
To realize the full potential of devolution and meet the development
aspirations of the people of Kisumu County

ii Kisumu County Integrated Development Plan | 2018 – 2022
Table of Contents
TABLE OF CONTENTS ...................................................................................................... II
LIST OF TABLES.............................................................................................................. VII
LIST OF MAPS/FIGURES ................................................................................................... X
LIST OF PLATES (CAPTIONED PHOTOS) .................................................................... XI
ABBREVIATIONS AND ACRONYMS .......................................................................... XIII
FOREWORD ...................................................................................................................... XV
ACKNOWLEDGEMENTS............................................................................................ XVIII
EXECUTIVE SUMMARY ................................................................................................ XX
CHAPTER ONE: .................................................................................................................... 1
COUNTY GENERAL INFORMATION ............................................................................... 1
1.0 INTRODUCTION ............................................................................................................ 2
1.1 COUNTY OVERVIEW ............................................................................................. 2
1.2 POSITION AND SIZE: ............................................................................................... 2
1.3 PHYSIOGRAPHIC AND NATURAL CONDITIONS .............................................. 4
1.4 ADMINISTRATIVE AND POLITICAL UNITS ......................................................... 5
1.5 DEMOGRAPHIC FEATURES .................................................................................. 8
1.6 HUMAN DEVELOPMENT APPROACH ............................................................... 14
1.7 INFRASTRUCTURE DEVELOPMENT ................................................................. 15
1.8 LAND AND LAND USE .......................................................................................... 21
1.9 LABOUR AND EMPLOYMENT ............................................................................ 23
1.10 IRRIGATION ............................................................................................................ 24
IRRIGATION INFRASTRUCTURE AND SCHEMES ..................................................... 24
1.11 CROP, LIVESTOCK, FISH PRODUCTION AND VALUE ADDITION .............. 25
1.12 MINING AND EXTRACTION. ............................................................................... 29
1.13 TOURISM AND WILDLIFE .................................................................................... 29
MAIN TOURIST AND WILDLIFE ATTRACTIONS ....................................................... 29
1.14 SPORTS, CULTURE AND CREATIVE ARTS ...................................................... 31
1.15 INDUSTRY AND TRADE ....................................................................................... 32
iii Kisumu County Integrated Development Plan | 2018 – 2022
1.16 THE BLUE ECONOMY ........................................................................................... 35
1.17 FORESTRY, AGRO FORESTRY AND VALUE ADDITION FOREST
RESOURCES: ...................................................................................................................... 36
1.18 FINANCIAL SERVICES .......................................................................................... 36
1.19 ENVIRONMENT AND CLIMATE CHANGE ........................................................ 37
1.20 WATER AND SANITATION .................................................................................. 38
1.21 HEALTH ACCESS AND NUTRITION ................................................................... 39
1.22 EDUCATION, SKILLS, LITERACY AND INFRASTRUCTURE......................... 47
1.23 SECURITY, LAW AND ORDER ............................................................................ 48
CHAPTER TWO .................................................................................................................. 49
LINKAGES WITH VISION 2030 AND OTHER PLANS .................................................. 49
INTRODUCTION ................................................................................................................ 50
2.0 COUNTY INTEGRATED DEVELOPMENT PLAN II (2018-2022)....................... 50
2.1 GOVERNOR’S MANIFESTO ................................................................................... 51
2.2 KENYA VISION 2030 .............................................................................................. 52
2.3 THE MEDIUM-TERM PLAN (MTP) III .................................................................. 53
2.4 SUSTAINABLE DEVELOPMENT GOALS (SDGS) .............................................. 54
CHAPTER THREE .............................................................................................................. 58
REVIEW OF IMPLEMENTATION OF THE PREVIOUS CIDP (2013-2017) ................. 58
3.0 INTRODUCTION ..................................................................................................... 59
3.1 ANALYSIS OF COUNTY REVENUE STREAMS ................................................ 59
3.1.1 COUNTY’S SHARE OF THE NATIONAL REVENUE ......................................... 59
3.1.2 COUNTY’S OWN SOURCE REVENUE (LOCALLY COLLECTED REVENUE)
64
3.2 COUNTY EXPENDITURE ANALYSIS ................................................................. 67
3.2.1 RECURRENT EXPENDITURE ANALYSIS .......................................................... 69
3.2.2 DEVELOPMENT EXPENDITURE ANALYSIS .................................................... 72
3.3 SUMMARY OF KEY FINDINGS UNDER THE FIRST CIDP I (2013-2017) ....... 74
CHAPTER FOUR ................................................................................................................ 76
COUNTY DEVELOPMENT PRIORITIES AND STRATEGIES ...................................... 76
iv Kisumu County Integrated Development Plan | 2018 – 2022
4.0 INTRODUCTION ..................................................................................................... 77
4.1 COUNTY SPATIAL DEVELOPMENT FRAMEWORK........................................ 78
4.2 NATURAL RESOURCE ASSESSMENT ................................................................ 92
4.3 DEVELOPMENT PRIORITIES AND STRATEGIES ............................................ 94
4.3.1 GOVERNANCE AND ADMINISTRATION ............................................................ 94
SECTOR INTRODUCTION ................................................................................................ 94
GOVERNANCE AND ADMINISTRATION: .................................................................... 94
4.3.2 SECTOR PROGRAMMES ....................................................................................... 97
4.4.2 THE COUNTY ASSEMBLY ................................................................................ 104
4.4.2.1 SECTOR INTRODUCTION .................................................................................. 104
1.6.2 COUNTY ASSEMBLY ........................................................................................... 104
4.4.2.2 SECTOR PROGRAMMES .................................................................................... 106
4.5.4 COUNTY PUBLIC SERVICE BOARD .............................................................. 107
4.5.4.1 SECTOR INTRODUCTION .................................................................................. 107
1.7.5 COUNTY PUBLIC SERVICE BOARD .............................................................. 107
4.4.3 CITY OF KISUMU ................................................................................................... 109
4.4.3.1 SECTOR INTRODUCTION .................................................................................. 109
4.4.3.2 SECTOR PROGRAMMES .................................................................................... 110
4.4.4 ECONOMIC PLANNING AND DEVELOPMENT ............................................ 115
4.4.4.1 SECTOR INTRODUCTION .................................................................................. 115
4.4.4.2 SECTOR PROGRAMMES .................................................................................... 117
4.4.5 WATER, IRRIGATION, ENVIRONMENT & NATURAL RESOURCES ............ 120
4.4.5.1 SECTOR INTRODUCTION .................................................................................. 120
4.4.5.2 SECTOR PROGRAMMES .................................................................................... 121
4.4.6 HEALTH AND SANITATION ............................................................................. 135
4.4.6.1 SECTOR INTRODUCTION .................................................................................. 135
4.4.6.2 SECTOR PROGRAMMES .................................................................................... 137
4.4.7 TOURISM, ARTS&CULTURE, SPORTS AND INFORMATION ........................ 149
4.4.7.1 SECTOR INTRODUCTION .................................................................................. 149

v Kisumu County Integrated Development Plan | 2018 – 2022
4.4.8 AGRICULTURE, LIVESTOCK AND FISHERIES SECTOR ................................ 166
4.4.8.2 SECTOR PROGRAMMES .................................................................................... 167
1. NO OF MOTORCYCLES PROCURED .................................................................... 167
2. SUB PROGRAMME .................................................................................................. 168
4.4.9 BUSINESS/TRADE, ENERGY AND INDUSTRY .............................................. 172
4.4.9.2 SECTOR PROGRAMMES .................................................................................... 173
4.4.10 PHYSICAL PLANNING, LANDS AND URBAN DEVELOPMENT .................. 184
4.4.10.1 SECTOR PROGRAMMES .................................................................................. 185
4.4.11: ROADS, TRANSPORT AND PUBLIC WORKS ................................................ 188
4.4.11.1 SECTOR INTRODUCTION ................................................................................ 188
4.4.11.2 SECTOR PROGRAMMES .................................................................................. 190
4.4.12 EDUCATION, TECHNOLOGY AND HUMAN RESOURCE DEVELOPMENT
............................................................................................................................................ 192
4.4.12.1 SECTOR INTRODUCTION ................................................................................ 192
4.4.13 FINANCE ............................................................................................................ 205
4.5.3.1 SECTOR INTRODUCTION .................................................................................. 205
4.4.13.2 SECTOR PROGRAMMES .................................................................................. 207
CHAPTER FIVE: ............................................................................................................... 214
IMPLEMENTATION FRAMEWORK ............................................................................. 214
5.1 INTRODUCTION ................................................................................................... 215
5.2 INSTITUTIONAL FRAMEWORK ....................................................................... 215
5.3 RESOURCE REQUIREMENT BY SECTOR ........................................................ 216
5.4 RESOURCE MOBILIZATION FRAMEWORK .................................................. 216
5.5 ESTIMATED RESOURCE GAP AND MEASURES OF ADDRESSING IT ...... 218
CHAPTER SIX: ................................................................................................................. 219
MONITORING AND EVALUATION FRAMEWORK ................................................... 219
6.1 INTRODUCTION ..................................................................................................... 220
6.2 THE LEGAL FRAMEWORK FOR MONITORING AND EVALUATION ......... 220
6.3 MODALITIES AND GUIDING PRINCIPLES OF M&E ...................................... 220

vi Kisumu County Integrated Development Plan | 2018 – 2022
6.4 INSTITUTIONAL ARRANGEMENT FOR M &E ................................................ 221
6.4.1 THE COUNTY M&E UNIT .................................................................................. 221
6.5 THE CITIZENRY ROLE IN M&E .......................................................................... 221
6.6 DATA COLLECTION, ANALYSIS, AND REPORTING .................................... 223
6.7 UTILIZATION OF M&E DATA AND DISSEMINATION OF FINDINGS ......... 223
6.8 M&E OUTCOME INDICATORS ........................................................................... 223
vii Kisumu County Integrated Development Plan | 2018 – 2022
List of Tables
TABLE 1: CLIMATIC CONDITION .................................................................................... 5
TABLE 2: ADMINISTRATIVE AND POLITICAL UNITS ................................................ 5
TABLE 3: COUNTY POPULATION PROJECTIONS ........................................................ 9
TABLE 4: POPULATION PROJECTIONS FOR KISUMU CITY .................................... 10
TABLE 5: POPULATION PROJECTIONS BY URBAN CENTRE .................................. 10
TABLE 6: POPULATION DENSITY ................................................................................. 10
TABLE 7: POPULATION PROJECTIONS FOR SPECIAL AGE GROUPS .................... 11
TABLE 8: PEOPLE WITH DISABILITIES BY TYPE, SEX AND AGE .......................... 13
TABLE 9 : DEMOGRAPHIC DIVIDEND POTENTIAL .................................................. 13
TABLE 10: HUMAN DEVELOPMENT INDICATORS ................................................... 14
TABLE 11:KENHA ROADS WITHIN THE COUNTY..................................................... 16
TABLE 12: KERRA ROADS WITHIN THE COUNTY .................................................... 16
TABLE 13: ELECTRICITY CONSUMPTION................................................................... 18
TABLE 14: RENEWABLE ENERGY PROJECTS IN THE SEVEN SUB-COUNTIES .. 20
TABLE 15: MAJOR HOTELS ............................................................................................ 30
TABLE 16: DISTRIBUTION OF COMMERCIAL BANKS WITHIN THE COUNTY ... 36
TABLE 17: WATER COVERAGE AND STORAGE CAPACITY .................................. 39
TABLE 18: TOP TEN CAUSES OF MORBIDITY IN KISUMU COUNTY .................... 39
TABLE 19: DISTRIBUTION OF COMMUNITY UNITS BY SUB-COUNTY IN
KISUMU COUNTY ............................................................................................................. 40
TABLE 20: SUMMARY OF REGISTERED FACILITIES IN KISUMU COUNTY BY
TYPE AND OWNERSHIP .................................................................................................. 42
TABLE 21: AVAILABLE HEALTH WORKFORCE BY CADRES IN THE PUBLIC
SECTOR WITHIN KISUMU .............................................................................................. 43
TABLE 22: KISUMU COUNTY PERFORMANCE ON HEALTH INFORMATION
MANAGEMENT ................................................................................................................. 45
TABLE 23: DISTIBUTION OF EDUCATIONAL INSTITUTIONS IN THE COUNTY . 47
TABLE 24: NUMBER OF LEARNERS PER INSTITUTION CATEGORY .................... 47

viii Kisumu County Integrated Development Plan | 2018 – 2022
TABLE 25: DISTRIBUTION OF SECURITY AND LAW OFFICES WITHIN THE
COUNTY.............................................................................................................................. 48
TABLE 26: LINKAGES OF COUNTY FUNCTIONS TO SDGS, GOVERNOR’S
MANIFESTO AND VISION 2030 ...................................................................................... 55
TABLE 27: KISUMU COUNTY DEPARTMENT FUNCTIONS AND THE RELATED
SDGS .................................................................................................................................... 56
TABLE 28: SUMMARY OF THE COUNTY’S SHARE OF THE NATIONAL
REVENUE............................................................................................................................ 59
TABLE 29: SUMMARY OF THE LOCALLY COLLECTED REVENUE ....................... 59
TABLE 30: SUMMARY OF THE COUNTY’S TOTAL SHARE OF REVENUE ........... 60
TABLE 31: COUNTY'S SHARE OF THE NATIONAL REVENUE ................................ 61
TABLE 32: LOCALLY COLLECTED REVENUE STREAMS ANALYSIS ................... 62
TABLE 33:RECURRENT ALLOCATION AND EXPENDITURES ................................ 68
TABLE 34: DEVELOPMENT ALLOCATIONS AND EXPENDITURES ....................... 71
TABLE 35: COUNTY SPATIAL DEVELOPMENT STRATEGIES BY THEMATIC
AREAS ................................................................................................................................. 78
TABLE 36: NATURAL RESOURCE ASSESSMENT ....................................................... 92
TABLE 37: GOVERNANCE SECTOR PROGRAMES ..................................................... 97
TABLE 38: COUNTY ASSEBLY PROGRAMMES ........................................................ 106
TABLE 39: COUNTY PUBLIC SERVICE BOARD SECTOR PROGRAMMES .......... 108
TABLE 40: KISUMU CITY PROGRAMMES ................................................................. 110
TABLE 41: DEPARTMENT OF ECONOMIC PLANNING AND DEVELOPMENT
SECTOR PROGRAMMES ................................................................................................ 117
TABLE 42: 5 WATER, IRRIGATION, ENVIRONMENT & NATURAL RESOURCES
SECTOR PROGRAMMES ................................................................................................ 121
TABLE 43: HEALTH AND SANITATION SECTOR PROGRAMME .......................... 137
TABLE 44: TOURISM, ARTS&CULTURE, SPORTS AND INFORMATION SECTOR
PROGRAMMES ................................................................................................................ 157
TABLE 45: AGRICULTURE, LIVESTOCK AND FISHERIES SECTOR
PROGRAMMES ................................................................................................................ 167
TABLE 46: BUSINESS/TRADE, ENERGY AND INDUSTRY SECTOR
PROGRAMMES ................................................................................................................ 173

ix Kisumu County Integrated Development Plan | 2018 – 2022
TABLE 47: PHYSICAL PLANNING, LANDS AND URBAN DEVELOPMENT
SECTOR PROGRAMMES ................................................................................................ 185
TABLE 48: ROADS, TRANSPORT AND PUBLIC WORKS SECTOR PROGRAMMES
............................................................................................................................................ 190
TABLE 49:EDUCATION, TECHNOLOGY AND HUMAN RESOURCE
DEVELOPMENTSECTOR PROGRAME ........................................................................ 194
TABLE 50: FINANCE SECTOR PROGRAMMES.......................................................... 207
TABLE 51: SUMMARY OF PROPOSED BUDGET BY SECTOR ................................ 216
TABLE 52: RESOURCE MOBILIZATION IMPLEMENTATION STRATEGY........... 216
TABLE53: REVENUE PROJECTIONS ........................................................................... 218
TABLE 54: SUMMARY OF M&E OUTCOME INDICATORS ..................................... 224

x Kisumu County Integrated Development Plan | 2018 – 2022
List of Maps/Figures
FIGURE 1: LOCATION OF KISUMU COUNTY IN KENYA ........................................... 3
FIGURE 2: KISUMU COUNTY ADMINISTRATIVE/POLITICAL BOUNDARIES ....... 8
FIGURE 3: CIDP LINKAGES WITH OTHER SECTORS PLANS; ................................. 51
FIGURE 4: MAIN REVENUE STREAMS EFFICIENCY RATES ................................... 65
FIGURE 5: DEPARTMENTS REVENUE STREAMS EFFICIENCY .............................. 66
FIGURE 6: BUDGET ABSORPTION RATES/SECTOR .................................................. 70
FIGURE 7: DEVELOPMENT EXPENDITURE ABSORPTION RATE ........................... 72
FIGURE 8: SOURCES OF COUNTY FUNDING ............................................................ 215
FIGURE 9: COUNTY INTEGRATED M&E STRUCTURE ........................................... 222
xi Kisumu County Integrated Development Plan | 2018 – 2022
List of Plates
PLATE 1: INTERSECTION OF NYAMASARIA-KONDELE BYPASS WITH
KISUMU-KERICHO ROAD ............................................................................................... 16
PLATE 2: KISUMU INTERNATIONAL AIRPORT ........................................................ 18
PLATE 3: SANG’ORO TURBINE (SONDU- MIRIU HYDRO ELECTRIC POWER
STATION) ............................................................................................................................ 20
PLATE 4 : OBUNGA INFORMAL SETTLEMENT IN RAILWAYS WARD ................. 22
PLATE 7: R. NYANDO USED FOR IRRIGATING THE RICE FIELDS IN AHERO ..... 25
PLATE 6: JUAKALI ARTISAN KISUMU ......................................................................... 24
PLATE 5: BODA-BODA RIDERS IN OBUNGA .............................................................. 24
PLATE 8: SUGARCANE PLANTATION IN MUHORONI .............................................. 26
PLATE9: BANANA DEMONSTRATION PLOT (MASENO ATC)................................. 28
PLATE 10: PINEAPPLE AND MAIZE DEMONSTRATION PLOT, LIVESTOCK AT
MASENO ATC FOR RESEARCH, AND GREEN HOUSE& ISOLATED
DEMONSTRATIONS (MASENO ATC) ............................................................................ 28
PLATE 11: CEMENT PRODUCTION INDUSTRY IN AWASI ONJIKO WARD ......... 29
PLATE 12: THE GRAND ROYAL SWISS ........................................................................ 31
PLATE 13: SOVEREIGN HOTEL ...................................................................................... 31
PLATE 15: GRAINS RETAIL SECTION AT JUBILEE MUNICIPAL MARKET .......... 32
PLATE 15: RETAIL MERCHANDISE ON ROAD RESERVE AT KIBUYE OPEN AIR
MARKET ............................................................................................................................. 33
PLATE 17: TRADERS ALONG KENYATTA AVENUE IN KISUMU ........................... 33
PLATE 18: TRADERS ALONG ANGAWA HIGHWAY IN KISUMU MARKET .......... 33
PLATE 19: CAPENTER AT WORK IN KIBUYE MARKET KISUMU .......................... 33
PLATE 20: JUA KALI SECTOR IN KIBUYE OPEN AIR MARKET .............................. 34
PLATE 21: PAGA BEACH IN SOUTH WEST KISUMU WARD .................................... 35
PLATE 23: CAR WASHING IN L. VICTORIA - LWANGNI BEACH ............................ 37
PLATE 22: DEGRADED LAND DUE TO MURRAM EXTRACTION IN
KANYAKWAR.................................................................................................................... 37
PLATE 24: KACHOK DUMPSITE JULY, 2017 ................................................................ 38
xii Kisumu County Integrated Development Plan | 2018 – 2022
PLATE 26: KISUMU COUNTY LEVEL IV HOSPITAL, FROM TOP LEFT THE
ENTRANCE, MALE GENERAL WARD, ENT CLINIC AND OUT-PATIENT .............. 41

xiii Kisumu County Integrated Development Plan | 2018 – 2022
Abbreviations and Acronyms
ADP Annual Development Plan
APRM African Peer Review Mechanism
ARVs Anti Retroviral
BMUs Beach Management Units
CA County Assembly
CBROP County Budget Review and Outlook Paper
CDF Constituency Development Fund
CFSP County Fiscal Strategy Paper
CHV Community Health Volunteer
CGK County Government of Kisumu
CIDP County Integrated Development Programme
CIMES County Integrated Monitoring and Evaluation System
CoG Council of Governor
CU Community Unit
ECDE Early Childhood Development Education
EIA Environmental Impact Assessment
ERS Economic Recovery Strategy
EU European Union
FY Financial Year
GBV Gender Based Violence
GDP Gross Domestic Product
GESIP Green Economy Strategy and Implementation Plan
GoK Government of Kenya
GsDP Grass-root support Development Programme
HDI Human Development Index
HIV/AIDS Human Immunodeficiency Virus/Acquired Immuno Deficiency
Syndrome
ICT Information Communication and Technology
KCHSSIP Kisumu County Health Sector Strategic Investment Plan

xiv Kisumu County Integrated Development Plan | 2018 – 2022
KDHS Kenya Demographic Health Survey
KEMSA Kenya Medical Supplies Authority
KeNHA Kenya National Highways Authority
KeRRA Kenya Rural Roads Authority
KISIP Kenya Informal Settlement Improvement Programme
KNBS Kenya National Bureau of Statistics
KRB Kenya Roads Board
KTB Kenya Tourist Board
KUP Kisumu Urban Programme
KUSP Kisumu Urban Support Programme
KURA Kenya Urban Roads Authority
LBDA Lake Basin Development Authority
MDGs Millenium Development Goals
M&E Monitoring and Evaluation
MTP Medium Term Plan
MMR Maternal Mortality Ratio
NEMA National Environmental Management Authority
NHIF National Hospital Insurance Fund
NITA National Industrial Training Authority
PPPs Public Private Partnerships
PWD People with Disability
SDG Sustainable Development Goals
SWM Solid Waste Management
UN United Nations
UNDP United Nations Development Programme
UNICEF United Naations Children Education Fund
VTC Vocational Training Centres
WHO World Health Organization

xv Kisumu County Integrated Development Plan | 2018 – 2022
FOREWORD
The second Kisumu County Integrated
Development Plan is the County’s
development blueprint that outlines the
programmes and projects which Kisumu
County intends to implement during the
five-year period starting 2018 to 2022. It is
the social contract between the County
Government and the people of Kisumu
County. The plan draws from the promises
made during campaigns to take up
leadership of the County and convert those
promises into actionable programmes and
projects.
Like other counties, our first CIDP (2013-2017) was prepared in 2013 and its
implementation ends in June, 2018. The CIDP II aims to build on the achievements and
also takes into account, lessons learnt from implementation of the CIDP I in order to put
the County on a high, broad-based, inclusive and sustainable growth trajectory recovery
path. Intrusively, County development planning takes place in the context of Global targets
in the current Sustainable Development Goals (SDGs), Agenda 2063 of the African Union
and the National Long-term Vision 2030 and its third MediumTerm Plan presently
anchored in the President’s “Big Four Agenda” and its implementation arrangements. Our
plan aligns to these frameworks since we recognize our circumstance in the diagnosis in the
constraints to Development that underpin the global, regional and national responses. That
nowithstanding our primary responsibily is to meet thedevelopment aspirations of the
people of Kisumu County.
For far too long, Kisumu has remaned a county of great potential, but a disappointing
under-achiever. With this plan, Kisumu is now a county of great potential and a promising
xvi Kisumu County Integrated Development Plan | 2018 – 2022
achiever. We will stopwalking with the chicken and begin to fly with the eagles. How will
we achieve this? Our ten-point plan in the Manifesto is integrated into this CIDP II, to keep
us focused on the following key priorities:
Revitalizing agriculture for food security and agribusiness;
Ensuring a healthy population living in a clean and secure environment;
Modernizing infrastructure;
Promotion of skills development and innovation;
Conservation of environment while opening the Kisumu lake-front for business;
Promotion of decent housing;
Promotion of sports, culture and arts;
Promotion of sustainable energy sources in industrialization and service sector
development
Promotion of tourism driven by culture and heritage and
Deepening the structures of devolved governance.
The central focus of the plan is to deliver and create an accelerated and inclusive economic
growth, higher living standards, improved governance, efficient public service delivery and
an enabling environment for the private sector to do business. The Plan also includes an
equitable and socio-economic agenda focusing on reducing inequalities in access to
productive resources and basic goods and services.
The CIDP II was prepared through an inclusive and consultative process in conformity to
to the requirements of the Constitution of Kenya on public participation in public policy-
making. In implementation, we recognize that our most valuable assets are the people,
interms of the human resources at the county government and various individual and group
actors outside the government. The county government will mobilize human effort,
financial and technical resources in partnership with the national government and external
partners to realize the goals in in this plan. Internally, we will introduce innovations in the
structure of the county government, for organizational efficiency and effective service
delivery.
xvii Kisumu County Integrated Development Plan | 2018 – 2022
I call upon residents of Kisumu County and our partners to give their best towards the
achievement of this plan. Together, we will build a prosperous and peaceful county where
all residents enjoy high quality life and feel at home.
HONOURABLE PROFESSOR PETER ANYANG’ NYONG’O
GOVERNOR - KISUMU COUNTY

xviii Kisumu County Integrated Development Plan | 2018 – 2022
ACKNOWLEDGEMENTS
On behalf of the County Government of Kisumu, specifically the department of Economic
Planning and Development, I am grateful to the County Integrated Development Plan
(CIDP II) preparation secretariat under the leadership of the Ag. Chief Officer, Ms.
Margaret Oumah for spearheading the development of the CIDP II (2018-2022).
The leadership displayed by Members of the County Assembly during public participation
fora in the respective wards and the valuable contributions as members of various house
committees in the respective Sector Working Groups is highly commended as a move
towards good governance. In addition, I would like to commend the immense role played
by members of the public in coming up with development strategies, programmes and
projects through memoranda and during public participation fora.
Much appreciation goes to the Executive Office of the Governor for the support,
cooperation and supervisory role played during the CIDP II preparation process. Special
thanks go to all Chief Officers and Directors for coordinating the various Sector Working
Groups throughout the process. The support and participation of the County Commissioner
and the various national government departments within the county is also appreciated.
Special thanks go to the Ministry of Devolution and Planning, the Council of Governors,
and the UNDP - Support to Devolution Programme for the technical assistance and support
provided to the County planning team.
I acknowledge the sustained effort of all development partners to the CIDP II preparation
process. Gratitude is owed to Friedrich Ebert Stiftung (FES-Kenya), Sustainable
Environmental Development Watch (SUSWATCH-Kenya) and Kenya Water and
Sanitation Civil Societies Network (KEWASNET) for their support towards the CIDP II
preparation launch and validation exercises respectively.
xix Kisumu County Integrated Development Plan | 2018 – 2022
Finally, with utmost appreciation and revered humility I recognize the contributions and
effort from the County Budget and Economic Forum and other individuals not mentioned,
that continue to kindle the spirit of sustainable development as we work towards ensuring
improved standards of living and service delivery to the citizenry of Kisumu County.
Mr. Richard D. Ogendo
Executive Committee Member- Economic Planning and Development

xx Kisumu County Integrated Development Plan | 2018 – 2022
Executive Summary
The second Kisumu County Integrated Development Plan identifies key policy actions,
programmes and projects that the County will implement in the 2018-2022 plan period.
The theme of this CIDP is “a peaceful and prosperous County where all citizens enjoy high
quality life and a sense of belonging.” The CIDP is divided into six chapters.
Chapter one provides a brief overview of the County, describes the county in terms of the
location, size, physiographic and natural conditions, demographic profiles as well as the
administrative and political units. It gives the background information on the socio-
economic and infrastructural indicators that has a bearing on the development of the
County.
The second chapter explains how the County Integrated Development Plan II (2018-22)
links up and integrates with the Governor’s manifesto, the Kenya Vision 2030 and its third
Medium Term Plan, Sustainable Development Goals and other Sectoral plans.
The third chapter presents a summary of key findings in CIDP I (2013-2017) and analysis
of the aggregate revenue allocation and expenditures for the period 2014/15 to 2016/17
financial years. It assesses the extent to which the implementation of various Projects,
Programs and Initiatives (PPIs) identified in the County Integrated Development Plan I
(2013-2017) addressed the development priorities of the citizens of Kisumu. It highlights
key challenges encountered and key lessons learnt during the implementation period.
Chapter four discusses the County spatial development framework which supports
economic and sectoral planning within which development projects and programmes will
be implemented. It entails an assessment of natural resources within the County; key
County development strategies, projects and programmes as identified by stakeholders in
the County.
Chapter five explains the resource mobilization strategies and mechanism for resource
mobilization for implementation of the CIDP II (2018-2022). It shows the linkages with
other stakeholders and provides projections on own-source, the equitable share of national
revenue, conditional grants from National Government or Development Partners as well as
the Public-Private Partnerships (PPPs) arrangement.
xxi Kisumu County Integrated Development Plan | 2018 – 2022
Chapter six provides an overview of the County’s Monitoring and Evaluation framework
which forms part of a results culture in the public service that is meant to provide value and
services for all citizenry.
In conclusion, the policy frameworks that are necessary to ensure the successful
implementation of the CIDP are elaborated in subsequent sections of this document. The
County Government will therefore ensure that the requisite legislation and reforms are
undertaken upfront so that the sector programmes, projects and activities are implemented
within the specified timelines as highlighted in the implementation matrix. The
programmes and projects to be implemented under PPPs are also highlighted in each of the
sectors’ implementation matrices.

xxii Kisumu County Integrated Development Plan | 2018 – 2022
PRIORITY AREAS OF THE CIDP II
(2018 – 2022)
I. Revitalize agriculture for food security and agribusiness
II. Ensure a healthy population living in a clean and safe environment
III. Build modern physical infrastructure
IV. Promote skills development and innovation
V. Conserve the environment while opening the Kisumu lakefront for
business;
VI. Provide decent housing
VII. Promote sports, culture and arts
VIII. Promote industrialization and a vibrant service sector, supported by
Sustainable energy sources.
IX. Promote tourism driven by culture and heritage and information and
communication technologies.
X. Deepen and strengthen the structures of devolved governance

1 Kisumu County Integrated Development Plan | 2018 – 2022
CHAPTER ONE:
COUNTY GENERAL INFORMATION

2 Kisumu County Integrated Development Plan | 2018 – 2022
1.0 Introduction
This chapter provides a brief overview of the county, describes the county in terms of the
location, size, physiographic and natural conditions, demographic profiles as well as the
administrative and political units. It gives the background information on the socio-economic
and infrastructural indicators that has a bearing on the development of the county.
1.1 County overview
Kisumu County is one of the 47 counties created through the devolved system of governance by
the Constitution of Kenya 2010 delineated as County number 42. The population is estimated at
1,224,531 persons as at the start of the plan period 2018. The county has a diverse background
comprising of urban and rural set-ups as well as rich ethnic, racial and cultural diversity with the
Luo being the dominant community. The county’s strategic position serves as a gateway for
Kenya into the rest of the African Great Lakes region. It is located on the shores of Lake Victoria
and serves as the main commercial and transport hub for the Western part of Kenya and the East
African region.
The county hosts the third largest city in Kenya, Kisumu city, which serves as the County's
headquarters. There are five major urban centers; Ahero, Katito, Muhoroni, Chemilil, and
Maseno. Other emerging fast-growing centers include Awasi, Pap-Onditi, Holo, Kombewa and
Sondu.
The major economic activities of the residents are trade, farming and fishing.
1.2 Position and Size:
Kisumu County lies between longitudes 33020’E and 35
0 20’E and latitude 0
0 20’ South and 0
0
50’ South. The County is bordered by Homa Bay County to the South, Nandi County to the
North East, Kericho County to the East, Vihiga County to the North West, Siaya County to the
West and surrounded by the second largest freshwater lake in the World; Lake Victoria. Kisumu
County covers approximately 567 km2 on water and 2086km
2 land area, representing 0.36% of
the total land area of Kenya's 580,367km2.

3 Kisumu County Integrated Development Plan | 2018 – 2022
Figure 1: Location of Kisumu County in Kenya

4 Kisumu County Integrated Development Plan | 2018 – 2022
1.3 Physiographic and Natural Conditions
1.3.1 Physical and topographic features
The county’s topography is undulating and characterized by Kano-Plains which is a flat stretch
lying on the floor of the Rift Valley, the Nyabondo Plateau and the over-hanging huge granite
rocks at Riat hills, Maseno and Seme areas. Due to flash flooding, the Kano-Plains have rich
alluvial soils which favour agricultural production in horticulture and rice. Granites on the other
hand, find their use essentially in the building and road construction industry.
The county is endowed with the second largest freshwater lake in the world; L. Victoria with
two major rivers; Nyando and Sondu-Miriu and seven permanent rivers, Awach-Kano,
Oroba/Ombeyi, Kibos, Awach-Seme, Kisian, and Mugru, in its catchment. These resources
provide a big potential for development of blue economy. Impala sanctuary, Ndere is land, the
legendary Luanda Magere and Kit-Mikayi sites are among the unique topographical features.
1.3.2 Ecological Conditions
Kano Plains is predominantly black cotton soil which is poorly drained and unstable though
suitable for rice, horticulture and sugarcane production. Seme and the lower parts of Nyakach
Sub-counties are dominated by lake sediments, commonly sand and clay soils while Kisumu
West Sub-county and upper-Nyakach are predominantly red-loamy soils suitable for agricultural
production. The lake shores are generally swampy and offer fertile ground for horticulture
and fish breeding.
1.3.3 Climatic Conditions
The climate of the County is generally warm with minimal monthly variation in temperatures
between 230C and 33
0C throughout the year. The rainfall is determined by a modified equatorial
climate characterized by long rains (March to May) and short rains (September to November).
The average annual rainfall varies from 1000-1800mm during the long rains and 450-600mm
during the short rains. The altitude in the County varies from 1,144 meters above the sea level on
the plains to 1,525 meters above sea level in the Maseno and Lower Nyakach areas. This greatly
influences temperatures and rainfall in the County.

5 Kisumu County Integrated Development Plan | 2018 – 2022
Table 1: Climatic Condition
Climatic Condition Unit 2014
Rainfall (annual average) Mm 725-1200
Long rains (average) Mm 1000-1800
Short rains(average) Mm 450-600
Temperature (annual average) OC 17-26.5
Temperature (annual average highest) OC 23-33
Temperature (annual average lowest) OC 16-18
Source: Metrological Department, Kisumu County (2014)
a) Rainfall
January is entirely a dry month. The peak generally falls between March and May, with a
secondary peak in September to November. Despite the challenges experienced in land
preparation as black cotton soils are difficult to work on manually during dry and heavy rain
seasons, the available rainfall is adequate and evenly distributed for small-scale food- crop
production and cash-crop growing.
b) Temperature
The annual maximum temperature ranges between 25OC and 33
OC and the annual minimum
temperature ranges between 16OC and 18
OC.
1.4 Administrative and Political Units
Kisumu County has seven Sub-Counties/ Constituencies namely: Kisumu East, Kisumu West,
Kisumu Central, Muhoroni, Nyando, Seme and Nyakach. The County has thirty-five wards
covering the locations and sub-locations as indicated in table 2 below:
Table 2: Administrative and Political Units
Sub-County
Name
Sub-
County
(projected
2018)
Population
Sub
County
area in sq.
Km2
(approx)
Ward Name Ward
Population
(projected
2018)
Ward
Area in
sq. Km2
(approx)
Ward description (sub-
locations)
Kisumu
East
189,730 135.90 Kajulu 51,660 38.30 Got Nyabondo, Kadero,
Okok, Konya Wathorego
Kolwa East 26,904 57.80 Buoye, Chiga & Mayenya
Manyatta “B” 35,326 2.50 Manyatta “B”
Nyalenda “A” 35,727 3.20 Nyalenda “A”
Kolwa Central 40,113 34.10 Nyalunya, Kasule
Kisumu
West
165,872
212.90
South West
Kisumu
27,963 50.40 Ojolla, Osiri Kanyawegi
Central
Kisumu
48,189 30.30 Kogony, Korando “A”
Korando “B”
North Kisumu 31,457 40.60 Dago. Mkendwa, Bar “A”
Bar “B” & Nyahera

6 Kisumu County Integrated Development Plan | 2018 – 2022
Sub-County
Name
Sub-
County
(projected
2018)
Population
Sub
County
area in sq.
Km2
(approx)
Ward Name Ward
Population
(projected
2018)
Ward
Area in
sq. Km2
(approx)
Ward description (sub-
locations)
West Kisumu 27,990 56.40 Newa, Upper Kadongo,
Lower Kadongo, south
Kapuonja & north Kapuonja
North West
Kisumu
30,275 35.20 West Karateng’ East
Karateng’, Sunga & Marera
Kisumu
Central
213,450
32.70
Railways 44,138 15.10 Kanyakwar, Bandari and
Nyawita
Migosi 25,057 1.90 Migosi
Shaurimoyo-
Kaloleni
18,712 2.10 Kaloleni
Market
Milimani
23,889 6.50 Northern & Southern
Kondele 60,669 2.40 Manyatta “A”
Nyalenda “B” 40,986 4.70 Nyalenda “B”
Seme
124,872
266.70
West Seme 35,963 77.10 West Reru, East Reru, West
Ngere, East Ngere, Ang’oga,
Alwala, Kadinga West, East
Kadinga, North Alungo, and
South Alungo
Central Seme 29,337 63.60 West Kanyadwera, East
Kanyadwera, Upper
Kombewa, East Othany,
West Othany &Lower
Kombewa
East Seme 27,410 55.70 West Kolunje, East Kolunje,
Kaila, Kitmikayi, Koker/
Kajulu.
North Seme 32,162 70.90 East Katieno, Kadero, West
Katieno, North Kowe, South
Kowe, North Ratta & South
Ratta
Nyando
178,246
413.20
East Kano
Wawidhi
21,907 101.90 Magina, Nyakongo, Katolo,
Achego & Ayueyo
Awasi Onjiko 32,949 94.50 Kobong’o, Border1, Border2,
Ayucha, Kakmie &
Wang’anga
Ahero 45,884 51.80 Kakola, Ahero, Kakola
Ombaka, Tura, South
Kochogo, Kochogo Central
and Kochogo North
Kabonyo-
Kanyagwal
31,678 87.00 Kabonyo Irrigation Scheme,
Kapiyo, Upper Bwanda,
Kwakungu, Central Bwanda,
Kolal, Anyuro, Ogenya,
Ugwe, Nduru and
Kadhiambo
Kobura 45,828 77.90 Kotieno, Kamayoga, Lela,
Masogo, Nyamware North,
Nyamware South, Rabuor,
Kochieng’& Okana

7 Kisumu County Integrated Development Plan | 2018 – 2022
Sub-County
Name
Sub-
County
(projected
2018)
Population
Sub
County
area in sq.
Km2
(approx)
Ward Name Ward
Population
(projected
2018)
Ward
Area in
sq. Km2
(approx)
Ward description (sub-
locations)
Muhoroni
184,220
667.30 Miwani 24,551 132.30 East Kabar, central Kabar,
West Kabar, Miwani North
Miwani East, Miwani Central
and Miwani West.
Ombeyi 33,247 92.50 Obumba, Kang’o, Ramula,
Kore& Ahero Irrigation
Scheme
Masogo/
Nyang’oma
41,069 106.10 Wang’aya1, Wang’aya 2,
Kamswa North, Kamswa
South, Sidho1 & Sidho East
2
Chemelil 33,337 185.50 Songhor East, Songhor West,
Upper Tamu, Lower Tamu,
Kibigori, Chemelil,
Nyangore, Got Abuoro
Muhoroni/
Koru
52,015 183.10 Muhoroni town, Orego,
Owaga, Tonde, Nyando,
Koru, Ochoria, Fort- Ternan
& Homaline
Nyakach
168,140
357.30
South West
Nyakach
21,892 50.90 Kajimbo, Ramogi, Gari &
West Kadiang’a
North
Nyakach
42,347 110.40 Rarieda, Lisana, Kasae, Jimo
Middle, Gem Rae, Gem
Nam, Agoro East, Jimo East,
Awach, Agoro West and
Kandaria
Central
Nyakach
31,952 76.00 Moro, Kabodho East,
Olwalo, Jimo West, Kabodho
North and Kabodho West
West Nyakach 33,369 69.00 Upper Kadianga, Adingo
Opanga, West Koguta,
Nyong’onga and Lower
Kadiang’a
South East
Nyakach
38,581 51.00 East Koguta, East Kadiang’a
and Ramogi

8 Kisumu County Integrated Development Plan | 2018 – 2022
Figure 2: Kisumu County Administrative/Political Boundaries
Source: Independent Electoral and Boundaries Commission
1.5 Demographic Features
1.5.1 Population size and Composition
The population of the County according to the 2009 Kenya National Population and Housing
Census was 968,909 persons with 474,687 (49.0 percent) males and 494,222 (51.0 percent)
females. The projections for the start of the plan year 2018; mid of the plan year 2020 and the
end of the plan year 2022 have been tabulated with a population growth rate of 2.6 percent
basing on the 2009 population census.
Table 3 below shows population by age groups as at 2009 and projections for 2018, 2020 and
2022.

9 Kisumu County Integrated Development Plan | 2018 – 2022
Table 3: County Population Projections
Age
group
2009 (Census) 2018 (Projected) 2020 (Projected) 2022 (Projected)
Male Female Total Male Female Total Male Female Total Male Female TOTAL
0–4 80,511 80,098 160,609 101,752 101,230 202,982 107,190 106,641 213,831 112,912 112,333 225,245
5–9 67,083 67,779 134,862 84,781 85,661 170,442 89,313 90,239 179,552 94,080 95,056 189,136
10-14 62,706 63,359 126,065 79,249 80,075 159,324 83,485 84,355 167,840 87,941 88,857 176,799
15-19 55,597 56,742 112,339 70,265 71,712 141,977 74,021 75,545 149,566 77,971 79,577 157,549
20-24 47,281 57,649 104,930 59,755 72,858 132,613 62,949 76,753 139,701 66,309 80,849 147,158
25-29 40,964 40,614 81,578 51,771 51,329 103,100 54,539 54,073 108,611 57,450 56,959 114,408
30-34 30,412 27,515 57,927 38,435 34,774 73,210 40,490 36,633 77,123 42,651 38,588 81,239
35-39 21,251 20,611 41,862 26,858 26,049 52,906 28,293 27,441 55,734 29,803 28,906 58,709
40-44 15,145 16,894 32,039 19,141 21,351 40,492 20,164 22,492 42,656 21,240 23,693 44,933
45-49 13,361 15,298 28,659 16,886 19,334 36,220 17,789 20,367 38,156 18,738 21,455 40,193
50-54 11,251 12,504 23,755 14,219 15,803 30,022 14,979 16,648 31,627 15,779 17,536 33,315
55-59 8,718 9,175 17,893 11,018 11,596 22,614 11,607 12,215 23,822 12,226 12,867 25,094
60-64 7,054 7,597 14,651 8,915 9,601 18,516 9,392 10,114 19,506 9,893 10,654 20,547
65-69 4,163 5,402 9,565 5,261 6,827 12,088 5,543 7,192 12,735 5,838 7,576 13,414
70-74 3,777 4,757 8,534 4,773 6,012 10,785 5,029 6,333 11,362 5,297 6,671 11,968
75-79 2,392 3,356 5,748 3,023 4,241 7,264 3,185 4,468 7,653 3,355 4,707 8,061
80+ 3,021 4,872 7,893 3,818 6,157 9,975 4,022 6,486 10,509 4,237 6,833 11,069
Total 474,687 494,222 968,909 599,921 624,610 1,224,531 631,987 657,996 1,289,983 665,720 693,117 1,358,837
Source: Economic Planning CGK (2018)
Table 3 above indicates that the categories between 0-4 and 5-9 age groups according to the 2009
census statistics have the largest populations of 160,609 and 134,862 respectively and it is
estimated at 202,982 and 170,442 in the year 2018, 225,245 and 189,136 by the end of the plan
period (2022) respectively. The cohort with the lowest population is 75-79 years. The 2018
population projection of this age cohort is 7,264 and is expected to rise to 8,061 by 2022.
The City of Kisumu
Kisumu City covers Kisumu Central and Kisumu East Sub-Counties and the following wards in
Kisumu West Sub-County; South West Kisumu, Central Kisumu and North Kisumu.

10 Kisumu County Integrated Development Plan | 2018 – 2022
Table 4: Population Projections for Kisumu City
Sub-
County
2009 (Census) 2018 (Projected) 2020 (Projected) 2022 (Projected)
Male Female Total Male Female Total Male Female Total Male Female Total
Kisumu
Central
83,191 85,701 168,892 105,139 108,311 213,450 110,759 114,100 224,859 116,670 120,191 236,861
Kisumu
East
74,799 75,325 150,124 94,533 95,198 189,730 99,586 100,286 199,872 104,901 105,639 210,540
Kisumu
West
43,341 41,803 85,144 54,775 52,832 107,607 57,703 55,656 113,359 60,783 58,626 119,409
Total
201,331 202,829 404,160
254,447
256,340 510,787 268,047
270,042
538,089
282,355
284,456
566,810
Table 5: Population Projections by Urban Centre
Source: Economic Planning CGK (2018)
Table 6: Population Density
Sub-county 2009 (Census) 2018 (Projected) 2020(Projected) 2022 (Projected)
Population Densit
y
Population Density Population Density Population Density
Kisumu East 150,124 1,105 189,730 1,397 199,872 1,471 210,540 1,550
Kisumu West 131,246 616 165,872 779 174,738 820 184,065 864
Kisumu Central 168,892 5,165 213,450 6,528 224,859 6,877 236,861 7,244
Seme 98,805 519 124,872 469 131,547 494 138,568 520
Nyando 141,037 341 178,246 431 187,773 454 197,796 478
Nyakach 133,041 372 168,140 470 177,128 495 186,582 522
Muhoroni 145,764 218 184,220 276 194,067 290 204,425 306
Total 968,909 483 1,224,530 610 1,289,984 642 1,358,837 677
Source: Economic Planning CGK (2018)
Urban
Centre
2009 (Census) 2018 (Projected) 2020 (Projected) 2022 (Projected)
Male Female Total Male Female Total Male Female Total Male Female Total
Ahero 3912 4663 8,575 4,944 5,893 10,837 5,208 6,208 11,417 5,486 6,540 12,026
Maseno 1720 1581 3,301 2,174 1,998 4,172 2,290 2,105 4,395 2,412 2,217 4,629
Chemelil 4331 3557 7,888 5,474 4,495 9,969 5,766 4,736 10,502 6,074 4,988 11,062
Awasi 1264 1224 2,488 1,597 1,547 3,144 1,683 1,630 3,312 1,773 1,717 3,489
Muhoroni 7,735 7,071 14,806 9,776 8,937 18,712 10,298 9,414 19,712 10,848 9,917 20,765
Total 18,962 18,096 37,058 23,965 22,870 46,834 25,245 24,093 49,338 26,593 25,379 51,971
11 Kisumu County Integrated Development Plan | 2018 – 2022
1.5.2 Population Density and Distribution
The County's average population density is projected at 610 persons per square km and is
expected to grow to 677 persons per square km by the end of the plan period (2022). The most
densely populated Sub-County as per the 2018 population projections is Kisumu Central at 6,528
persons per square km while Muhoroni Sub-County is the least at 276 persons per square km.
By end of the plan period, it is projected that Kisumu Central Sub-County population density
would be 7,244 persons per square km while Muhoroni Sub-County will grow to 306 persons per
square km.
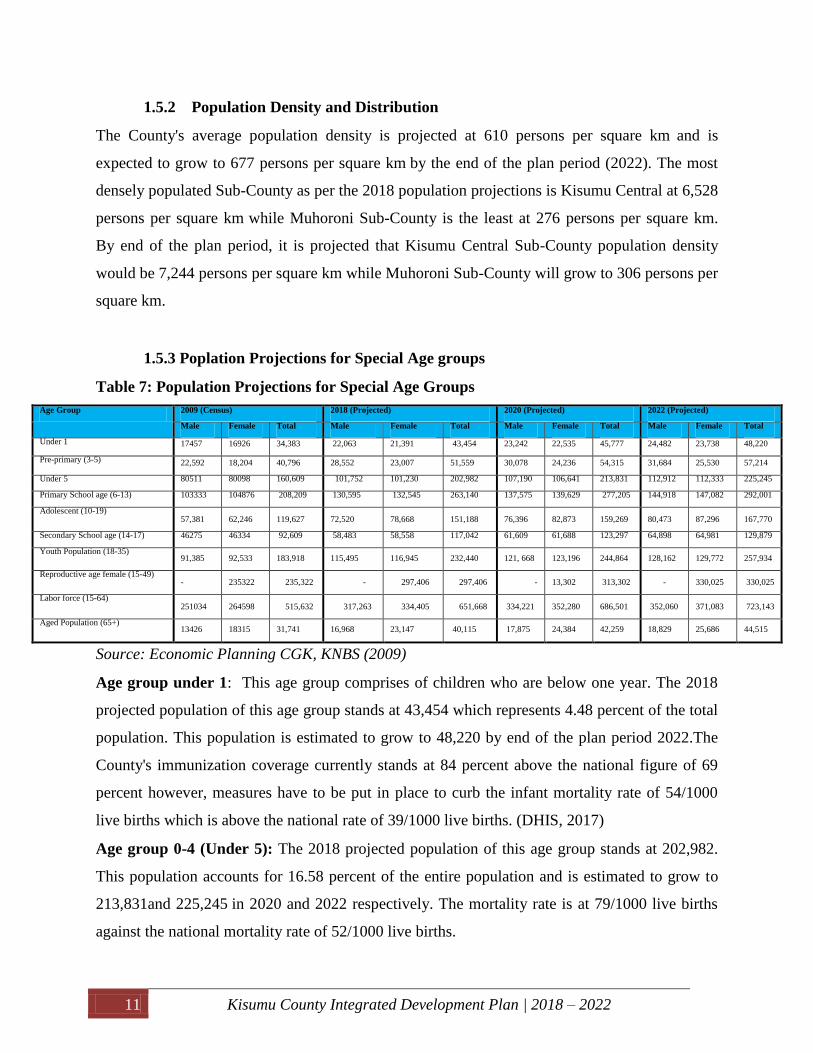
1.5.3 Poplation Projections for Special Age groups
Table 7: Population Projections for Special Age Groups
Age Group 2009 (Census) 2018 (Projected) 2020 (Projected) 2022 (Projected)
Male Female Total Male Female Total Male Female Total Male Female Total
Under 1 17457 16926 34,383 22,063 21,391 43,454 23,242 22,535 45,777 24,482 23,738 48,220
Pre-primary (3-5) 22,592 18,204 40,796 28,552 23,007 51,559 30,078 24,236 54,315 31,684 25,530 57,214
Under 5 80511 80098 160,609 101,752 101,230 202,982 107,190 106,641 213,831 112,912 112,333 225,245
Primary School age (6-13) 103333 104876 208,209 130,595 132,545 263,140 137,575 139,629 277,205 144,918 147,082 292,001
Adolescent (10-19) 57,381 62,246 119,627 72,520 78,668 151,188 76,396 82,873 159,269 80,473 87,296 167,770
Secondary School age (14-17) 46275 46334 92,609 58,483 58,558 117,042 61,609 61,688 123,297 64,898 64,981 129,879
Youth Population (18-35) 91,385 92,533 183,918 115,495 116,945 232,440 121, 668 123,196 244,864 128,162 129,772 257,934
Reproductive age female (15-49) - 235322 235,322 - 297,406 297,406 - 13,302 313,302 - 330,025 330,025
Labor force (15-64) 251034 264598 515,632 317,263 334,405 651,668 334,221 352,280 686,501 352,060 371,083 723,143
Aged Population (65+) 13426 18315 31,741 16,968 23,147 40,115 17,875 24,384 42,259 18,829 25,686 44,515
Source: Economic Planning CGK, KNBS (2009)
Age group under 1: This age group comprises of children who are below one year. The 2018
projected population of this age group stands at 43,454 which represents 4.48 percent of the total
population. This population is estimated to grow to 48,220 by end of the plan period 2022.The
County's immunization coverage currently stands at 84 percent above the national figure of 69
percent however, measures have to be put in place to curb the infant mortality rate of 54/1000
live births which is above the national rate of 39/1000 live births. (DHIS, 2017)
Age group 0-4 (Under 5): The 2018 projected population of this age group stands at 202,982.
This population accounts for 16.58 percent of the entire population and is estimated to grow to
213,831and 225,245 in 2020 and 2022 respectively. The mortality rate is at 79/1000 live births
against the national mortality rate of 52/1000 live births.
12 Kisumu County Integrated Development Plan | 2018 – 2022
Age group 3-5 (Pre-primary School) This age group comprises of children in Early Childhood
Development Education (ECDE). The 2018 projected population for this age group stands at
51,559 accounting for 4.2 percent of the total County’s population. The total number of
registered pre-primary school going children as at September 2017 doubles this projected
population. It is projected to grow to 54,315 by 2020 and 57,214 by end of the plan period, 2022.
The male accounts for 55.4 percent of this age group.
Age Group 6-13 (Primary School): This is the population of Primary School going age and it
accounts for 21.5 percent (263,140) of the total, this age cohort is expected to grow to 277,205 in
2020 and 292,001 by end of Plan period, 2022.
Age Group 10-19 (Adolescent): This age group drives the change in the disease burden
between child-hood to adulthood. It accounts for the highest number of drug abusers, incidences
of STIs and health rights and cases of GBV. The 2009 Kenya National Housing and Population
census put this age group population at 57,381 male and 66, 246 females. It is projected to
increase to 80,473 male and 87,296 females at the end of the plan period, 2022. It accounts for
12.76 percent of the total population.
Age group 14-17 (Secondary School): It is estimated that 117,053 persons are in the secondary
school going age in the year 2018. The population is expected to grow to 123,309 and 129,891 in
2020 and 2022 respectively. The net enrolment in secondary schools for this group which
constitute 9.6 percent of the County population stands at 57.7 percent (34,208) for males and
58.5 percent (32,618) for females.
Age group 18-35 (Youth Population): The County’s youth population in 2018 is estimated at
232, 440 accounting for 19.0 percent of the total population. It is estimated that the population
will grow to 244,864 in 2020 and to 257,934 by 2022. This age group is the most productive
with the highest unemployment rate and inadequate skills.
Age group15-49 (Reproductive Age): Reproductive health issues remain critical to the County
as women face many challenges. The County’s fertility rate stands at 4percent Maternal
Mortality Rate is at 495/100,000 live births against the national which stands at 362/100,000
live births and a contraception prevalence of 59.3 percent against the country’s 52.3 percent.
The 2018 projected population for this age group is 297,406 which accounts for 24.3 percent of
the County’s population. The group is estimated to grow to 313,302 and 330,025 in 2020 and
2022 respectively.

13 Kisumu County Integrated Development Plan | 2018 – 2022
Age group 15-64 (Labour Force): The projected labour force in the County in 2018 is 651,668
which constitute 53.2 percent of the total County population. It is estimated to increase to
686,501 and 723,143 in 2020 and 2022 respectively. This implies that the County has a readily
available labour (human resource) and therefore there is need for formulation of programmes
that would develop human resource skills. In addition, the County has to formulate strategies to
strengthen the sectors which constitute her economic base so that employment can be created.
Age group above 65: The County’s elderly population is estimated at 40,115 in 2018. This
accounts for 3.4 percent of the total population and is projected to increase to 42,259 in 2020 and
44,515 by 2022. It is important to understand this population for various family, social and
economic aspects of society in designing of social protection.
1.5.4 Population of persons with disabilities
Table 8: People with disabilities by type, sex and age
Hearing Speech Visual Mental Physical/ Self-
care
Other Total
Male 3,430 2,697 7,052 2,222 7,481 1,464 24,347
Female 4,047 2,252 9,110 1,757 9,081 1,924 28,131
Total 7,477 4,949 16,162 3,979 16,562 3,388 52,517
Source: Kenya National Bureau of Statistics, (2009) Kenya National Population and Housing Census Vol.II
The number of persons with disabilities according to the 2009 Kenya National Population and
Housing Census was 52,517 which accounted for 5.4 percent of the then total population. This
high proportion compared to the national figure of 3.5 percent calls for special attention by the
Government, partners and stakeholders in terms of funding for programmes that can address the
specific needs of People with Disabilities. It is expected that the number of PWDs with physical
challenges will increase due to increased number of accidents from the unregulated boda boda
sector.
Table 9 : Demographic Dividend Potential
Source: Department of Economic Planning, KNBS (2009)
Category 2009* 2014 2017 2022 2030
Population Size 968,909 1,103,500 1,193,103 1,358,837 1,673,256
Population below 15 421,536 480,091 519,075 591,179 727,971
Population 15-64 515,632 587,258 634,943 723,143 890,470
Population above 65 31,741 36,150 390,86 44,515 54,815
Dependency ratio 46.78 46.78 46.78 46.78 46.78
Fertility rate 4 4 4 4 4
14 Kisumu County Integrated Development Plan | 2018 – 2022
1.6 Human Development Approach
The Human Development Approach is a new approach for advancing human well-being and is
focused more on people and their opportunities and choices. It expounds on the richness of
human life, rather than simply the richness of the economy in which human beings live. The
Human Development Approach is based on three foundations; living a long, healthy and creative
life; being knowledgeable and finally having access to resources needed for a decent standard of
living.
As the county moves towards implementing its second County Integrated Development Plan II
(2018-2022) and monitoring its implementation, the human development approach remains
useful to articulating the objectives of the 2030 agenda.
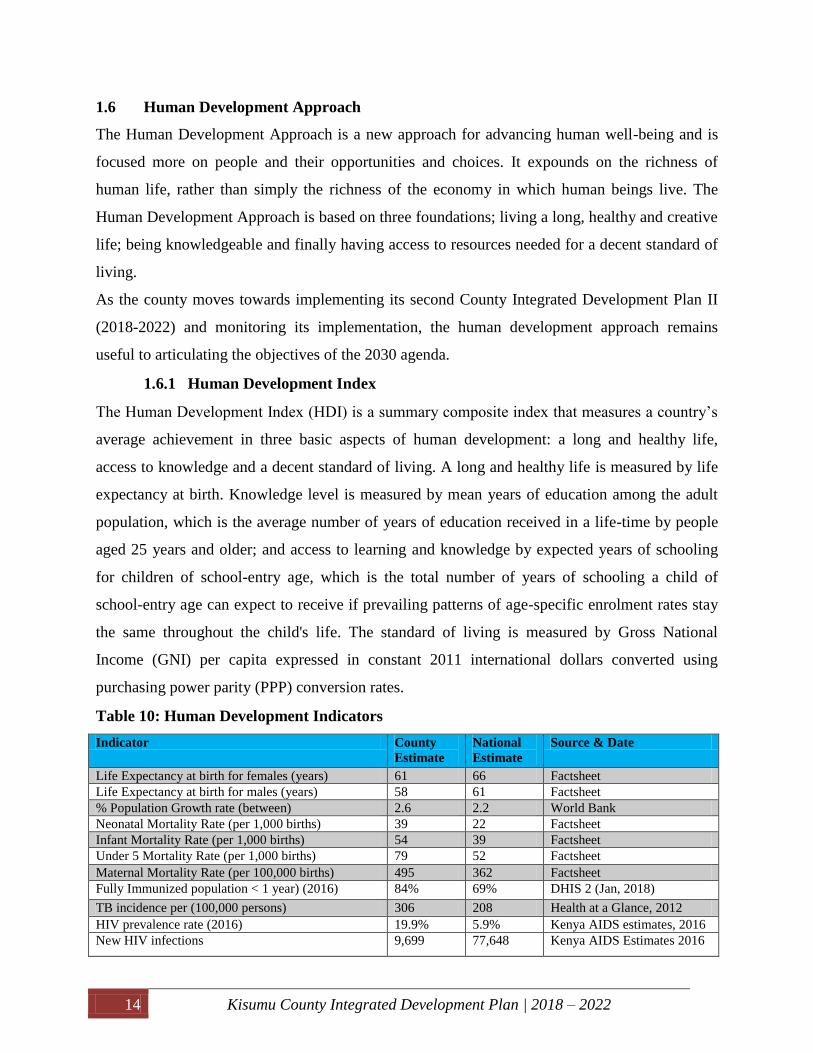
1.6.1 Human Development Index
The Human Development Index (HDI) is a summary composite index that measures a country’s
average achievement in three basic aspects of human development: a long and healthy life,
access to knowledge and a decent standard of living. A long and healthy life is measured by life
expectancy at birth. Knowledge level is measured by mean years of education among the adult
population, which is the average number of years of education received in a life-time by people
aged 25 years and older; and access to learning and knowledge by expected years of schooling
for children of school-entry age, which is the total number of years of schooling a child of
school-entry age can expect to receive if prevailing patterns of age-specific enrolment rates stay
the same throughout the child's life. The standard of living is measured by Gross National
Income (GNI) per capita expressed in constant 2011 international dollars converted using
purchasing power parity (PPP) conversion rates.
Table 10: Human Development Indicators
Indicator County
Estimate
National
Estimate
Source & Date
Life Expectancy at birth for females (years) 61 66 Factsheet
Life Expectancy at birth for males (years) 58 61 Factsheet
% Population Growth rate (between) 2.6 2.2 World Bank
Neonatal Mortality Rate (per 1,000 births) 39 22 Factsheet
Infant Mortality Rate (per 1,000 births) 54 39 Factsheet
Under 5 Mortality Rate (per 1,000 births) 79 52 Factsheet
Maternal Mortality Rate (per 100,000 births) 495 362 Factsheet
Fully Immunized population < 1 year) (2016) 84% 69% DHIS 2 (Jan, 2018)
TB incidence per (100,000 persons) 306 208 Health at a Glance, 2012
HIV prevalence rate (2016) 19.9% 5.9% Kenya AIDS estimates, 2016
New HIV infections 9,699 77,648 Kenya AIDS Estimates 2016

15 Kisumu County Integrated Development Plan | 2018 – 2022
(0.4%) (0.3%)
Adults 15 years and above 8,790 71,034 Kenya AIDS Estimates 2016
Children (0-14 years) 909 6,613 Kenya AIDS Estimates 2016
Adolescent and young people (15-24 years) 4996 (52%
of new
infections)
35776 (46
% of new
infections)
Kenya AIDS Estimates 2016
HIV burden 144,303 1.5 million Kenya AIDS Estimates 2016
Malaria cases (per 100,000) 46,444 20,252 Health at a Glance
Malaria test positivity rate (%) 45.0 41.0 Health at a Glance, 2012
Malaria prevalence 27% 8% (2015 Kenya Malaria
Indicator Survey)
Contraception prevalence (%) 59.3 53.2 Health at a Glance, 2012
Skilled deliveries (%) (2016) 69.7% 56% DHIS 2 (Jan, 2018)
Stunting (MOH-UNICEF Survey 2016, 2017) 18% 26% MOH-UNICEF Survey 2016,
2017)
Exclusive breastfeeding 77% 50% MOH-UNICEF Survey 2016,
2017)
Source: Department of Health CGK (2017)
1.7 Infrastructure Development
The County is served with effective and reliable infrastructure which is critical in lowering the
cost of doing business and increasing the competitiveness of the County.
1.7.1 Roads Network
Kisumu County is served with reliable road network, Major players in the road sub-sector in the
County include; Kenya National Highways Authority (KeNHA), Kenya Urban Roads Authority
(KURA), Kenya Rural Roads Authority (KeRRA), Kenya Informal Settlement Improvement
Projects (KISIP), Kenya Wildlife Services (KWS), Kenya Roads Board (KRB), Kisumu Urban
Projects (KUP).

16 Kisumu County Integrated Development Plan | 2018 – 2022
Plate 1: Intersection of Nyamasaria-Kondele Bypass with Kisumu-Kericho Road
Table 11:KENHA Roads within the County
Road Class Road Description Length (KM) Surface type
A1 Majengo – Kisumu- Kisii- Migori- IBD
Isebania
224 Paved
A1-R Kisumu A1 Dual RHS 1 Paved
A12 IBD Busia- Kisumu- Kericho 198 Paved
B10 Osieko- Bondo-A12 Kisian 82 Paved
B2 Mbita- HomaBay- Kendu Bay- A1 Katito 124 Paved
B8 A12 Awasi- Kapasbet- Mosoriot- A8
Eldoret
42 Paved
TOTAL LENGTH 671
Source: Kisumu Regional Office-KeNHA (2018)
Table 12: KeRRA Roads within the County
Road Code Section Name Road Class Length(KM) Surface
Type
Administrative
unit/Remarks
Road
Condition Old New Old New
C34 C674 Mamboleo-
Miwani-
Chemelil-
Kipsitet
C C 53 Gravel Kisumu
East/Muhoroni
Poor
D311 C677 Chemase-
Kapkuong-
Kopere-
Muhoroni
D C 21.7
Gravel Muhoroni Fair
C35 C749 Awasi-
Muhoroni-
Fortenan-
Londiani
C C 21.86 Paved Muhoroni Good

17 Kisumu County Integrated Development Plan | 2018 – 2022
E219 C756 Storepamba-
Sosiot-
Kapsuser
E C 5.23 Gravel Nyakach Poor
D218 C757 Kusa-
Nyamarimba-
Sondu
D C 26.9 Gravel Nyakach Fair
R13 C758 Ramula-Sondu RAR C 20.24 Gravel Nyakach Fair
URA2 C799 Riat-Rabuor URA C 11.509 Earth/gravel Nyando Poor
D245 C800 Kombewa-
Maseno
D C 17.2 Paved Seme (under
construction)
Good
C842 Kalandini-
Wang’arot
D C 19.3 Paved Seme (under
construction
Good
D293 C851 Lake Victoria-
Ahero-Miwani
D C 29.6 Gravel Nyando/Muhoroni Fair
E248 C852 Chiga-
Ombeyi-
Kibigori
E C 27.3 Gravel Muhoroni Fair
D290 C853 Kondele-
Rabuor
D C 16.7 Gravel Kisumu East Fair
D290A C854 Korowe-
Kabonyo
D C 11.4 Gravel Nyando Fair
Source: Kisumu KeRRA Region Office (2018)
1.7.2 Kisumu International Airport
This is the third busiest airport in Kenya and the Country’s fourth International airport. Though
classified as an Internatioonal Airport scheduled passenger services is available only to Nairobi
and Mombasa.The Airport is set for a second phase expansion that will include the construction
of a parallel taxiway, cargo apron and associated facilities. Airlines operating include Kenya
Airways, Fly 540, Jambo and Silverstone. So far its only the Silverstone that offers direct flight
to Mombasa.

18 Kisumu County Integrated Development Plan | 2018 – 2022
Plate 2: Kisumu International Airport
1.7.3 Information, Communication Technology
ICT is a foundation for economic development. Kenya’s vision of knowledge-based economy
aims at shifting the current industrial development path towards innovation where creation,
adoption, adaptation and use of knowledge remain the key source of economic growth. ICT is a
critical tool for expanding human skills and rests largely on a system of producing, distributing
and utilizing information and knowledge that in turn plays a great role in driving productivity
and economic prosperity.
1.7.4 Energy access
The main sources of energy within the County are electricity and thermal (firewood, charcoal,
kerosene, LPG, biogas and solar). The County has not fully tapped into the potential of solar
power and renewable energy. Currently, the growth of urban areas requires the installation of
floodlights to promote the 24-hour economy and improve on security.
Electricity Consumption
The total annual electrical energy consumption in Kisumu County was estimated at 250.3 GWh
as at the year 2015. This is broken down as per the table below:
Table 113: Electricity Consumption

19 Kisumu County Integrated Development Plan | 2018 – 2022
Consumer Number of
Consumers
Annual Consumption
(GWh)
Percentage
(%)
Households 116,332 9.5 5.8
SMEs (Small Commercial) 594,904 48.4 29.5
Private sector within top 100
consumers
55 55.3 33.7
Public sector within top 100
consumers
15 8.3 5.0
F9 (Company Installations) 461 0 0.0
SL (Street Lighting) 86 0.1 0.1
Other Public and Private sector
consumers
111,857 42.5 25.9
KPLC Sub-total 823,710 164.1 100
Sugar Industry own generation 3 86.2 52.5
Approximated total 823,713 250.3 152.5
Source: KPLC (2018)
The consumption pattern depicts that private sector contributes to the highest share of electricity
consumption, followed by the public-sector entities. Household consumption accounts for only
5.8 percent of the total electricity supplied by Kenya Power.
Electricity coverage stood at 46.24 percent in 2015. The County targets to increase electrification
by 90 percent by the end of the plan period (2022) through a partnership programme between the
County Government and the Rural Electrification Authority.
The main sources of renewable energy that have been exploited in the County for electricity
generation are hydropower and biomass. The County has two hydro plants: Sondu Miriu and
Sang’oro which contributes 60MW and 20.2MW respectively to the National grid.

20 Kisumu County Integrated Development Plan | 2018 – 2022
Plate 3: Sang’oro turbine (Sondu- Miriu hydro electric power station)
Thermal Energy Consumption
Majority of thermal energy used across all sectors in Kisumu is generated from wood fuel, fuel
oil, agricultural residues and other oil products. Over 87 percent of households in the County rely
on traditional use of biomass for cooking. The use of firewood, charcoal and paraffin for cooking
is prevalent in the County at 58.2 percent, 29.3 percent and 7.1 percent respectively.
Solar Energy Access
Kisumu County receives an estimated 5 kWh/m2 per day of solar energy throughout the year.
This has made it possible to use solar energy in the County’s energy mix. Access to solar energy
within the County is mainly segmented into three tiers: commercial application solar systems
(which make up three quarters of the current installed capacity), off-grid solar power systems
(powering markets, health centers and other social amenities) and solar house systems
(distributed to schools and community social organizations).
Biogas Energy Access
Wood fuel is the key source of energy for rural households. This has a major impact on
sustainable development for the County at large hence the need for biogas as an alternative
source of energy. Five biogas plants were installed by the County as pilot projects. Three sugar
companies also use biogases for electricity generation to meet their own cumulative demand of
20.2MW.
Table 14: Renewable Energy Projects in the Seven Sub-counties
SUB-COUNTY
CATEGORY OF
RENEWABLE ENERGY
Muhoroni Nyakach Kisumu
Central
Kisumu
West
Kisumu
East
Seme Nyando
Solar Street Lights Centers
(Markets, schools and health
facilities)
6 2 7 5 4 4 4
Integrated solar power box 0 0 0 1 0 0 0
Solar powered water distribution 0 0 0 1 0 0 0
Off-grid solar power solutions 0 0 0 1 0 0 0
Solar power coolers 1 0 0 1 0 1 2
Domestic biogas plants 1 0 0 1 0 1 2
School hub solar equipment 1 1 1 1 1 0 0
Source: Department of Energy CGK (2018)

21 Kisumu County Integrated Development Plan | 2018 – 2022
1.8 Land and Land Use
1.8.1 Land ownership categories/ classification
Land is the most important natural resource that the county is endowed with. It is critical to
economic, social, political and cultural development. It is also considered as the principal source
of livelihood and material wealth by playing host to natural resources. Secure access to land,
sustainable land use planning and equitable distribution of land remain immensely important for
food and nutrition security, attraction of foreign investors, employment and growth of industries
and generally the socio-economic development of the county. Approximately 50 percent of the
county’s land surface is grossly underutilized with sparse or no development especially in rural
areas. In addition, most of the land in the county has not been registered which hinders people
from asserting their rights over land.
1.8.2 Mean holding size
The mean land holding size in the county is 1.6 acres while the mean agricultural parcel is 1.0
acres. The population is predominantly rural with those living in rural areas depending entirely
on land as the natural resource for subsistence and economic purposes. Due to population
pressure, the small parcels of land continue to be subdivided into uneconomical sizes. Securing
and repossession of public lands which have been illegally occupied by private developers will
enable the county put them back to their original use.
1.8.3 Percentage of land with title deeds
The percentage of land with title deeds is 61.3 per cent. The land in the county is largely owned
by individuals (78.8 per cent), 10.7 per cent of it is rented or leased, 4.9 per cent clan/family
owned and 0.4 per cent is communally owned. Others are owned by the various local authorities
now the County government.
1.8.4 Settlement patterns
The rapid population growth and urbanization trends coupled with low investment in
infrastructure and basic service expansion has resulted into enormous pressure on the urban
housing and is expected to adversely affect allocation and utilization of resources, environmental
degradation and availability to social amenities. The urban development challenges include:
water, sanitation, shelter, energy and electricity, transportation and infrastructure, market
infrastructure, solid and liquid waste management, citizen safety and security.

22 Kisumu County Integrated Development Plan | 2018 – 2022
The proportion of those residing in urban areas within the county accounts for 50.30 percent of
the total population. 40 percent of these urban dwellers reside in the informal settlements of
Nyalenda “A” and “B”, Manyatta “A” and “B” and Obunga. The land tenure system within these
informal settlements is free-hold. Other dilapidated estates which require complete
redevelopment include Okore, Argwings Kodhek, Arina, Lumumba, Ondiek, Mosque, Kibuye,
Pembe Tatu, Kaloleni and Nubian.
Plate 4 : Obunga Informal settlement in Railways ward
Emerging Urban Centres
Maseno Town is located along the Kisumu- Busia highway, approximately 25 kilometres
Northwest of Kisumu City. It is an educational centre which hosts a number of Educational
Institutions including Maseno University, Maseno School, Maseno Nursing school among
others. The town’s estimated population stood at 3,301 persons in the Kenya National Housing
and Population Census (2009) although the town hosts a larger population due to the number of
students in these institutions throughout the year.
Ahero Town is located along the Kisumu-Kericho highway, 25 kilometres East of Kisumu City.
It is an emerging Agribusiness hub served with efficiecint road network connecting major towns
and attracting cross-border trade. River Nyando flows through Ahero town and is used to irrigate
the large rice fields. It has an urban population of 8,575 persons as per the Kenya National
Housing and Population Census (2009).

23 Kisumu County Integrated Development Plan | 2018 – 2022
Katito Town is located along Kisumu- Kisii and Kisumu- Homabay highways. It is basically a
trading centre with emerging population and infrastructure development.
Muhoroni is an agro-based town hosting Muhoroni Sugar Mill, Agrochemicals and Food
Company among others. The town also serves as an administrative centre. Its population stood at
14,806 persons in the 2009 Kenya National Housing and Population Census. It is served with a
Railway Station along the Nairobi-Kisumu Railway. It is located 50 kilometres East of Kisumu
City.
1.8.5 County Spatial Map
The need for the County Spatial Plan is recommended under agriculture, manufacturing,
urbanization and environmental management which are a priority to the County. The County
Spatial Plan will consider land ownership, land use and control, land acquisition, land allocation
and provisions for major land development schemes held by national government, government
corporations or by individuals under freehold ownership for closer coordination that is often
lacking.
1.9 Labour and Employment
An efficient, motivated and healthy human resource base is pivotal for enhanced County
competitiveness, economic growth and development. The Constitution advocates for decent
work where freely chosen productive employment is promoted simultaneously with fundamental
rights at work, adequate income from work, representation and social security. In Kisumu
County, the informal sector cutting across retail and wholesale trade, industry, transport,
agriculture and extraction of minerals employ approximately more than 60 percent of those in
gainful employment.

24 Kisumu County Integrated Development Plan | 2018 – 2022
1.10 Irrigation
Irrigation infrastructure and schemes
There are two irrigation systems in the County namely; pump fed systems in National Irrigation
Board schemes covering 4,162 Ha and gravity fed systems in small holder farmer owned
schemes covering 6,042 Ha against the potential of 14,309 Ha in rice growing areas only. The
County is well endowed with water bodies such as Lake Victoria and permanent rivers such as
Sondu/Miriu, Awach-Kano, Nyando, Oroba/Ombeyi, Kibos, Awach-Seme, Kisian, and Mugru
which can be harnessed for gravity fed irrigation purposes to enhance self-employment and
economic development.
Plate 5: Boda-Boda Riders in
obunga Kisumu
Plate 6: Juakali Artisan Kisumu

25 Kisumu County Integrated Development Plan | 2018 – 2022
Plate 7: R. Nyando used for irrigating the rice fields in Ahero
1.11 Crop, Livestock, Fish Production and Value addition
1.11.1 Acreage under food and cash crops
The County’s performance in this sector has been dismal despite its suitable ecological and
climatic conditions for the production of cotton, sugarcane, rice and horticulture. The County’s
total area under food crop (maize, beans, rice, sorghum, green grams, sweet potatoes, cassava,
tomatoes, cowpeas, kales and groundnuts) is estimated at 107,335 Ha with 3,443 Ha under
horticulture during the long rains and 5,985 Ha under rice production. Area under cash crops is
approximately 45,309 Ha with sugarcane covering the largest area at 44,988 Ha. Sugarcane
growing is majorly done in Muhoroni Sub-County covering approximately 43,700 Ha and
employing 14,585 farmers directly.

26 Kisumu County Integrated Development Plan | 2018 – 2022
Plate 8: Sugarcane plantation in Muhoroni
1.11.2 Main storage facilities
Farmers in the County mainly utilize two types of storage: on farm and off farm storage. Most
farmers store their produce in gunny bags inside their houses. Off-farm storage is mainly
through the National Cereals and Produce Board Silos in Kisumu and Muhoroni Sub- counties.
The Lake Basin Development Authority and The National Irrigation Board offers storage
facility for rice produced.
1.11.3 Livestock and Veterinary Services
Main livestock breed in the County include dairy cattle, beef cattle, pigs, goats, sheep, poultry,
rabbits and bee keeping. A large number of dairy animals are found in the higher and cooler parts
of the County, which are mainly found in Kisumu West, Muhoroni and Nyakach Sub-Counties.
The most common dairy cattle breeds found in the County include Ayrshire, Friesian, Guernsey
and their crosses. The County also has large number of indigenous cattle breeds with low
productivity mostly occasioned by in-breeding and poor husbandry. Breeding services are costly
to the average farmer who resorts to use of communal bulls for breeding as opposed to use of
artificial insemination using superior bull semen. Leather development activities in the County

27 Kisumu County Integrated Development Plan | 2018 – 2022
are hampered by lack of skilled flayers, inadequate number of flaying knives, poor curing and
storage facilities. This affects quality and prices of leather
In the County, red meat is sourced from cattle, goats and sheep with the populous Zebu breed
being the primary source of beef in the County. The small East African meat goat, chevon, breed
dominates the County while sheep rearing, a source of mutton, is very popular in the local
community. Most sheep are predominantly cross breed between the red Maasai, Black head
Persian (Somali) and the Dorper sheep breeds.
Chicken production, which is one of the most important economic activities for small scale
farmers in the County, is either reared in subsistence or commercial systems of production for
white meat and eggs.
Despite production potential with varied animal species in the County, livestock sector is riddled
with low productivity due to animal diseases, farmers keeping animals of poor genetic material,
poor (traditional) farming methods and changing climate, among other factors. Animal diseases
affect the productivity and welfare of affected animals in the county. Among the diseases that
cause losses to farmers include Foot and Mouth Disease (FMD), East Coast Fever (ECF), Black
Quarter and Mastitis. Zoonotic diseases like Rabies kill animals and require expensive
management whenever human beings are affected. Food-borne infections like helminthiasis
cause economic losses to humans in form of lost man-hours, treatment and condemnation of
affected organs during meat inspection.
1.11.4 Agricultural extension, training, research and information services
The County hosts Maseno Agricultural Training Center which serves as training centre for
farmers and those interested in farming entreprises. The Training Centre has a multiplication
|centre, agro-processing unit and Demonstration plots for various Agricultural entreprises. Kenya
Agriculture and Livestock Research Organization (KALRO) also has Demonstration plots for
various Agricultural and Livestock produce.

28 Kisumu County Integrated Development Plan | 2018 – 2022
Plate9: Banana Demonstration plot (Maseno ATC)
Plate 10: Pineapple and Maize demonstration plot, Livestock at Maseno ATC for research, and
Green house& isolated demonstrations (Maseno ATC)

29 Kisumu County Integrated Development Plan | 2018 – 2022
1.11.5 Apiculture (bee keeping)
Apart from livestock, the County is rich in wild bee colonies which provide immense potential
for bee keeping and honey production.
1.12 Mining and extraction.
Kisumu County is rich in mining and extraction activities (Quarry, sand harvesting, cement etc.)
used in the construction industry ranging from sand harvested along river banks, Murram in
Kanyakwar and Nyakach; ballast in Kajulu, Kisumu West and Nyakach and lime in Koru.
Plate 11: Cement production industry in Awasi Onjiko ward
1.13 Tourism and Wildlife
Main tourist and wildlife attractions
Kisumu County has unique features such as the shoreline of Lake Victoria, Kit Mikayi, Ndere,
Island National Park, and Impala Park among others which collectively make Kisumu a major
tourist destination. , abundant hospitality industry with excellent conference facilities ranging
from the Grand Royal Swiss Hotel, situated in a serene environment of Riat hills providing a
clear aerial view of the City, Acacia Hotel within the Central Business District, Impala & Jambo
Safari Eco-lodge, Kiboko Bay on the shores of L. Victoria for hippo watching, Sunset Hotel to
Lwang’ni Beach chain of hotels where the Luo cuisine is enjoyed.

30 Kisumu County Integrated Development Plan | 2018 – 2022
Table 15: Major Hotels
Hotel Classification Bed Capacity
Standard
Rms
Deluxe
Rms
Suites Executive Presidential No.
of
Beds
The Grand
Royal Swiss
48 40 19 17 1
Acacia 46 42 4 1
Imperial 3 Star 19 26 3 30 90
Imperial
express
55
Wigot 10 13 7 7 1
The VIC 3 Star 24 48 8 2 24 122
Sunset Hotel 2 Star 50 100
Sovereign 3 Star 34 1
Kisumu Hotel 3 Star 39 37 3 3 1
Le Savanna 2 Star 32 79 2 23 0
Pinecone 25 6 30
Jumuiya 14 40 8
Jambo Impala
Eco Lodge
3 Star 12 24
St. John
Manor
2 Star 49 49
Dew Church 1 Star 13 16
Others
Source: Tourism Regulatory Authority Kisumu County.
The County’s total bed capacity for registered accommodation facilities is 3,500.
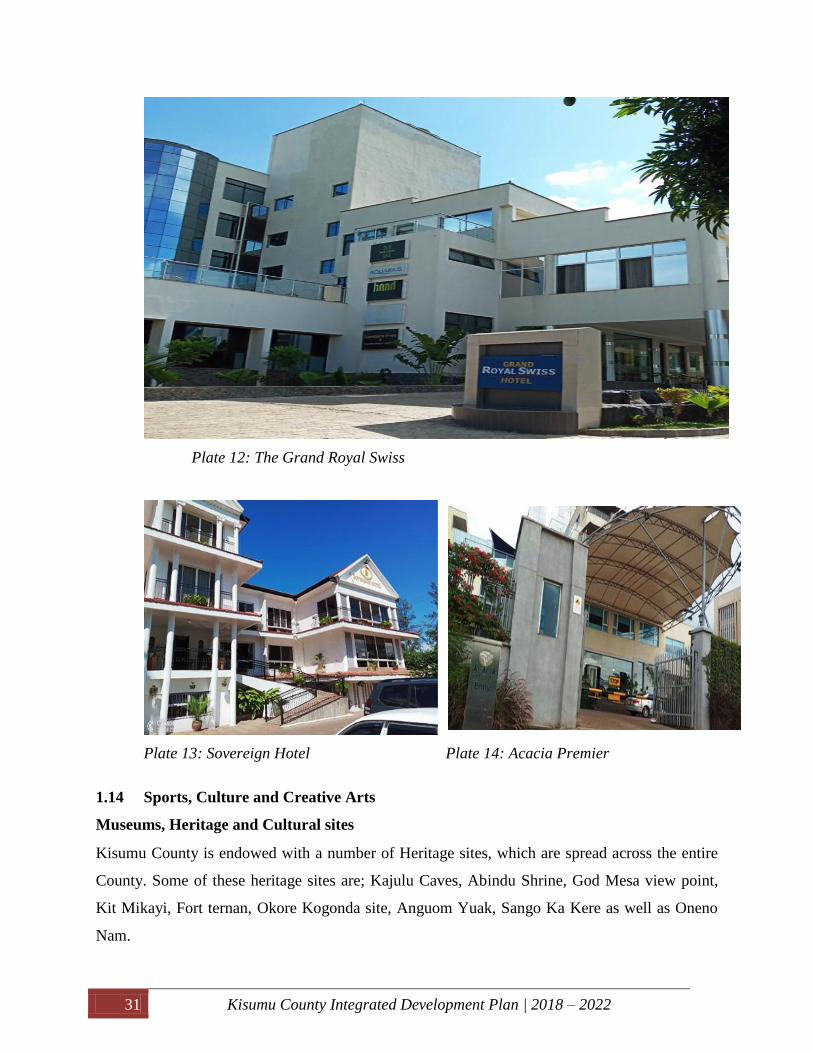
31 Kisumu County Integrated Development Plan | 2018 – 2022
Plate 12: The Grand Royal Swiss
Plate 13: Sovereign Hotel Plate 14: Acacia Premier
1.14 Sports, Culture and Creative Arts
Museums, Heritage and Cultural sites
Kisumu County is endowed with a number of Heritage sites, which are spread across the entire
County. Some of these heritage sites are; Kajulu Caves, Abindu Shrine, God Mesa view point,
Kit Mikayi, Fort ternan, Okore Kogonda site, Anguom Yuak, Sango Ka Kere as well as Oneno
Nam.

32 Kisumu County Integrated Development Plan | 2018 – 2022
1.15 Industry and Trade
1.15.1 Trade
The trade sector has been identified as one of the key engines of the economy due to its immense
contribution to the Kenya’s GDP and employment creation through trade and investments.
Plate 15: Grains Retail section at Jubilee Municipal Market
1.15.2 Micro, Small and Medium Entrepreneurs
The Micro, Small and Medium Entrepreneurs are major drivers of economy despite the various
challenges they face that impede their growth and development. These include: inability of small
firms to enjoy economies of scale; limited access to credit facilities; small talent pool and
inadequate marketing structures/infrastructure. Majority of MSMEs operate from temporary
business premises/work on road reserves.
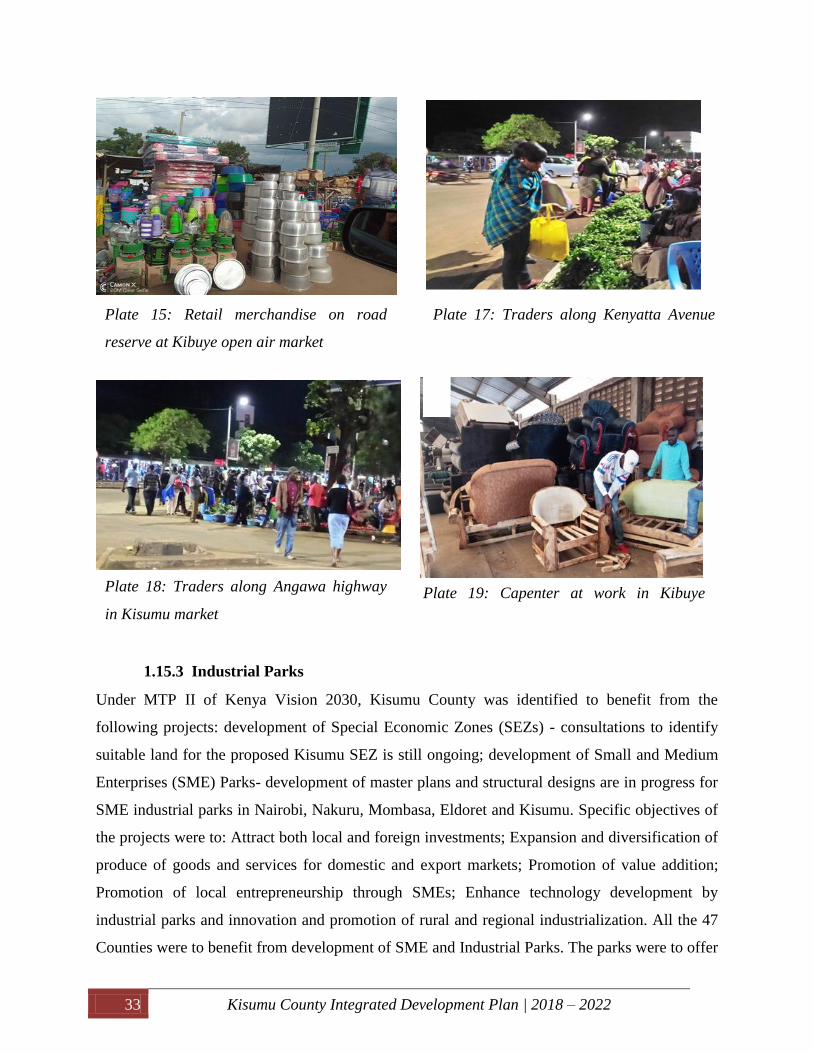
33 Kisumu County Integrated Development Plan | 2018 – 2022
1.15.3 Industrial Parks
Under MTP II of Kenya Vision 2030, Kisumu County was identified to benefit from the
following projects: development of Special Economic Zones (SEZs) - consultations to identify
suitable land for the proposed Kisumu SEZ is still ongoing; development of Small and Medium
Enterprises (SME) Parks- development of master plans and structural designs are in progress for
SME industrial parks in Nairobi, Nakuru, Mombasa, Eldoret and Kisumu. Specific objectives of
the projects were to: Attract both local and foreign investments; Expansion and diversification of
produce of goods and services for domestic and export markets; Promotion of value addition;
Promotion of local entrepreneurship through SMEs; Enhance technology development by
industrial parks and innovation and promotion of rural and regional industrialization. All the 47
Counties were to benefit from development of SME and Industrial Parks. The parks were to offer
Plate 15: Retail merchandise on road
reserve at Kibuye open air market
Plate 17: Traders along Kenyatta Avenue
in Kisumu
Plate 18: Traders along Angawa highway
in Kisumu market
Plate 19: Capenter at work in Kibuye
Market Kisumu

34 Kisumu County Integrated Development Plan | 2018 – 2022
infrastructure and shared resources such as power supply exploiting, comparative advantages of
local resources, telecommunication hubs, management offices and internal transportation, all of
which were not implemented.
Plate 20: Jua kali sector in Kibuye Open Air Market
1.15.4 Industries
Agro and food-based Industries:
The County has three State-owned Sugar Milling Factories; Chemelil, Muhoroni and Miwani
riddled with heavy debt burden, mismanagement and obsolete machineries and one privately-
owned; Kibos. An Agro-chemicals food processing plant in Muhoroni. Kenya Breweries is set to
re-open its Kisumu-based plant providing an opportunity to Sorghum farmers to invest in
sorghum production to sustain the demand for the industry. The County has suitable climatic
and ecological conditions for sorghum production. Contrary, KICOMI has since remained
dormant despite the favourable agro-ecological conditions for quality cotton production. In
addition, the fish processing industry has remained dormant despite the existance of the second
largest fresh water lake in the world; L. Victoria.
Huge potential also exists in horticulture production and processing, given agro- ecological
conditions, however this remains unexploited. The County hosts Kisumu bottlers which
processes, bottles, sales and distributes Coca cola products in the entire Western region. There
are also numerous water bottling factories spread across the County.
Construction- based Industries:
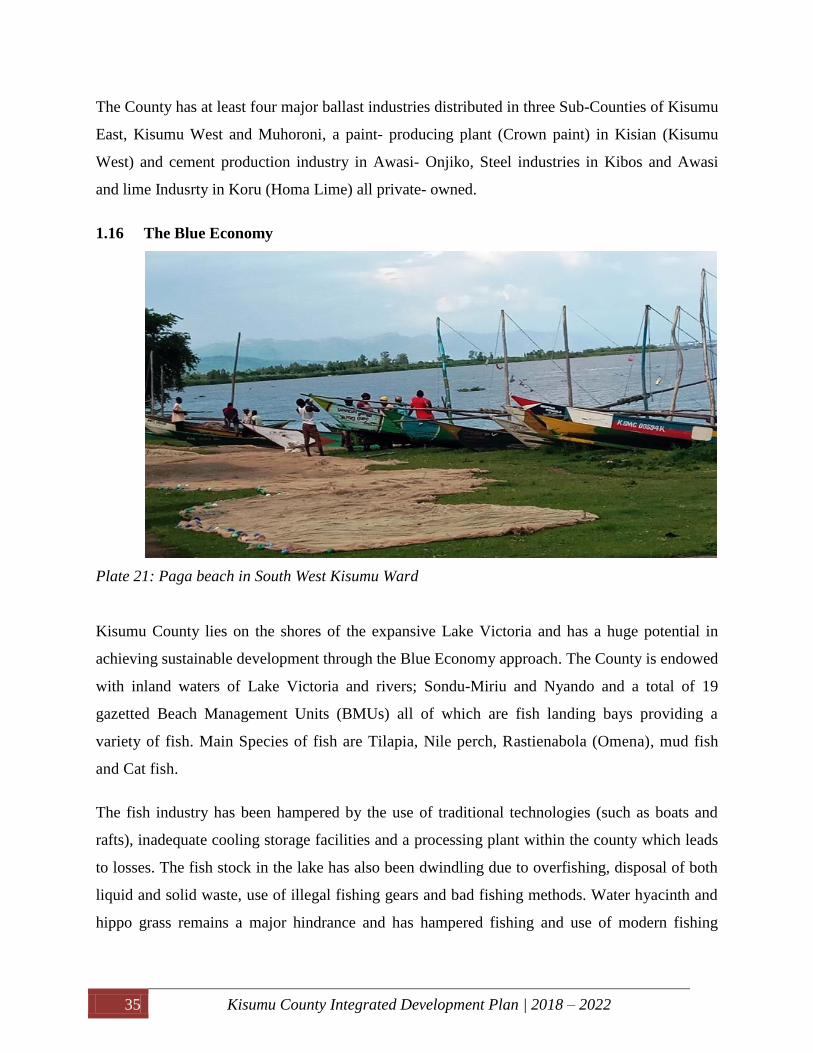
35 Kisumu County Integrated Development Plan | 2018 – 2022
The County has at least four major ballast industries distributed in three Sub-Counties of Kisumu
East, Kisumu West and Muhoroni, a paint- producing plant (Crown paint) in Kisian (Kisumu
West) and cement production industry in Awasi- Onjiko, Steel industries in Kibos and Awasi
and lime Indusrty in Koru (Homa Lime) all private- owned.
1.16 The Blue Economy
Plate 21: Paga beach in South West Kisumu Ward
Kisumu County lies on the shores of the expansive Lake Victoria and has a huge potential in
achieving sustainable development through the Blue Economy approach. The County is endowed
with inland waters of Lake Victoria and rivers; Sondu-Miriu and Nyando and a total of 19
gazetted Beach Management Units (BMUs) all of which are fish landing bays providing a
variety of fish. Main Species of fish are Tilapia, Nile perch, Rastienabola (Omena), mud fish
and Cat fish.
The fish industry has been hampered by the use of traditional technologies (such as boats and
rafts), inadequate cooling storage facilities and a processing plant within the county which leads
to losses. The fish stock in the lake has also been dwindling due to overfishing, disposal of both
liquid and solid waste, use of illegal fishing gears and bad fishing methods. Water hyacinth and
hippo grass remains a major hindrance and has hampered fishing and use of modern fishing

36 Kisumu County Integrated Development Plan | 2018 – 2022
methods in the lake. Fish processing companies have also scaled down their operations due to
low fish stocks from the lake and instead opting to import fish.
1.17 Forestry, Agro Forestry and Value addition Forest Resources:
Less than 1 percent tree cover exists in Kisumu County which is short of the constitutional
requirement of at least 10% of land cover. The County has two gazetted Forest lands; Koguta
and Karateng’ which measure approximately 400 and 25 hectares respectively. Farm forestry and
commercial forestry are lowly adopted in Kisumu County.
1.18 Financial services
The County hosts a branch of the Central Bank of Kenya and is served with several commercial
banks all situated within the Kisumu Central Business District, many Micro-finance institutions,
Agency banking services and SACCOs.
Table 16: Distribution of Commercial banks within the County
Name of Commercial Bank No of Branches
ABC Bank 1
Bank of Baroda 1
Barclays 1
CfC Stanbic 1
Commercial Bank of Africa 1
Co-operative Bank 3
Credit Bank 1
Diamond Trust Bank 2
Eco- Bank 2
Equity Bank 3
Family Bank 2
First Community Bank 1
Giro Bank 1
Guardian Bank 1
I&M 1
Kenya Commercial Bank 3 and 1 in Muhoroni Sub-County
National Bank of Kenya 1
NIC 1
Paramount Bank 1

37 Kisumu County Integrated Development Plan | 2018 – 2022
Prime Bank 1
Post Bank 1
Standard Chartered Bank 1
Spire Bank 1
Source: Department of Economic Planning CGK (2018)
1.19 Environment and Climate Change
1.19.1 Degradation of natural resources: Amongst the threatened natural resources in
Kisumu County is the L. Victoria and the wetlands. Other threatened resources include land
(murram, sand, soils and ballast), flora and fauna. Water sources are also increasingly under
threat from discharge of raw sewer and industrial waste, deforestation, point and non-point
source of pollution.
1.19.2 Noise and air pollution: Particulate air pollution from industrial process exists in
the County. Increased production activities introduce carbon compounds and green house gases
which contribute to climate change. Increased noise pollution from entertainment spots, outdoor
advertising and community social and religious gatherings are in the County, threatening the
peaceful and ambient environment.
Plate 22: Degraded land due to
murram extraction in Kanyakwar
Plate 23: Car washing in L. Victoria -
Lwangni beach
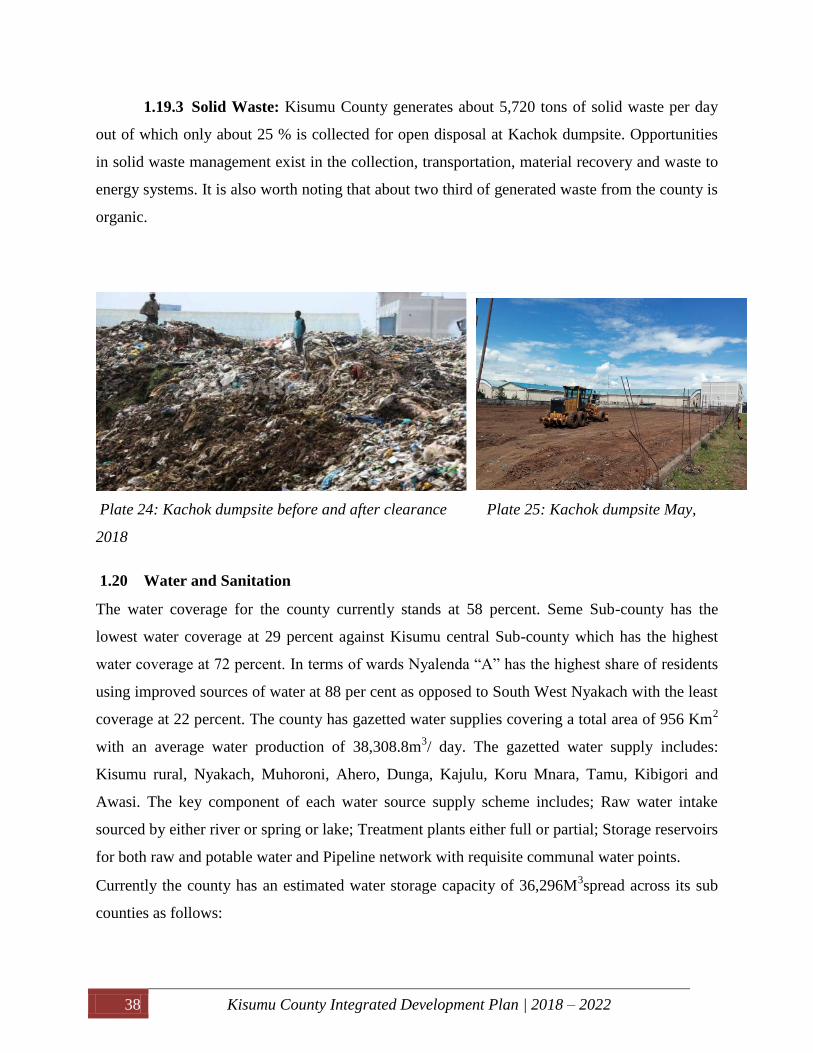
38 Kisumu County Integrated Development Plan | 2018 – 2022
1.19.3 Solid Waste: Kisumu County generates about 5,720 tons of solid waste per day
out of which only about 25 % is collected for open disposal at Kachok dumpsite. Opportunities
in solid waste management exist in the collection, transportation, material recovery and waste to
energy systems. It is also worth noting that about two third of generated waste from the county is
organic.
Plate 24: Kachok dumpsite before and after clearance Plate 25: Kachok dumpsite May,
2018
1.20 Water and Sanitation
The water coverage for the county currently stands at 58 percent. Seme Sub-county has the
lowest water coverage at 29 percent against Kisumu central Sub-county which has the highest
water coverage at 72 percent. In terms of wards Nyalenda “A” has the highest share of residents
using improved sources of water at 88 per cent as opposed to South West Nyakach with the least
coverage at 22 percent. The county has gazetted water supplies covering a total area of 956 Km2
with an average water production of 38,308.8m3/ day. The gazetted water supply includes:
Kisumu rural, Nyakach, Muhoroni, Ahero, Dunga, Kajulu, Koru Mnara, Tamu, Kibigori and
Awasi. The key component of each water source supply scheme includes; Raw water intake
sourced by either river or spring or lake; Treatment plants either full or partial; Storage reservoirs
for both raw and potable water and Pipeline network with requisite communal water points.
Currently the county has an estimated water storage capacity of 36,296M3spread across its sub
counties as follows:

39 Kisumu County Integrated Development Plan | 2018 – 2022
Table 17: Water Coverage and storage capacity
Sub-County Current Storage
Capacity available in M3
Required Storage
Capacity M3/ Day
Deficit/Surplus storage
capacity in M3/ Day
A) Urban
Kisumu East 30,454 5,328.25 -
Kisumu Central - 5,994.35 -19,131.4
Sub total (Urban) 30,454 11,322.6 -19,131.4
B) Rural
Seme 850 3,506.8 2,656.80
Kisumu West 975 4,658.2 3,683.20
Muhoroni 197 5,173.45 4,976.45
Nyando 120 5,005.71 4,885.71
Nyakach 3,700 4,721.91 1,021.91
Sub-total (Rural) 5842 23,066.13 17,224.07
TOTAL 36,296 34,388.273 17,224.07
Source: Department of Water, Irrigation, Environment and Natural Resources
1.21 Health Access and Nutrition
1.21.1 Disease Burden of Kisumu County
Malaria remains the leading cause of morbidity in all age groups despite interventions put in
place such as testing (microscopy and RDTs) and provision of LLINs. The top 5 causes of
morbidity in Kisumu in all age groups are malaria, upper respiratory tract infection, diarrhea,
diseases of the skin and other diseases of the respiratory system. Similar causes of morbidity are
noted at the national level over the same period for the age groups. Table 4 provides the top ten
causes of morbidity in Kisumu County for population below and above 5 years.
Table 18: Top Ten Causes of Morbidity in Kisumu County
<5 years >5 years
Kisumu County National Kisumu County National
1. Confirmed Malaria Upper Respiratory Tract
Infections
Confirmed Malaria Upper Respiratory Tract
Infections
2. Upper Respiratory Tract
Infections
Other diseases of Respiratory
System
Upper Respiratory Tract
Infections
Confirmed Malaria
3. Diarrhea Confirmed Malaria Diseases of the skin Diseases of the skin

40 Kisumu County Integrated Development Plan | 2018 – 2022
4. Other diseases of
Respiratory System
Diarrhea Other diseases of
Respiratory System
Other diseases of Respiratory
System
5. Diseases of the skin Diseases of the skin Typhoid fever Urinary Tract Infection
6. Fevers Pneumonia Diarrhea Arthritis, Joint pains etc.
7. Pneumonia Fevers Fevers Diarrhea
8. Ear Infections/Conditions Eye Infections Urinary Tract Infection Hypertension
9. Eye Infections Tonsillitis Arthritis, Joint pains Pneumonia
10. Urinary Tract Infection Intestinal worms Hypertension Intestinal worms
Source: Department of Health and Sanitation CGK (2018)
1.21.2 The Community Units
The community strategy’s main goal is to increase community access to healthcare so as to
improve community productivity, decrease poverty as well as child and maternal deaths.
Investment in community strategy has yielded 193 community units, of which 158 are fully
functional. The community health services are designed for each Community Unit (CU) to be
attached to a link facility. This is in order for the Community Health Volunteers (CHVs) to seek
technical guidance from trained health professionals and also refer their community members to
a health facility for ailments that cannot be managed at home. Each community unit serves a
population of approximately 5,000 people although households and area of coverage informs the
distribution of CUs. Each CU is covered by not less than 10 community health volunteers
(CHVs). Currently partners cater for stipends for 30% of the CHVs. In the Kisumu County
Health Sector Strategic Investment Plan II (KCHSSIP) (2018-2023), the County has committed
to provide stipends and National Health Insurance Fund (NHIF) cover to all CHVs. Legislation
on the CHVs compensation needs to be considered for sustainability. Table 7 below, provides the
distribution of community units by sub-county and their functionality.
Table 19: Distribution of community units by Sub-County in Kisumu County
Sub-county Estimated
population
Density (2018)
Expected
Community
Units
Established
Community Units
Functional
Community
Units
Gaps
Nyakach 160,440 45 39 32 6
Nyando 170,082 41 36 30 5
Muhoroni 169,925 38 26 18 12
Kisumu Central 204,028 25 19 14 6

41 Kisumu County Integrated Development Plan | 2018 – 2022
Kisumu East 181,356 29 21 18 8
Kisumu West 158,275 30 24 22 6
Seme 119,153 32 28 24 4
Total 1,163,260 240 193 158 47
Source: Department of Health and Sanitation CGK (2018)
1.21.3 Level II to level IV Facilities
In 2013, the county had 20 hospitals and 149 primary health care facilities (level II and III). The
county invested immensely in construction and renovation of health facilities resulting to 34
hospitals and 176 primary health care facilities. In KCHSSIP II, the county will invest in
completion and improving the functionality of the existing health facilities to meet the required
standards. Table 8, below provides the number of facilities by ownership and level of care.
Plate 26: Kisumu County Level IV Hospital, from top left the Entrance, Male general ward, ENT
clinic and Out-Patient

42 Kisumu County Integrated Development Plan | 2018 – 2022
Table 20: Summary of Registered Facilities in Kisumu County by Type and ownership
Facility type Public %Public FBOs %FBOs NGOs %NGOs Private %Private Total
Hospital 21 62% 4 12% 0 0% 9 26% 34
Nursing/Maternit
y homes
0 0% 0 0% 0 0% 8 100% 8
Health Centers 35 78% 6 13% 1 2% 3 7% 45
Dispensaries 69 73% 4 4% 7 7% 14 15% 94
Clinics 0 0% 1 3% 9 31% 19 66% 29
Totals 125 60% 15 7% 17 8% 53 25% 210
Source: Department of Health and Sanitation CGK (2018)
1.21.4 Human Resource for Health
The Human Resources for Health (HRH) investment area relates to availability of appropriate
and equitably distributed health care workers, quality training relevant for the market
requirements, safe and secure working environment for attraction and retention of required
health workers, improving of institutional and health worker performance.
A National HRH personneling norm has been defined for each level, to outline the minimum
health workers, by cadre, needed to assure provision of health care. The norms only define the
minimum that the sector will work towards ensuring equitable distribution of human resources
for health. The optimum personneling shall be defined for each facility, based on its actual
workload.
In Kisumu County, currently the Doctor to population ratio is 1: 44,634 and Nurse to population
ratio is 1: 2,383 against the recommended WHO standard Doctor or nurse Population ratio of
1:435. A comprehensive approach, supported by strong County and national leadership,
governance and information systems, is needed to ensure skilled and motivated health care
workers are deployed in the right place. Performance needs and training needs assessments need
to be conducted to address imbalances.
During the period of the Kisumu County HSSIP, the sector efforts shall be geared towards
ensuring the shortage of health professionals are addressed through creating an optimal size of
health workforce with the right and balanced skills, equitably distributed, productive and
delivering quality health services for the realization of the targeted health outcomes.
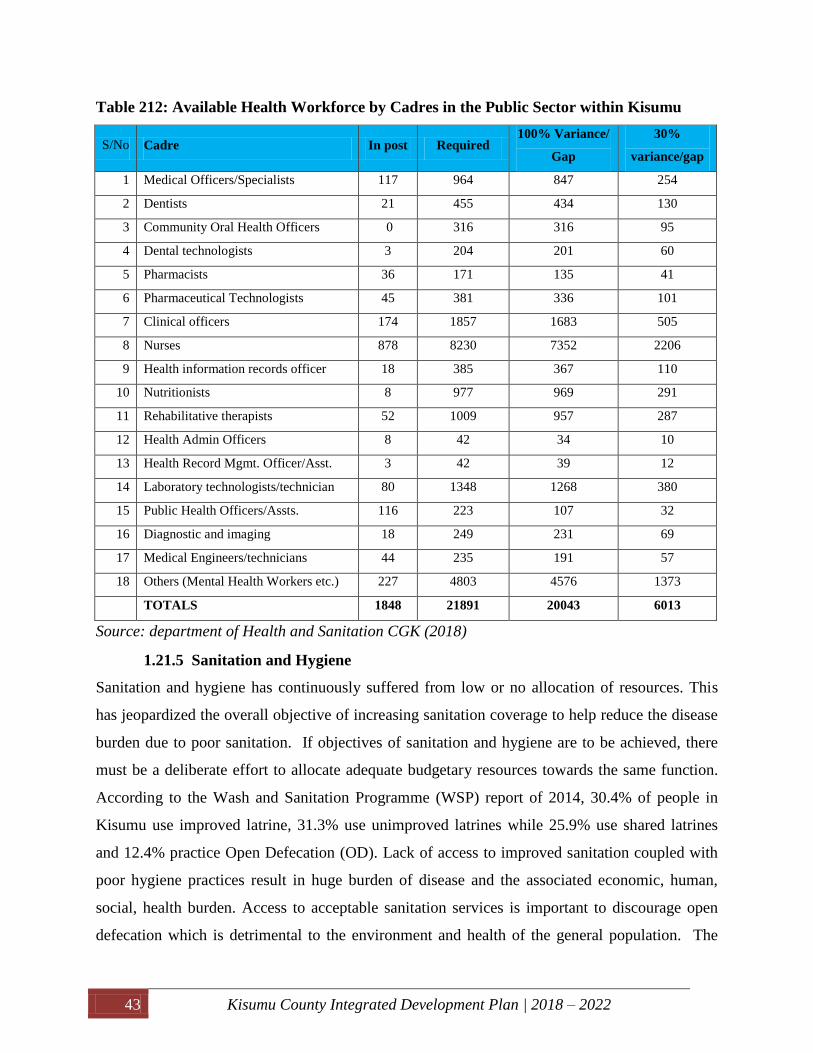
43 Kisumu County Integrated Development Plan | 2018 – 2022
Table 212: Available Health Workforce by Cadres in the Public Sector within Kisumu
S/No Cadre In post Required 100% Variance/
Gap
30%
variance/gap
1 Medical Officers/Specialists 117 964 847 254
2 Dentists 21 455 434 130
3 Community Oral Health Officers 0 316 316 95
4 Dental technologists 3 204 201 60
5 Pharmacists 36 171 135 41
6 Pharmaceutical Technologists 45 381 336 101
7 Clinical officers 174 1857 1683 505
8 Nurses 878 8230 7352 2206
9 Health information records officer 18 385 367 110
10 Nutritionists 8 977 969 291
11 Rehabilitative therapists 52 1009 957 287
12 Health Admin Officers 8 42 34 10
13 Health Record Mgmt. Officer/Asst. 3 42 39 12
14 Laboratory technologists/technician 80 1348 1268 380
15 Public Health Officers/Assts. 116 223 107 32
16 Diagnostic and imaging 18 249 231 69
17 Medical Engineers/technicians 44 235 191 57
18 Others (Mental Health Workers etc.) 227 4803 4576 1373
TOTALS 1848 21891 20043 6013
Source: department of Health and Sanitation CGK (2018)
1.21.5 Sanitation and Hygiene
Sanitation and hygiene has continuously suffered from low or no allocation of resources. This
has jeopardized the overall objective of increasing sanitation coverage to help reduce the disease
burden due to poor sanitation. If objectives of sanitation and hygiene are to be achieved, there
must be a deliberate effort to allocate adequate budgetary resources towards the same function.
According to the Wash and Sanitation Programme (WSP) report of 2014, 30.4% of people in
Kisumu use improved latrine, 31.3% use unimproved latrines while 25.9% use shared latrines
and 12.4% practice Open Defecation (OD). Lack of access to improved sanitation coupled with
poor hygiene practices result in huge burden of disease and the associated economic, human,
social, health burden. Access to acceptable sanitation services is important to discourage open
defecation which is detrimental to the environment and health of the general population. The
44 Kisumu County Integrated Development Plan | 2018 – 2022
costs incurred as a result of dealing with ailments related to poor sanitation are a major burden
on the people of Kisumu County.
The low sanitation coverage is also a major challenge in schools especially primary and early
Childhood Development Centers within Kisumu County. Most of the latrines in these institutions
are dilapidated and in poor state of repair. Coverage for primary school sanitation facilities in
functional condition is 85.83% due to of lack of maintenance. A School WASH analysis
conducted by SANA/UNICEF in 2016 established the latrine ratio for girls in Kisumu County
was 1:67 against the recommended ratio of 1:25 while the latrine ratio for boys was 1:73 against
the recommended ratio of 1:30.
1.21.6 Health Information System
Health information involves data collected systematically from service delivery points to inform
Sub-County, county and national level decision-making regarding key public health interests.
The objective is so that such data may enable health managers and decision-makers to plan and
carry out timely response to gaps in health performance and leading causes of illness, death and
disability. The sector relies on District Health Information System (DHIS), Supplementary
reporting System, Integrated Disease Surveillance and Response (IDSR), Maternal and Perinatal
Death Surveillance and Response (MPDRS). The County Reproductive Health Coordinator and
the Sub-County Reproductive Health Coordinators work with the County and Sub-County
Surveillance Officers in health facilities to ensure that the Kisumu County MPDSR guidelines
are followed through to the later. This is to ensure no maternal and perinatal deaths which occur
within and without the facilities go unnoticed. All deaths must be reviewed according to the
guidelines and action taken.
Unfortunately, there are limited health investments with regard to health information that have
been planned for to enhance management of health information. This is devoid of findings on
most surveys connected to minimizing exposure to health risk factors, data for deworming
campaigns, reporting systems indicators are not routinely collected at MOH and mental health
data collection tools.

45 Kisumu County Integrated Development Plan | 2018 – 2022
Table 22: Kisumu County Performance on Health Information Management
Intervention 2017-year total (actual)
1. level 2 and 3 health facilities with HRIOs as per the standard norms 0%
2. All health facilities in the County that are reporting in the DHIS 100%
3. All health facilities in the County that are reporting on a timely basis 85%
4. Private sector/ FBO/ NGO facilities that are reporting 95%
5. Public health facilities that are reporting 100%
6. Level 2 and - 3 facilities using DHIS data/ information for decision making 12%
7. Level 2 and 3 health facilities that are using electronic medical records
systems 0%
Source: Department of Health and Sanitation CGK (2018)
1.21.7 Health Products and Technologies
Despite the decentralization of procurement for essential drugs, the procurement and distribution
of most pharmaceutical and commodities for routine immunizations, HIV, TB and malaria are
managed by national level programs, i.e. Kenya Expanded Programme on Immunization (KEPI),
Kenya National AIDS & STI Control Programme (NASCOP), Kenya National Tuberculosis,
Leprosy and Lung Disease Programme (NTLD) and the Kenya National Malaria Control
Program (NMCP) respectively.
Delayed reimbursement of fund for free maternity by the national government is a potential
threat which may cause consumable shortages to ensue in the maternal health care. On the front
view the success of having children under one being fully immunized standing at 84% may be
attributed to the timeliness and optimum availability of vaccines. The blood bank constantly
conducts blood drives to ensure optimum stock and proper storage of blood as an emergency
preparedness function. In a bid to accurately project the figures of required pharmaceutical and
medical supplies, a comprehensive needs assessment should be conducted.
1.21.8 Nutrition status
Nutrition status of a population is based on the concept that the distribution of children’s weight
and height at a given age will follow a predictable statistical distribution. Three indices, Height
for Age (stunting), Weight for Age (underweight) and Weight for Height (wasting) are used to
assess nutritional well-being of children and also reflect the economic and social well-being of
the population. According to Kenya Demographic and Health Survey (KDHS), 2014, 2.2% of
children under five years in Kisumu County are wasted, 6.6% are underweight and 18% are
46 Kisumu County Integrated Development Plan | 2018 – 2022
stunted. These outcomes are closely linked to poor child feeding practices and the quality of
children’s diets. Poor nutrition among children under five is associated with long term
deprivation and poor health resulting in reduced performance productivity later in life. A
Knowledge, Attitude and Practice (KAP) survey (MoH, UNICEF 2017) showed that 76% of
children are exclusively breastfed, compared to the WHO target of 50% by 2030. This was
possible through the implementation of the Baby Friendly Community Initiative (BFCI)
supported by the County Government and partners. However, the quality of children’s diet is still
poor with less than half (44%) receiving a minimum acceptable diet according to WHO/UNICEF
standards. The KAP report further revealed that more than 80% of the children in Kisumu
County consume a diet deficient of iron rich foods, with bigger proportion comprising of grains,
roots and tubers and fruits. Less than half (43.6%) of children aged 6-59 months receive Vitamin
A capsules compared to the national average of 72% (KDHS 2014). The County has only 8
Nutrition and Dietetics Officers managing all the 124 government health facilities, which is far
below the WHO Human Resource Norms and Standards. Most facilities also lack the basic
anthropometric equipment required for assessment of nutritional status of children and mothers.
1.21.9 HIV and AIDS
HIV and AIDS still remains a burden to the County with the prevalence rate increasing from
19.3 percent in 2013 to 19.9 percent in 2016 (Kenya HIV estimates, 2015). There has a been a
slight decline in the rate of new HIV infections from 12,645 in 2013 to 9,699 in 2015, Kisumu
County is still classified among the nine high incidence Counties in the Country. Major concern
is the high incidence among the youth, adolescent and young people aged (15-24 years) that
contribute to 52 percent of all new HIV infections in the County (Kenya HIV estimates, 2015).
HIV and AIDS programmes in the County are essentially donor-supported but with the recent
elevation of the country into a middle-income bracket, donor funding has gradually reduced
hence the need for a deliberate and strategic mechanism for domestic HIV response financing.
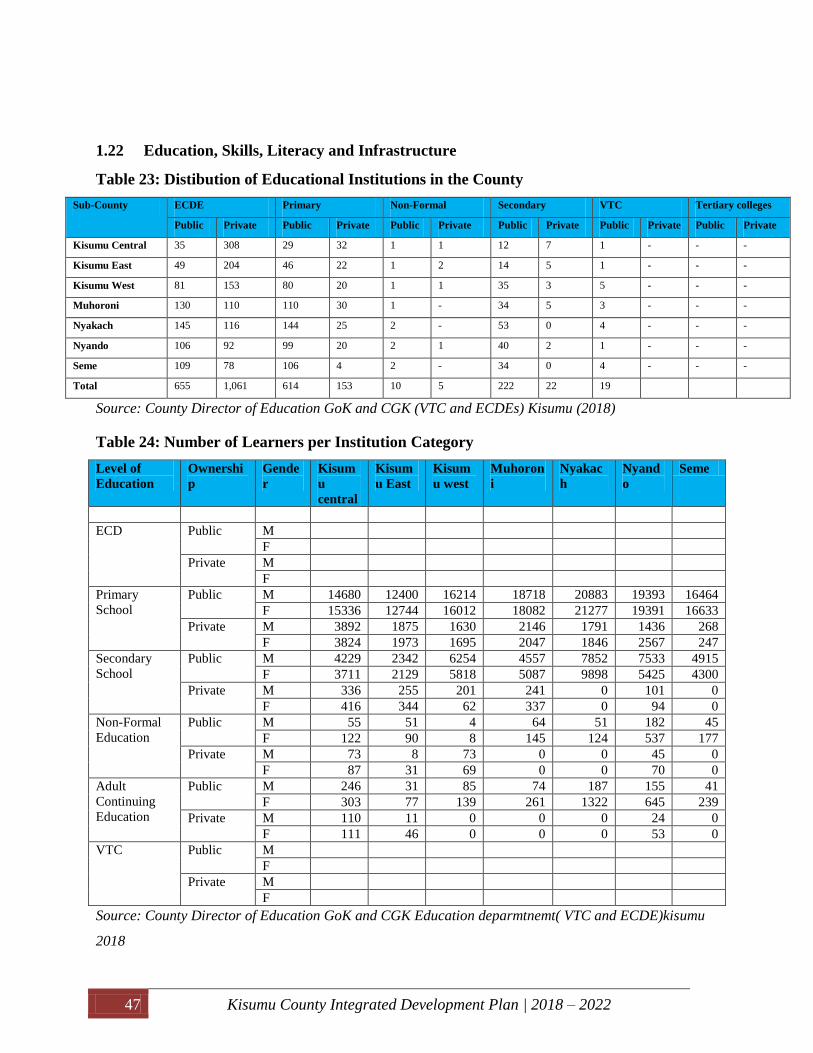
47 Kisumu County Integrated Development Plan | 2018 – 2022
1.22 Education, Skills, Literacy and Infrastructure
Table 23: Distibution of Educational Institutions in the County
Sub-County ECDE Primary Non-Formal Secondary VTC Tertiary colleges
Public Private Public Private Public Private Public Private Public Private Public Private
Kisumu Central 35 308 29 32 1 1 12 7 1 - - -
Kisumu East 49 204 46 22 1 2 14 5 1 - - -
Kisumu West 81 153 80 20 1 1 35 3 5 - - -
Muhoroni 130 110 110 30 1 - 34 5 3 - - -
Nyakach 145 116 144 25 2 - 53 0 4 - - -
Nyando 106 92 99 20 2 1 40 2 1 - - -
Seme 109 78 106 4 2 - 34 0 4 - - -
Total 655 1,061 614 153 10 5 222 22 19
Source: County Director of Education GoK and CGK (VTC and ECDEs) Kisumu (2018)
Table 24: Number of Learners per Institution Category
Level of
Education
Ownershi
p
Gende
r
Kisum
u
central
Kisum
u East
Kisum
u west
Muhoron
i
Nyakac
h
Nyand
o
Seme
ECD Public M
F
Private M
F
Primary
School
Public M 14680 12400 16214 18718 20883 19393 16464
F 15336 12744 16012 18082 21277 19391 16633
Private M 3892 1875 1630 2146 1791 1436 268
F 3824 1973 1695 2047 1846 2567 247
Secondary
School
Public M 4229 2342 6254 4557 7852 7533 4915
F 3711 2129 5818 5087 9898 5425 4300
Private M 336 255 201 241 0 101 0
F 416 344 62 337 0 94 0
Non-Formal
Education
Public M 55 51 4 64 51 182 45
F 122 90 8 145 124 537 177
Private M 73 8 73 0 0 45 0
F 87 31 69 0 0 70 0
Adult
Continuing
Education
Public M 246 31 85 74 187 155 41
F 303 77 139 261 1322 645 239
Private M 110 11 0 0 0 24 0
F 111 46 0 0 0 53 0
VTC Public M
F
Private M
F
Source: County Director of Education GoK and CGK Education deparmtnemt( VTC and ECDE)kisumu
2018

48 Kisumu County Integrated Development Plan | 2018 – 2022
1.23 Security, Law and Order
Security, Law and Order is vital in achieving and sustaining economic growth. Freedom from
danger, fear and an assurance of justice provides an enabling environment for individuals and
business to thrive. It’s a key incentive for attracting investment from within and outside the
County and the Country at large. The County has established Community Policing Initiatives in
each of the seven Sub- Counties. Common types of crime within the County are assault, stealing,
creating disturbance and burglary.
Table 25: Distribution of Security and Law offices within the County
Police Station/ Post Community
Policing
Initiatives
Prisons Type of Law Courts Sub-County
Kisumu Central Police
Station
Kondele Police station
CBK Police Post
Obunga Police Post
Nyalenda Police Post
Kisumu High
Court
Winam Magistrates
Court
Municipal Court
Kisumu
Central
Mamboleo Police Post Nil Kisumu East
Maseno Police Station
Riat Police Post
Dago Police Post
Kodiaga Maseno Law
Courts
Kisumu West
Ahero Police Station
Boya Police station
Awasi Police Station
Ahero Magistrates
Court
Nyando Sub
County
Pap- Onditi Police
Station
Sondu Miriu Police
Post
Nil Nyakach Sub-
County
Koru Police Station
Miwani Police Station
Songhor Police Post
Kibos Police Post
Muhoroni Police Post
Nyangore Police Post
Chemelil Police Post
Kibos Prisons Tamu Law Courts Muhoroni
Kombewa Police
Station
Ratta Police Post
Nil Seme
Source: Office of the County Commissioner and the County Police Commander, Kisumu 2018

49 Kisumu County Integrated Development Plan | 2018 – 2022
CHAPTER TWO
LINKAGES WITH VISION 2030 AND OTHER PLANS

50 Kisumu County Integrated Development Plan | 2018 – 2022
Introduction
This chapter explains how the County Integrated Development Plan II (2018-22) links upand
integrates with the Governor’s manifesto, the Kenya Vision 2030 and its third Medium Term
Plan, Sustainable Development Goals and other Sectoral plans.
2.0 County Integrated Development Plan II (2018-2022)
The second County Integrated Development Plan (2018-2022) is a five- year development plan
prepared and implemented under the Kenya Constitution which created a two-tier government; a
National Government, along with 47 County governments that are distinct and interdependent
and thus a paradigm-shift in development planning.
The Kisumu CIDP II aims to build on the achievements of the CIDP I (2013-2017) and to put the
County on a high, broad-based, inclusive and sustainable growth trajectory recovery path as
envisioned in the Governor’s Manifesto “Kisumu Stand Up”. The Manifesto’s central focus is
on job creation and ending poverty through sustainable development in agriculture, industry and
service sectors. The CIDP II will integrate the Kenya Vision 2030 and its MTP III, the
Sustainable Development Goals and other sectoral plans.

51 Kisumu County Integrated Development Plan | 2018 – 2022
Figure 3: CIDP Linkages with other sectors plans;
2.1 Governor’s Manifesto
This is Governor’s campaign promise to the people of Kisumu. His five-year development
agenda is to transform the County of Kisumu from a disappointing under-achiever to a County of
great potential through his ten-point agenda: revitalizing agriculture for food security and
agribusiness; ensuring a healthy population living in a clean and secure environment;
modernizing infrastructure; promotion of skills development and innovation; conservation of the
environment while opening the Kisumu lake front for business; promotion of decent housing;
promotion of sports, culture and arts; promotion of the use of sustainable energy sources in
Inputs
Updates
Governor’s Manifesto
(Kenya Vision 2030, SDGs)
Kenya Vision 2030
(MTP III- 5 Years)
County Integrated
Development Plan
(5 Year)
Sectoral, Spatial and Urban
Plans
(10 Years)
Sector/Department Work
Plans
(1 Year - Development)
Annual Development Plan
(1 Year - Development)
Programme Based Budget
(1 Year Appropriation, Dev. and
Rec.)
Sector/Department Work
Plans
(1 Year – Dev. and Rec.)
County Long Term
Strategic Plan
MTEF (3-year rolling)
Inputs

52 Kisumu County Integrated Development Plan | 2018 – 2022
industrialization and service sector; promotion of tourism driven by culture and heritage and
finally, deepen the structures of devolved governance (establishment of the village councils).
He visualizes Kisumu as a peaceful and prosperous County where all citizens enjoy high quality
of life and a sense of belonging.
2.2 Kenya Vision 2030
Kenya Vision 2030 is the national long-term development policy that aims to transform Kenya
into a newly industrializing, middle-income country providing a high quality of life to all its
citizens by 2030 in a clean and secure environment. The vision comprises of three key pillars:
Economic, Social and Political which are anchored on the foundations of macroeconomic
stability; continuity in governance reforms; enhanced equity and wealth creation opportunities
for the poor. The Vision 2030 strategy is to undertake reforms in eight key sectors resource
development; security and public-sector reforms.
The Economic Pillar: Aims to achieve an average economic growth rate of 10 percent per
annum and sustaining the same until 2030. Six priority sectors that make up the larger part of
Kenya’s GDP (57 percent) and provide for nearly half of the country’s total formal employment
were targeted: Agriculture; Manufacturing; Tourism; Wholesale and retail (trade); Financial
Services and Information Technology enabled services. Two other sectors have since been
added, Blue Economy and Energy and Petroleum.
The Social pillar: Its objective is to invest in the people of Kenya in order to improve their
quality of life by targeting a cross-section of human and social welfare, projects and
programmes, specifically: Education and training, Health (Medical Services and Public services
and Sanitation), Environment, Water, Housing and Urbanization, Gender, Youth and Vulnerable
Groups, Labour and Manpower Development and Sports, Culture and Arts.
The political pillar: It aims at realizing an issue-based, people-centred, results-oriented and
accountable democratic system. The pillar is anchored on transformation of Kenya’s political
governance across five strategic areas; the rule of law-the Kenyan Constitution; Electoral and
political processes; democracy and public service delivery; transparency and accountability and
security, peace building and conflict management.
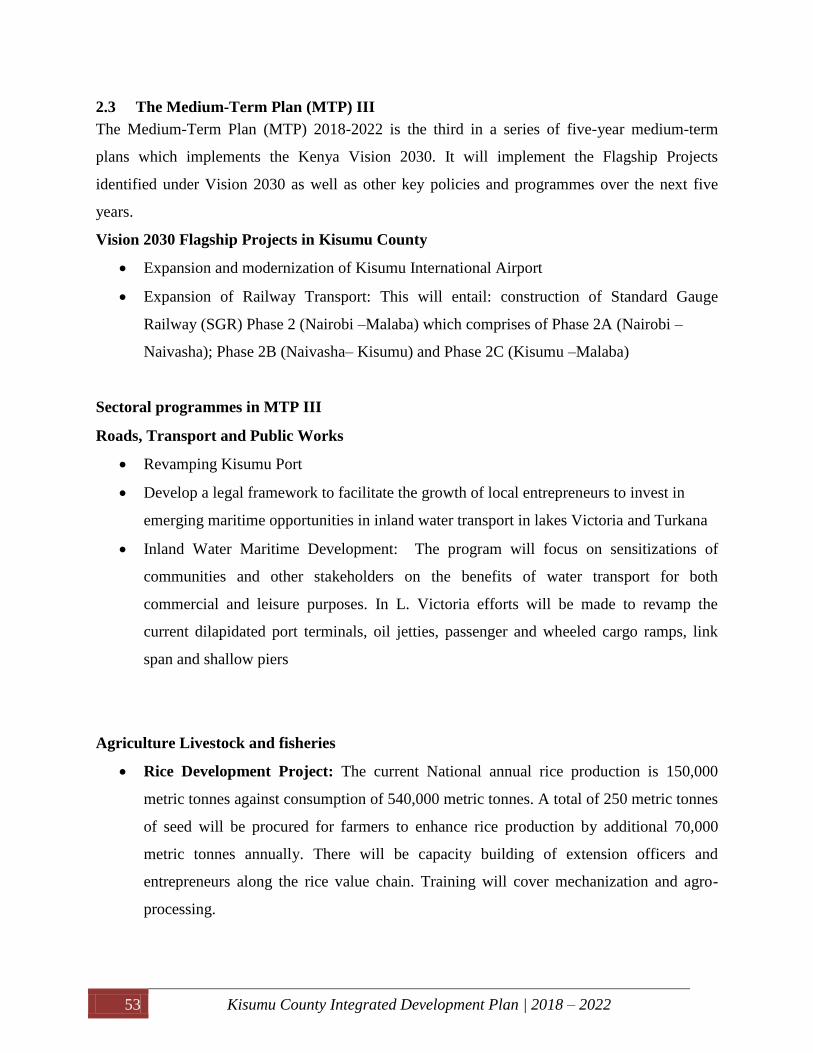
53 Kisumu County Integrated Development Plan | 2018 – 2022
2.3 The Medium-Term Plan (MTP) III
The Medium-Term Plan (MTP) 2018-2022 is the third in a series of five-year medium-term
plans which implements the Kenya Vision 2030. It will implement the Flagship Projects
identified under Vision 2030 as well as other key policies and programmes over the next five
years.
Vision 2030 Flagship Projects in Kisumu County
Expansion and modernization of Kisumu International Airport
Expansion of Railway Transport: This will entail: construction of Standard Gauge
Railway (SGR) Phase 2 (Nairobi –Malaba) which comprises of Phase 2A (Nairobi –
Naivasha); Phase 2B (Naivasha– Kisumu) and Phase 2C (Kisumu –Malaba)
Sectoral programmes in MTP III
Roads, Transport and Public Works
Revamping Kisumu Port
Develop a legal framework to facilitate the growth of local entrepreneurs to invest in
emerging maritime opportunities in inland water transport in lakes Victoria and Turkana
Inland Water Maritime Development: The program will focus on sensitizations of
communities and other stakeholders on the benefits of water transport for both
commercial and leisure purposes. In L. Victoria efforts will be made to revamp the
current dilapidated port terminals, oil jetties, passenger and wheeled cargo ramps, link
span and shallow piers
Agriculture Livestock and fisheries
Rice Development Project: The current National annual rice production is 150,000
metric tonnes against consumption of 540,000 metric tonnes. A total of 250 metric tonnes
of seed will be procured for farmers to enhance rice production by additional 70,000
metric tonnes annually. There will be capacity building of extension officers and
entrepreneurs along the rice value chain. Training will cover mechanization and agro-
processing.

54 Kisumu County Integrated Development Plan | 2018 – 2022
Revitalization of Cotton: Plant machine will be set up under AFA. This will comprise a
mini ginnery plant which will delint, clean, package and avail the seed to farmers. It will
include establishment of a centre of excellence for value addition technologies;
manufacture of fabrics using cotton waste to produce a variety of products such as cotton
seed oil, cake, soap and candles.
Development of Fisheries and Maritime Infrastructure: This will entail establishment
of maritime infrastructures including ;small commercial port in Takaungu; fish markets
in Kisumu, Lamu, Mombasa and Nairobi; upgrading of Bandari College into National
Maritime Centre of Excellence; fish ports in Lamu, Kilifi, and Shimoni; jetties; fish
processing, cold storage facilities and ice plants; accreditation of International Fish
Quality Control laboratories in Nairobi, Mombasa and Kisumu; and border point
inspection units. Recovery of encroached public land reserved for jetties, landing sites,
fishing ports and access roads to beaches and lakes.
Aquaculture Technology Development: The priority interventions to be implemented
include: Aquaculture Technology Development and Innovations Transfers; Youth
Aquaculture Programme; National fish breeding programme in Sagana, Kiganjo,
Ngomeni and Kabonyo; Development of International Nile Perch Research Centre at
Kabonyo in Kisumu; Development of Aqua-parks; Promotion and development of
ornamental fisheries; and development and promotion of recreational fisheries.
Environment water and natural resources
Conduct six frame surveys in Lake Victoria, Lake Turkana and marine waters.
Physical planning and urban development
Operationalization of 2 Metropolitan Areas i.e. Mombasa and Kisumu
2.4 Sustainable Development Goals (SDGs)
The Agenda 2030 for Sustainable Development and its 17 goals and 169 targets were adopted by
all member states of the United Nations in September 2015. It officially came into effect on 1st
January 2016 and is to be achieved by 2030.

55 Kisumu County Integrated Development Plan | 2018 – 2022
The 2030 Agenda applies to every country, sets forth “a plan of action for people, planet and
prosperity and seeks to strengthen universal peace in larger freedom”. Integrated plan of action
is structured in four main parts: vision and principles for transforming our world as set out in the
declaration; a results framework of global SDGs; a means of implementation and global
partnership and follow-up and review.
Table 26: Linkages of County functions to SDGs, Governor’s manifesto and Vision 2030
County Functions (Constitution
of Kenya 2010- Schedule Four)
SDGs Governor’s Manifesto Kenya Vision 2030
Agriculture
Irrigation services
Goals 1, 2 and 6 Revitalizing agriculture for
food security and
agribusiness
Economic pillar;
agricultural sector
County Health Services Goal 3 and 6 Ensure a healthy population
living in a clean and secure
environment
Social pillar; health
sector
Control of air and noise
pollution, other public nuisances
Goals 3, 6 and 14 Solid waste management;
relocation of the Kachok
dumpsite
Social pillar;
environment sector
Cultural activities, public
entertainment and public
amenities
Goals 4 and 11 Promotion of sports,
culture and arts
Social pillar
County transport Goal 9 and 11 Modernization and linkage
of infrastructure (road and
water/maritime)
Enablers and macro-
foundations;
infrastructural
development
Animal control and welfare Goal 2, 3 and 12 Control of livestock
diseases, reduce livestock
theft, and improve animal
health
Economic pillar
(Agriculture) Social
pillar (Health)
Trade development and
regulation
Goals 2, 3, 8, 9, 10 and 17 Sustainable trade
development through
provision of linkages
between SMEs and large
firms;
Establishment of
innovation and Business
Incubation Centres
Economic pillar;
trade sector
County planning and
development All Coordination of
development planning and
tracking of results
(Planning for results)
Foundation and
tracking of the
Kenya Vision 2030
Pre-primary education, village
polytechnics, home craft centres
and child care facilities
Goal 4 Social pillar;
Education and
training sector
Implementation of specific
national government policies on
natural resources on
environmental conservation
Healthy Environment
Goals 1, 6, 8, 9, 11, 12, 13,
14, 15 and 17
Management and
conservation of the natural
resources: Lake Victoria,
Gazetted forests;
Promotion of the use of
sustainable energy sources
Economic pillar;
Blue economy sector
Social pillar;
Environment sector
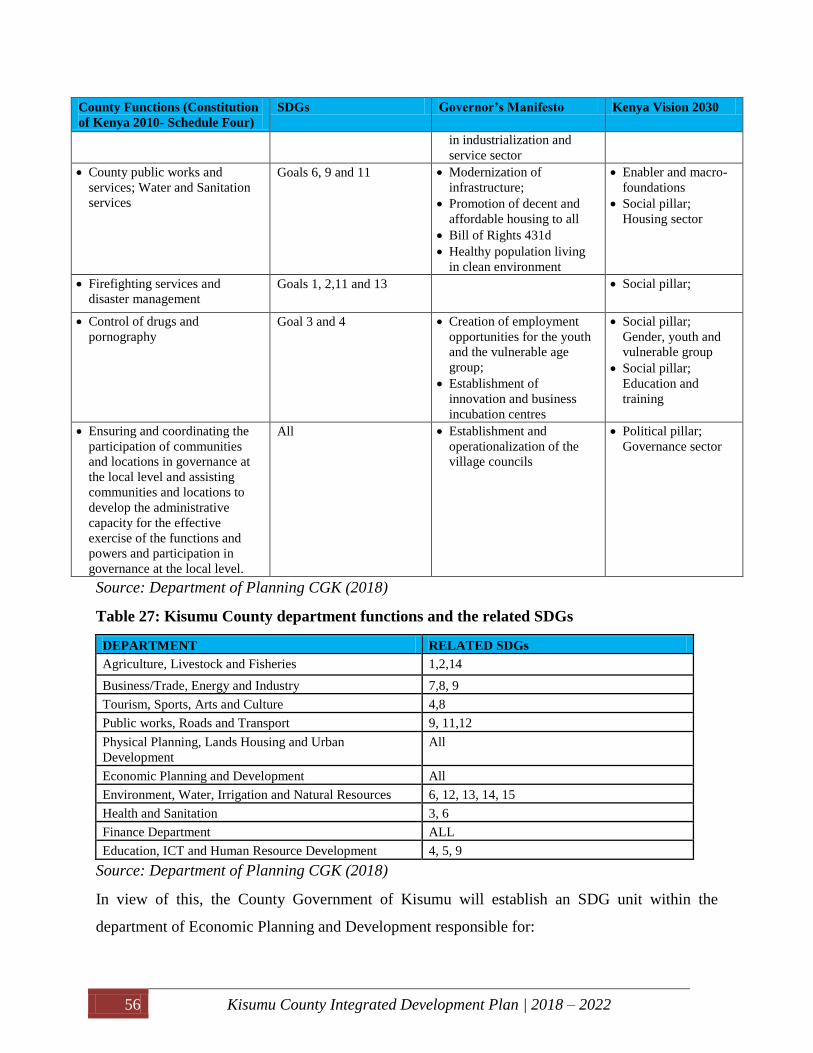
56 Kisumu County Integrated Development Plan | 2018 – 2022
County Functions (Constitution
of Kenya 2010- Schedule Four)
SDGs Governor’s Manifesto Kenya Vision 2030
in industrialization and
service sector
County public works and
services; Water and Sanitation
services
Goals 6, 9 and 11 Modernization of
infrastructure;
Promotion of decent and
affordable housing to all
Bill of Rights 431d
Healthy population living
in clean environment
Enabler and macro-
foundations
Social pillar;
Housing sector
Firefighting services and
disaster management Goals 1, 2,11 and 13 Social pillar;
Control of drugs and
pornography
Goal 3 and 4 Creation of employment
opportunities for the youth
and the vulnerable age
group;
Establishment of
innovation and business
incubation centres
Social pillar;
Gender, youth and
vulnerable group
Social pillar;
Education and
training
Ensuring and coordinating the
participation of communities
and locations in governance at
the local level and assisting
communities and locations to
develop the administrative
capacity for the effective
exercise of the functions and
powers and participation in
governance at the local level.
All Establishment and
operationalization of the
village councils
Political pillar;
Governance sector
Source: Department of Planning CGK (2018)
Table 27: Kisumu County department functions and the related SDGs
DEPARTMENT RELATED SDGs
Agriculture, Livestock and Fisheries 1,2,14
Business/Trade, Energy and Industry 7,8, 9
Tourism, Sports, Arts and Culture 4,8
Public works, Roads and Transport 9, 11,12
Physical Planning, Lands Housing and Urban
Development
All
Economic Planning and Development All
Environment, Water, Irrigation and Natural Resources 6, 12, 13, 14, 15
Health and Sanitation 3, 6
Finance Department ALL
Education, ICT and Human Resource Development 4, 5, 9
Source: Department of Planning CGK (2018)
In view of this, the County Government of Kisumu will establish an SDG unit within the
department of Economic Planning and Development responsible for:

57 Kisumu County Integrated Development Plan | 2018 – 2022
Tracking the performance of the 169 SDG indicators in all the wards and villages of the
County.
Setting and reviewing of the County- Relevant targets
Make recommendations to the leadership of the County on the domestication and
integration of the SDGs integration and implementation of policies, programmes and
projects.

58 Kisumu County Integrated Development Plan | 2018 – 2022
CHAPTER THREE
REVIEW OF IMPLEMENTATION OF THE PREVIOUS CIDP
(2013-2017)
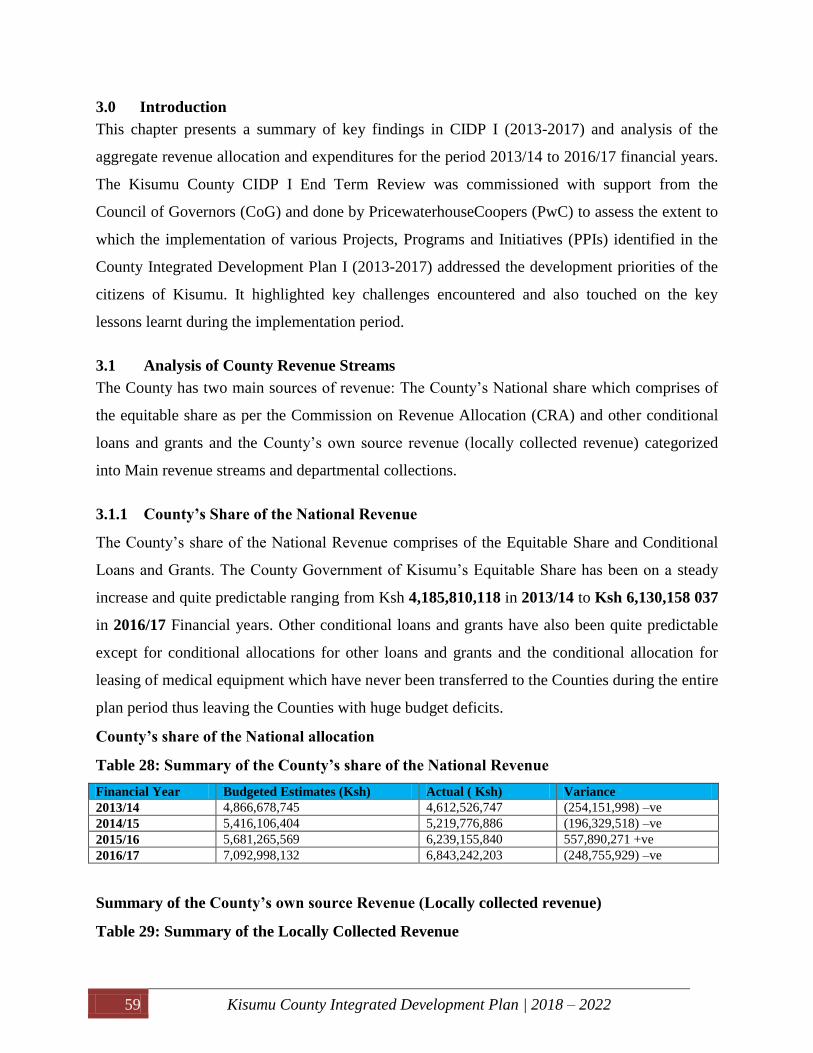
59 Kisumu County Integrated Development Plan | 2018 – 2022
3.0 Introduction
This chapter presents a summary of key findings in CIDP I (2013-2017) and analysis of the
aggregate revenue allocation and expenditures for the period 2013/14 to 2016/17 financial years.
The Kisumu County CIDP I End Term Review was commissioned with support from the
Council of Governors (CoG) and done by PricewaterhouseCoopers (PwC) to assess the extent to
which the implementation of various Projects, Programs and Initiatives (PPIs) identified in the
County Integrated Development Plan I (2013-2017) addressed the development priorities of the
citizens of Kisumu. It highlighted key challenges encountered and also touched on the key
lessons learnt during the implementation period.
3.1 Analysis of County Revenue Streams
The County has two main sources of revenue: The County’s National share which comprises of
the equitable share as per the Commission on Revenue Allocation (CRA) and other conditional
loans and grants and the County’s own source revenue (locally collected revenue) categorized
into Main revenue streams and departmental collections.
3.1.1 County’s Share of the National Revenue
The County’s share of the National Revenue comprises of the Equitable Share and Conditional
Loans and Grants. The County Government of Kisumu’s Equitable Share has been on a steady
increase and quite predictable ranging from Ksh 4,185,810,118 in 2013/14 to Ksh 6,130,158 037
in 2016/17 Financial years. Other conditional loans and grants have also been quite predictable
except for conditional allocations for other loans and grants and the conditional allocation for
leasing of medical equipment which have never been transferred to the Counties during the entire
plan period thus leaving the Counties with huge budget deficits.
County’s share of the National allocation
Table 28: Summary of the County’s share of the National Revenue
Financial Year Budgeted Estimates (Ksh) Actual ( Ksh) Variance
2013/14 4,866,678,745 4,612,526,747 (254,151,998) –ve
2014/15 5,416,106,404 5,219,776,886 (196,329,518) –ve
2015/16 5,681,265,569 6,239,155,840 557,890,271 +ve
2016/17 7,092,998,132 6,843,242,203 (248,755,929) –ve
Summary of the County’s own source Revenue (Locally collected revenue)
Table 29: Summary of the Locally Collected Revenue

60 Kisumu County Integrated Development Plan | 2018 – 2022
Financial Year Budgeted Estimates (Kshs) Actual (Kshs) Variance (Kshs)
2013/2014 3,417,121,255 621,861,798 2,795,259,457 (-ve)
2014/2015 1,500,000,000 970,903,407 529,096,593 (-ve)
2015/2016 1,868,587,022 984,794,407 889,697,761 (-ve)
2016/2017 1,584,987,119 1,004,043,906 580,943,213 (-ve)
County’s Total Revenue
Table 30: Summary of the County’s Total Share of Revenue
Financial Year Budgeted Estimates (Kshs) Actual (Kshs) Variance (Kshs)
2013/14 8,283,800,000 5,234,388,545 3,049,411,455 (-ve)
2014/2015 6,916,106,464 6,190,680,293 725,426,171 (-ve)
2015/2016 7,549,852,591 7,223,950,247 325,902,344 (-ve)
2016/17 8,677,985,251 7,847,286,109 830,699,142 (-ve)

61 Kisumu County Integrated Development Plan | 2018 – 2022
Table 31: County's Share of the National Revenue
ITEM FY 2013/14 FY 2014/15 FY 2015/16 FY 2016/17
Budgeted Actual Budgeted Actual Budgeted Actual Budgeted Actual
Equitable share 4,155,298,066 4,185,810,118 4,957,071,160 4,957,071,000 5,681,265,569 5,681,265,569 6,130,158,037 6,130,158,037
DANIDA 14,200,000 14,200,000 16,580,000 16,580,000 38,363,021 8,290,000
World Bank(KDSP) - - - - 30,418,403 0
Conditional Allocations- other loans and grants 711,380,679 - 196,329,518 - 48,000,000 - 30,000,000 0
Level 5 Conditional Grant - - 248,505,726 248,506,000 338,616,571 338,616,571 351,445,087 351,445,087
Conditional allocation for free maternal health 123,782,400 107,937,500 118,015,691 110,497,500
Conditional allocation for compensation for
users’ fee foregone
22,585,235 22,585,235 21,854,292 21,854,292
Conditional allocation for leasing of medical
equipment
95,774,680 - 95,744.681 0
Conditional allocation for roads maintenance
fuel levy fund
72,170,965 72,170,965 164,024,920 94,189,837
Financing under Build Operate and Transfer
(BOT)
0 0
Symbiocity Grant from Swedish Association of
Local Authority & Regions
0 0
Conditional grant for call and risk allowance-
Nurses & other personnels
54,774,000
Conditional grant for call & risk allowance-
Doctors
58,200,000
Total Share of National Revenue 4,866,678,745 4,185,810,118 5,416,106,404 5,219,777,000 6,398,775,420 6,239,155,840 7,092,998.132 6,716,434,753
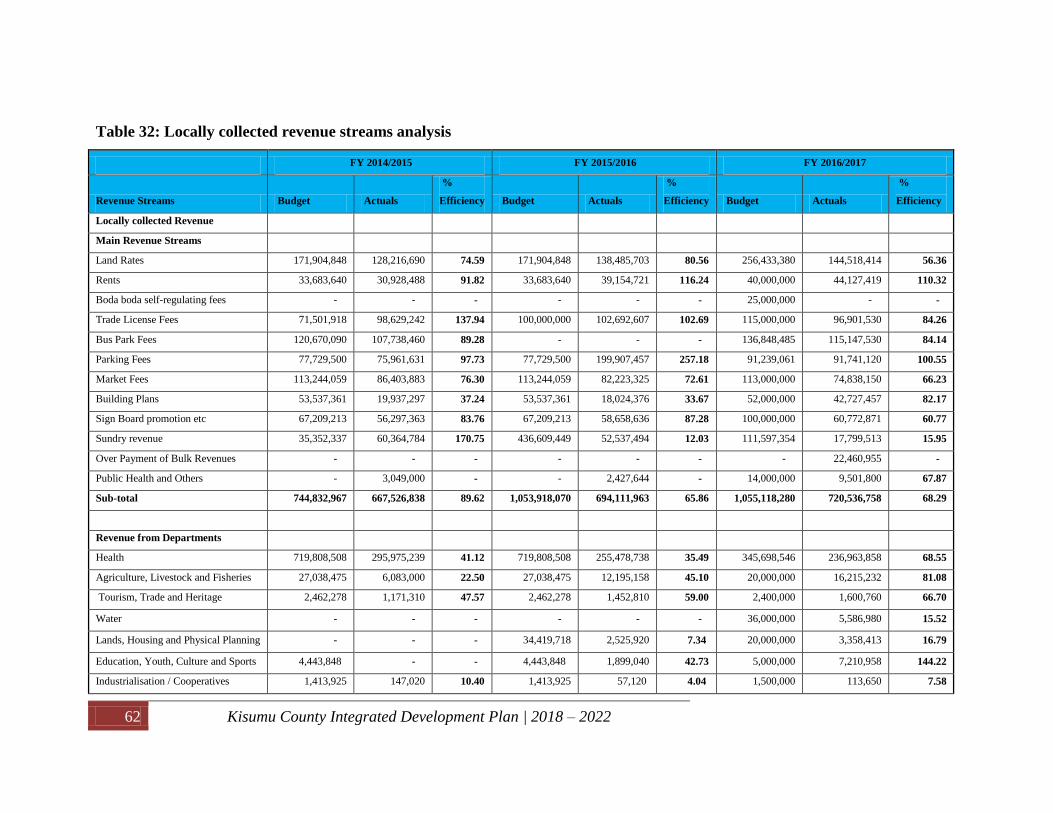
62 Kisumu County Integrated Development Plan | 2018 – 2022
Table 32: Locally collected revenue streams analysis
FY 2014/2015 FY 2015/2016 FY 2016/2017
Revenue Streams Budget Actuals
%
Efficiency Budget Actuals
%
Efficiency Budget Actuals
%
Efficiency
Locally collected Revenue
Main Revenue Streams
Land Rates 171,904,848 128,216,690 74.59 171,904,848 138,485,703 80.56 256,433,380 144,518,414 56.36
Rents 33,683,640 30,928,488 91.82 33,683,640 39,154,721 116.24 40,000,000 44,127,419 110.32
Boda boda self-regulating fees - - - - - - 25,000,000 - -
Trade License Fees 71,501,918 98,629,242 137.94 100,000,000 102,692,607 102.69 115,000,000 96,901,530 84.26
Bus Park Fees 120,670,090 107,738,460 89.28 - - - 136,848,485 115,147,530 84.14
Parking Fees 77,729,500 75,961,631 97.73 77,729,500 199,907,457 257.18 91,239,061 91,741,120 100.55
Market Fees 113,244,059 86,403,883 76.30 113,244,059 82,223,325 72.61 113,000,000 74,838,150 66.23
Building Plans 53,537,361 19,937,297 37.24 53,537,361 18,024,376 33.67 52,000,000 42,727,457 82.17
Sign Board promotion etc 67,209,213 56,297,363 83.76 67,209,213 58,658,636 87.28 100,000,000 60,772,871 60.77
Sundry revenue 35,352,337 60,364,784 170.75 436,609,449 52,537,494 12.03 111,597,354 17,799,513 15.95
Over Payment of Bulk Revenues - - - - - - - 22,460,955 -
Public Health and Others - 3,049,000 - - 2,427,644 - 14,000,000 9,501,800 67.87
Sub-total 744,832,967 667,526,838 89.62 1,053,918,070 694,111,963 65.86 1,055,118,280 720,536,758 68.29
Revenue from Departments
Health 719,808,508 295,975,239 41.12 719,808,508 255,478,738 35.49 345,698,546 236,963,858 68.55
Agriculture, Livestock and Fisheries 27,038,475 6,083,000 22.50 27,038,475 12,195,158 45.10 20,000,000 16,215,232 81.08
Tourism, Trade and Heritage 2,462,278 1,171,310 47.57 2,462,278 1,452,810 59.00 2,400,000 1,600,760 66.70
Water - - - - - - 36,000,000 5,586,980 15.52
Lands, Housing and Physical Planning - - - 34,419,718 2,525,920 7.34 20,000,000 3,358,413 16.79
Education, Youth, Culture and Sports 4,443,848 - - 4,443,848 1,899,040 42.73 5,000,000 7,210,958 144.22
Industrialisation / Cooperatives 1,413,925 147,020 10.40 1,413,925 57,120 4.04 1,500,000 113,650 7.58

63 Kisumu County Integrated Development Plan | 2018 – 2022
FY 2014/2015 FY 2015/2016 FY 2016/2017
Revenue Streams Budget Actuals
%
Efficiency Budget Actuals
%
Efficiency Budget Actuals
%
Efficiency
Liquor Licenses - - - 25,082,200 17,073,658 68.07 30,570,293 10,912,848 35.70
Green Energy - - - - - - 5,000,000 - -
Energy & Mining - - - - - - 2,500,000 65,000 2.60
Roads, Transport and Public Works - - - - - - 60,000,000 - -
Environment - - - - - - 1,200,000 1,479,450 123.29
Sub-Total 755,167,034 303,376,569 40.17 814,668,952 290,682,444 35.68 529,868,839 283,507,148 53.51
Total 1,500,000,000 970,903,407 64.73 1,868,587,022 984,794,407 52.70 1,584,987,119 1,004,043,906 63.35

64 Kisumu County Integrated Development Plan | 2018 – 2022
3.1.2 County’s own source Revenue (Locally collected revenue)
The locally collected revenue budget had been pro-rated into two categories of revenue streams
namely: Main revenue streams and revenue from departments. The budget estimates for the
locally collected revenue has varied over the years from Kshs. 3,417,121,255 in 2013/14 to
1,500,000,000 in 2014/15 to Kshs. 1,868,587,022 in 2015/16 and Kshs. 1,584,987,119 in
2016/17. On the other hand, the actual revenue realized has been on an upward trend from a
paltry Kshs. 621,861,798 in 2013/14 to Kshs. 1,004,043,906 in 2016/17. This growth represents
a positive deviation of 3.4 percent. Revenue from the main revenue streams has shown an
upward trend from Kshs. 667,526,838 in 2014/15 to Kshs. 694,111,963 in 2015/16 to
720,536,758 in 2016/17. On the other hand, departmental revenue streams actual has been on a
declining trend from Kshs. 303,376,569 in 2014/15 to Kshs. 290,682,444 in 2015/16 to Kshs.
283,507,148to2016/17
Revenue Collection Efficiency
The average revenue efficiency rate was 60.26 percent for the period under review. This rate
however declined with 2014/15 having 64.73 percent, 2015/16 had 52.70 percent and 2016/17
with 63.35 percent. The main revenue streams category recorded a better performance with an
average efficiency rate of 74.6 percent compared to 43.12 percent for departmental revenue
collections.

65 Kisumu County Integrated Development Plan | 2018 – 2022
Figure 4: Main Revenue Streams Efficiency Rates
The figure above indicates that most of the revenue streams had variations in revenue efficiency
rates for the last three years. The main revenue streams with notable variations are highlighted
below:
Land Rates
This revenue stream which accounts for approximately 20 percent of the total collection from the
main revenue streams, had an efficiency rate of 74.6 percent in 2014/16 which increased to 80.6
percent in 2015/16 because the budget target was never revised. However, its efficiency dropped
to 56.4 percent in 2016/17 when the budget was revised in anticipation that land and property
owners would take advantage of the waiver on land rates that had been granted by the County
Government of Kisumu.
Bus Park Fees
This is the second largest contributor of revenue in the main revenue streams category. It
accounts for approximately 16 percent of the total revenue collection from the said category. Its
efficiency rate dropped from 89.3 percent in 2014/15 to zero percent in 2015/16. This drop is
explained by the fact that bus park fees and parking fees were merged to form parking fees
stream in 2015/16 financial year and therefore parking fees recorded the highest efficiency rate
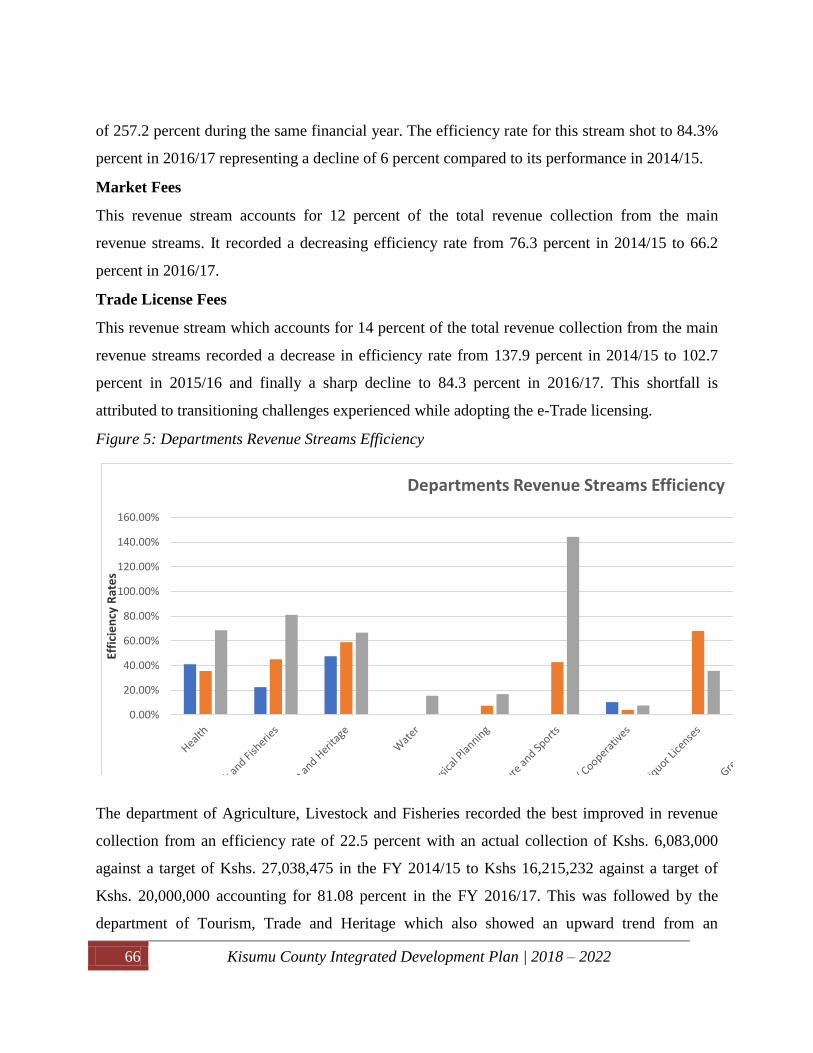
66 Kisumu County Integrated Development Plan | 2018 – 2022
of 257.2 percent during the same financial year. The efficiency rate for this stream shot to 84.3%
percent in 2016/17 representing a decline of 6 percent compared to its performance in 2014/15.
Market Fees
This revenue stream accounts for 12 percent of the total revenue collection from the main
revenue streams. It recorded a decreasing efficiency rate from 76.3 percent in 2014/15 to 66.2
percent in 2016/17.
Trade License Fees
This revenue stream which accounts for 14 percent of the total revenue collection from the main
revenue streams recorded a decrease in efficiency rate from 137.9 percent in 2014/15 to 102.7
percent in 2015/16 and finally a sharp decline to 84.3 percent in 2016/17. This shortfall is
attributed to transitioning challenges experienced while adopting the e-Trade licensing.
Figure 5: Departments Revenue Streams Efficiency
0.00%
20.00%
40.00%
60.00%
80.00%
100.00%
120.00%
140.00%
160.00%
Effi
cie
ncy
Rat
es
Departments Revenue Streams Efficiency
The department of Agriculture, Livestock and Fisheries recorded the best improved in revenue
collection from an efficiency rate of 22.5 percent with an actual collection of Kshs. 6,083,000
against a target of Kshs. 27,038,475 in the FY 2014/15 to Kshs 16,215,232 against a target of
Kshs. 20,000,000 accounting for 81.08 percent in the FY 2016/17. This was followed by the
department of Tourism, Trade and Heritage which also showed an upward trend from an

67 Kisumu County Integrated Development Plan | 2018 – 2022
efficiency rate of 47 percent to 66 percent during the period under review. As we move towards
implementation of CIDP II, the Agriculture, Livestock and Fisheries Sector, Trade Energy and
Industry Sector and the Tourism subsectors will be given priority in acting as key growth areas
and greatest movers in generation of our locally collected revenue
The Health sector has been the highest contributor of the locally collected revenue accounting for
30.48 percent in 2014/15 FY, to 25.94 percent in 2015/16 FY and 23.6 percent in 2016/17 FY
despite the sector’s key role in lowering the incidences of diseases and promoting affordable
healthcare to the residents of Kisumu County.
3.2 County Expenditure Analysis
The total expenditure was Kshs. 5,734,081,943 in 2014/15, Kshs. 6,439,962, 805 in 2015/16 and
Kshs. 6,691,485,817 in 2016/17 financial year. The tables below show sectors allocations for the
period under review:

68 Kisumu County Integrated Development Plan | 2018 – 2022
Table 33:Recurrent Allocation and Expenditures
FY 2014/2015 FY 2015/2016 FY 2016/2017
BUDGET EXPENCE
ABSORPTION
RATE BUDGET EXPENCE
ABSORPTION
RATE BUDGET EXPENCE
ABSORPTION
RATE
Governance and administration 375,568,636 2,716,857,071 723.40% 391,160,000 1,990,504,266 508.90% 417,851,093 663,605,162 158.8%
Finance and planning 856,420,002 526,174,314 61.40% 793,679,590 610,081,093 76.90% 815,618,589 569,736,829 69.9%
Health 1,981,199,629 504,431,409 25.50% 2,122,990,000 802,123,664 37.80% 2,388,398,993 1,616,554,689 67.7%
Tourism, Trade and Heritage 64,705,426 15,633,268 24.20% 68,048,880 17,126,943 25.20% 73,756,662 50,112,696 67.9%
Transport and Infrastructure 109,209,830 22,664,605 20.80% 113,904,104 97,729,352 85.80% 119,347,474 107,804,802 90.3%
Lands, Housing and Physical Planning 28,592,509 6,665,734 23.30% 27,378,863 3,157,776 11.50% 30,044,022 16,541,095 55.1%
Industrialisation & Enterprise Development 40,736,210 7,814,999 19.20% 78,281,138 27,857,393 35.60% 110,930,944 89,070,284 80.3%
Agriculture, Livestock and Fisheries 298,221,672 90,202,326 30.20% 280,457,645 156,099,039 55.70% 267,503,424 237,150,419 88.7%
Education, Gender, Culture and & Sports 94,358,229 62,717,232 66.50% 145,296,096 105,646,546 72.70% 378,446,655 354,240,147 93.6%
Water, Environment & Natural Resources 86,832,901 24,749,679 28.50% 107,120,427 54,656,789 51.00% 152,378,213 128,162,696 84.1%
Energy and Mining 24,208,173 12,514,735 51.70% - -
ICT and Communication 65,913,670 24,119,979 36.60% 65,115,352 22,926,588 35.2%
County Public Service Board 58,957,966 44,974,935 76.30% 47,148,907 40,927,600 86.8%
City of Kisumu 757,577,345 101,463,945 13.40% 816,861,848 205,816,351 25.20% 709,455,157 524,861,701 74.0%
County Assembly 371,339,299 295,832,921 79.70% 533,898,747 471,393,650 88.30% 654,621,594 433,590,880 66.2%
Total Reccurrent Expenditure 5,088,969,861 4,387,722,238 86.20% 5,603,949,014 4,611,287,776 82.30% 5,812,765,986 4,191,680,426 72.1%
69 Kisumu County Integrated Development Plan | 2018 – 2022
3.2.1 Recurrent Expenditure Analysis
The recurrent expenditure increased by 10.7 percent from Kshs. 4,387,722,238 in 2014/15 to
Kshs. 4,855,285,588 in 2016/17. This was attributed to an overall increase in compensation of
employees due to recruitment of personnel with high pay scale and salaries revision for officers.
In 2014/15 FY and 2015/16 FY Personal Emoluments vote was under Governance and
administration sector thus the highest recurrent expenditure of Kshs. 2,716,857,071 in 2014/15
to Kshs. 1,990,504,266 in 2015/16. This figure however declined to Kshs. 663,605,162
accounting for 158.8 percent absorption rate in 2016/17 upon transfer of Personal Emoluments
Vote to their respective departments.
Absorption rates
The Budget absorption rate during the period under review reduced from 86.2 percent in
2014/15 to 77.9 percent in 2016/17. Governance and administration department had the highest
(abnormal) budget absorption rates throughout the period with 723.4 percent in 2014/15, 508.9
percent in 2015/16 and 158.8 percent in 2016/17. Generally, the absorption rates of all the
sectors increased for the period under review.

70 Kisumu County Integrated Development Plan | 2018 – 2022
Figure 6: Budget Absorption Rates/Sector
0.00%
100.00%
200.00%
300.00%
400.00%
500.00%
600.00%
700.00%
800.00%
Ab
sorp
tio
n R
ate
s
Sectors
Budget Absorption Rates/Sector
2014/15 2015/16 2016/17
The figure above indicates that all sectors except Governance and Administration utilized below
100% of the approved funds for the period under review.

71 Kisumu County Integrated Development Plan | 2018 – 2022
Table 34: Development Allocations and Expenditures
DEVELOPMENT EXPENDITURE
FY 2014/2015 FY 2015/2016 FY 2016/2017
BUDGET EXPENCE
ABSO
RPTI
ON
RATE BUDGET EXPENCE
ABSO
RPTI
ON
RATE BUDGET EXPENCE
ABSOR
PTION
RATE
Governance and administration 100,000,000 87,143,670 87.1% 235,000,000 217,631,080 92.6% 127,500,000 127,115,220 99.7%
Finance and planning 1,267,867,872 1,071,558,659 84.5% 1,477,261,278 1,076,932,276 72.9% 1,499,989,853 884,914,853 59.0%
Health 145,900,000 - 0.0% 241,711,000 74,834,542 31.0% 96,450,633 98,575,577 102.2%
Tourism, Trade and Heritage 67,160,000 200,000 0.3% 130,000,000 47,068,936 36.2%
Transport and Infrastructure 670,095,440 12,917,052 1.9% 484,370,000 74,583,632 15.4% 628,634,862 204,301,339 32.5%
Lands, Housing and Physical Planning 100,846,520 27,000,000 26.8% 252,300,000 20,000 0.0% 156,395,240 74,916,996 47.9%
Industrialisation & Enterprise Development 12,000,000 942,500 7.9% 232,000,000 29,033,549 12.5% 135,982,248 57,678,946 42.4%
Agriculture, Livestock and Fisheries 10,000,000 15,000,000 150.0% 180,012,428 31,611,560 17.6% 138,540,986 112,723,033 81.4%
Education, Gender, Culture and & Sports 320,945,640 98,208,324 30.6% 371,000,000 166,733,169 44.9% 47,795,773 51,296,178 107.3%
Water, Environment & Natural Resources 111,800,000 3,389,500 3.0% 210,020,000 43,117,971 20.5% 118,034,019 76,796,263 65.1%
Energy and Mining 44,400,000 30,000,000 67.6%
ICT and Communication 130,000,000 49,342,903 38.0% 119,816,624 85,404,160 71.3%
County Public Service Board
City of Kisumu 90,000,000 17,765,411 19.7% 16,350,000 2,862,708 17.5%
County Assembly
Total Development Expenditure 2,851,015,472 1,346,359,705 72.2% 4,033,674,706 1,828,675,029 66.80% 3,164,597,405 1,836,200,229 58.0%
72 Kisumu County Integrated Development Plan | 2018 – 2022
3.2.2 Development Expenditure Analysis
The approved allocation increased from Kshs. 2,851,015,472 in 2014/15 to Kshs. 4,033,674,706
in 2105/16 before decreasing to Kshs. 3,164,597,405 in 2016/17. These fluctuations can be
attributed to the variations in the development allocations of the Governance and Administration
sector. It should also be noted that the County Public Service Board and the County Assembly
sectors never had any development allocation for the period under review. On the other hand,
development expenditure increased by 36.4 percent from Kshs. 1,346,359,705 in 2014/15 to
Kshs. 1,836,200,229 in 2016/17.
Development Absorption Rates
The Development Budget absorption rate reduced from 72.2 percent in 2014/15 to 66.8 percent
in 2015/16 before increasing to 71.2 percent in 2016/17. The fluctuations in the absorption rates
can be attributed to changes in the Land, Housing and Physical Planning sectors’ absorptions
rates during the period under review. These rates dropped from 26.8 percent in 2014/15to 0
percent in 2015/16 before shooting to 47.9 percent in 2016/17.
Figure 7: Development Expenditure Absorption Rate

73 Kisumu County Integrated Development Plan | 2018 – 2022
0.00%
20.00%
40.00%
60.00%
80.00%
100.00%
120.00%
140.00%
160.00%
Ab
sorp
tio
n R
ate
Sectors
Development Expenditure Absorption Rate
FY 2014/15 FY 2015/16 FY 2016/17
The above figure indicates that most of sectors had variations in development absorption rates
for the period under review. The sectors with significant variations are as highlighted below:
Health
This sector recorded zero percent absorption in 2014/15, 31 percent in 2015/16 before shooting
to 102.2 percent in 2016/2017.
Tourism
The sector recorded a 0.3 percent absorption rate in 2014/15, this increased to 36.2 percent in
2015/16 and finally to 75.4 percent in 2016/17.
Land, Housing and Physical Planning
The sector had an absorption rate of 26.8 percent in 2014/15, this dropped to zero percent in
2015/16 before increasing to 47.9 percent in 2016/17.
Agriculture, Livestock and Fisheries

74 Kisumu County Integrated Development Plan | 2018 – 2022
The sector recorded an abnormal development absorption rate of 150 percent in 20015/16. This
dropped drastically to 17.6 percent in 2015/16 and rose again to 81.4 percent in 2016/17.
Education Gender, Culture and Sports
This sector had an upward trend in development absorption rates from 30.6 percent in 2014/15,
44.9 percent in 2015/16 to 107.3 percent in 2016/17.
City of Kisumu
The sector recorded a zero percent absorption rate in 2014/15, 19.7 percent in 2015/16 before
dropping to 17.5 percent in 2016/17.
Information, Communication and Technology
The sector recorded a zero percent absorption rate in 2014/15, before increasing steadily in the
subsequent years with absorption rates of 38 percent in 2015/16 and 71.3 percent in 2016/2017.
3.3 Summary of key findings under the first CIDP I (2013-2017)
Overall findings:
The CIDP I was highly ambitious in terms of the number of projects that were envisaged
to be implemented
Resource mapping and CIDP I funding mechanisms were simplistic in light of the
number of magnitude of PPIs that were to be undertaken
The delivery mechanism or structure that was proposed to implement the CIDP I was
unrealistic and inconsistent with the organization structure of the County Government of
Kisumu.
Projects which were identified during public participation for the Development of the
Annual Development Plan were given prominence/ attention than those originally in the
CIDP I
Specific findings
Lessons learnt and way forward.
The often trust deficit between the Executive and the Assembly largely over
disagreements on the budget should be addressed through a joint induction training on the
role and responsibilities in budgeting and public policy making. Regular joint bonding
75 Kisumu County Integrated Development Plan | 2018 – 2022
events may also be considered to build trust and confidence between the two levels of
government
Projects proposed in CIDP II should be realistically implemented based on realistic
revenue projections. This will also need to be prioritized to promote economies of scales.
The County should sensitize the citizens on the devolved functions and their role in the
identification and implementation of projects, programs and initiatives

76 Kisumu County Integrated Development Plan | 2018 – 2022
CHAPTER FOUR
COUNTY DEVELOPMENT PRIORITIES AND STRATEGIES

77 Kisumu County Integrated Development Plan | 2018 – 2022
4.0 Introduction
This chapter discusses the County spatial development framework to support economic and sectoral
planning within which development projects and programmes will be implemented. It entails an
assessment of natural resources within the County, key County’s development gaps/issues and strategies,
projects and programmes as identified by stakeholders in the County.

78 Kisumu County Integrated Development Plan | 2018 – 2022
4.1 County Spatial Development Framework
Table 35: County Spatial Development Strategies by Thematic Areas
Thematic Area Development Issues/Concerns Policy Strategy/ Intervention Potential
Geographical
Areas
Lead
Agencies/
Departments
a)Revitalization of
agriculture
Irrigation
Low acreage under irrigation. The
current area under Irrigation is
10,204 Ha (NIB schemes - 4162Ha
Smallholder schemes 6042 Ha)
being (42%) of the rice growing
potential areas
Irrigation potential of other river
basins within the County has not
been adequately exploited.
Rehabilitation and expansion of
existing schemes
Construction of new Irrigation
projects
All existing
natural river
basins (R.
Nyando,
Awach Kano
and Ombeyi)
and along
Lake Victoria
shore
CGK-
irrigation
CGK-
Agriculture
LBDA
NIB
GoK
Sugarcane
High cost of production
Poor factory performance( Human,
processing technology,)
Lack of quality research and advice
from extension officers
Poor sugarcane (cuttings) varieties
Weak Farmers Co-operative
Societies
Lack of political goodwill
Poor road infrastructure
Provision of subsidized farm
input; fertilizers, cuttings and
early land preparation
Improve rural infrastructure
Provide high value varieties ( fast
maturing and high sugar content)
Proper land adjudication and
demarcation
Use innovative financing
Instruments and insurance
scheme.
Muhoroni
Kisumu East
Nyando
CGK-
Agriculture
CGK-Co-
operative
Sugar Research
AFFA
Sugar Millers
Weights and
measures-
Trade
Livestock and Insecurity and stock-theft in Provide Multiplication centres for Kisumu West CGK-

79 Kisumu County Integrated Development Plan | 2018 – 2022
Thematic Area Development Issues/Concerns Policy Strategy/ Intervention Potential
Geographical
Areas
Lead
Agencies/
Departments
Veterinary Services Nyakach and Muhoroni Sub
Counties
High cost and inadequate veterinary
services and drugs
Few veterinary personnel from
government
Inability to control livestock
diseases
High cost or unavailability of
breeding stock
farmers
Provision of Livestock extension
services
Increase security personnel
especially in Nyakach and
Muhoroni
Build more cattle dips/ crash pens
to tackle livestock diseases
Muhoroni
Nyakach
Livestock
CGK-
Veterinary
Services
KALRO
Fishing Waste water management
Eutrophication
Insufficient infrastructure
Acidification
Environment degradation in the
lake
Decline in fish stocks due to
pollution,
Use of illegal fishing gears
Mechanical removal of water
hyacinth and hippo grass
Provision of free fingerlings
Cage fishing
Construction of modern fish
bandas with adequate cooling
facility
Seme
Nyando
Nyakach
Kisumu
Central
Kisumu West
CGK- Fisheries
Kenya Marine
Environment
(CGK & GoK)
b)Environmental
Conservation
Flood control and land
reclamation
Perennial flooding in Nyando and
Nyakach Sub- Counties
Massive Soil erosion and land
degradation
Construction of Multipurpose
dams
Construction of dykes
Fence off the degraded land from
roaming animals to allow
conservation to pick up.
Site specific
at Koru on (R.
Nyando) and
Nandi forest
near Kapsabet
on (R. Yala)
LBDA
CGK- Climate
change
LVEMP/LVBC
NEMA

80 Kisumu County Integrated Development Plan | 2018 – 2022
Thematic Area Development Issues/Concerns Policy Strategy/ Intervention Potential
Geographical
Areas
Lead
Agencies/
Departments
Site specific
on R. Asawo,
R. Mbogo, R.
Mugru, R.
Awach-Seme
and R. Kisian.
All wards in
the County
Five Sub-
Counties of
Nyakach,
Muhoroni,
Kisumu West
and Seme
KFS
(NETFUND)
Water and
Irrigation
Waste Management and
Pollution Inadequate measures to manage
solid waste, degraded landscape,
and to control air and noise
pollution. Also, there is low
awareness level on environmental
conservation benefits.
Water pollution.
Review and Operationalize
County Policy on SWM
Develop and operationalized
Landscape management policy
Operationalize the national
policies on pollution of air, water
and noise.
Collaborate in completion and
implementation of County
Climate Change Policy.
Mainstreaming environmental
safeguards in county development
projects e.g. EIA
Strengthen environmental
County wide CGK-
Environment
Depart.
LVEMP/LVBC
NEMA
LBDA
WRA
KFS
NETFUND
Kenya
Maritime
Authority

81 Kisumu County Integrated Development Plan | 2018 – 2022
Thematic Area Development Issues/Concerns Policy Strategy/ Intervention Potential
Geographical
Areas
Lead
Agencies/
Departments
education and innovations for
sustainable development.
Natural
Resources(Afforestation) Low tree cover,
Threatened biodiversity,
Afforestation
Promote ecosystem based
adaptation to climate change.
Protect, conserve and enhance
county natural resources.
Promote sustainable use of
Environment and Natural
Resources (ENR)
Biodiversity conservation
Wildlife resources management
and conservation.
Forestry research and
development
County Wide KEFRI
CGK-Envi.
Depart.
LVEMP/LVBC
NEMA
LBDA
WRA
KFS
NETFUND
Kenya
Maritime
Authority
Water Low household water coverage Increase access to safe water
supply in rural areas.
Promote and scale up rainwater
harvesting at household, public
institutions and community level.
Seme
Nyakach
Nyando
c)Industrialization
Fish processing Pollution and overfishing.
Decline in fish production.
Closure of fish processing
companies.
.Promotion of cage fishing
Adopt the national fishing Conrol
guideline and regulation
Enforce the national fiching
control laws.
Seme
Kisumu West
Nyando
Kisumu
Central
CGK- fisheries
CGK- Industry

82 Kisumu County Integrated Development Plan | 2018 – 2022
Thematic Area Development Issues/Concerns Policy Strategy/ Intervention Potential
Geographical
Areas
Lead
Agencies/
Departments
Cotton Milling Collapse of the KICOMI industry
Lack of political goodwill to
promote cotton processing in the
county
Revive cotton farming industry in
the county.
Provision of input subsidies to
cotton farmers.
Give farmers forward contracts in
the commodities market.
Nyakach
Muhoroni
CGK-
Agriculture
CGK- Industry
Sugar milling Mismanagement of the State-
owned millers
Heavy farmers debts
Obselete machineries
Inadequate cane for processing
Debt-write-off for the State-
owned Millers
Investment in modern milling
equipments
Timely payment for cane farmers
Consolidate small scale plots into
blocks to enjoy the economies of
scale.
Construct light rails for
transporting the cane to the
factory.
Partner with efficient cane
processors to put up new factories
and introduce new technology
County
Leadership.
CGK-
Agriculture
GoK
Energy
High cost and unreliable hydro-
electric power.
Inadequate technology for
alternative power sources.
Develop renewable energy
including: Hydropower energy ,
Biomass .Solar energy , Mini-
hydro , Wind , Agro-waste
Municipal waste .
Promote use of alternative sources
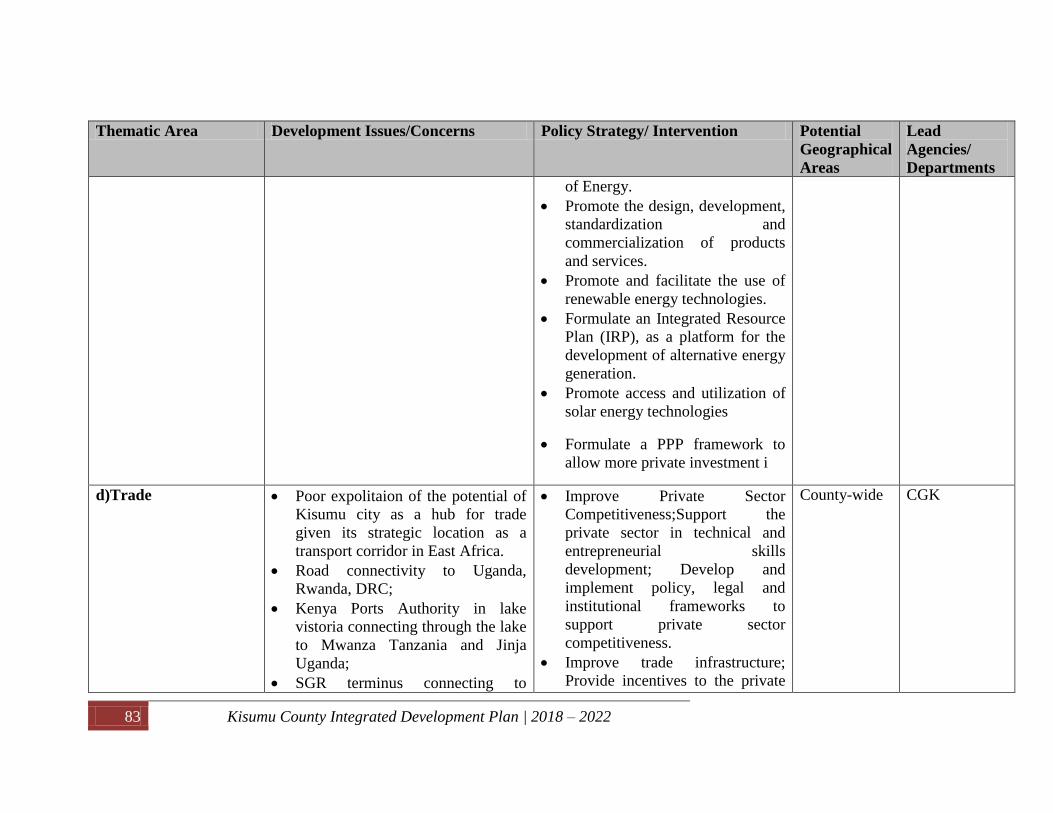
83 Kisumu County Integrated Development Plan | 2018 – 2022
Thematic Area Development Issues/Concerns Policy Strategy/ Intervention Potential
Geographical
Areas
Lead
Agencies/
Departments
of Energy.
Promote the design, development,
standardization and
commercialization of products
and services.
Promote and facilitate the use of
renewable energy technologies.
Formulate an Integrated Resource
Plan (IRP), as a platform for the
development of alternative energy
generation.
Promote access and utilization of
solar energy technologies
Formulate a PPP framework to
allow more private investment i
d)Trade Poor expolitaion of the potential of
Kisumu city as a hub for trade
given its strategic location as a
transport corridor in East Africa.
Road connectivity to Uganda,
Rwanda, DRC;
Kenya Ports Authority in lake
vistoria connecting through the lake
to Mwanza Tanzania and Jinja
Uganda;
SGR terminus connecting to
Improve Private Sector
Competitiveness;Support the
private sector in technical and
entrepreneurial skills
development; Develop and
implement policy, legal and
institutional frameworks to
support private sector
competitiveness.
Improve trade infrastructure;
Provide incentives to the private
County-wide CGK

84 Kisumu County Integrated Development Plan | 2018 – 2022
Thematic Area Development Issues/Concerns Policy Strategy/ Intervention Potential
Geographical
Areas
Lead
Agencies/
Departments
Nairobi and Mombasa ports;
International Airport.
Kisumu County has a number of
urban areas that are growing
rapidly. These include; Kisumu
city, Ahero, Katito, Maseno, Awasi,
Chemelil, Sondu, Pap-Onditi,
Kombewa and Holo.
sector to invest in trade
infrastructure
Micro, Small, Medium
Entreprises Lack of secure property rights and
security of tenure of businesses
Lack of confidence to reinvest in
their enterprises
Limited access to external finance.
Delays in issuance of business
permits
Develop modern markets or malls
and lock-up outlets.
Establish market and
technological linkages.
Provision of affordable credit
facilities.
Paperless trade within the county.
Provision of world class
connectivity at competitive prices.
Put in place wide area network
connectivity to connect all
counties institutions
Promote standardization and
commercialization of products
and services.
County-wide CGK-
Entreprise
Development
CGK- Trade
Cooperative and
Marketing Weak Co-operatives Societies
Mismangement of Co-operatives
Socities
Promote growth of cooperative
Societies Popularize, disseminate
and implement the County
Cooperative Development Policy;
County-wide CGK- Co-
operative

85 Kisumu County Integrated Development Plan | 2018 – 2022
Thematic Area Development Issues/Concerns Policy Strategy/ Intervention Potential
Geographical
Areas
Lead
Agencies/
Departments
Strengthen governance of the
cooperative movement and
commodity marketing
infrastructure;
Improve access to financial
services for the co-operative
institutions and promote
collective marketing.
Supervision and and audit of
cooperative societies regularly.
Enhance the capacity of
cooperatives. Support farmers in
enterprise selection through
provision of advisory services to
the different categories of farmer
cooperatives.
Support and facilitate cooperative
society members to mechanize.
Increase diversity of
Cooperatives
e) Tourism
Diversifying Tourism,
Creative arts & Culture
and Sports Development
Poor marketing of the County as a
tourist destination in response to the
Global demand.
Security, Transport, and
Environmental pollution.
Lack of proper structures for
To open up the waterfront for
commercialized cultural activities.
Build one big modern arts and
theatre
Support arts and theatre groups at
the Sub-County level.
Countywide
Game Parks
CBTE sites
Recreational
parks
Lake
excursions
CGK-Tourism
Lake Victoria
Tourism
Association
LBDA
Tourism
Regulatory
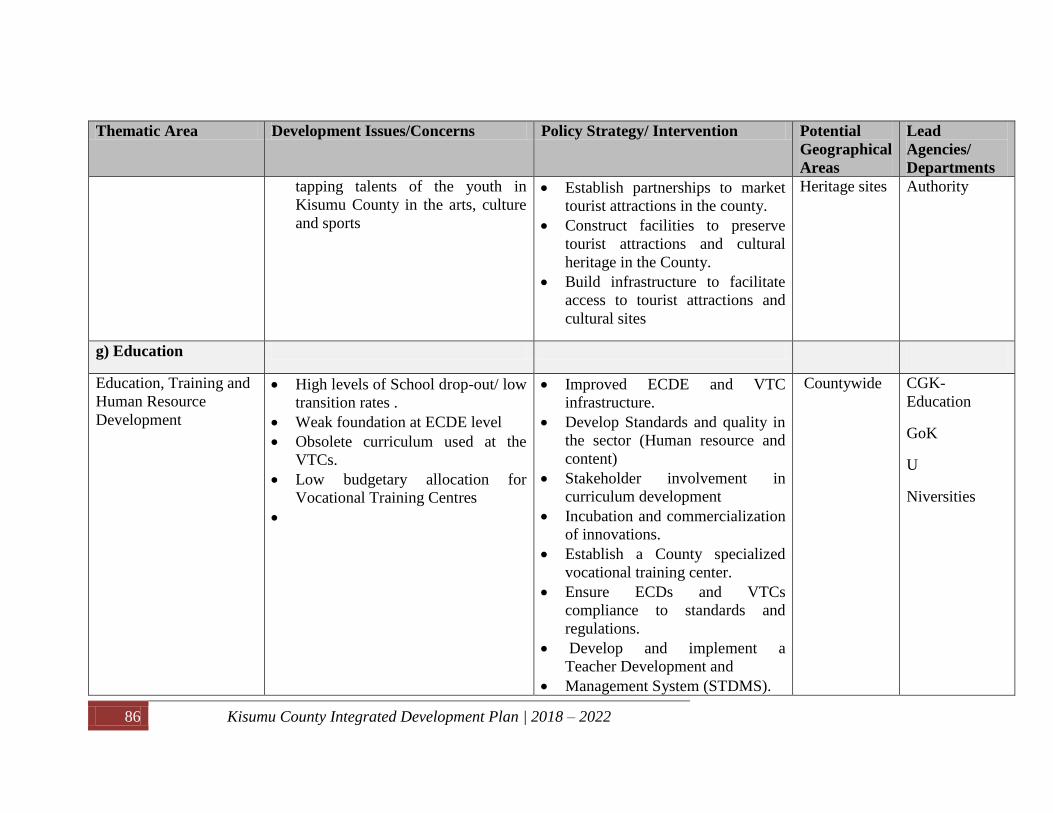
86 Kisumu County Integrated Development Plan | 2018 – 2022
Thematic Area Development Issues/Concerns Policy Strategy/ Intervention Potential
Geographical
Areas
Lead
Agencies/
Departments
tapping talents of the youth in
Kisumu County in the arts, culture
and sports
Establish partnerships to market
tourist attractions in the county.
Construct facilities to preserve
tourist attractions and cultural
heritage in the County.
Build infrastructure to facilitate
access to tourist attractions and
cultural sites
Heritage sites
Authority
g) Education
Education, Training and
Human Resource
Development
High levels of School drop-out/ low
transition rates .
Weak foundation at ECDE level
Obsolete curriculum used at the
VTCs.
Low budgetary allocation for
Vocational Training Centres
Improved ECDE and VTC
infrastructure.
Develop Standards and quality in
the sector (Human resource and
content)
Stakeholder involvement in
curriculum development
Incubation and commercialization
of innovations.
Establish a County specialized
vocational training center.
Ensure ECDs and VTCs
compliance to standards and
regulations.
Develop and implement a
Teacher Development and
Management System (STDMS).
Countywide CGK-
Education
GoK
U
Niversities

87 Kisumu County Integrated Development Plan | 2018 – 2022
Thematic Area Development Issues/Concerns Policy Strategy/ Intervention Potential
Geographical
Areas
Lead
Agencies/
Departments
Establish VTC centers of
excellence per sub-county.
Institutionalize internship and
apprenticeship for hands-on
training.
Promote establishment of
research, innovation and
technology Incubation centres.
To promote HIV/ AIDS
prevention, care and treatment.
Mainstream HIV/AIDS issues in
sector Planning, Budgeting,
Implementation,
h)Health
Inadequate basic medical supplies
in health facilities
Inadequate health personnel.
Lack of structured support to the
CHVs
Increased risk of poor sexual and
reproductive health outcomes
High fertility and associated high
child dependency burdens
Persistent socio-cultural and
religious beliefs and practices that
Enhanced supply of drugs to
facilities
Provision of free emergency
referral ambulance services to all
Kisumu residents.
Structured compensation and
facilitation of CHVs.
Recruitment and deployment of
health personnel.
Carrying out reproductive health
education.
County Wide CGK- Health
and sanitation
GoK

88 Kisumu County Integrated Development Plan | 2018 – 2022
Thematic Area Development Issues/Concerns Policy Strategy/ Intervention Potential
Geographical
Areas
Lead
Agencies/
Departments
curtails health- outcomes
Maternal health and mortality rate
Child health and mortality rates.
High HIV/AIDS prevalence.
Health risk factors associated with
lifestyle which includes harmful
use of alcohol, unhealthy diet and
physical inactivity.
Public Health Concerns
Un-affordable and in accessible
health-care
Improved HIV/AIDS services and
budgetary allocation.
Investing in preventive care
through regular tests and
screening exercises.
Promotion of public awareness
and healthy living through
education in school and
communities
Completion of stalled health
facilities.
Improving sanitation and
environmental health services
Embrace PPP in provision of
health- care.
Establishing a universal health
insurance scheme.
Improved health infrastructure
and equipments.
i)Lands, Physical
Planning, housing and
Urban development
Housing and urban
development
Unprecedented demographic,
environmental, economic, social
and spatial challenges
Poor and inadequate housing.
Development of County Spatial
Plan
Installation of Traffic
Management Infrastructure.
Development and redevelopment
Kisumu City
Maseno
Ahero
CGK- lands,
Physical
planning,
Housing and
urban

89 Kisumu County Integrated Development Plan | 2018 – 2022
Thematic Area Development Issues/Concerns Policy Strategy/ Intervention Potential
Geographical
Areas
Lead
Agencies/
Departments
Poor drainage system within the
City CBD and other major towns
Rapid spread of informal
settlements within the City and
upcoming urban areas.
Traffic congestion in the CBD
Lack of recreational facilities in
upcoming urban areas.
Insecurity
Poor Solid Waste Management
Dilapidated urban housing and
Infrastructure
Rapid urbanisation trends coupled
with low investment in
infrastructure impacting enormous
pressure in the urban environment
of affordable housing
Redevelopment of the Lake front
project.
Re- designed Urban Plan for the
City.
Improved infrastructure in
informal settlements
Solid Waste Management
Muhoroni
Chemelil
Awasi
Katito
Kombewa
Development
City of
Kisumu
Lands Land is grossly underutilized with
sparse or no development.
Lack of property rights
Ineffiective land use
Enforcement of the National Land
Act
Nyakach
Seme
j) Roads, Transport and
Public works
Poor and inefficient road network
within urban and rural areas.
Under-utilization of the Lake as
mode of transport.
Develop adequate, reliable and
efficient multi-modal transport
network in the County- light rail
system in sugar-belt region
Urban
Estates(
Kisumu City)
CGK-Roads,
Transport and
Public Works

90 Kisumu County Integrated Development Plan | 2018 – 2022
Thematic Area Development Issues/Concerns Policy Strategy/ Intervention Potential
Geographical
Areas
Lead
Agencies/
Departments
High cost of transport
Poor workmanship in construction
and civil works
Expansion of the Kisumu
International Airport.
Establishment of the County
Roads Maintenance Board.
Designing specialized public
transport facilities for people
with disabilities.
Rehabilitate and maintain the
County, Urban, and rural Access
road network.
Construct new and rehabilitate
old bridges.and foot paths .
Develop and implement
mechanisms to ensure that the
existing and future transport
infrastructure is climate change
resilient.
To promote HIV nad AIDS
prevention, care and treatment.
Mainstream HIV/AIDS issues in
sector Planning, Budg
KeRRA
KURA
KISIP
KeNHA
Water, Irrigation
Environment and
Natural Resources

91 Kisumu County Integrated Development Plan | 2018 – 2022
Thematic Area Development Issues/Concerns Policy Strategy/ Intervention Potential
Geographical
Areas
Lead
Agencies/
Departments
Environment Discharge of raw waste into the
lake
Invasion of water hyacinth and
hippo grass.
Rapid urbanisation trends coupled
with low investment in
infrastructure impacting enormous
pressure in the urban environment.
Weak coordination mechanisms in
the implementation of
environmental conservation role..
Poor Solid Waste Management.
Enforcement of the waste
management.
Afforestation and water
conservation
Improve on solid waste
management.
Regulate and enforce proper
environmental impact assessment
codes before construction.
Information and
Communication
Slow embrace of the ICT platform.
Improvement of connectivity
across the County.

92 Kisumu County Integrated Development Plan | 2018 – 2022
. 4.2 Natural Resource Assessment
Table 36: Natural Resource Assessment
Name of
Natural
Resource
Dependent Sectors Status, Level of
Utilization &
Scenarios for future
Opportunities for
optimal utilization
Constraints to optimal
utilization
Sustainable Management
strategies
Lake Victoria Fisheries
Tourism
Irrigation
Agriculture
Livestock
Declining water
levels – expected to
further decline with
expansion of
horticulture sector
Water quality
expected to decline
due to increased
farming activities
and industrial
discharge
Cage fish culture
fishing.
Horticultural crop
farming
Irrigated Agriculture
Water
sports/tourism
Invasion of the water
hyacinth and hippo grass
Disposal of raw waste into
the lake
Lack of harmonized law for
lake basin region
Unregulated reclamation of
the lake
Pollution in the lake
Monitoring of water levels
and quality
Regulate waste water and
effluents from farms and
industries
Enactment of harmonized
laws
Lake surveillance
River nyando,
River kisati.
Nyamasaria
river,
River Kisian,
River awach,
sondu miriu,
River sinyolo
(daraja river)
Irrigation
Mining
Fisheries
Tourism
Irrigation
Agriculture
Livestock
WARA
Over utilized up
stream
Rampant sand
harvesting;
River bank
degradation,
Erosion in
downstream
Can support more
food production
through irrigation;
Fish farming
Domestic and
livestock use
Horticultural
crop farming
Irrigated
Agriculture
Fish farming
Upstream damming;
Nitrification; deforestation
along the river banks
Pollution of the rivers eg
effluent
Receding of water levels eg
seasonal rivers
Over exploitation on sand
harvesting.
Legal and policy
enforcement
River rehabilitation
programme
Control utilization of
sand harvesting and
water
River bank protection
measures
Conservation of
catchment
Water resource
authority for
regulation purposes
Land Irrigation
• Fisheries
• Irrigation
• Agriculture
County is well
endowed with land of
high and medium
agricultural potential; a
substantial area of this
Horticultural
crop farming
Irrigated
Agriculture
Fish farming
Demarcation of land
to small units
Low adoption of new
technology in
agricultural

93 Kisumu County Integrated Development Plan | 2018 – 2022
Name of
Natural
Resource
Dependent Sectors Status, Level of
Utilization &
Scenarios for future
Opportunities for
optimal utilization
Constraints to optimal
utilization
Sustainable Management
strategies
• Livestock
productive agricultural
land is cropped with
subsistence crops. The
county to date has not
fully exploited the land
for agricultural
production as only
50% of land is
currently being used
production
High cost of farm
inputs

94 Kisumu County Integrated Development Plan | 2018 – 2022
4.3 DEVELOPMENT PRIORITIES AND STRATEGIES
4.3.1 GOVERNANCE AND ADMINISTRATION
Sector Introduction
Governance and Administration:
This sector is divided into three broad sub sectors of Office of the Governor, Office of the
County Secretary and the County Law office and Administration of Justice. It is charged with the
responsibilities of policy formulation, coordination, human resource management and
development and overseeing County programmes implementation
Office of the Governor
The executive office of the Governor includes the Governor, the Deputy Governor, the County
Executive Committee, the County Secretary, the Chief of Personnel and Special Delivery Unit.
The Governor provides leadership in governance and development promotes democracy,
cohesion, the County’s competitiveness and facilitates citizen participation in development of
policies, programmes and delivery of services in the county. Whereas the County government
structure has been devolved to the ward level, the people are yet to realize the full potential of
devolution as envisaged in the County Government Act, 2012
The office of the governor is currently working on strengthening devolution up to the village
level through the formation of the village councils. This will entail playing a major role in
coordination and implementation of all policies at the grassroot level. Other critical services will
be ensuring service delivery by all County departments, handling emergencies when they occur.
Special Delivery Unit
The SDU’s mission is to assist the County Government of Kisumu to deliver improved, more
efficient and effective services to the residents, by: maximizing delivery of government’s top
priorities; Tracking progress of departmental commitments; Troubleshooting emerging
implementation issues. ( annex)
Investment and Resources Mobilization Unit

95 Kisumu County Integrated Development Plan | 2018 – 2022
The IRM is a directorate which plays a critical role of driving the County’s economic growth
agenda through attraction of Foreign Direct Investments, domestic investments, facilitation of
expansions and further spearheading the growth of locally manufactured goods, exports
promotion to regional and international markets.
Office of the County Secretary
This office is charged with the responsibility of management of the County Public Service.
The human resource function faces both internal and external challenges. Internally the
existence of four categories of employees: defunct local authorities’ personnel, national
government devolved personnel, County Public Service Board recruited personnel and state
officers with different pay scales and different ranks within the same functional area pose a big
challenge on employees’ morale. Additionally, there are cases where employees in lower
grades earn more than their seniors or those with less experience earning more than those with
more experience largely because of the route through which they came to the service.
Externally, some personnel who were legally devolved are still under the national government
which still pays and transfers them.
An efficient, motivated and well-trained public service will be one of the major foundations of
the CIDP II. The County will build a public service that is citizen-focused, results-oriented
with zero tolerance to corruption. The County will intensify efforts to bring about an attitudinal
change in public service that values transparency and accountability to the residents of Kisumu
County. Results-based management and performance contracting will be pegged to the
implementation of the sector’s goals.
County Law Office and Administration of Justice
The County law office is a legal unit in the County Government of Kisumu which provides legal
advice to all the departments and sectors. Currently the County law and Administration of Justice
office is not anchored under any County legislative instruments despite performing functions that
are vital to the execution of the County mandates. The unit continues to incur huge debts arising
out of engagement of external legal services, a situation that could be addressed by
commensurate allocations in legal personnel and resources.

96 Kisumu County Integrated Development Plan | 2018 – 2022
The functions include but are not limited to dealing with day to day intra-departmental matters
which call for legal direction and ensuring that all legislative instruments are in adherence to the
County Policy guidelines and resolve any conflicts that may arise between policy guidelines and
County laws.
The Unit is also involved in monitoring continuous evolution of laws based both on statutory and
judicial decisions and making sure that the County keeps abreast with changing legal trends and
with key legislative mandates.
Vision
To be a leading governance entity in the provision of excellent leadership and service delivery
for the prosperity of Kisumu County
Mission
To provide strategic leadership, policy direction and set the agenda for achieving social,
economic, and political development of our people
Sector Goal: To ensure efficient and effective service delivery to residents of Kisumu County
through provision of strategic leadership, policy direction and setting the agenda for achieving
social, economic and political development needs
Sector/subsector Development needs, Priorities and Strategies
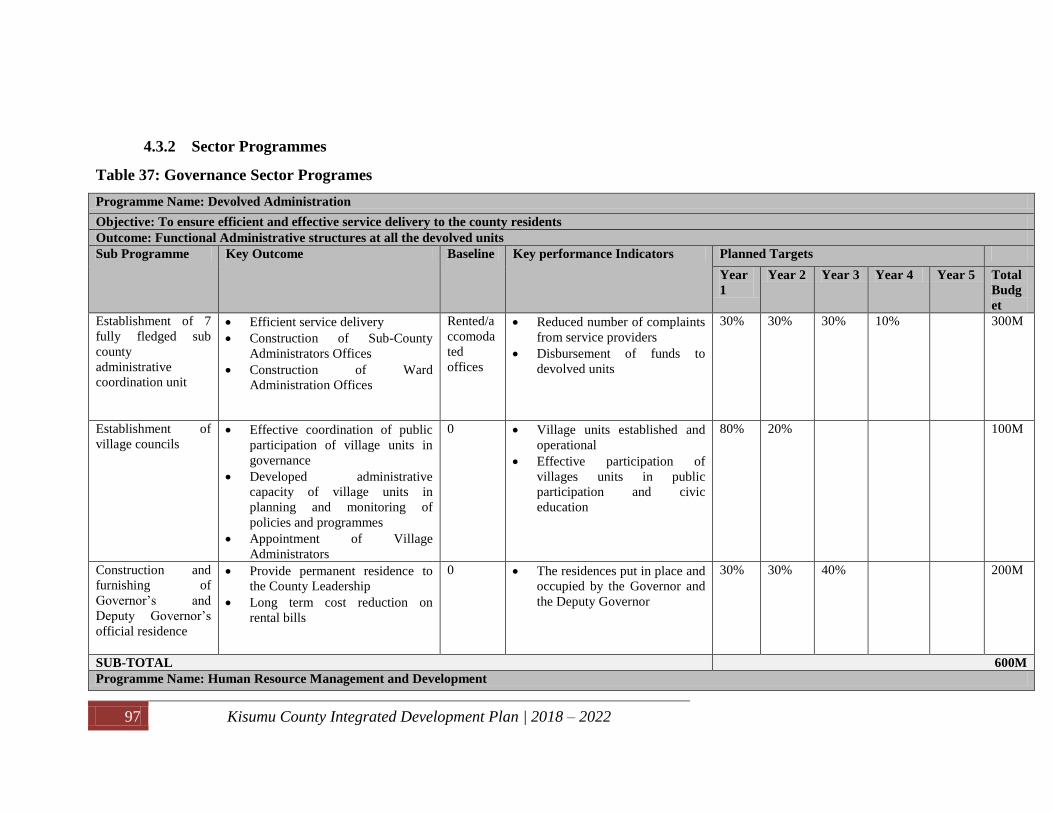
97 Kisumu County Integrated Development Plan | 2018 – 2022
4.3.2 Sector Programmes
Table 37: Governance Sector Programes
Programme Name: Devolved Administration
Objective: To ensure efficient and effective service delivery to the county residents
Outcome: Functional Administrative structures at all the devolved units
Sub Programme Key Outcome Baseline Key performance Indicators Planned Targets
Year
1
Year 2 Year 3 Year 4 Year 5 Total
Budg
et
Establishment of 7
fully fledged sub
county
administrative
coordination unit
Efficient service delivery
Construction of Sub-County
Administrators Offices
Construction of Ward
Administration Offices
Rented/a
ccomoda
ted
offices
Reduced number of complaints
from service providers
Disbursement of funds to
devolved units
30% 30% 30% 10% 300M
Establishment of
village councils Effective coordination of public
participation of village units in
governance
Developed administrative
capacity of village units in
planning and monitoring of
policies and programmes
Appointment of Village
Administrators
0 Village units established and
operational
Effective participation of
villages units in public
participation and civic
education
80% 20% 100M
Construction and
furnishing of
Governor’s and
Deputy Governor’s
official residence
Provide permanent residence to
the County Leadership
Long term cost reduction on
rental bills
0 The residences put in place and
occupied by the Governor and
the Deputy Governor
30% 30% 40% 200M
SUB-TOTAL 600M
Programme Name: Human Resource Management and Development

98 Kisumu County Integrated Development Plan | 2018 – 2022
Objective: To ensure efficient and effective delivery of Human Resource Services for optimum productivity
Outcome: Optimum productivity
Sub Programme Key Outcome Baseline Key performance Indicators Planned Targets
Year
1
Year
2
Year
3
Year
4
Year
5
Total
Budget
HR Planning Approved/functional Organograms
Personnel Establishment
Personnel Job Descriptions and
Specifications
Personnel Competencies profile
HR Audit
Reviewed HR policies
30% HR organograms in place
Job descriptions developed and
signed by every officer
HR Audit report
Policy documents in place
40% 30% - - - 30M
Training & Capacity
Building
Training programs and plans in
place
Well trained, competent work force
Higher productivity
5% Training Needs Assessment
report
Training programs undertaken
10% 25% 25% 25% 10% 700M
Rationalization and
Harmonization of
County personnel
pay structures
Harmonized pay structures
Merit based timely promotions
Cleaned Payroll
30% Reduced personnel complains
on salary issues
Number of officers promoted
Reduced Audit queries of
payroll
20% 20% 20% 10% 150M
Performance
Management
Development of implementable
performance contracting system
Verifiable Performance Appraisal
System
Establishing Biometric Attendance
Management
5% Executed performance
contracts
Executed performance
appraisals for all personnel
Biometric attendance
management procured and
installed
10% 30% 30% 25% - 50M
Records
Management
Establishment of County Human
Resource Management Information
System (CHRMIS)
Digitalization of records
Realization well organized registry
Decentralized back up records
0 Reduced time taken to access
HR information
Easy and accurate reporting
10% 30% 30% 30% 100M
Recruitment and Proper enforcement of county 5% 1000 County enforcement 50% 30% 15% 0% 200M

99 Kisumu County Integrated Development Plan | 2018 – 2022
Employment of
County enforcement
officer
policies
Enhanced security of public
amenities
officers employed and placed
Industrial Relations Improved Communication among
management, employees and third
party
Reduced personnel unrest
Clear and timely
communication of policies,
progress and organization
status report
Periodic meetings and reports
with personnel from different
sectors
50M
HR Reporting Quarterly, semiannually and annual
reports
10% Timely production of quality
HR reports
10M
SUB-TOTAL 1.29B
Programme Name: County Legal Services and Administration of Justice
Objective: To ensure respect of the rule of law and upholding justice
Outcome: Increased Awareness and Rule of Law upheld
Sub Programme Key Outcome Baseline Key performance Indicators Planned Targets
Year
1
Year 2 Year 3 Year
4
Year 5 Total
Budg
et
Personnel establishment
and functional Analysis Efficiency in Legal
matters
Analysis Report
30% No. of personnel recruited.
No. of legal documents/instruments,
opinions and briefs;
No of Policy Instruments domesticated,
harmonized in relation to Drafting Laws
No of Domesticated periodic/county
reports and in compliance with regional
and international instruments;
No. of coordinating stakeholder
consultations;
No of Laws Reviewed
10% 30% 30% 1 1 80M
Legal Administrative
Practices
Legal Reports
Transcribed court proceedings and other
recorded meetings
Scheduled, coordinated court dates,
appointments, and meetings

100 Kisumu County Integrated Development Plan | 2018 – 2022
Litigation
No of Successful handling of complex
litigation and related proceedings in the
High Court, Court of Appeal and supreme
Court
1 1 1 1 1 60M
Conveyancing Properties Acquired,
leased out and
properties sold,
mortgaged
0 Prepared legal documents that are part of
any property transaction.
Prepared Contracts of Sale/buying and
ensuring that any special conditions
required are included in final contract.
Prepared Vendor’s Statement and
premised on conducted of the title and
planning searches that go into this
final statement, so that all of the
disclosure obligations are met according
to the relevant laws.
Prepared ancillary documents that are part
of the settlement process.
Determined statutory fees that need to be
paid.
Coordinated a proper time for settlement
which entails the ideal time for both the
seller and purchaser. This will depend on
the parties’ banks and mutual convenience
Enforced promises, known as
undertakings, given by parties to the
conveyancing transaction.
0 12 15 15 0 90M
SUB-TOTAL 230M
Programme: Name: Governor’s Press Unit and Communication
Objective: Robustly and Competently improve the positive visibility of the Governor’s Office.
Outcome: Enhanced visibility of the Governor’s Office and Activities
Sub Programme Key Outcome Baselin
e
Key performance Indicators Planned Targets
Year 1 Year 2 Year 3 Year 4 Year 5 Total
Budge
t
Infrastructure development Cultivate continuous
engagement with the
0 Improve information outreach 1 1 1 1 1 30M

101 Kisumu County Integrated Development Plan | 2018 – 2022
media outlets
Install Digital
Communicators/Billb
oards at the Sub
Counties
0 1. Enhance public participation
2. Effective dissemination of government
agenda
3. Continuous public updates of the
implemented development projects
4 3 70M
Procure outdoor
Communication
equipment
0 Improve Governor’s Public
Communication
1 3M
Procure Video and
Still Cameras
0 Capture Governor’s Functions 3 6M
Procure Governor’s
Boardroom
Communication
Equipment
0 Improved meetings environment 1 5M
Procure Video
Conferencing
Equipment
0 Reduce costs of long distance meetings 1 3M
Design and
construction of
commemorative
plaque for the county
heroes
0 Enhance county patriotism and cohesion 1 20M
Organization of
County Feedback
Fora.
0 Increased public participation in
monitoring and evaluation of the
Governor’s performances
14 14 14 14 14 70M
SUB-TOTAL 207M
Programme Name: Protocol
Objective: To ensure efficient and effective service delivery in the entire county.
Outcome: Optimum productivity of the Governor’
Sub Programme Key Outcome Basel
ine
Key performance Indicators Planned Targets
Yea
r 1
Year
2
Year 3 Year 4 Year 5 Total
Budge
t
Establishment of a fully-
fledged directorate of Coordination of indoor and
outdoor Governor’s
30% Improved coordination of governor’s
activities
50% 20% 50M

102 Kisumu County Integrated Development Plan | 2018 – 2022
Protocol function
Development of diplomatic
affairs and partnership
programme.
0 Improved exchange of ideas, cultures,
and traditions, to foster
intergovernmental goodwill and
provide them greater insight and
understanding of our people, customs,
and governance.
1 20M
Establishing ceremonial
and visitations programme
0 Improved planning, execution and
support of a wide range of ceremonies
and official functions hosted by the
Governor or Deputy Governor.
1 10M
Establishment of Governor
and Deputy Governor
residential houses protocol
team.
0 Efficient management and
maintenance of the residential houses
through the office of the Director – of
– Protocol
1 1 2M
Procurement of vehicles. 1 Effective travel and airport transfers
for dignitaries.
2 3 30M
SUB-TOTAL 112M
Programme Name: Special Program
Objective: To ensure efficient and effective Disaster Preparedness, Mitigation, Response and Management and Mainstreaming of Special interest groups
Outcome: Optimum disaster management and mainstreaming of special interest groups
Sub Programme Key Outcome Baseline Key performance Indicators Planned Targets
Year
1
Year 2 Year 3 Year
4
Year 5 Total
Budg
et
Establishment of Disaster
and Risk Management
units
Efficient disaster
management
Effective and timely
disaster response and
management
0
35 disaster management units in place
2000 disaster management volunteers
trained and placed under ward disaster
management units
35
10M
0 Risk assessment, mapping, documentation
and database creation
1 15M
Disaster Management Strategic Plan 1 5M
Establishment of 3
evacuation centers in
disaster prone areas
0 Evacuation centers established as
informed by the risk assessment and
mapping report.
1 100M
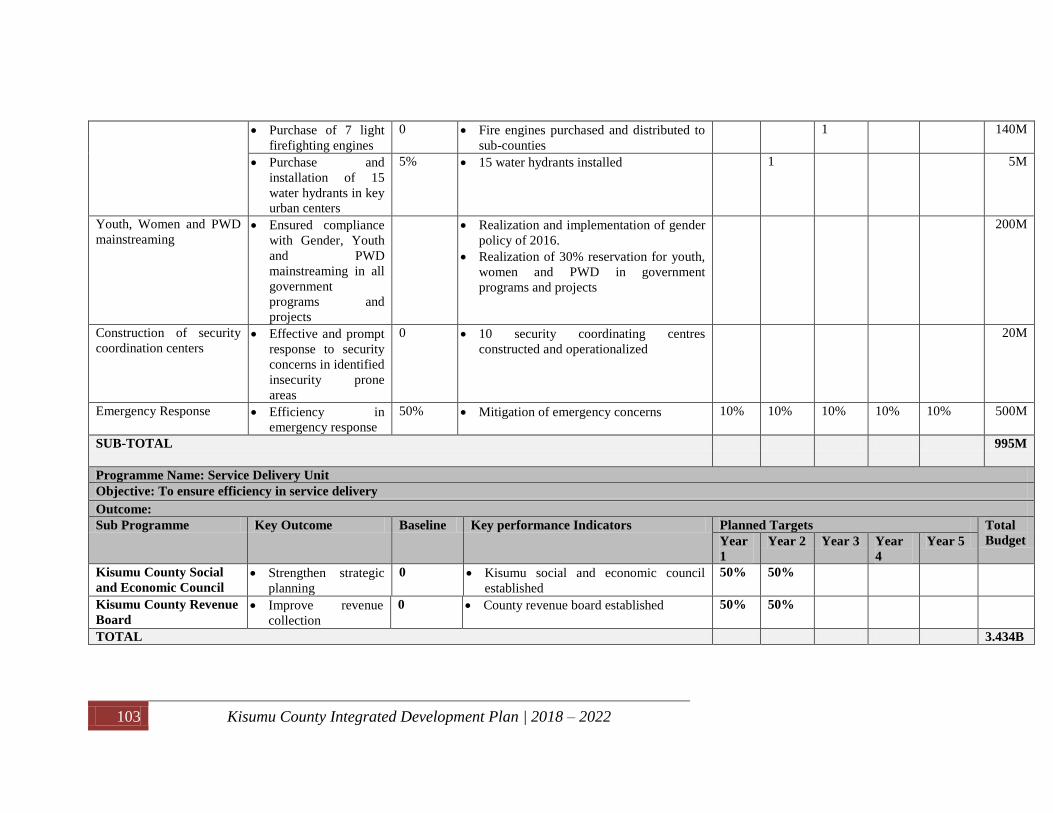
103 Kisumu County Integrated Development Plan | 2018 – 2022
Purchase of 7 light
firefighting engines
0 Fire engines purchased and distributed to
sub-counties
1 140M
Purchase and
installation of 15
water hydrants in key
urban centers
5% 15 water hydrants installed 1 5M
Youth, Women and PWD
mainstreaming Ensured compliance
with Gender, Youth
and PWD
mainstreaming in all
government
programs and
projects
Realization and implementation of gender
policy of 2016.
Realization of 30% reservation for youth,
women and PWD in government
programs and projects
200M
Construction of security
coordination centers Effective and prompt
response to security
concerns in identified
insecurity prone
areas
0 10 security coordinating centres
constructed and operationalized
20M
Emergency Response Efficiency in
emergency response
50% Mitigation of emergency concerns 10% 10% 10% 10% 10% 500M
SUB-TOTAL 995M
Programme Name: Service Delivery Unit
Objective: To ensure efficiency in service delivery
Outcome:
Sub Programme Key Outcome Baseline Key performance Indicators Planned Targets Total
Budget Year
1
Year 2 Year 3 Year
4
Year 5
Kisumu County Social
and Economic Council Strengthen strategic
planning
0 Kisumu social and economic council
established
50% 50%
Kisumu County Revenue
Board Improve revenue
collection
0 County revenue board established 50% 50%
TOTAL 3.434B

104 Kisumu County Integrated Development Plan | 2018 – 2022
4.4.2 THE COUNTY ASSEMBLY
4.4.2.1 Sector Introduction
Sector Composition:
1.6.2 County Assembly
The County Assembly is one of the two arms of the County government with the other being
the County executive. The Assembly is constitutionally mandated to undertake the legislative
oversight and representation role on behalf of the County.
In the discharge of its Constitutional mandate, the Assembly is comprised of elected and
nominated members of the County Assembly incorporating gender, youth and persons with
disability. These members are ideally assisted by a team of competent professionals and
qualified personnel led by the Assembly Clerk while the overall leader of the Assembly is the
speaker to whom the Clerk is answerable.
Whilst the Assembly is an arm of the County government, it is distinct and independent from
the executive and enjoys autonomy in the execution of its mandate and management of its
affairs. The overall supervision and conduct of the Assembly as well as ownership of its
property and policy direction overview is undertaken by the County Assembly Service Board
chaired by the Speaker. The board is equally mandated to implement the several circulars from
the various commissions that coordinate the functions of County government such as the
Salary and Remuneration Commission (SRC) and the Commission on Revenue Allocation
(CRA).
Kisumu County Assembly membership currently stands at 48 with a personneling level of 50
members against the ideal recommendation of eighty-eight (88), far below the optimum
number recommended by SRC. The Assembly hall and offices are situated within the old ADC
offices constructed at the beginning of the 20th
century, while the Speakers residence is rented.
The Assembly furniture and equipment comprise of furniture from the defunct local authority.
Presently the following situation obtains at the Assembly: -the Assembly debating chambers is
old and falling apart, the Assembly debating chambers is small and cannot comfortably seat the
forty-eight (48) members, the debating chambers are ill suited for the functions undertaken
105 Kisumu County Integrated Development Plan | 2018 – 2022
therein. Members have no offices at all and have to do with undertaking their responsibilities in
their cars or various restaurants in town thereby compromising confidentiality. The members
have no common room or recreational facilities as is the norm in Commonwealth System. The
Assembly has inadequate qualified and professional personnel to enable it competently
discharge its mandate, the few members of personnel lack adequate physical offices and
facilities to perform their duties, the Assembly does not have a residence for the Speakers
against the salaried and remuneration commission advice, the Assembly is unable to install
modern communication equipment in the County Assembly and its offices owing to
architecture and age of the offices. With the impending ward and constituency boundaries
reviews, the next Assembly will not have enough space. Worth noting is that there is no
Speaker’s or media gallery in the current Assembly. Parliament discharges 90% of its work
through committees yet committee rooms are lacking.
Vision
To be a leading, people-driven, progressive and vibrant assembly in good governance.
Mission
To promote good governance through strong representation, pro-active legislation and impartial
oversight under the devolved system of governance.

106 Kisumu County Integrated Development Plan | 2018 – 2022
4.4.2.2 Sector Programmes
Table 38: County Assebly Programmes
Programme Name: Infrastructure Development
Objective 1: To increase efficiency in service delivery
Outcome: Improved service delivery
Sub Programme Key Outcome Baseline Key
performance
Indicators
Planned Targets
Year 1 Year 2 Year 3 Year 4 Year 5 Total
Budget
Purchase of land within
the City (for the
construction of modern
County Assembly and
Speaker’s residence
Availability of land
space for construction
of the County
Assembly and
Speaker’s residence.
0% Legal title deed
for land
purchased.
Hectares of land
purchased
100% 150M
Construction of ultra-
modern Assembly
Sufficient space with
installed modern
equipment to enhance
productivity
0% Percentage of
construction
work completed
in phases.
300M 200M 300M 800M
Construction of the
speaker’s residence
Increased efficiency in
the execution of
speaker’s mandate.
0% Percentage of
construction
work completed
in phases.
50% 50% 60M
TOTAL 1.01B

107 Kisumu County Integrated Development Plan | 2018 – 2022
4.5.4 COUNTY PUBLIC SERVICE BOARD
4.5.4.1 Sector Introduction
1.7.5 County Public Service Board
Kisumu County Public Service Board (CPSB) is an independent institution established under
Article 235(1) of the Kenyan constitution. The CPSB is charged with the responsibility of
developing and implementing human resource policies and framework for the County
government in line with the relevant laws. The CPSB handles all human resource issues in the
County and consists of a Chairperson and other members nominated by the Governor and
approved by the County Assembly. The secretary to the board is a Certified Public Secretary
(CPS K) nominated by the governor and approved by the County Assembly.
The board has the responsibility of ensuring that the County Public Service has adequate skilled
and competent personnel; its functions include establishment and abolition of offices and
appointing persons to act or hold office in the public service and in the boards of cities. It also
plays a disciplinary role in the Public Service as well as reporting to the County Assembly with
regards to the public service.
Whereas the Kisumu CPSB is independent, it has heavily relied on the Governors’ budget
allocation to run its activities. It has faced challenges including operating without adequate office
accommodation; a secretariat to support its activities; inadequate transport and emerging conflict
in working cultures, discrepancy in salary structures and a negative personnel working attitude.
Vision:
A haven of excellence in County public service delivery.
Mission:
To enhance excellence in Kisumu County Public service delivery byproviding ethical and
performance driven human resource.
Sector composition:
County Public Service Board Members
Board Personnel headed by the Secretary of the Board.

108 Kisumu County Integrated Development Plan | 2018 – 2022
COUNTY PUBLIC SERVICE BOARD
Table 39: County Public Service Board Sector Programmes
Programme Name: Infrastructure Development
Objective: To Equip Youth in the Vocational Training Centre’s with Relevant Skills, Knowledge and Capacity to Engage in Meaningful Activities
Outcome: Improved access to vocational training across the county
Sub Programme Key Outcome Baseline Key
performance
Indicators
Planned Targets
Year 1 Year 2 Year 3 Year 4 Year 5 Total Budget
Construction of the
County Public
Service Board
Adminisration
Block
Conducive
environment,
efficiency and
competence when
hiring County
personnel
0 Administration
block 10 70 20 50M
Purchase of land Land purchased 0 Hectares of land
purchased 100% 100M
Construction of the
County School of
Governent
Completed training
facility for County
Civil Service
0 25% 25% 100M
TOTAL 250M

109 Kisumu County Integrated Development Plan | 2018 – 2022
4.4.3 CITY OF KISUMU
4.4.3.1 Sector Introduction
The City of Kisumu is an independent entity within the County Government of Kisumu under
the leadership of the City Manager who is answerable to the City Board who further reports
directly to the Governor. Unlike the other two Cities in Kenya where the whole city is the
County, The City of Kisumu covers only fourteen of the thirty-five wards of the County.
Vision
To be the leading City in Kenya and the entire Great Lakes Region providing innovative services
that are responsive to customer expectations.
Mission
To provide unequalled quality services matched by superior solutions, that result in creating
enabling environment for investment, with the aim of improving the quality of life of the
residents of Kisumu.
Sector composition:
General Planning and Administration – (Administration, HRM, Legal services, IT
departments)
Financial Management - (Finance department)
Engineering, Planning and Housing - (Engineering, Planning and Housing
departments)
Environmental and natural resources management - (Environmental department)
Education and Social services - (Education and Social services departments)
Public Health - (Public Health department)

110 Kisumu County Integrated Development Plan | 2018 – 2022
4.4.3.2 Sector Programmes
Table 40: Kisumu City Programmes
Programme Name: Financial Management
Objective: To improve Financial management in the City of Kisumu
Outcome: Improved revenue within the City of Kisumu
Sub Programme Key Outcome Baseline Key performance
Indicators
Planned Targets
Year
1
Year
2
Year
3
Year
4
Year
5
Total
Budget
KES
Full Automation of
revenue collection
Improved revenue
collection
A mix of both
manual &
automated
systems of
revenue
collection
No. of revenue
streams automated
100% 100M
Modernize 10 minor
Markets within the City
Improved revenue 20% No. of markets
rehabilitated/impro
ved
30% 20% 20% 10% 50M
Designate, pave and
mark all street parking
spaces
Improved service and
revenue collection
30% No. of parking slots
designated and
paved
20% 20% 20% 10% 100M
Revision of City
valuation roll
To capture additional
5000 parcels not in
the current Valuation
Roll
60% Approved
Valuation Roll
2018
30% 10% 50M
Upgrade Jua kali sheds Improved work
environment for the
Jua kali artisans
Improved revenue
collection
20%
Upgraded Jua kali
sheds
20% 20% 10% 10% 10% 150M
SUB-TOTAL 450M

111 Kisumu County Integrated Development Plan | 2018 – 2022
Programme Name: Environment and natural resources management
Programme Name: Engineering, Planning and Housing
Objective: To improve Land, infrastructure and housing Management in the City
Outcome: Improved infrastructure orderly development within the City
Sub Programme Key Outcome Baseline Key Performance
Indicators
Planned Targets
Year 1 Year
2
Year 3 Year 4 Year 5 Total
KES
Installation of surveillance
cameras
Enhanced security No surveillance cameras No. of cameras installed 100M 100M
Installation of storm water
drainage facilities within
the City
Reduced flooding 20% Length of drainage
constructed
20% 20% 20% 20% 200M
Installation of traffic lights Reduced traffic
jams
00%
No. of traffic lights installed 100% 100M
Develop cycle foot paths
and souks
-To improve trade
and road safety
20%
No of paved foot paths and
cycle lanes
Km of footpaths covered.
No of souks constructed
30% 20% 20% 300M
Construction of 3 satellite
bus parks
-To decongest the
CBD and create
economic hubs
-Nyamasaria, mamboleo
and Otonglo already
identified in the ISUD
3 bus parks constructed 20% 10% 20% 1.5B
Open /improve road and
public infrastructure in
informal settlements
To improve access
to services
To improve
livelihoods
Poor/lack of access of
emergency services
Low land and property
values
Length of new road network
constructed
Length of drainage and
walkway/cycle paths
constructed Security lighting
20% 20% 10% 10% 10% 2.0B
Creation of land bank Availability of land
for investment
00 Land bank 100% 200M
SUB-TOTAL 4.4B
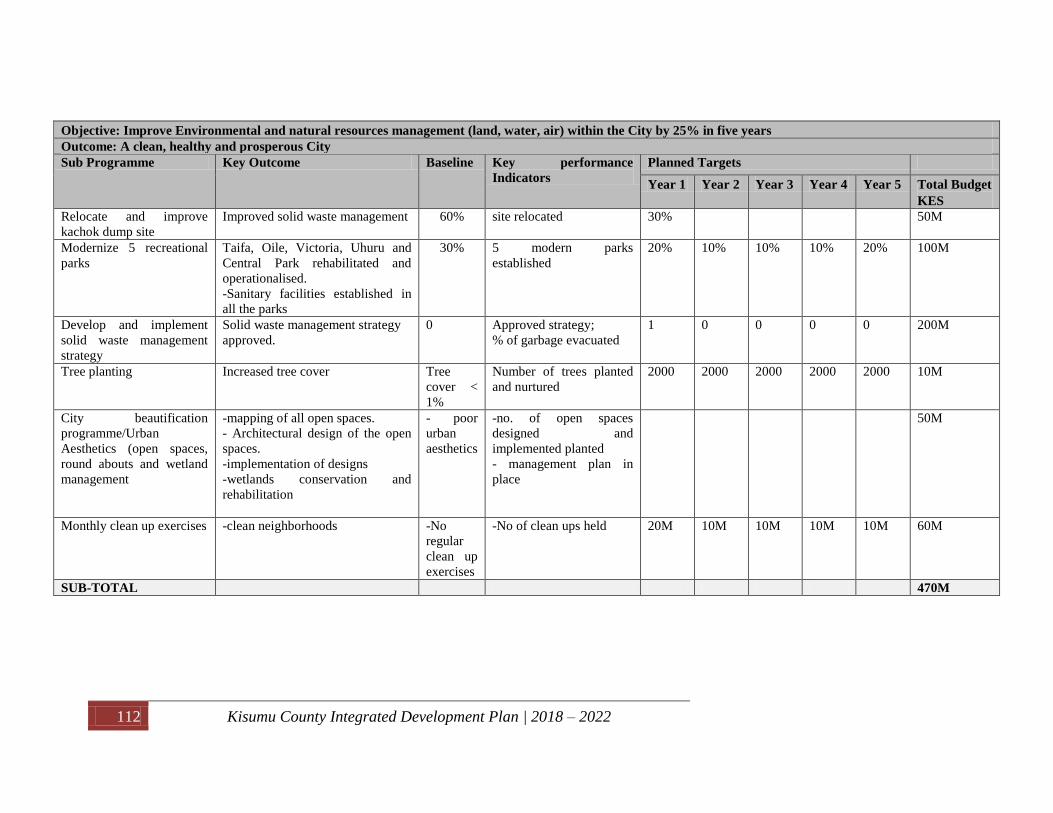
112 Kisumu County Integrated Development Plan | 2018 – 2022
Objective: Improve Environmental and natural resources management (land, water, air) within the City by 25% in five years
Outcome: A clean, healthy and prosperous City
Sub Programme Key Outcome Baseline Key performance
Indicators
Planned Targets
Year 1 Year 2 Year 3 Year 4 Year 5 Total Budget
KES
Relocate and improve
kachok dump site
Improved solid waste management
60% site relocated
30% 50M
Modernize 5 recreational
parks
Taifa, Oile, Victoria, Uhuru and
Central Park rehabilitated and
operationalised.
-Sanitary facilities established in
all the parks
30% 5 modern parks
established
20% 10% 10% 10% 20% 100M
Develop and implement
solid waste management
strategy
Solid waste management strategy
approved.
0 Approved strategy;
% of garbage evacuated
1 0 0 0 0 200M
Tree planting
Increased tree cover
Tree
cover <
1%
Number of trees planted
and nurtured
2000 2000 2000 2000 2000 10M
City beautification
programme/Urban
Aesthetics (open spaces,
round abouts and wetland
management
-mapping of all open spaces.
- Architectural design of the open
spaces.
-implementation of designs
-wetlands conservation and
rehabilitation
- poor
urban
aesthetics
-no. of open spaces
designed and
implemented planted
- management plan in
place
50M
Monthly clean up exercises
-clean neighborhoods -No
regular
clean up
exercises
-No of clean ups held 20M 10M 10M 10M 10M 60M
SUB-TOTAL 470M

113 Kisumu County Integrated Development Plan | 2018 – 2022
Programme Name: Education and Social Services
Objective: Improve education and social services Management within the City of Kisumu
Outcome: Improved educational and social services to residents of Kisumu
Sub Programme Key Outcome Baseline Key performance
Indicators
Planned Targets
Year 1 Year 2 Year 3 Year 4 Year 5 Total
Budget
Modernize 3 social
facilities within the City
Availability of
access to social
facilities
Kisumu Social Centre,
Kosawo, and Kaloleni
social hall
No. of facilities
rehabilitated
45M 45M
SUB-TOTAL 245M
Programme Name: Public Health
Objective: To improved public health management within the City
Outcome: Improved public health management in the City of Kisumu
Sub Programme Key Outcome Baseline Key performance Indicators Planned Targets
Year 1 Year 2 Year 3 Year 4 Year 5 Total
Budget
Water, Sanitation and
Hygiene services
Effective urban
community led
total sanitation
strategy
0 Improved latrine coverage and
latrine standards
Improved solid and liquid waste
management
Reduced faeco oral disease
morbidity
5M 5M 5M 5M 1M 21M

114 Kisumu County Integrated Development Plan | 2018 – 2022
Vector and Vermin
control services
Indoor residual
spraying,
laviciding and
screening of
buildings
0 Total number of fumigation
machines procured
Total number of household
sprayed and screened
Total number of premises
fumigated and screened
17M 15M 10M 10M 10M 62M
Health Infrastruture
Development control
and public health law
enforcement
Renovation of
slaughter house
Fencing of
Mamboleo
cemetery
30% Cemetry fenced;
Slaughter house renovated
SUB-TOTAL 83M
TOTAL 5.448B

115 Kisumu County Integrated Development Plan | 2018 – 2022
4.4.4 ECONOMIC PLANNING AND DEVELOPMENT
4.4.4.1 Sector Introduction
The sector plays a strategic role in the overall co-ordination of County development planning and
budgeting, research and statistics and tracking of development results through a structured
monitoring and evaluation framework which provides timely feedback to the citizenry.
It prepares the development agenda for a specified period of time, sets goals, objectives,
strategies, prioritized programmes and an implementation matrix with outputs and outcomes
through enhanced community participation in project identification, implementation and
management and enhances networking and collaboration with other development actors.
Through participatory and conventional sector approach planning, the sector takes into
consideration competitive demands/ prioritization in allocation of public resources - Economic
Growth versus poverty reduction and inequality and designs specific programmes targeting
special regions and groups to promote equal access to resources and opportunities and benefits
thereof as it addresses disparities between the rich and poor, inequitable distribution of public
resources / services between individuals, regions; Rural –urban inequities and income disparities
among rural areas and within major cities and towns which would otherwise lead to discontent
and slow the development agenda.
The sector has to work towards meaningful and productive engagement of the citizenry during
public participation in the budget making process; enhance policy linkage to planning and
budgeting at the County level; enhance co-ordination of development partners to avoid
duplication of activities and build capacities of communities to mobilize resources towards
sustaining programmes/projects.
Monitoring and evaluation is a key ingredient to development planning and forms an integral
part of the programme management cycle and is the best way of measuring progress, detecting
problems, correcting them, improving performance and learning at all levels.
Vision:
Planning for better quality life and sustainable development for the residents of Kisumu
116 Kisumu County Integrated Development Plan | 2018 – 2022
Mission:
To provide leadership in economic policy formulation, co-ordination, implementation and
tracking of results for sustainable development.
Goal:
Planning for Sustainable development
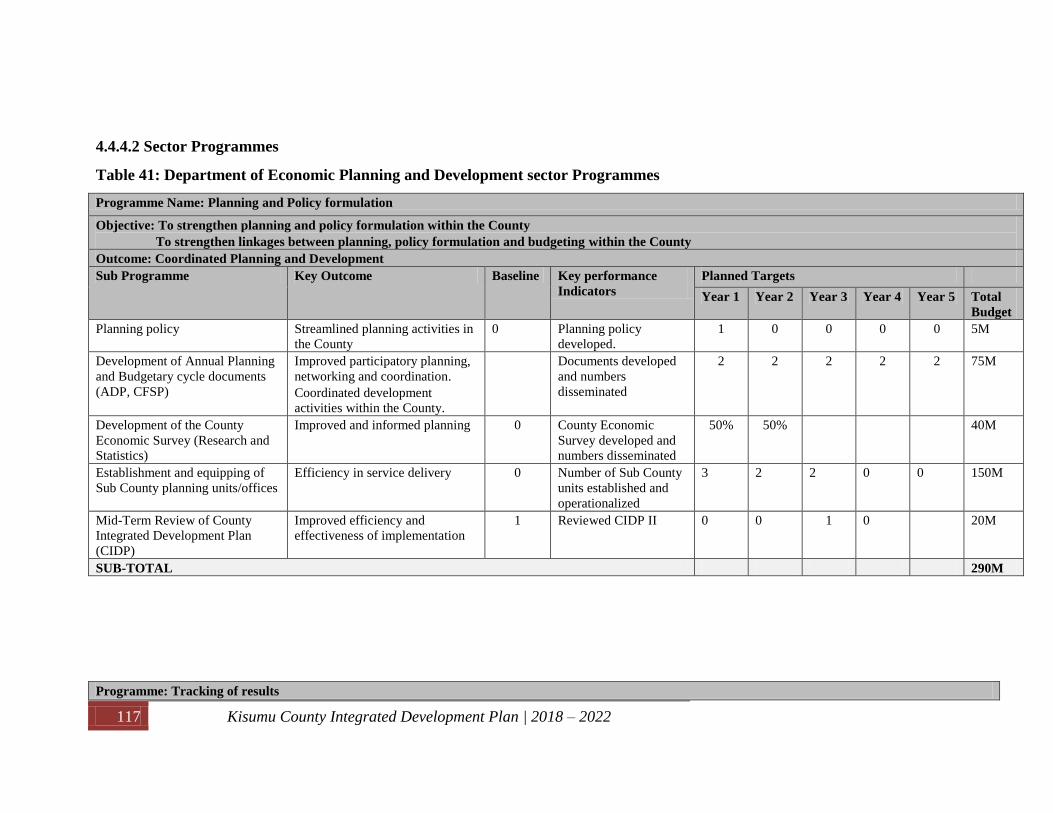
117 Kisumu County Integrated Development Plan | 2018 – 2022
4.4.4.2 Sector Programmes
Table 41: Department of Economic Planning and Development sector Programmes
Programme Name: Planning and Policy formulation
Objective: To strengthen planning and policy formulation within the County
To strengthen linkages between planning, policy formulation and budgeting within the County
Outcome: Coordinated Planning and Development
Sub Programme Key Outcome Baseline Key performance
Indicators
Planned Targets
Year 1 Year 2 Year 3 Year 4 Year 5 Total
Budget
Planning policy Streamlined planning activities in
the County
0 Planning policy
developed.
1 0 0 0 0 5M
Development of Annual Planning
and Budgetary cycle documents
(ADP, CFSP)
Improved participatory planning,
networking and coordination.
Coordinated development
activities within the County.
Documents developed
and numbers
disseminated
2 2 2 2 2 75M
Development of the County
Economic Survey (Research and
Statistics)
Improved and informed planning 0 County Economic
Survey developed and
numbers disseminated
50% 50% 40M
Establishment and equipping of
Sub County planning units/offices
Efficiency in service delivery 0 Number of Sub County
units established and
operationalized
3 2 2 0 0 150M
Mid-Term Review of County
Integrated Development Plan
(CIDP)
Improved efficiency and
effectiveness of implementation
1 Reviewed CIDP II 0 0 1 0 20M
SUB-TOTAL 290M
Programme: Tracking of results

118 Kisumu County Integrated Development Plan | 2018 – 2022
Objective: To improve tracking of implementation of development policies, strategies and programmes
Outcome: Prudent use of resources and accountability
Sub Programme Key Outcome Baseline Key performance
Indicators
Planned Targets
Year
1
Year
2
Year
3
Year
4
Year
5
Total
Budget
Monitoring and Evaluation
Policy
Strengthened M&E system 0 Number of policies
developed
1 0 0 0 0 5M
Establishment County
Integrated Monitorig and
Evaluation System (CIMES)
Improved tracking of
implementation of development
programmes
0 CIMES established 50% 50% 0 0 0 80M
Capacity building on
Monitoring and Evaluation
Strengthened M&E within the
departments
0 Number of personnels
trained
120 0 120 0 0 20M
Monitoring, Evaluation and
dissemination County M&E
Progress Reports
Informed decision making 0 Number of reports compiled
and disseminated
1 1 1 1 1 500M
SUB-TOTAL 610M
Programme: Grass-root Projects
Objective: To promote equitable distribution of resources across the wards
Outcome: Improved living standards of the citizenry
Sub Programme Key Outcome Baselin
e
Key performance Indicators Planned Targets
Year
1
Year
2
Year
3
Year
4
Year
5
Total
Budget
Establishment and strenghethening
of ward committees
Improved coordination of
development activities
0 No. of ward committees
established and operationalized
35 0 0 0 0 46M
Training and Capacity building of
ward committees
Enhanced service delivery 0 No of committees trained 35 35 35 35 35 200M

119 Kisumu County Integrated Development Plan | 2018 – 2022
Programme: Institutional Capacity Strengthening
Objective: To improve service delivery
Outcome: Adequate and skilled workforce
Sub Programme Key Outcome Baseline Key performance Indicators Planned Targets
Year
1
Year
2
Year
3
Year
4
Year
5
Total
Budget
Personnel recruitment Enhanced service delivery 12 Number of personnels recruited
and deployed
7 14 8 8 0 75M
Training Enhanced service delivery Number of personnels trained 15 15 15 10 0 25M
SUB-TOTAL 100M
TOTAL 3.241B
Infrastructure development Increased access to
basic/essential services
0 No. of projects completed and
operationalized
35 35 35 35 35 2B
SUB-TOTAL 2.246B

120 Kisumu County Integrated Development Plan | 2018 – 2022
4.4.5 WATER, IRRIGATION, ENVIRONMENT & NATURAL
RESOURCES
4.4.5.1 Sector Introduction
Sector composition:
Water Services
Irrigation and Land reclamation
Environment and Natural resources
Vision:
A County with Clean and Healthy Environment Supplied with Quality Water for Domestic and
Irrigation Purposes
Mission:
To enhance access to safe and healthy environment with sustainable water supply and irrigation
systems through a multi-sectorial approach.

121 Kisumu County Integrated Development Plan | 2018 – 2022
4.4.5.2 Sector Programmes
Table 42: 5 Water, Irrigation, Environment & Natural Resources Sector Programmes
Programme Name: Water service provision and management
Objective 1: Improve access to water services from 58% to 68% in the next 5 years
Outcome: Increased access to quality water and Sewerage
Sub Programme Key Outcome Baseline Key performance
Indicators
Planned Targets
Year
1
Year
2
Yea
r 3
Year
4
Year
5
Total
Budge
t
Develop Kisumu County water and
sewerage master plan
Master plan in place 0
Master plan
1 30M
Rehabilitate and expand existing 14
water treatment works.
Increased production efficiency
from 42% to 80%
41.6 % Increased production 7.6% 7.6% 7.6
%
7.6% 7.6% 2.5 B
Rehabilitation and expansion of
piped water distribution network in
the Peri-Urban, Rural areas and
informal settlements
Reduced distance of fetching
potable water
> 250m
1000 M Reduced distance of
accessing to quality
water.
800 600 400 300 200 3.0 B
Purchase of water bowsers Quick response (<24 Hrs.) to
emergency water shortages
0 Reduced complaints to
water shortages
1
20M
Rehabilitation and upgrading of
existing viable boreholes
Increased Number of functional
boreholes
96 Non-
functional
Boreholes
Number of
rehabilitated boreholes
24 19 19 20 19 400
M
Drilling and equipping of New
boreholes
Increased number of functional
boreholes
200
Boreholes
Number of new
boreholes
15 26 27 26 26 200 M
Construction of Soin- Koru Dam to
cover Nyando, Muhoroni and
Nyakach Sub counties
Adequate water coverage within
Upcoming Urban Centers and
Rural Communities
0 Number of new water
schemes
- 1 1 1 29 B
MTP
II
flagshi
p
project
GOK

122 Kisumu County Integrated Development Plan | 2018 – 2022
and
CGK
Development of water supplies to
cover Maseno and Seme
Adequate water coverage within
Seme and Kisumu West Sub
counties
2 B
Protection and rehabilitation of
viable water springs from 20 to 90
Protected sources free from
Chemical and Organic
contamination
20
Number of springs
protected and
rehabilitated.
4 16 16 17 17 35
M
SUB-TOTAL 8.225B
Programme Name: Water service provision and management
Objective 2: Increase storage per capita per day from 8 liters to 25 liters by the year 2022.
Outcome: Improved water storage capacity
Sub Programme Key Outcome Baselin
e
Key performance
Indicators
Planned Targets
Year
1
Year
2
Year 3 Year
4
Year 5 Total
Budge
t
Promotion of rain
water harvesting
systems at institutions
Increased rainwater storage
facilities at institutions from
3000M3 to 10,000 M
3.
3000
M3
Number of rain catchment
facilities developed for
institutions
1400 1400 1400 1400 1400 100 M
Increase water storage
capacity in rural area
Increased storage capacity from
5842 M3 to 35,000M
3
5842 Amount of increased
storage capacity
5832 5832 5832 5832
5832 1.1 B
Desilting of existing
water pans
Increased storage and holding
capacity of existing pans
28 Number of water pans
desilted
2 2 2 2 2 50M
SUB-TOTAL 1.25B
Programme Name: Water service provision and management
Objective 3: Reduce Non-Revenue water from 45% to 30 % by the year 2021
Outcome: Improved management of water supplies
Sub Programme Key Outcome Baseline Key performance
Indicators
Planned Targets
Year
1
Year
2
Year
3
Year
4
Year
5
Total
Budget
Digital GIS Mapping of all the rural GIS maps in place 0 Maps of 12 water supplies 0 3 3 3 3
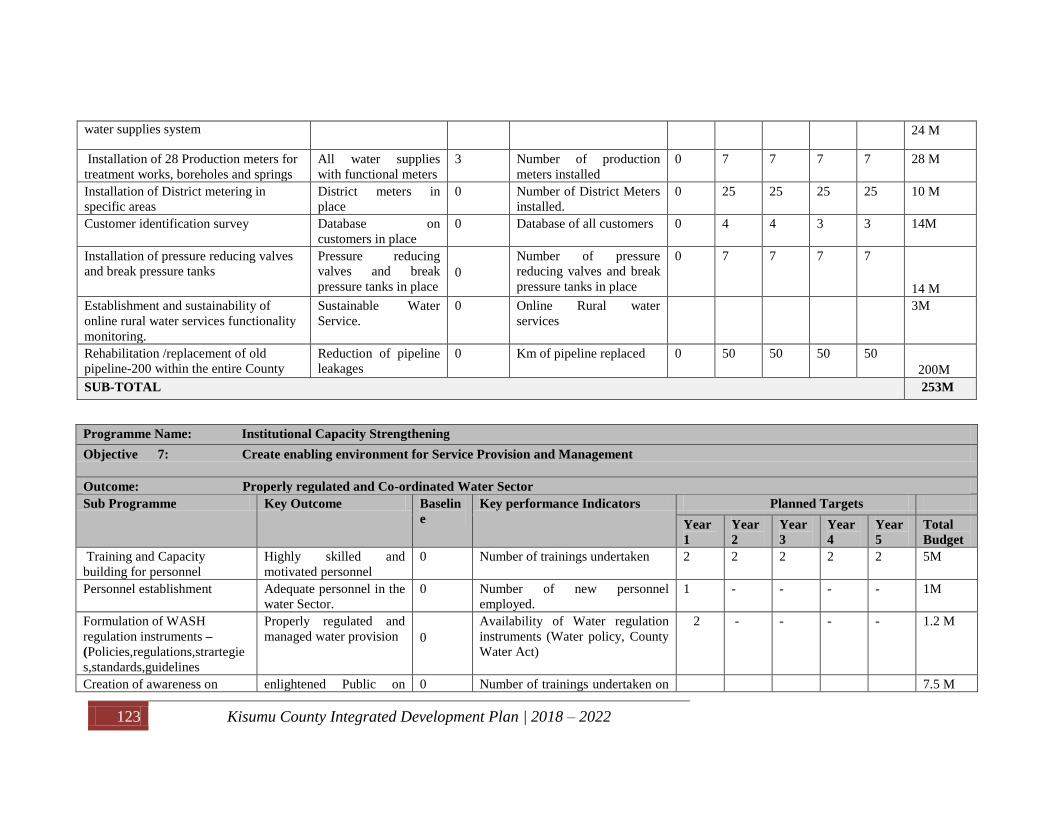
123 Kisumu County Integrated Development Plan | 2018 – 2022
water supplies system 24 M
Installation of 28 Production meters for
treatment works, boreholes and springs
All water supplies
with functional meters
3 Number of production
meters installed
0 7 7 7 7 28 M
Installation of District metering in
specific areas
District meters in
place
0 Number of District Meters
installed.
0 25 25 25 25 10 M
Customer identification survey Database on
customers in place
0 Database of all customers 0 4 4 3 3 14M
Installation of pressure reducing valves
and break pressure tanks
Pressure reducing
valves and break
pressure tanks in place
0
Number of pressure
reducing valves and break
pressure tanks in place
0 7 7 7 7
14 M
Establishment and sustainability of
online rural water services functionality
monitoring.
Sustainable Water
Service.
0 Online Rural water
services
3M
Rehabilitation /replacement of old
pipeline-200 within the entire County
Reduction of pipeline
leakages
0 Km of pipeline replaced 0 50 50 50 50
200M
SUB-TOTAL 253M
Programme Name: Institutional Capacity Strengthening
Objective 7: Create enabling environment for Service Provision and Management
Outcome: Properly regulated and Co-ordinated Water Sector
Sub Programme Key Outcome Baselin
e
Key performance Indicators Planned Targets
Year
1
Year
2
Year
3
Year
4
Year
5
Total
Budget
Training and Capacity
building for personnel
Highly skilled and
motivated personnel
0 Number of trainings undertaken 2 2 2 2 2 5M
Personnel establishment Adequate personnel in the
water Sector.
0 Number of new personnel
employed.
1 - - - - 1M
Formulation of WASH
regulation instruments –
(Policies,regulations,strartegie
s,standards,guidelines
Properly regulated and
managed water provision
0
Availability of Water regulation
instruments (Water policy, County
Water Act)
2 - - - - 1.2 M
Creation of awareness on enlightened Public on 0 Number of trainings undertaken on 7.5 M

124 Kisumu County Integrated Development Plan | 2018 – 2022
regulation instruments
(publishing, Civic education,
public participation
policy and legal
framework
water policy awareness 3 3 3 3
3
Implementation and
enforcement of regulatory
instruments
Institutionalized Public on
policy and legal
framework
Policy document and Water Act
2017 available in all the 7 sub
county Offices
7
-
-
-
-
Strengthening of Kisumu
County WASH Network
Properly coordinated and
effective WASH network
42 No of WASH Network meetings
held
4
4
4
4 4 5M
Institutionalise WASH
Coordination unit within the
department.
WASH unit established in
the water department
0
WASH coordination unit in place
1
1M
Interrogate the existing
organization structure
Gaps in human resource
established
Gap analysis report 1
Design and implement new
organizational structure
An efficient and effective
Organizational structure
Structure aligned to strategic plan
in place
1
Undertake a job analysis,
rationalization and evaluation
study
Skilled manpower for the
sector
Job analysis, rationalization and
evaluation report
1
2M
SUB-TOTAL 22.7M
TOTAL 12.688B

125 Kisumu County Integrated Development Plan | 2018 – 2022
ENVIRONMENT AND NATURAL RESOURCES
Programme Name: Solid Waste Management
Objective 1: To Strengthen Solid Waste Management System in Kisumu County
Outcome: Improved Solid Waste Management System
Sub Programme Key Outcome Baseline Key performance Indicators Planned Targets
Y 1 Y 2 Y 3 Y 4 Y 5 Total
Budget
Strengthen
regulatory, policy
and framework on
Solid waste
management
Reviewed and
Operationalised
SWM policies, Act
and Plan
-SWM Act 2015 in
existence not
operationalised
-KISWAMP exists
No. of documents on solid waste reviewed 1 1 0 0 0 1M
No of guidelines/ Regulations developed 1 1 1 0 0 7.5M
Documentation of
sources and
characteristics of
Solid Waste from 7
sub-counties
An inventory of Solid
waste generation
points and their
characteristics
-Unconsolidated
literature,
-No recent primary data
-No. of studies done
-Copies of the research work on Solid
waste management
-State of solid waste report
2 2 2 1 0 7M
Institute measures on
handling solid Waste
at point of generation
Wastes handling
facilities (bins, skips
equipment)
-Dilapidated receptors
-Inadequate receptors
No. of procured bins 100
100 100 0 0 9M
No. of procured skips 20 0 20 0 20 6M
Integrated Solid
Waste management
-Sensitization forums
for households (3R)
-Sensitization forums
for industries (3R)
-Sensitization forums
on 3R s for small &
medium enterprises
-Low practice levels on
3Rs
No of solid waste Recyclers at generation
point
7 0 7 0 7 3M
No. of household sensitized 350 700 700 700 700 2M
No. of industries personnel sensitized 10 10 10 10 10 1M
No. of small and medium enterprises 40 40 40 40 40 2M
Personnel sensitized
No. of Minutes, sensitization materials and
reports on for a
40 40 40 40 40
Promote appropriate
system of Solid
waste transportation
Improved means of
solid waste transport
and collection system
-Four 25 tone
Construction trucks
-1 skip Loader
-1 Backhoes
No. of appropriate solid waste
transportation trucks purchased
A document showing waste collection
route planning
1 2 1 2 - 1M

126 Kisumu County Integrated Development Plan | 2018 – 2022
Programme Name: Solid Waste Management
Objective 1: To Strengthen Solid Waste Management System in Kisumu County
Outcome: Improved Solid Waste Management System
Sub Programme Key Outcome Baseline Key performance Indicators Planned Targets
Y 1 Y 2 Y 3 Y 4 Y 5 Total
Budget
and collection No. of broomer 1 - - 1 - 29M
Establish appropriate
system of Solid
waste disposal
Transfer stations
(temporary holding)
Absence of designated
waste transfer stations
for material recovery
2 transfer station identified and equipped
with material recovery
- - 1 - 1 30M
No. of segregation equipment 1 - 1 20M
Layers of compacted
Solid Waste at
disposal point
Inefficient Compactor
and compaction
No. of compactor bought and
operationalised
- - 1 - - 50M
Land Fill
Partially
Decommissioned open
dumpsite
1 No. suitable landfill site acquired - 1 - - - 30M
Studies on potential
medium scale
investments in Solid
Waste Management in
Kisumu County
No. of Studies on SWM 1 1 0 0 0 2M
SUB-TOTAL 200.5M
Programme Name: Afforestation, vegetation and beautification of public spaces
Objective 2: To improve forest/tree cover in County rural and urban spaces and its water towers
Outcome: Improved Forest/Tree Cover in the County vegetation cover and its water towers
Sub Programme Key Outcome Baseline Key performance Indicators Planned Targets
Year
1
Year
2
Year
3
Year
4
Year
5
Total
Budget
Mapping of Forest
cover Geospatial maps
Potential carbon sink
demarcated
Scanty data on forest
cover
Area mapped out in sq. km 1 2 2 1 1
21M

127 Kisumu County Integrated Development Plan | 2018 – 2022
Programme Name: Solid Waste Management
Objective 1: To Strengthen Solid Waste Management System in Kisumu County
Outcome: Improved Solid Waste Management System
Sub Programme Key Outcome Baseline Key performance Indicators Planned Targets
Y 1 Y 2 Y 3 Y 4 Y 5 Total
Budget
Hilltop/sub water
tower afforestation Ha. of hilltops
afforested
-At least 4 hills
reforested
- Scanty vegetation on
hilltops such as
Sanganyinya, Kisian,
Nyabondo-kajulu, Got
Alila among others
-No. of ha. of hill-tops /sub water towers
afforested
-2 hills/sub water towers reforested
-Initiation and establishment of micro
enterprises by communities
20 25 25 20 20 50M
Re -afforestation at
Koguta and
Karateng’ Forest
Increasing forest
cover in Koguta forest
and Karateng’
1% tree coverage Afforested gazzetted forest No. of hectares
re-afforest
5% 5% 5% - - 30M
Farmland re-
forestation Increased farmland
forest cover
0.4% forest cover % of farmland under forest cover -.8% 2% 3% 4% 5% 10M
SUB-TOTAL 111M
Programme Name: Conservation and rehabilitation of degraded landscapes
Objective 3: To conserve degraded land and lakeshores
Outcome: Conserved land and Lakeshores
Sub Programme Key Outcome Baseline Key performance
Indicators
Planned Targets
Year
1
Year
2
Year
3
Year
4
Year
5
Total
Budget
Wetlands protection
and conservation
Adopted and
operationalised Wetland
policy
None existent county
policy on wetland
conservation
National wet-land policy
adopted
- 1 - - - 2.5M
Guidelines on Ramser
Convention developed and
adopted
- - 1 - - 1M
Wetlands mapped and
gazette
Unmapped wetlands No. of wetlands identified
and mapped
1 1 1 1 1 15M

128 Kisumu County Integrated Development Plan | 2018 – 2022
No. of degraded land
rehabilitated
7 7 7 7 7 35M
Empowered wetland
conservation group
Weak wetland
management community
groups exist
No. of groups implementing
wise use principles on
wetland resources
management
- 2 2 2 2 20M
Development of wet-land
based businesses
Small scale enterprises for
value addition and use of
wetland resources
developed
No. of enterprises 1 4 5 5 5 10M
Protection and
conservation of
river banks and
riparian lands
Mapping of degraded river
banks, springs and streams
Un-documented Degraded
river banks
No. of degraded River bank.
sections mapped
21 21 21 21 21 3M
Construction of river bank
protection structures
Water Resource Users
Association (WRUA)
handles only certain
sections of degraded River
Catchment.
No. of Check dams 7 7 7 7 7 5M
No. of gabions 7 7 7 7 7 17M
No. of dykes 1 1 1 1 1 25M
No. of kms of riverbank
protected
1 1 1 1 1 10M
Weak partnership in joint
conservation with
WRUAs, NGOs and WRA
No of joint interventions 10 10 10 10 10 50M
Construction of gulley
protection structures,
landscape sheet erosion
prevention and planting of
vegetation
Unprotected gulleys and
new gulleys opening up
Area of Gulley protected
Structures built on gulleys
and river banks
1 3 3 3 3 40M
Ecological &
aesthetic beach
health enhancement
Improved Beach
Environmental Health
-Degraded beaches, beach
Management Unit strong
on Fish catch management
and weak in conservation
aspect.
-Point and non-point
pollution at beaches
% of area occupied by
riparian vegetation buffer
5 10 20 30 40 20M
No. of Sensitization for a
held
14 14 14 14 14 1M
No. of live maintained
fences securing beach land
7 7 7 7 7 9M

129 Kisumu County Integrated Development Plan | 2018 – 2022
Biodiversity
management and
eradication of alien
species
Identify and map out
invaded areas, develop
appropriate control
strategies
identified biodiversity rich
areas in the county
Reports on invasive
species
Water hyacinth
surveillance at lakefront
Invasive species eradicated
Expanse of under control
1 1 2 2 2 3M
Watershed sub
catchment
management
Operationalised sub
catchment management
plans in partnership with
WRA, WRUAs AND
NGO’s
Not all sub catchments
have sub catchment
management plans
No. of trees planted
sub catchment management
plans
Landscape management
strategies
1 2 3 4 5 2M
SUB-TOTAL 268.5M
Programme Name: Noise and Air Pollution Control
Objective 4: To control noise and air pollution
Outcome: Controlled industrial air pollution and reduced levels of noise pollution
Sub Programme Key Outcome Baseline Key performance
Indicators Planned Targets
Year 1 Year 2 Year 3 Year 4 Year 5 Total
Budget
Noise pollution
Control
Controlled noise level in
high generation points
Low level of
compliance to
acceptable noise level
No. of Noise hotpots
marked 21 21 21 21 21 0.2M
No. of noise metres
purchased 1 2 2 1 1 1M
No. of warning letters
served 21 21 21 21 21 Nil
No. of sensitization for
a held 14 14 14 14 14 0.4M
No. of Noise
prevention programme
developed
7 7 7 7 7 Nil
Air Pollution
Controlled air pollution
Un-monitored
industrial air
pollution leading to
high particulate
matter in air
No. of air pollution
hotspots mapped 7 7 7 7 7 Nil
No. of warning letters
served 2 2 2 2 - Nil
No. of sensitization
held 7 7 7 7 7 0.2M

130 Kisumu County Integrated Development Plan | 2018 – 2022
No. of Noise
prevention
programmes developed
7 7 7 7 7 Nil
SUB-TOTAL 1.8M
Programme Name: Enforcement of Environmental governance processes
Objective: To strengthen environmental management
Outcome: Development of a strengthened county environmental management system
Sub Programme Key Outcome Baseline Key performance
Indicators Planned Targets
Year 1 Year 2 Year 3 Year 4 Year 5 Total Budget
Strengthen
enforcement of
national and county
environmental policies
and laws
Citizens follow policy
and laws in their
actions
Weak enforcement of
policies and laws
Enforcement
officers assigned to
department
Enforcement officers
trained
Law breakers
charged
Trained
Environmental
committee of the
national assembly
4 3 1 1 1 2M
Environmental
education for
sustainable
development
-Behaviour change
among residents on
environmental
protection
-Strengthened
Regional Center of
Expertise
Minimal engagement
with schools
No. of schools
involved
No. of community
awareness and
education forums
No. of groups and
institutions
participating in the
Regional Center of
Expertise
20 30 40 50 50 10M

131 Kisumu County Integrated Development Plan | 2018 – 2022
Development of
guidelines to
implementation of
Multilateral
Environmental
Agreements (MEA’s)
Operationalised MEAs No county guideline
on implementation of
MEAs
No of guidelines
developed 1 1 1 2M
Establishment of
County Environmental
Management structures
County Environmental
Committee Established
Non-existence of
County Environmental
Committee
-One Functional
County
Environmental
Committee
1 0 0 0 0 2 M
-One County
Environmental
Action Plan
developed
0 1 0 0 0 2.5M
Mainstreaming
environmental
safeguards in County
Programmes and
projects
County programmes
and projects to comply
with national and
international best
practices
Weak SEA, EIA, SIA
and EA on county
programmes and
projects
- No. of SEA done
on departmental
programmes
2 2 2 2 2 10M
-No. of EIA, SIA and
EA done on County
projects
5 5 5 5 5 7.5M
Enhance resource
mobilization for
environmental
activities
Resources mobilized
from collaborators on
Environmental
governance
Insufficient funding for
sub sector activities
-Amount and
quantity of resources
mobilized
1 1 1 1 1 1M
SUB-TOTAL 37M
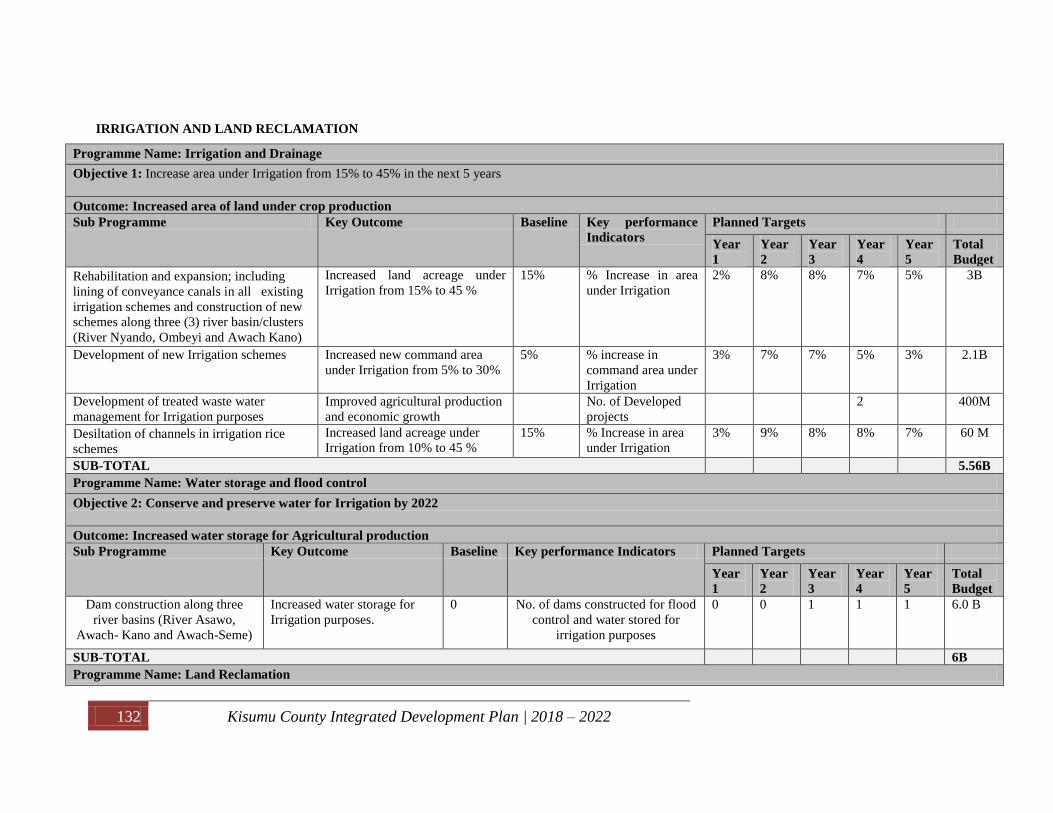
132 Kisumu County Integrated Development Plan | 2018 – 2022
IRRIGATION AND LAND RECLAMATION
Programme Name: Irrigation and Drainage
Objective 1: Increase area under Irrigation from 15% to 45% in the next 5 years
Outcome: Increased area of land under crop production
Sub Programme Key Outcome Baseline Key performance
Indicators
Planned Targets
Year
1
Year
2
Year
3
Year
4
Year
5
Total
Budget
Rehabilitation and expansion; including
lining of conveyance canals in all existing
irrigation schemes and construction of new
schemes along three (3) river basin/clusters
(River Nyando, Ombeyi and Awach Kano)
Increased land acreage under
Irrigation from 15% to 45 %
15% % Increase in area
under Irrigation
2% 8% 8% 7% 5% 3B
Development of new Irrigation schemes Increased new command area
under Irrigation from 5% to 30%
5% % increase in
command area under
Irrigation
3% 7% 7% 5% 3% 2.1B
Development of treated waste water
management for Irrigation purposes
Improved agricultural production
and economic growth
No. of Developed
projects
2 400M
Desiltation of channels in irrigation rice
schemes
Increased land acreage under
Irrigation from 10% to 45 %
15% % Increase in area
under Irrigation
3% 9% 8% 8% 7% 60 M
SUB-TOTAL 5.56B
Programme Name: Water storage and flood control
Objective 2: Conserve and preserve water for Irrigation by 2022
Outcome: Increased water storage for Agricultural production
Sub Programme Key Outcome Baseline Key performance Indicators Planned Targets
Year
1
Year
2
Year
3
Year
4
Year
5
Total
Budget
Dam construction along three
river basins (River Asawo,
Awach- Kano and Awach-Seme)
Increased water storage for
Irrigation purposes.
0 No. of dams constructed for flood
control and water stored for
irrigation purposes
0 0 1 1 1 6.0 B
SUB-TOTAL 6B
Programme Name: Land Reclamation

133 Kisumu County Integrated Development Plan | 2018 – 2022
Objective 3: Reclaiming and protecting wasted areas by 2022
Outcome: Increased arable land for Agricultural production
Sub Programme Key Outcome Baseline Key performance Indicators Planned Targets
Year
1
Year
2
Year
3
Year
4
Year
5
Total
Budget
Rehabilitation of gullies Increased arable land for
Agricultural production
0 No. of gullies conserved/protected 0 2 2 2 2 24 M
SUB-TOTAL 24M
Programme Name: Resource Mobilization for Irrigation sector
Programme Name: County Irrigation Office
Objective 5: To enhance work environment
Outcome: Improved service delivery
Sub Programme Key Outcome Baseline Key performance
Indicators
Planned Targets
Year
1
Year
2
Year
3
Year
4
Year
5
Total
Budget
Construction of County Irrigation
HQs and satellite offices
Office block constructed 0 No. of blocks constructed 0 0 1 2 100 M
SUB-TOTAL 100M
Pgramme Name: Capacity building
Objective 6: Sector learning, knowledge management and development by 2022
Outcome: Improve capacity of Irrigation personnel
Sub Programme Key Outcome Baseline Key performance
Indicators
Planned Targets
Year 1 Year 2 Year 3 Year 4 Year 5 Total Budget
Continuous
strengthening of the
County Irrigation
Active and
responsive
Irrigation Forum
4 Stakeholders
performance reports
and Score cards
0 1 1 1 1 3 M
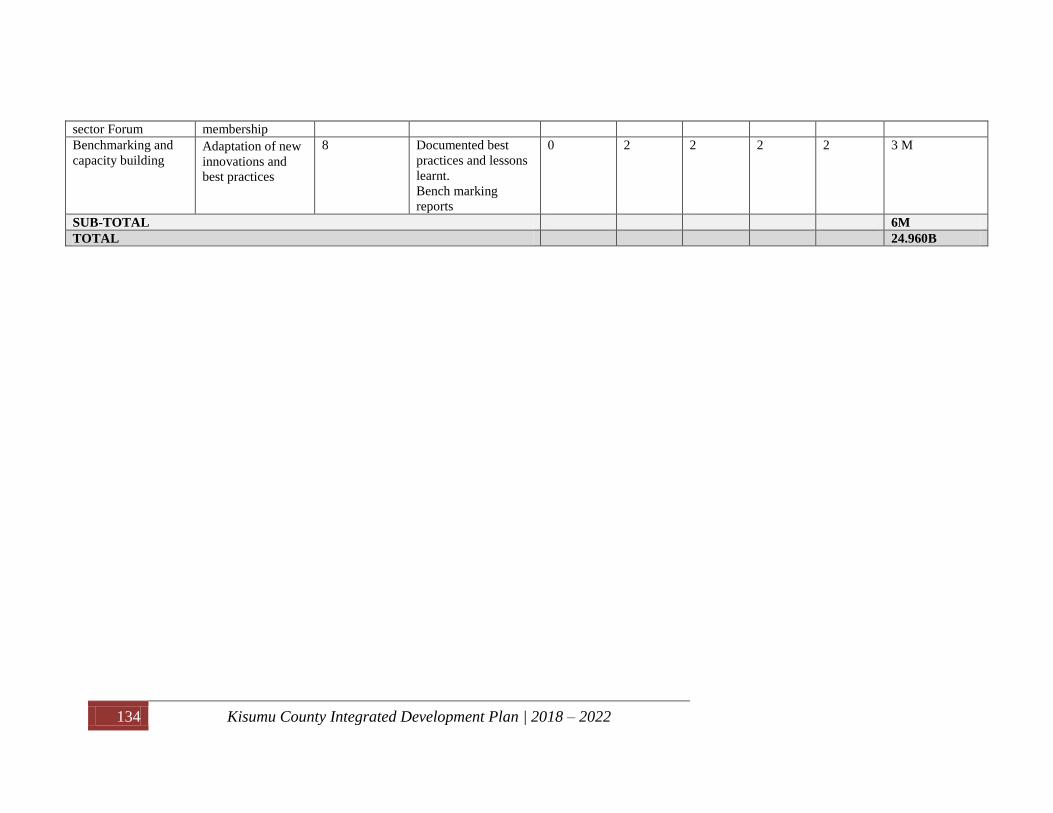
134 Kisumu County Integrated Development Plan | 2018 – 2022
sector Forum membership
Benchmarking and
capacity building Adaptation of new
innovations and
best practices
8 Documented best
practices and lessons
learnt.
Bench marking
reports
0 2 2 2 2 3 M
SUB-TOTAL 6M
TOTAL 24.960B

135 Kisumu County Integrated Development Plan | 2018 – 2022
4.4.6 HEALTH AND SANITATION
4.4.6.1 Sector Introduction
The Kisumu County Health Sector Strategic direction is to realign the ministry’s efforts from
treatment to prevention. The county will focus on the eradicating poor sanitation by working
with various ministries and departments to achieve a holistic promotive and preventive approach.
This health plan will incorporate all the sectors, stakeholders and ministries to help achieve
universal health care coverage through strengthening deliverables within the key six pillars of
health:
Eliminate communicable conditions;
Halt and reverse the rising burden of non-communicable conditions;
Reduce the burden of violence and injuries;
Provide essential health services;
Minimize exposure to health risk factor;
Strengthen collaboration with health related sectors
Kisumu County Health and Sanitation Department is divided into two Sub Sectors. These are:
Medical and Bio-medical Service and Public Health and Sanitation, each with well-defined unit.
Medical and Biomedical Services
Nursing
Emergency referral services
Specialized medical services
Laboratory Service
Nutrition
Pharmacy
Diagnostic imaging
Forensic pathology services
Physiotherapy
Rehabilitation services
Public Health Services
136 Kisumu County Integrated Development Plan | 2018 – 2022
Environmental health and sanitation
Nutrition and dietetics
HIV/AIDS control
Malaria control
TB control
Disease surveillance and response
Monitoring and evaluation
Health promotion
Primary health services
Community Health Services
Family health
Vision
A dynamic, excellent, and globally competitive county health services, that contribute to a
healthy and productive population.
Mission
To transform the livelihood of the people of Kisumu County through responsive and sustainable
technologically-driven evidence-based and client centered health system for accelerated
attainment of highest standards of health.
Goal
To attain the highest possible standard of health in a responsive manner.

137 Kisumu County Integrated Development Plan | 2018 – 2022
4.4.6.2 Sector Programmes
Table 43: Health And Sanitation Sector Programme
Programme 1: General Administration, Planning, Partnership and Support Services
Outcome: Improved service delivery and supportive functions
Objective: Improve standard of health of the people of Kisumu County.
Sub
Programme
Key Outcome Baseline Key performance Indicators Planned Targets
Year
1
Year 2 Year
3
Year 4 Year
5
Total
Budget
SP.1.1:
Health Policy,
Key health policies developed 0 Number of health of policies
developed
1 1 1 1 1 5M
Number of sub-sector strategic plans
developed.
5M
Annual planning and
performance review undertaken
1 Number of annual work plans and
performance reviews conducted
1 1 1 1 1 5M
Strengthen facility management
committees
0 Number of functional hospital
management committees
125 125 125 125 125 2.5M
Annual Performance
contracting
1 Annual Performance Contracting
Reports
1 1 1 1 1 5M
Conduct regular internal
management meetings
(CHMT and SCHMT)
12 Number of management meetings
conducted – CHMT, SCHMT
12 12 12 12 12 2.5M
Strengthen partnerships and
stakeholder coordination
strengthened
2 Number of health partnerships
established
2 2 2 2 2 2.5M
Public participation sessions
held
1 No of public participation sessions
held
1 1 1 1 1 10M
SP.1.2:
Health
Financing
30% Proportion of needy and vulnerable
population receiving universal access
to health services
35% 70% 80% 90% 100% 500M
SP.1.3: Improved work environment
and quality of care by
0 No. of QITs trained 100 250 200 100 100 7M

138 Kisumu County Integrated Development Plan | 2018 – 2022
Quality
Assurance
and
Standards
accreditation of health
personnel on ISO procedures
Quality improvement teams in
place in all Public Hospitals
8 Number of functional quality
improvement teams
10 13 15 17 21
Client Satisfaction Surveys
Conducted
1 Number of Client Satisfaction Surveys
Conducted 5 5 5 5 5 10M
Medicines and Therapeutic
committee in all Public
Hospitals
2 Number of functional MTC in all
Public Hospitals
5 9 13 17 21 5M
Conduct Clinical audits at Sub-
County Hospitals and JOOTRH
0 Number of hospitals conducting
clinical audits
2 8 13 17 21 5M
Availability of guidelines and
clinical standards in the
facilities
160 No. of facilities with required
guidelines and standards 30 20 25 25 20 10M
Improved skills on inspection
and licensure
0 No. of TOTs trained on inspection and
licensing 10 20 20 30 20 15M
202 Number of Health Facilities Inspected 50 50 50 50 40 10M
SP.1.4:
Human
Resource
Management
Health personnel recruited and
deploy personnel across all
cadres
193 Number of new Health work recruited 250 200 200 250 1B
County HRH strategy
developed
1 Develop the County HRH strategy 1 1 1 1 1 2M
In-service training for personnel 35 Number of personnel supported to
undertake in-service training
50 50 50 50 50 50M
Personnel promotion 246 Number of personnel promoted 100 100 100 100 100 2M
Institutionalize HRIS 50% % Sub-Counties with up to date HR
databases
100% 100% 100% 100% 100% 10M
Conduct annual HRH audit 0 Annual HRH audits conducted 1 1 1 1 1 1.5M
Institute occupational safety and
health practices in public
hospitals
0 Number of public hospitals compliant
with the OSH Act 2007
2 6 12 17 21 7M
1.5 Health
infrastructure
Improved and well-maintained
Health infrastructure
No. of public health facilities with
infrastructure master plans
0 5 10 15 21 2M
No of health facilities with titles deeds 2 48 50 55 45 25M
SP 1.6 Cross
cutting issues Enhanced Public Awareness on
Climate Change Mitigation and
0 Number of Health Personnel Trained
on Climate Change
50 50 70 50 40 15M
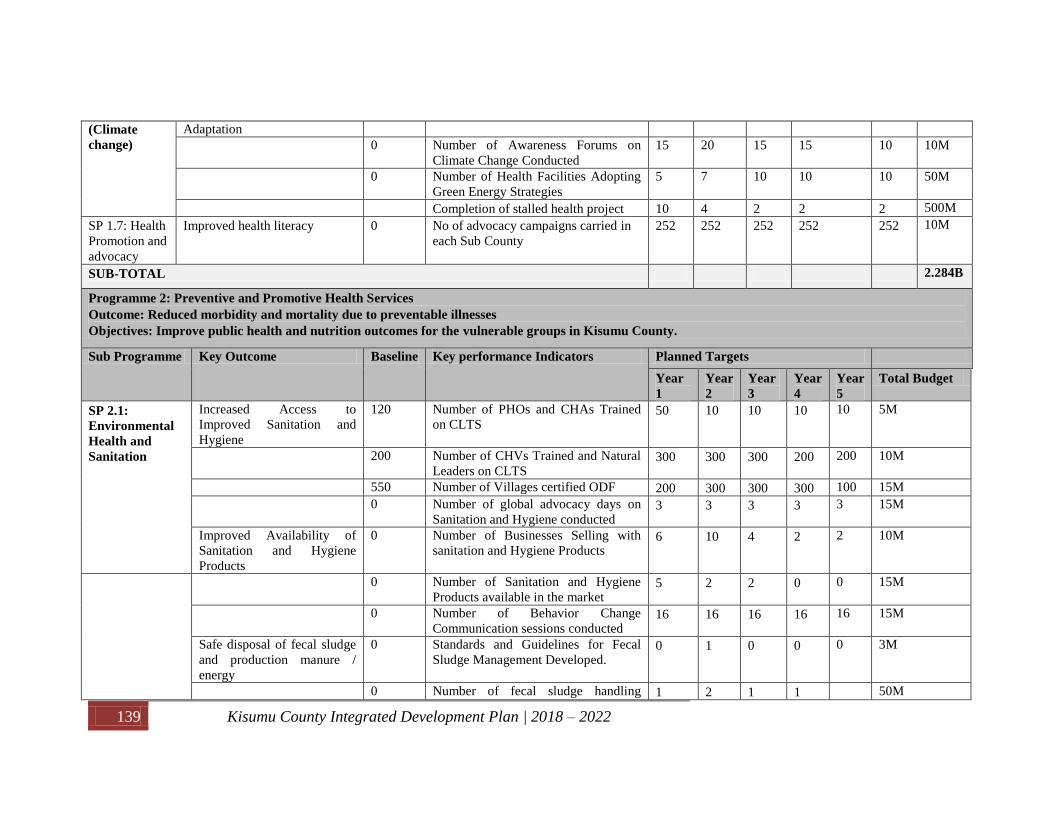
139 Kisumu County Integrated Development Plan | 2018 – 2022
(Climate
change)
Adaptation
0 Number of Awareness Forums on
Climate Change Conducted
15 20 15 15 10 10M
0 Number of Health Facilities Adopting
Green Energy Strategies
5 7 10 10 10 50M
Completion of stalled health project 10 4 2 2 2 500M
SP 1.7: Health
Promotion and
advocacy
Improved health literacy 0 No of advocacy campaigns carried in
each Sub County
252 252 252 252 252 10M
SUB-TOTAL 2.284B
Programme 2: Preventive and Promotive Health Services
Outcome: Reduced morbidity and mortality due to preventable illnesses
Objectives: Improve public health and nutrition outcomes for the vulnerable groups in Kisumu County.
Sub Programme Key Outcome Baseline Key performance Indicators Planned Targets
Year
1
Year
2
Year
3
Year
4
Year
5
Total Budget
SP 2.1:
Environmental
Health and
Sanitation
Increased Access to
Improved Sanitation and
Hygiene
120 Number of PHOs and CHAs Trained
on CLTS 50 10 10 10 10 5M
200 Number of CHVs Trained and Natural
Leaders on CLTS 300 300 300 200 200 10M
550 Number of Villages certified ODF 200 300 300 300 100 15M
0 Number of global advocacy days on
Sanitation and Hygiene conducted 3 3 3 3 3 15M
Improved Availability of
Sanitation and Hygiene
Products
0 Number of Businesses Selling with
sanitation and Hygiene Products 6 10 4 2 2 10M
0 Number of Sanitation and Hygiene
Products available in the market 5 2 2 0 0 15M
0 Number of Behavior Change
Communication sessions conducted 16 16 16 16 16 15M
Safe disposal of fecal sludge
and production manure /
energy
0 Standards and Guidelines for Fecal
Sludge Management Developed. 0 1 0 0 0 3M
0 Number of fecal sludge handling 1 2 1 1 50M

140 Kisumu County Integrated Development Plan | 2018 – 2022
companies and functional
0 Number of Latrines / Toilets Facilities
constructed in Health Centres and
Dispensaries
30 30 20 10 10 30M
Improved Vector Control 0 No. of premises sprayed or fumigated 8000 0 4000 5000 6000 12M
Improved food quality and
standards
0 No. of functional public Health
Laboratories established
1 0 0 0 0 8M
No. of food samples taken 150 200 250 300 200 6M
0 No. of food establishments inspected
and improved
2301 2500 2500 2500 2500 7M
0 Number of food control committees
established and Functional
1 7 0 0 0 2M
0 Number of Food Control Committees
Trained
1 4 3 0 0 1M
Safe and Healthy Housing 0 Number of building plans reviewed
and approved
500 500 600 700 800 5M
Safe water at household level 0 No. of water samples taken - 600 600 1400 1400 3M
1 No. of potter labs established 2 1 1 1 2 3.5M
0 Number of Trainings and Outreach
Sessions Conducted
30 30 20 20 20 10M
Compliance with public
Health Laws
Application of up to date
health care waste
management technology
Strengthen policy and
regulatory structures on
health care waste
management
Improved infrastructure for
health care management
0 No. of statutory notices served and
enforced
200 150 100 100 100 1M
0 Number of waste management
microwave installed and sustainably
managed
1 0 0 0 0 20M
0 No of Legal framework of health care
waste management for Kisumu County
1 0 0 0 0 2M
120 Number of health care facilities
supported to improve infrastructure
and healthcare waste treatment system
30 30 20 10 10 30M
0 Number of health care waste
management central coordinating units
established and equipped
0 0.5 0.5 0 0 30M
SP 2.2 Nutrition Improved maternal and Child 45 No. TOT trained workers trained 45 45 45 45 45 2.5M

141 Kisumu County Integrated Development Plan | 2018 – 2022
services feeding practices using CHS Nutrition packages
600 Number of frontline health workers
Trained on Nutrition packages
200 200 200 200 200 2.5M
0 Number of community units certified
baby friendly
2 2 2 2 2 6.0M
1 No of County Nutrition Action plans
developed
1 1 1 1 1 1.5M
400 No. CHVs and community leaders
trained on nutrition package.
200 200 200 200 200 1M
250 Number of anthropometric equipment
(MUAC tapes, baby weighing scales)
procured
600
pcs 600
pcs
600
pcs
600
pcs
600
pcs
1.5M
6 No of established breastfeeding
resource centres
2 2 2 2 2 7M
3 No. of national / International nutrition
celebrations observed
3 3 3 3 3 1.5M
Improved food and nutrition
security
6 No. of model/demonstration kitchen
gardens established
7 7 7 7 7 3.5M
20% Proportion of children <5 yrs.
supplemented with VAS twice yearly.
30% 50% 60% 70% 80% 2.5M
85% Proportion of pregnant women
receiving IFAS for 270 days.
87% 87% 90% 90% 90% 2.5M
Nutrition in emergencies and
treatment of malnutrition
<50% Proportion of facilities with adequate
stocks of therapeutic and
supplementary feeds
50% 50% 50% 50% 50% 41M
1 Number of nutrition emergency
contingency plans updated
1 1 1 1 1 1.5M
Enhanced nutrition policies 0 BMS act (code monitoring) reports
submitted annually
1 1 1 1 1 1M
0 Kisumu nutrition act developed 0 1 0 0 1 1.M
3 Conduct operation research 1 1 1 1 1 5.2M
0 Conduct nutrition sentinel site
surveillance
1 1 1 1 1 5.2M
2.3 County
Community
County Community Health
Services Operational Plan
No. of County Community Health
Services Operational Plan revised
1 1 1 1 1 5.0M

142 Kisumu County Integrated Development Plan | 2018 – 2022
Health Services revised
Stipends and NHIF
contribution for the CHVs
2240 Number of CHVs on stipend and
NHIF
2500 2550 2600 2650 2720 500M
Scale up community unit
functionality
158 Number of functional CUs 163 170 178 187 193 50M
Increase community unit
coverage
193 Number of new community units
established
219 225 230 235 240 50M
SP 2.4
Emergence
preparedness
and response
Health Referral Systems and
disease surveillance
strengthened
0 No. of County referral strategies
domesticated
1 1 1 1 1 2M
1 No. of emergency response plan
developed
1 1 1 1 1 10M
40 No. of personnel trained on referral
systems
50 50 50 50 50 10M
0 No of facilities offering EmoNc 2 2 2 2 2 10M
5 % of facilities with Emergency
response teams
10 15 20 25 50 10M
0 No personnel trained on basic and
advanced emergency response skills
20 30 50 70 80 50M
364 No. of early warning weekly reports
submitted
364 364 364 364 364 5M
Number of stalled health infrastructure
projects completed and
operationalized
100M
Number of county drugs and medical
supplies store constructed
0 1 0 0 0 30M
Number of level 2 and 3 facilities
adequately equipped
125 100M
SUB-TOTAL 1.3274B
Program 3: Medical and Biomedical Services

143 Kisumu County Integrated Development Plan | 2018 – 2022
Objective: To provide quality curative health services
Outcome: Improved treatment outcomes
Sub Programme Key Outcome Key performance
Indicators
Baseline
Planned Targets
Year 1 Year 2 Year 3 Year 4 Year 5 Total
Budget
SP.3.1
Hospital Services at
Level 5 Hospital
(JOOTRH)
Treatment and care at
JOOTH level 5
hospital including
diagnostics,
emergency and
specialized referrals
Number of modern MRI
machines procured and
installed in JOOTRH
0 1 0 0 0 0 200M
Cancer treatment center
JOOTRH
0 1 0 0 0 0 1B
Refurbished JOOTRH 0 0 1 0 0 0 1B
SP 3.2 Hospital
Services at Kisumu
County Referral
Hospital (KCH)
Treatment and care at
KCH level 4 hospital
including diagnostics,
emergency and
specialized referrals
Number of modern MRI
machines procured and
installed in KCH
0 0 1 0 0 0 200M
Refurbished Kisumu
County Referral Hospital
0 0 0 1 0 0 1B
SP 3.3 Hospital
Services at other
County and Sub-
County Hospitals
Treatment and care at
other county and sub
county hospitals
including diagnostics,
emergency and
specialized referrals
Number of Health
Facilities with equipped
Laboratories
2 8 15 20 20 10 1B
Number of level 4
hospitals with functional
X-ray units
4 5 6 7 0 0 150M
Number of level 4
hospitals with functional
operating theatre
2 3 4 5 6 7 500M
Percentage time out-of-
stock for a set of tracer
medicines and medical
supplies
NR 0% 0% 0% 0% 0% 1B
Construction of a morgue
in Muhoroni, Kombewa
and Nyakach
1 1 1 0 0 0 60M
Number of level 4 3 5 8 15 19 200M

144 Kisumu County Integrated Development Plan | 2018 – 2022
hospitals expanded and
fully equipped
SP 3.4 Reproductive
Health
Adolescent sexual
and reproductive
health friendly
services
Age at first sex 13 14 15 16 17 17 27M
Maternal and child
health targeting to
reduce maternal
mortality rate
MMR 465 430 410 390 370 365 30M
Availability of FP
commodities
Increase CPR 49 51 53 57 59 61 25M
SP 3.5 Non-
Communicable
Diseases.
Cancer screening
services provided
Proportion women of
reproductive age
screened for cervical
cancer
10 12 15 17 20 25 2M
Mental Health
Services provided
Number of mental health
cases reached
846 850 855 860 865 870 3M
New patients with
high blood pressure
reached
Proportion of new
outpatients with high
blood pressure reached
50 60 70 80 90 100 1M
Reduction in child
and adult obesity
Proportion of children
and adults with BMI >30
35 32 30 28 26 25 2M
SUB-TOTAL 6.4B
Program 4: Referral Services
Objective: To provide timely, quality and responsive referral services
Outcome: Improved referral services
Sub Programme Key Outcome Key performance
Indicators
Baseline
Planned Targets
Year 1 Year 2 Year 3 Year 4 Year 5
Total
Budget
4.1 Ambulance
Services Advanced life support
ambulances Procured
Number of advanced life
support ambulance
procured
0 2 2 2 1 1 80M
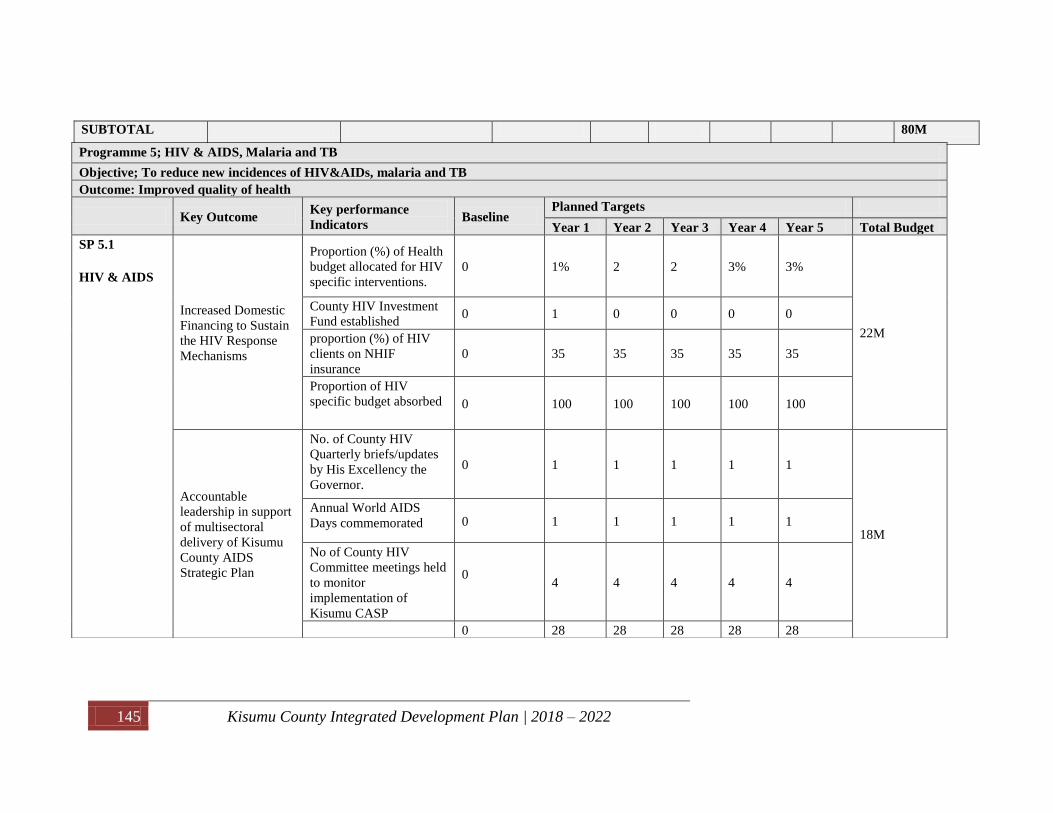
145 Kisumu County Integrated Development Plan | 2018 – 2022
SUBTOTAL 80M
Programme 5; HIV & AIDS, Malaria and TB
Objective; To reduce new incidences of HIV&AIDs, malaria and TB
Outcome: Improved quality of health
Key Outcome Key performance
Indicators Baseline
Planned Targets
Year 1 Year 2 Year 3 Year 4 Year 5 Total Budget
SP 5.1
HIV & AIDS
Increased Domestic
Financing to Sustain
the HIV Response
Mechanisms
Proportion (%) of Health
budget allocated for HIV
specific interventions.
0 1% 2 2 3% 3%
22M
County HIV Investment
Fund established 0 1 0 0 0 0
proportion (%) of HIV
clients on NHIF
insurance
0 35 35 35 35 35
Proportion of HIV
specific budget absorbed 0 100 100 100 100 100
Accountable
leadership in support
of multisectoral
delivery of Kisumu
County AIDS
Strategic Plan
No. of County HIV
Quarterly briefs/updates
by His Excellency the
Governor.
0 1 1 1 1 1
18M
Annual World AIDS
Days commemorated 0 1 1 1 1 1
No of County HIV
Committee meetings held
to monitor
implementation of
Kisumu CASP
0
4 4 4 4 4
0 28 28 28 28 28

146 Kisumu County Integrated Development Plan | 2018 – 2022
Increased availability
of strategic
information to
inform HIV response
at the County level
No. Reviews of Kisumu
County AIDS Strategic
Plan held 0 1 0 0 1 0
28M
No of HIV Situation
Room reports discussed
and actioned
1 1 1 1 1 1
No. of Quarterly HIV
data quality audits
conducted
0 2 2 2 2 2
1 2 2 2 2 2
No. of Quarterly HIV
Performance Review
Meetings held
1 4 4 4 4 4
Reduced annual new
HIV infection
% of the population
mobilized for uptake of
HIV Testing services
(HTS)
50% 60% 70% 80% 90% 100%
27M
No. of condoms
distributed. 1.5 2.5m 3m 3m 3.5m 4m
Proportion (%) of Key
population reached with
services and information
% of Adolescence and
young people (in and out
of school) reached with
targeted HIV & AIDS
interventions.
20% 50% 60% 70% 85% 100%
10% 20% 30 40 55% 65%

147 Kisumu County Integrated Development Plan | 2018 – 2022
% of Adolescence and
young people (in and out
of school) reached with
targeted HIV & AIDS
interventions.
0 7 7 7 7 7
Reduced barriers to
access of HIV
services.
No of Radio talk shows
conducted on SGBV 0 8 8 8 8 8
5M
Proportion of Head
teachers /principals
Sensitized on adolescent
HIV treatment, stigma
and discrimination
8 30 40 60 80 100
Proportion of schools
that have developed HIV
treatment, stigma and
discrimination policies
0 30 40 60 80 100
Research, Innovation
and Information
Management realized
to Meet Kisumu
County Strategic
Plan
No. of officers supported
to attend scientific
conferences 0 5 5 5 5 5
9M
No of Operational
Research conducted 0 1 0 0 0 0
Establish effective
laboratory networks
on Viral load
monitoring
No of samples collected
and sent for analysis 0 52 52 52 52 52 9M
Increase retention of
clients on ART
No of community ART
groups established 0 35 0 0 0 0 2M
Strengthen
community level
HIV & AIDS
Competency
No. of village councils
sensitized on HIV
response 0 35 35 35 35 35 2M
SP 5.2 Malaria All pregnant women
provided with Long
Proportion of pregnant
women provided with
85 88 90 93 95 97 7M

148 Kisumu County Integrated Development Plan | 2018 – 2022
Lasting Insecticide
Treated Nets
(LLITN)
Long Lasting Insecticide
Treated Nets (LLITN)
All children under 1
provided with
LLITN
Proportion of under 1
year provided with
LLITN
70 77 80 85 90 95
7 M
All pregnant women
provided with
Intermittent
Presumptive
Treatment (IPT) 2
IPT 2
Proportion of pregnant
women accessing
Intermittent Presumptive
Treatment (IPT) 2
50 55 60 65 70 75
7 M
LLITN distributed to
HH
Proportion of HH with of
LLITNs distributed 79 82 85 90 95 100 7 M
SP 5.3 TB Reduced TB
transmission
Percentage of TB
patients screened for HIV
100 100 100 100 100 100 1.5M
Proportion of TB patients
completing treatment
85 86 87 88 89 90 1.5 M
TB defaulter traced No of TB defaulters
traced
75 78 80 85 90 100 1.5 M
SUB-TOTAL 154.5M
TOTAL 10.246B

149 Kisumu County Integrated Development Plan | 2018 – 2022
4.4.7 TOURISM, ARTS&CULTURE, SPORTS AND INFORMATION
4.4.7.1 Sector Introduction
Sector/subsector
Tourism, Culture, Arts, Sports And Information
Sector/ Subsector composition:
Tourism Directorate
Culture and Arts Directorate
Sports and Talent Development Directorate
Information and Commuincation
Vision:
To be the leading tourism, culture, arts and sports destination in the country.
Mission:
A County offering high quality tourism, culture, arts and sports facilities, products and services
capable of competing on the global stage.
Sector Goal
To be the leading tourism, culture, arts and sports destination in the country.
Tourism Development
The County Government of Kisumu is prioritizing investment in tourism sector with an aim of
developing new and/or conserving of its existing tourism attractions. These include Community
Based Tourism products, heritage products for diversification, creating opportunities and
enabling environment for tourism and hospitality sector expansion among others. With these, the
County Government aims at doubling the number of tourists to the County and providing
favorable trickling down effect of revenues to the locals.
The County aims to position tourism department as the marketing arm of the county and the
center for tourism and investment development. Kisumu County has unique features such as the
shoreline of Lake Victoria, Kit Mikayi, Ndere, Island National Park, and Impala Park among
others which collectively make Kisumu a major tourist destination. Kisumu International Airport
currently has a major potential to deliver direct international tourists and visitors to the County.

150 Kisumu County Integrated Development Plan | 2018 – 2022
Kisumu International Airport had an historic event in February 2018 where one of the airlines
(Silverstone Air) launched direct flight to Mombasa, a great opportunity to increase trade,
investment and long lasting visitor experience.
Diversification and development of tourism products will largely be pursued by the County to
avoid over reliance on traditional beach and wildlife tourism that Kenya has always relied on for
a long time. These include cultural tourism, sports tourism, agro-tourism, MICE tourism, nature
based tourism, heritage sites, educational and research, unique scenery and landscape, arts and
crafts, community based tourism, adventure tourism, and beach based tourism activities and
events tourism.
The County was recently honored to host an African Premiere of the Superhero Black Panther
film that globally positioned Kisumu on the world map. The County will in addition to this host a
mega celebration dubbed fish Fiesta that will culminate annual celebrations to be hosted in the
city. Deliberate efforts will be made to promote authentic cultural tourism experiences and
launch high value cultural tourism festivals through theatre, arts, music and culinary aspects. So
far, Kolwa and AGES cultural dancers have been identified by the tourism Directorate for
revival of cultural tourism. The construction process of a heritage site at Katito is complete and
will act as tourism and cultural heritage demonstration center.
The County will also provide a platform for tourism and investment through exhibitions. The
County through tourism directorate will be hosting annual Tourism and Trade Investment Expos
for businesses and tourism players.
The County Government will be exploring possibilities of developing beach units complete with
Jetties and there are already talks with Tourism Fund and Tourism Finance Corporation towards
development of floating facilities and amusement parks in the County. Paga Beach is one of the
prioritized beaches earmarked for development in order to open Ndere Island National Park.
Promotion of lake recreational activities will help the County develop and promote a new
product water sports like boat racing and sports fishing. This will be carried out annually to open
up the shore line not only for fishing but also for other tourism activities.
Educational and research tourism is being considered for Kisumu and has great potential in this
area. Through research and development, the County Government will determine priority areas

151 Kisumu County Integrated Development Plan | 2018 – 2022
in order to open up the region for investment in the hospitality sector and other potential tourism
services. Tourism Information and data centers are a priority for the County of Kisumu.
In addition, the currently developed medical facilities to world class in Kisumu will have a bid
advantage as medical tourism destination.
The County is working towards opening up Kisumu for Meetings, Incentives, Convention and
Exhibitions (MICE) in the region. The County Government of Kisumu is exploring ways of
putting up a conference at the ground currently occupied by Sunset Hotel. This is done in
collaboration with the national government through Tourism Finance Corporation. This project
will open up MICE tourism not only for the County but also for the region. In addition,
promotion and branding of the County is expected to pick up through several marketing activities
and initiates.
The County Government through the Directorate of Tourism will give priority to use of modern
information systems to market and promote tourism products and services. The directorate is
focusing on use of website and social media, and apps to enable tourism information
management as well as creation of awareness globally.
In a summary, the Directorate of Tourism is currently undertaking the following programs:-
Updating catalogued and profiled information of existing and potential tourism products
in each sub county
Research and Information management on status of tourism in Kisumu County
Development of promotional materials
Branding the County
Diversification of tourism products and services to accommodate diverse source markets
into the County
Promotion and hosting tourism functions and events
Development of earmarked Community Based Tourism products in each Sub-County
Construction and development of Hippo Point Public Beach
To further broaden the tourism product base, the department will focus on refurbishing, branding
and marketing of the tourism sites across the county. This is in recognition of the potential of
heritage and culture as a driving force for sustainable tourism promotion and development.
152 Kisumu County Integrated Development Plan | 2018 – 2022
The department intends to position and market Kisumu County as an entertainment and
conferencing hub in this region. In this regard, plans are underway to develop recreational parks
as well build state of the art conferencing facilities as well as world Class Theater that will
enhance tourism promotion in the county.
Cultural Heritage.
Cultural Heritage sites suffer total neglect and have not benefited host communities and the
County as much as they should. All these heritage sites have no discernible social amenities
capable of attracting visitor and tourists .And the few tourists who out of curiosity visit them
have to bear the brunt of terrible roads which are impassible during poor weather conditions.
Besides, there are no resource centers in these heritage sites where visitors can get to learn their
significance. This scenario has ensured that the heritage sites remain just those places of tour by
curious visitors who are attracted by myths around them but not significant tourist products,
which they also ought to be.
A mechanism will be put in place to capture data on visitors on an ongoing basis, to provide
information on Cultural Heritage Sites, local communities and businesses. These will be
included among the metrics to be tracked so that the department maintains clear visibility on the
return of investment.
Visual and Performance Arts
Kisumu County has a robust creative industry that is driven by a large pool of talented youth.
The informal settlements of Nyalenda, Obunga, Manyatta, Nubian and Nyamasaria teem with
creative youth who not only find a medium of expression in performing Arts and Visual Arts but
also view the creative industry as their only escape pathway out of biting poverty. This has
ensured a steady supply of creative minds not only for local consumption but as a feeder to other
towns as is exemplified by the big names in the Country’s entertainment scene. Challenges
however exist those continue to impede the creative sector. For a long time, this important
economic lifeline has not attracted sufficient funding from the Government and the Private
Sector.
This has ensured that this sector has remained low key and at best scanty with little or no impact.
The County neither has a modern theatre where artistes can showcase their works nor a public

153 Kisumu County Integrated Development Plan | 2018 – 2022
Art Gallery where Visual Artistes can exhibit. This has exposed them to exploitation by
middlemen
The County does not have a modern high quality Film /video production studio where talented
artistes can produce their works. This therefore means that the upcoming Artistes must scramble
with their more established counterparts to produce from the limited local studios or seek
production of their works elsewhere.
There exists a database of Artists. This will be enriched with detailed information as we
implement the new strategy.
Sculpture and Handicrafts
Kisumu is the home of some of the leading craftsmen and women in the country having some of
the finest practitioners of Basketry, sculpture from wood and stone carving, pottery and
metalwork. Many of these craftspeople and sculptors ply their trade in Nairobi and further afield,
as the market within the county is currently underdeveloped. Many have abandoned the artistic
side of their craft relying more on producing functional products including carpentry and joinery,
masonry and welding of fittings and fixtures. The county citizens are some of the most proficient
and prolific Jua Kali artisans.
Music
The Lakeside communities around Kisumu have collectively been the dynamo of quintessential
Kenyan music since colonial times. The Benga genre that continues to influence local music
across the country was invented in Kisumu County. While there has been a relentless onslaught
of Kenyan musicians performing under the influence of global trends like rap, major artistes
from the region have prevailed in indigenous popular music and Kisumu County is a hotbed of
original and innovative beats and sounds.
An aspect that is often overlooked is that the County alongside its neighbors boasts the largest
assortment of traditional musical instruments. In Europe these would be labeled classical
instruments. These include Nyatiti, Abuu, Asili, Orutu, Ohangla, Bul, Oyieke. These coincide
with traditional musical genres such as Ohangla, Orutu, and Nyatiti and heavily influenced the
more contemporary Benga style.

154 Kisumu County Integrated Development Plan | 2018 – 2022
On the creative side, praise singing has always been a part of musical tradition. Leading
proponents of the genres mentioned above are adept at original compositions, sometimes
composing original pieces at short notice for major events like funerals and weddings. All this in
addition to the staple lyrics of love, loss and heroic events. Some of these lyrics cross over into
poetry.
Institutional support for these amazing musicians has been sorely lacking, from both the
government and private sectors. Devolution offers a great opportunity for sharper focus on this
rich vein of talent. Corporate sponsorship budgets have neglected indigenous music, even those
with cross over appeal. Better linkages with industry stakeholders, as well as promotion
championing the diverse and distinctive music from the County will elevate this great potential
to international level.
The infrastructure supporting musical production is under-developed when compared to the well
of talent available. Kisumu lacks state of the art recording studios, producers, and live
performance venues.
The numbers supporting the above narrative are few and far between. Under the new County
Government we have established a database of musicians in the county as a start. We intend to
capture more robust numerical information gathered from the spectrum of stakeholders,
recognizing the adage that what does not get measured does not get done. In particular we need
to track the productivity of our musicians both in volume as well as revenue generated from their
efforts. We also intend to keep an eye on the level of counterfeiting and pirating of the
intellectual property of our artistes.
Fashion and Textiles
Kisumu was the epicenter of a thriving textile industry with Kicomi producing high quality
fabrics with popular local designs. The industry supported the livelihoods of many cotton
growers and ginneries dotted across the county. The rise of cheap imports and in particular
mitumba, put paid to Kicomi as well as the whole cotton industry in the county leading to loss of
an important source of family income.

155 Kisumu County Integrated Development Plan | 2018 – 2022
Despite this situation the County has produced many leading designers inspired by the local
creative idioms. There is also a thriving artisanal design sector producing bespoke designs for
special occasions.
The Fashion and Textile industry is in dire straits. Kicomi collapsed, bringing down with it the
once thriving entire cotton growing and ginning sector. Cotton growing subcounties like
Nyakach and Seme have not found a replacement cash crop and reverted to subsistence farming.
With the advent of Mitumba, tailoring skills that were once well developed are being lost at an
alarming rate. Nevertheless some of the most creative African fashion designers reside in the
county. There is the opportunity to rebuild the industry around their creativity, leveraging the
power of the internet to market distinctive authentic designs to the discerning global consumer.
While the revival of the Fashion and Textile industry is primarily driven by the private sector,
the Minsitry of Tourism, Culture, Information and Sports plays a vital role in positioning and
marketing this facet of the county. It also harnesses and coordinates the efforts of all
stakeholders. Therefore it is vital to collect numerical data to measure the investments as well as
the outcomes of all the stakeholders. This is the first necessary exercise that we will undertake to
establish a baseline.
Sports
Kisumu County has a robust sporting culture. A number of sporting activities take place within
the County and several disciplines actively compete both locally and nationally. Some of the
most active sports disciplines in the County are Football/Soccer, Basketball, Netball, Rugby,
Hockey, Cricket, Tae Kwon Do, Karate, Badminton, Chess and Boxing.
Almost all sporting disciplines are run by registered organizations which have their branch
Offices within the County and which work closely with the Department of Sports. Some of these
organizations are the Football Federation of Kenya, Kenya Basketball Federation, and Kenya
Rugby Union, Kenya Hockey Federation, and Kenya Karate Federation.
The situation of sports in Kisumu County is a case of abundant talent against meager resources.
The budgetary allocation to the sports sector remains very low. This has not only effected
investment in the sportsmen but has also seen little investment in sports facilities. Moi Stadium
which is the main sports facility in Kisumu County is not only dilapidated but is also below

156 Kisumu County Integrated Development Plan | 2018 – 2022
FIFA accepted standards and therefore cannot host Continental matches. Even though the
Stadium was fitted with artificial turf under the FIFA Goal project, the rest of the facility is in a
deplorable state. It is important to note that the stadium cannot host Athletic games, as it has no
running lanes. This has not only hampered development of Athletics but has seen the County
miss out on hosting Athletic events. The Stadium too does not have suitable changing rooms and
the toilets are in a very bad state.
The other sub counties don’t fare any better in terms of facilities. Other than Muhoroni which
has a Company managed stadium, the rest of the Counties only have pitches. It is noteworthy to
report that the County Government has recently embarked on rehabilitating these community
pitches. This financial year, the County Government will rehabilitate the basketball pitch at Jomo
Kenyatta sports Ground, Ogada Pitch in Kisumu West, Pap Kadundo in Seme and Chemelil
Pitch in Chemelil.
Other than Football, the other disciplines too are challenged by lack of equipment, insufficient
facilities as well as sponsorship challenges. Lack of sponsorship is in itself the bane of all sports
disciplines in Kisumu County. Many Federations are unable to facilitate teams’ participation in
games due to lack of funds. The situation is not helped by the fact that Kisumu County does not
have many Businesses with brands of sufficient scale to assist sports clubs with adequate levels
of sponsorship.
Despite the listed challenges, sports continue to be a major resource for Kisumu County. With
the blessing of abundant talent, what is required is focused investment in this sector coupled with
prudent management. There is urgent need to streamline sports management by crafting a policy
framework capable of attracting cooperate investment. Similarly, there is need to market the
sector as a tourist product while broadening the base to venture into untapped potential areas
such as water sports.

157 Kisumu County Integrated Development Plan | 2018 – 2022
Sector Programmes
Table 44: Tourism, Arts&Culture, Sports and Information Sector Programmes
Tourism
Programme Name: Tourism Product development and diversification
Objective: To be the leading tourism, culture, arts and sports destination in the country
Outcome: A vibrant tourism sector with increased earnings
Sub Programme Key Outcome Baseline Key performance Indicators Planned Targets
Year 1 Year 2 Year 3 Year 4 Year
5
Total Budget
County destination
marketing Programme Increased tourist
arrivals
Increased domestic
bednights
0 Number of tourist arrivals
Bed occupancy
36 36 36 36 36 50M
PPP
Premium Parks and
Heritage Sites initiative Upgraded facilities
for Ndere islands,
Luanda Magere and
Kit- Mikayi
Rehabilitated
Infrastracture for the
two sites
0 No. of tourist arrivals
30M
Development of Niche
Products New Monuments
and Heritage sites
established
Homestays
developed across the
County
Promoted and
marketed Cultural
tourism through
festivals and Cruise
Tourism facilities
0 No of heritage sites developed.
No. of homestays
developed/registered
No. of Cultural festivals held
40 40 40 40 40 100M
PPP

158 Kisumu County Integrated Development Plan | 2018 – 2022
developed.
Businessand Conference
Tourism Initiative Increased no. of
business and
conference facilities
New Convetion
Centres developed
0 Number of competent tourism
and hospitality professionals
200 M
PPP
Development of
Community Wildlife
conservancies
Conserved environment 0 Number of conservancies
Developed
1 1 1 1 1 50M
Development of Lake
Recreational Beaches,
jetties and recreational
centers
Increased tourism activities
along the shores of L.
Victoria
0 Number of recreational beaches
and centers developed
100 M
PPP
Park/Aqua Parks An enabling environment
for leisure visitors
0 Number of parks developed 1 1 1 1 1 50M
PPP
Tourism Information
Center s
Tourist destination sites
identified
0 Information centers built in all
tourism sites
2 1 15M
SUBTOTAL 595M
Programme Name: Tourism Regulation and Standards Development
Objective: To offer and maintain internationally accepted standards of tourist service to compete effectively in the global economy
Outcome: Standard tourism infrastructure
Sub Programme Key Outcome Baseline Key performance
Indicators
Planned Targets
Year
1
Year
2
Year
3
Year
4
Year
5
Total
Budget
Tourism stakeholders training and
education awareness
Well informed tourism
stakeholders
0 Numbers of trainings
undertaken
12 12 12 12 12 10 M
Inspection of tourist establishments World class services with required
acceptable global standards
0 Number of
establishments inspected
4 4 4 4 4 20
million
Develop and maintain databases of
tourism facilities and services
Established data base for tourists’
arrivals
0 Verifiable data on tourist
arrivals.
10M
Establish a Kisumu County Tourism
Excellence Award Scheme
Motivated tourism sector offering
world class services
0 Annual Award Scheme 50M
PPP
SUBTOTAL 90M

159 Kisumu County Integrated Development Plan | 2018 – 2022
Programme Name: Tourism Sector Policy and Legal Framework Development
Objective: To develop a policy and legal framework to facilitate growth in the tourism sector to spur growth and competiveness
Outcome: An orderly and regulated tourism sector competing favorably in the global market
Sub Programme Key Outcome Baseline Key performance
Indicators
Planned Targets
Year
1
Year
2
Year
3
Year
4
Year
5
Total
Budget
Draft Kisumu County Tourism Legislation in
line with the National Tourism Policy and
Tourism Act 2011
Well-regulated tourism
sector
0 County tourism bill 1 0 0 0 0 5M
Establish Kisumu County Tourism Advisory
Committee
All-inclusive and well
managed Sector Co-
ordination
0 Tourism committee 3 3 3 3 3 10 M
Strengthen inter-County collaboration on
tourism matters (4 meetings per year)
Collaborative approach
towards tourism
development
0 Number of inter
county meetings
4 4 4 4 4 10M
Programme: Tourism Marketing and Promotion
Objective: To position the sector as the marketing and branding arm of the County and to promote the Counties unique attributes for sustainable development
Outcome: A competitive tourist destination.
Sub Programme Key Outcome Baseline Key performance Indicators Planned Targets
Year
1
Year
2
Year
3
Year
4
Yea
r 5
Total
Budget
Kisumu County Branding Positioning Kisumu county
as a unique destination
0 No. of tourist arrivals
Increased earning from the sector
30M
PPP
Tourism Exhibitions in
Kisumu County
Positioning Kisumu as a
tourism destination
0 Number of tourism exhibitions 1 1 1 1 1 25 M
International Trade Fairs and
Exhibitions
Marketing Kisumu to the
outside world
0 Number of international
exhibitions attended
9 9 9 9 9 40M
SUB TOTAL 120M

160 Kisumu County Integrated Development Plan | 2018 – 2022
Programme Name: Development of Human Resource in Tourism
Objective: To train a pool of competent tourism professionals to spur growth and focused marketing of the tourism sector
Outcome: Competent tourism and hospitality professionals
Sub Programme Key Outcome Baseline Key performance
Indicators
Planned Targets
Year
1
Year
2
Year
3
Year
4
Year
5
Total
Budget
Tourism sector Personneling
Vibrant and well-trained
tourism personnel
0 Number of trained personnel 8 1 1 1 1 12 M
Workshops for hoteliers, tour
operators and communities
and groups in the sector
A well-informed community 1 Number of workshops held 4 4 4 4 4 20M
SUBTOTAL 32M
Programme Name: Tourism Financing
Objective: To create a tourism fund into which the tourism sector players can pull resources for development of the sector
Outcome: A well-resourced tourism sector
Sub Programme Key Outcome Baseline Key performance
Indicators
Planned Targets
Year
1
Year
2
Year
3
Year
4
Year
5
Total
Budget
Establishment of the County
Tourism Fund
Economically empowered
sector players
0 Number CBTEs funded 20m 0 0 0 0 80 M
SUBTOTAL 80M
CULTURE AND ARTS
Programme Name: Preservation of Community Cultural Heritage
Objective: To promote Preservation of cultural heritage for posterity
Outcome: Impoved incomes through our cultural values
Sub Programme Key Outcome Baselin
e
Key performance Indicators Planned Targets
Year
1
Year
2
Year
3
Year
4
Year
5
Total
Budget
Rehabilitation and
improvement of infrastructure
Improved and well-
maintained heritage sites
0 No of tourists visiting the sites.
Increased earning from the sites
2 1 1 2 2 80M

161 Kisumu County Integrated Development Plan | 2018 – 2022
–Heritage Sites
Annual Cultural and
CreativeArts Events
Increased participation of
stakeholders
No. of events organized.
No. of People attending and
Participating in the event
1 1 1 1 1 30M
SUBTOTAL 110M
Programme Name: Culture and Art Infrastructure Development
Objective: To harness the full potential of artistes for development
Outcome: Adequate infrastructural facilities for artistic expression
Sub Programme Key Outcome Baselin
e
Key performance Indicators Planned Targets
Year
1
Year
2
Year
3
Year
4
Year
5
Total
Budget
Completion and equipping of
Cultural Centres
Completed Cultural
centres where artist
recreate, exhibit and
produce.
70% No. of Productions and
exhibitions done
15% 15%
10M
Construction of Sub County
Cultural centres
A vibrant artists Industry 20% 1 1 1 1 1 100M
SUBTOTAL 110M
Programme Name: Culture and Arts financing
Objective: To create a fund to finance culture and arts programme to ensure a vibrant creative industry sector
Outcome: A vibrant creative industry
Sub Programme Key Outcome Baseli
ne
Key performance
Indicators
Planned Targets
Year
1
Year
2
Year
3
Year
4
Year
5
Total
Budget
Culture and Arts Development
Fund
Well-funded cultural
organization
0 No of artists accessing
the fund
3 3 3 10M
Kenya Inter County Sports and
Cultural Association (KICOSCA–
Culture Component)
A county excelling in personnel
games and cultural activities
with a healthy personnel
5 Participation of the
County in KICOSCA
1 1 1 1 1 25M
SUBTOTAL 40M
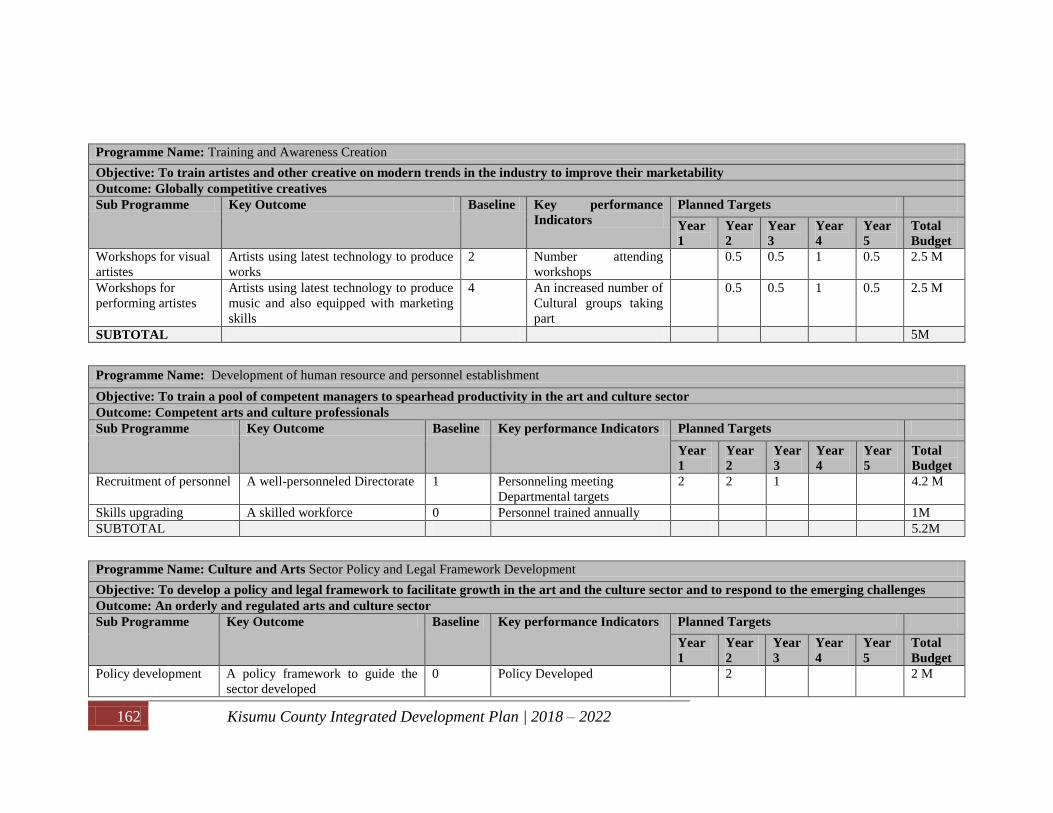
162 Kisumu County Integrated Development Plan | 2018 – 2022
Programme Name: Training and Awareness Creation
Objective: To train artistes and other creative on modern trends in the industry to improve their marketability
Outcome: Globally competitive creatives
Sub Programme Key Outcome Baseline Key performance
Indicators
Planned Targets
Year
1
Year
2
Year
3
Year
4
Year
5
Total
Budget
Workshops for visual
artistes
Artists using latest technology to produce
works
2 Number attending
workshops
0.5 0.5 1 0.5 2.5 M
Workshops for
performing artistes
Artists using latest technology to produce
music and also equipped with marketing
skills
4 An increased number of
Cultural groups taking
part
0.5 0.5 1 0.5 2.5 M
SUBTOTAL 5M
Programme Name: Development of human resource and personnel establishment
Objective: To train a pool of competent managers to spearhead productivity in the art and culture sector
Outcome: Competent arts and culture professionals
Sub Programme Key Outcome Baseline Key performance Indicators Planned Targets
Year
1
Year
2
Year
3
Year
4
Year
5
Total
Budget
Recruitment of personnel A well-personneled Directorate 1 Personneling meeting
Departmental targets
2 2 1 4.2 M
Skills upgrading A skilled workforce 0 Personnel trained annually 1M
SUBTOTAL 5.2M
Programme Name: Culture and Arts Sector Policy and Legal Framework Development
Objective: To develop a policy and legal framework to facilitate growth in the art and the culture sector and to respond to the emerging challenges
Outcome: An orderly and regulated arts and culture sector
Sub Programme Key Outcome Baseline Key performance Indicators Planned Targets
Year
1
Year
2
Year
3
Year
4
Year
5
Total
Budget
Policy development A policy framework to guide the
sector developed
0 Policy Developed 2 2 M
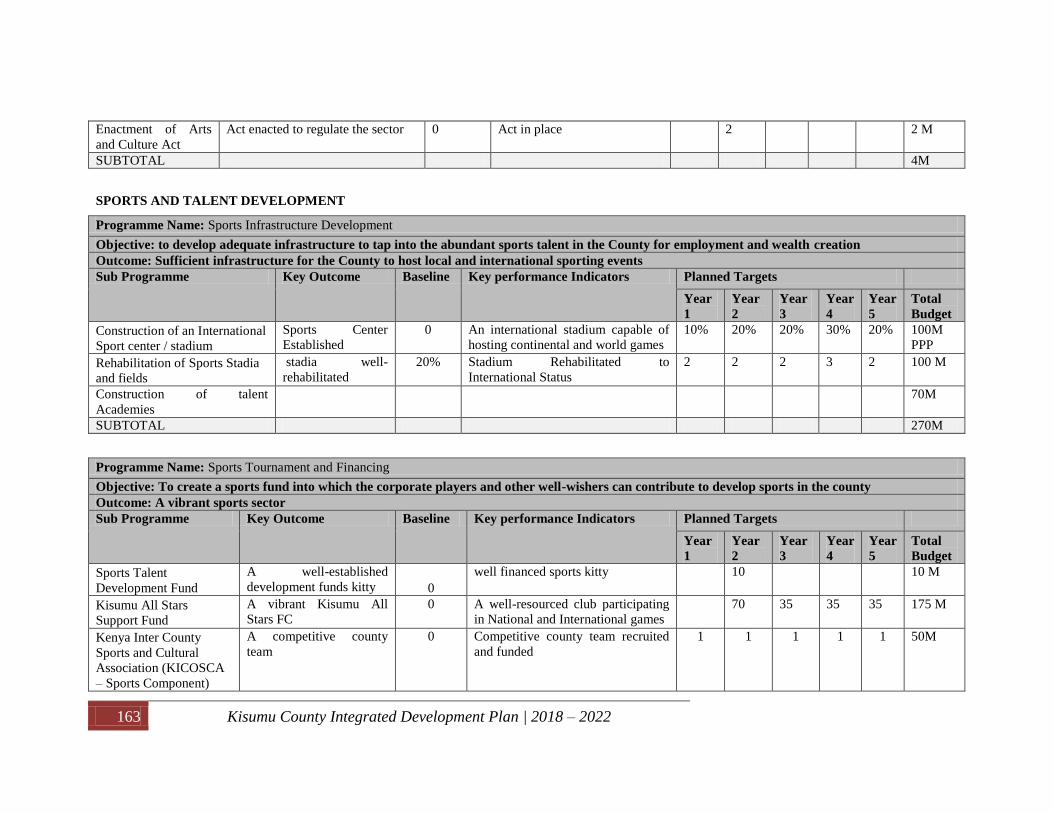
163 Kisumu County Integrated Development Plan | 2018 – 2022
Enactment of Arts
and Culture Act
Act enacted to regulate the sector 0 Act in place 2 2 M
SUBTOTAL 4M
SPORTS AND TALENT DEVELOPMENT
Programme Name: Sports Infrastructure Development
Objective: to develop adequate infrastructure to tap into the abundant sports talent in the County for employment and wealth creation
Outcome: Sufficient infrastructure for the County to host local and international sporting events
Sub Programme Key Outcome Baseline Key performance Indicators Planned Targets
Year
1
Year
2
Year
3
Year
4
Year
5
Total
Budget
Construction of an International
Sport center / stadium
Sports Center
Established
0 An international stadium capable of
hosting continental and world games
10% 20% 20% 30% 20% 100M
PPP
Rehabilitation of Sports Stadia
and fields
stadia well-
rehabilitated
20% Stadium Rehabilitated to
International Status
2 2 2 3 2 100 M
Construction of talent
Academies
70M
SUBTOTAL 270M
Programme Name: Sports Tournament and Financing
Objective: To create a sports fund into which the corporate players and other well-wishers can contribute to develop sports in the county
Outcome: A vibrant sports sector
Sub Programme Key Outcome Baseline Key performance Indicators Planned Targets
Year
1
Year
2
Year
3
Year
4
Year
5
Total
Budget
Sports Talent
Development Fund
A well-established
development funds kitty
0
well financed sports kitty 10 10 M
Kisumu All Stars
Support Fund
A vibrant Kisumu All
Stars FC
0 A well-resourced club participating
in National and International games
70 35 35 35 175 M
Kenya Inter County
Sports and Cultural
Association (KICOSCA
– Sports Component)
A competitive county
team
0 Competitive county team recruited
and funded
1 1 1 1 1 50M

164 Kisumu County Integrated Development Plan | 2018 – 2022
Inter Ward Sports
Competitions
Young talented players
identified and
placed/developed further
0 No. of players identified
No. of games played
1 1 1 1 1 50M
Recruitment of personnel Enhanced supervision and
development of talents
0 No. of personnel recruited.
3 3 1 0 0 10M
Training of coaches Enhanced capacity of
coaches
No. of coaches trained
SUBTOTAL 295M
TOTAL 1.756B
DIRECTORATE OF COMMUNICATION
Programme Name: Communication Services
Objective: To engage the public and disseminate information of the County's programs and activities.
Outcome: Effective and efficient communication among CGK’s departments and the public.
Sub Programme Key Outcome Baseline Key performance Indicators Planned Targets
Year
1
Year
2
Year
3
Year
4
Year
5
Total
Budget
Installation of LED screens for
public communication in the sub
counties
Effective, reliable and
timely communication
0 No. of LED screens installed 1 6 0 49M
Development of communication
policy and strategy
A clear framework for
public communication
0 policy and strategy developed 1 5M
Designing, publishing and circulation
of County biannual magazines
Informed and engaged
public
0 Number of published and
circulated county magazines
2 2 2 2 2 30m
Running of radio programs
Informed and engaged
public
0 Number of radio programs
held (Monthly)
48 48 48 48 48 20M
Capacity building and training on
media literacy
Informed personnel on
media relations
0 Number of personnels trained 15M
Broadcast equipment Boost creative production
industry
0 Number of programs produced 60M
Personnel recruitment Improved service delivery 7 Number of Personnel recruited 7 0 0 0 0 10M
TOTAL 189M

165 Kisumu County Integrated Development Plan | 2018 – 2022
DIRECTORATE OF INFORMATION
Programme Name: 3. Information/resource centers
Objective: To provide easy access to accurate and reliable Information to county residents up to the grass root level
Outcome: Improved access to accurate and reliable information
Sub Programme Key Outcome Key performance Indicators Planned Targets
Year
1
Year
2
Year
3
Year
4
Year
5
Total
Budget
Setting up a county Library/
Archive Centre
Enhanced access to information Established County Library/Archive
center
1 15M
Document/ Information
management systems policy
Clear guidelines on County
Information management and
dissemination
No Document/ Information
Management policy in place
5M
Development of an SMS pop up
system/unstructured supplementary
service data (USSD)- protocol
Enhanced public engagement SMS pop up system in place 1 2M
TOTAL 22M

166 Kisumu County Integrated Development Plan | 2018 – 2022
4.4.8 AGRICULTURE, LIVESTOCK AND FISHERIES SECTOR
Sector composition:
Agriculture and Crop production,
Livestock production,
Fisheries
Veterinary Services
Vision:
a Vibrant Food and Nutrition secure County
Mission:
An innovative, commercially oriented agriculture in Kisumu County
Sector Goal
Achieve food and nutrition security and commercially sustainable agriculture

167 Kisumu County Integrated Development Plan | 2018 – 2022
4.4.8.2 Sector Programmes
Table 45: Agriculture, Livestock and Fisheries Sector Programmes
Programme Name: General Administration and Planning Services
Objective: To have efficient administration and planning
Outcome: Effective service delivery
Sub Programe Key Outcome Baseline Key performance Indicators Planned Targets
Year
1
Year
2
Year
3
Year
4
Year
5
Total
Budget
Planning and Coordination Services Policies developed 0 No of policies developed 4 10M
Revolving fund 0 No established 0 2 0 0 0 30M
Regulation of profession % compliance 100% 100% 100% 100% 100% 2.5M
Acts developed 0 No of legislation developed 2 2 2 2 2 10M
Management of Stations Utility bills paid No of utilities 32 32 32 32 32 10.M
Offices managed No of offices 32 32 32 32 32 5M
Equipment purchased No of equipment’s 10 10 20 20 10 15M
Refurbishment of offices No of offices 32 32 32 32 32 35M
Development of Human Resources Officers trained. 2017 No of officers trained 30 30 30 30 30 8.0M
Management of Capital Resources Procurement of vehicles,
motorcycle, tractors, boat
and Agricultural
machinery
No of vehicles procured 4 0 4 2 2 30M
No of motorcycles procured 10 10 5 5 5 5M
No of machinery procured 0 0 0 0 0 0
Procurement of boats 1 No of boats procured 0 1 0 0 0 10.0M
SUBTOTAL 170.5M

168 Kisumu County Integrated Development Plan | 2018 – 2022
Programme :2 Sustainable land use
Outcome: Sustainable Agricultural production
Sub Programme Key Outcome Baseline Key performance
Indicators
Planned Targets
Year
1
Year
2
Year
3
Year
4
Year
5
Total
Budget
Promotion of Soil and Water
management
Increased adoption of soil and
water management technologies
No. of technologies
adopted
10 10 10 10 10 48M
Promotion of Water Harvesting Increased use of water harvesting
technologies
No. of users of water
harvesting technologies
- 3 3 3 3 48M
Special Agriculture Projects
Increased adoption of climate
smart technologies in agricultural
value chains,
2017 No. of of climate smart
technologies adopted
3 3 3 3 3 70M
SUBTOTAL 166M
Programme Name: 3 Agricultural productivity and output improvement
Objective: To increase agricultural productivity and output
Outcome: Increased production of agricultural produce
Sub Programe Key Outcome Baseline Key performance
Indicators
Planned Targets
Year 1 Year 2 Year 3 Year 4 Year 5 Total
Budget
Management of Agriculture
Advisory services
Extension messages packaged
and disseminated
No of farmers reached 12000 14000 15800 17200 18600 60M
Appropriate working tools
provided
No of tools and
facilities provided
32 32 32 32 32 4.5M
Development of crop production
value chains
Trainings conducted No of farmers trained 4000 5600 6400 7200 8000 15M
No of value chain
initiated
2 2 2 2 2 10M
Certified planting
material/seed procured
MT of seeds or No of
cuttings
736
tonnes/
5000
bags of
cutting
600
tonnes/
4000
bags of
cutting
500
tonnes/
3500
bags of
cutting
500
tonnes/
3500
bags of
cutting
500
tonnes/
3500
bags of
cuttings
300M

169 Kisumu County Integrated Development Plan | 2018 – 2022
s s s
Development of livestock
production value chains
Procurement of Dairy cattle No of improved
animals and trainings
600 300 200 0 0 168M
Poultry production No of birds and
trainings
10,500 10,500 10,500 10,500 10,500 66M
Sheep and goat’s production No of sheep and goats
and trainings
600 1000 500 0 0 11M
Apiculture No of equipment and
trainings
7 7 7 7 7 10M
Emerging livestock
production
No of trainings 7 7 7 7 7 3.5M
Development of fisheries value
chains
Fish Farmers/traders trained,
BMUs, Feed Manufacturers
No of farmers
trained/traders
1000 1000 1000 1000 1000 13.5M
No of value chain
initiated
2 0 0 0 0 5.0M
Management Crop pest and
diseases
Farmers trained No of farmers trained 12000 14000 15800 17200 18600 27M
Management Livestock pest and
diseases
Meat inspected No of meat inspections 10,000 10,500 11,025 11,575 12,155 15M
Management Livestock pest and
diseases
Meat inspected No of meat inspections 10,000 10,500 11,025 11,575 12,155 15M
Animals vaccinated No of animal
vaccinated
20,000 22,000 24,200 26,600 29,200 50M
Farmers trained No of farmers 1,000 1,200 1,440 1,720 2,070 4.5M
Livestock saleyards No constructed 2 2 1 1 1 35M
Leather development Flayers trained No of flayers trained 250 250 250 250 250 2.5M
Curing premises No of premises
licenced
20 20 20 20 20 1M
Rural tanneries established No of rural tanneries
established
1 0 1 0 0 5M
Hides and skin produced Tonnes produced 100 110 121 133 146 2M
1.Leather and leather goods The pieces, no/MT of
leather good produce
24000 26400 29040 31944 35138 1M
Livestock breed improvement AI services No of insemination 2000 2400 2880 3456 4147 8M

170 Kisumu County Integrated Development Plan | 2018 – 2022
Training of inseminators No trained. 0 3 0 3 3 5M
Semen/liquid nitrogen
facilities
No of storage facilities
established
2 2 2 1 0 5M
Synchronization/breeding
improvement technologies
No of animals
improved
2000 2400 2880 3456 4147 89M
Agriculture Mechanization
Development
Equipment purchased No procured 8 8 8 8 8 200M
SUBTOTAL 1.132B
Programme Name: 4. Enhancement of Agricultural Credit and Inputs Access
Objective: To enhance access to credit and inputs by agricultural value chain actors (VCA)
Outcome: Increased credit and farm inputs access.
Sub Programe Key Outcome Baseline Key performance
Indicators
Planned Targets
Year 1 Year 2 Year 3 Year 4 Year 5 Total
Budget
Agriculture credit access Increased credit access 0 No. of VCA
accessing credit
12000 12000 12000 12000 12000 5.5 M
0 No, of VCA
capacity built on
resource
mobilization
12000 12000 12000 12000 12000 5.5 M
Agriculture/ Farmers Revolving
Loan Fund
increased and affordable
credit
0 No. of farmers
accessing Credit
600 700 800 900 1000 30M
Agriculture input access Increased farm input
access.
No. of farmers
accessing inputs
10,000 10,000 10,000 10,000 10,000 150
SUB-TOTAL 191M
Programme:5 Market Accessability
Objective: to promote market access and products development
Outcome: Increased credit and farm inputs access.
Sub Key Outcome Baseline Key performance Planned Targets

171 Kisumu County Integrated Development Plan | 2018 – 2022
Programe Indicators Year 1 Year 2 Year 3 Year 4 Year 5 Total
Budget
Promotion of
agribusiness.
Farmers trained 0 No of
organizations
30 30 30 30 30 15M
Market information reports collected 0 No of reports 300 300 300 300 300 3.5M
Agri-business advisory centre established 0 Agribusiness
center established
1 1 1 1 1 30M
Farmers /traders trained- Crop products value
addition, Livestock products value addition,
and Fish products value addition
0 No of products 28 28 28 28 28 120M
Slaughter house rehabilitated/maintained 0 No of structures 3 3 3 3 3 50.0M
Fish banda/ice making machine/cold storage 0 No of
structures/facilities
3 3 3 3 3 75.0M
Development
of Product
Quality
Assurance
Farmers trained 0 No trained 300 300 300 300 300 20.0M
Meat inspection 0 No of inspections
done
360 360 360 360 360 15.0M
Abattoirs inspection 0 No licenced 12 12 12 12 12 2.5M
SUB-TOTAL 331M
TOTAL 1.99B
172 Kisumu County Integrated Development Plan | 2018 – 2022
4.4.9 BUSINESS/TRADE, ENERGY AND INDUSTRY
Sector Compsition:
Co-operative development
Industrialization
Enterprise & training development
Trade
Weights and Measures
Energy/green – Energy
Climate-change
Vision:
Competitive sustainable industrial enterprises, cooperatives, trade and afforadle energy for all
Mission:
To create an enabling environment for a county competitive sustainable, industrial enterprises,
cooperatives and secure energy for county development.
Goal:
Promote industrialization, enterprise cooperative and affordable energy through policy formulation
and regulation
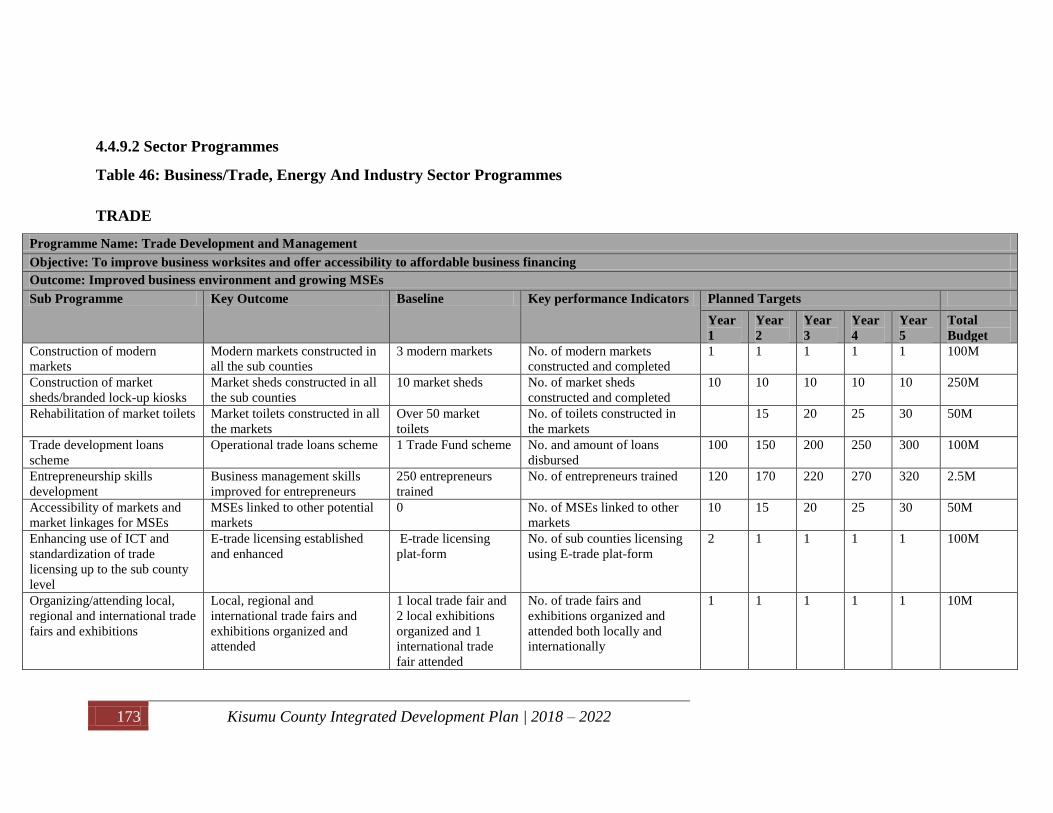
173 Kisumu County Integrated Development Plan | 2018 – 2022
4.4.9.2 Sector Programmes
Table 46: Business/Trade, Energy And Industry Sector Programmes
TRADE
Programme Name: Trade Development and Management
Objective: To improve business worksites and offer accessibility to affordable business financing
Outcome: Improved business environment and growing MSEs
Sub Programme Key Outcome Baseline Key performance Indicators Planned Targets
Year
1
Year
2
Year
3
Year
4
Year
5
Total
Budget
Construction of modern
markets
Modern markets constructed in
all the sub counties
3 modern markets No. of modern markets
constructed and completed
1 1 1 1 1 100M
Construction of market
sheds/branded lock-up kiosks
Market sheds constructed in all
the sub counties
10 market sheds No. of market sheds
constructed and completed
10 10 10 10 10 250M
Rehabilitation of market toilets Market toilets constructed in all
the markets
Over 50 market
toilets
No. of toilets constructed in
the markets
15 20 25 30 50M
Trade development loans
scheme
Operational trade loans scheme 1 Trade Fund scheme No. and amount of loans
disbursed
100 150 200 250 300 100M
Entrepreneurship skills
development
Business management skills
improved for entrepreneurs
250 entrepreneurs
trained
No. of entrepreneurs trained 120 170 220 270 320 2.5M
Accessibility of markets and
market linkages for MSEs
MSEs linked to other potential
markets
0 No. of MSEs linked to other
markets
10 15 20 25 30 50M
Enhancing use of ICT and
standardization of trade
licensing up to the sub county
level
E-trade licensing established
and enhanced
E-trade licensing
plat-form
No. of sub counties licensing
using E-trade plat-form
2 1 1 1 1 100M
Organizing/attending local,
regional and international trade
fairs and exhibitions
Local, regional and
international trade fairs and
exhibitions organized and
attended
1 local trade fair and
2 local exhibitions
organized and 1
international trade
fair attended
No. of trade fairs and
exhibitions organized and
attended both locally and
internationally
1 1 1 1 1 10M
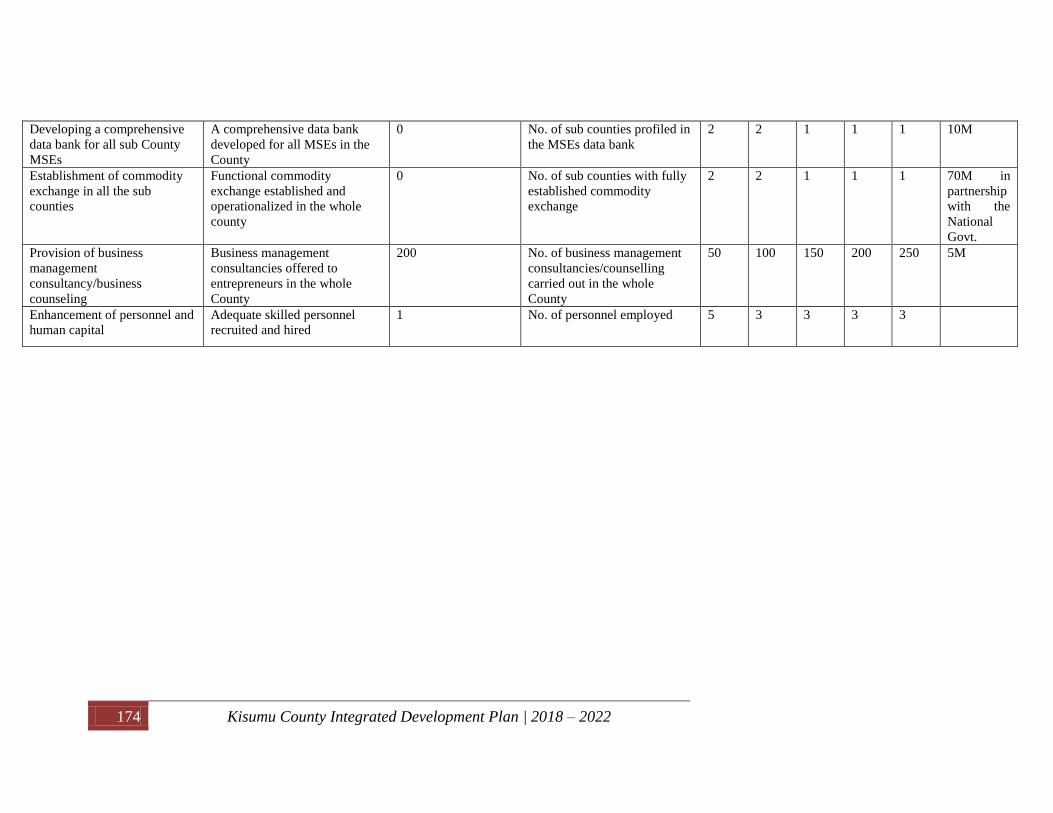
174 Kisumu County Integrated Development Plan | 2018 – 2022
Developing a comprehensive
data bank for all sub County
MSEs
A comprehensive data bank
developed for all MSEs in the
County
0 No. of sub counties profiled in
the MSEs data bank
2 2 1 1 1 10M
Establishment of commodity
exchange in all the sub
counties
Functional commodity
exchange established and
operationalized in the whole
county
0 No. of sub counties with fully
established commodity
exchange
2 2 1 1 1 70M in
partnership
with the
National
Govt.
Provision of business
management
consultancy/business
counseling
Business management
consultancies offered to
entrepreneurs in the whole
County
200 No. of business management
consultancies/counselling
carried out in the whole
County
50 100 150 200 250 5M
Enhancement of personnel and
human capital
Adequate skilled personnel
recruited and hired
1 No. of personnel employed 5 3 3 3 3

175 Kisumu County Integrated Development Plan | 2018 – 2022
Table 13: Sector Programmes: Weights and Measures/ Legal Metrology
Programme Name: Consumer Protection and promotion of fair trade practices
Objective: Improved consumer confidence from quantity measurements in trade and trade descriptions
Outcome: Compliance to Weights and Measures Act (Legal Metrology Act) and Trade Descriptions Act
Sub Programme Key Outcome Baseline Key performance
Indicators
Planned Targets
Year
1
Year
2
Year
3
Year
4
Year 5 Total
Budget
Construction and establishment
of County Legal Metrology Lab Functional Legal Metrology
Laboratory constructed & equipped
0 One Legal Regional
Laboratory constructed at
Kisumu Central Sub
County
1 100M
Erection of weighbridges in
sugar belt region Fully operational weighbridges
erected at Chemelil and Muhoroni
areas
No. of weighbridges
erected at various locations
in the County
1 1 1 1 1 25M
Procure and establish
weighbridge testing unit Fully equipped weighbridge testing
unit established
0 No. of roller weights
procured and mobile
testing unit truck
5
Tonn
es
5
Tonn
es
1
truck
Conti
nued
Contin
ued
25M
Erection of cattle weighers in all
cattle markets Operational cattle weighers erected at
entry points of cattle markets
0 No. of cattle weighers
erected at cattle markets in
the County
Nil 10 10 10 10 16M
Verifications of weighing and
measuring equipment used for
trade in all the sub counties
Accurate weighing and measuring
equipment for trade use in the whole
County
0 No. of weighing and
measuring equipment
verified
6,000 7,000 8,000 9,000 10,000 5M
Inspections and enforcement in
relation to Weights & Measures
Act and Trade Descriptions Act
Compliance to provisions of Weights
and Measures Act & Trade
Description Act
50 No. of businesses inspected
for compliance to Weights
& Measures Act and Trade
Descriptions
100 150 200 250 300 2M
Procure and establish fully
equipped mobile verification unit
Established fully operational and
equipped mobile verification unit
established
0 Mobile verification unit
purchased for the County
Nil 1 Conti
nued
Conti
nued
Contin
ued
10M

176 Kisumu County Integrated Development Plan | 2018 – 2022
Rebrand Weights and Measures
Dept to Legal Metrology Dept.
Weights and Measures Dept.
rebranded to County Legal Metrology
Dept.
0 Rebranding carried out 1 Conti
nued
Conti
nued
Conti
nued
Contin
ued
2M
done in
partners
hip with
GOK
GREEN ENERGY AND CLIMATE CHANGE
Goal: Enhance climate actions to a low carbon and climate resilience pathway
Programme 1: Name; Mainstreaming Climate Change Adaptation and Mitigation
Objective 1: Strengthen institutional and organizational capacity
Outcome: Improved institutional framework for implementation of climate change act and county climate change policy
Key Sub-program Baseline Key Outcome Key performance
indicator
Planned targets
Year
1
Year
2
Year
3
Year
4
Year
5
Budget

177 Kisumu County Integrated Development Plan | 2018 – 2022
County Climate change
policy and legislation
Implementation
7 Establishment of ward and village
climate change committees and capacity
building them.
County gazettement of Climate Change
council/board
Climate Change trust fund
Technical working committees
Monitoring and evaluation of
projects
No of CC Village
committees formed and
operational
1Council formed
No of tech committees
No of projects evaluated
17
1
4
25
18
-
-
25
-
25
-
25
-
25
5M
5M
Domesticate National
Climate Change Action plan
(2018-2022) and Develop
Kisumu County Climate
Change Action Plan (2018-
2022)
Nil CCCAP 2018-2022
Ward Action plans
Village action plans
No of Action plans
prepared
10 15 10 - - 10M
Annual Vulnerability CC
impact assessment
Nil Assessment reports Reports 1 1 1 1 1 10M
Early warning
systems/stations
1 Weather Sub-stations No of stations
established
1 1 1 1 1 10M
Soil testing tool machine Nil Samples of soil tested No of machines procured 1 21M

178 Kisumu County Integrated Development Plan | 2018 – 2022
Objective 2: Mainstreaming climate change in education and public awareness
Outcome: Improved knowledge of CC among early age(ECD) children, personnel and community
Sub-program Baseli
ne
Key Outcome Key performance indicator Planned targets
Year 1 Year 2 Year 3 Year 4 Year 5 Budget
Climate change education in
school curriculum, and clubs
Nil
Nil
Improved awareness
Ward and village green
champions
CC information materials
disseminated
No of schools sensitized
No of clubs empowered
No of green champions
registered
50
20
100
100
40
100
50
50
100
50
50
100
50
50
100
10M
Capacity Development, media
strategy and institutional
partnerships
Improved access to CC
information
No of persons trained
No of climate change desks
in departments
No of Media strategies
developed
No of contracts signed for
partnerships
210
3
7
10
300
5
7
10
210
8
7
10
200
10
21
10
300
20
21
10
9.County Climate Change
complex (Research,
innovation and resource
centre)
Nil Purchase Land
Innovation and Resource
centre
Equipped library
Innovation centre
Greened centre
Developed media programs
Web-based information
No of acres purchased
1 resource centre established
1
-
1
-
-
-
30M
200M
(PPP)

179 Kisumu County Integrated Development Plan | 2018 – 2022
and knowledge
management platform
Programme 2 Name: Renewable Energy for Sustainable development
Objective 3: To reduce cost of energy through source diversification
Outcomes: Improved security, reduced cost of power, increased business hours (24hour economy) and increased number of household using clean energy
Key Sub-program Baseli
ne
Key Output Key performance
indicator
Planned targets
Year
1
Year
2
Year
3
Year
4
Year
5
Budget
Solar flood lights for powering markets
schools and health facilities.
100 Solar lights No. of solar lights installed 35 35 35 35 35 70M
Integrated Solar-powered Water
pumping from boreholes
Reduced water pumping
costs
No of solar water pumps
installed
- 10 10 10 15 35M
Promotion of Ethanol jikos/ energy
conservation jikos in every ward -Reduced GHGs emission
-improved tree cover
No of households adapting
ethanol jikos
1400 1400 1400 1400 1400 20M
Community Solar Integrated power box
installation in 4 sub counties - improved energy access
-improved security
-Business growth
No of solar power boxes
installed
1 1 1 1 - 20M
Biogas plants school feeding (ECD
programme) - - Reduced energy costs in
ECD institutions
-Improved ECD nutrition
programme
No of Biogas plants
installed
20 50 50 50 30 20M
Programme 3: Name: Green Economy strategy plan
Objective 3: Implementation of the Green Economy strategy and Implementation plan (GESIP)
Outcome: Green economic growth in the County, green jobs created
Key Sub-program Key Output Key performance
indicator
Planned targets
Year
1
Year
2
Year
3
Year
4
Year
5
Budget
Green innovation and
technologies programme - - Sustainable environmental,
economic and social growth
Number of initiatives
initiated
5 5 5 5 5 10M
Capacity building on
Sustainable Natural resource
management
- - Conserved and sustainable resource
management
No of people trained in
SLM
1000 3000 4000 3000 2000 5M

180 Kisumu County Integrated Development Plan | 2018 – 2022
Green growth and employment
program
- - Green jobs created No of green jobs created
No of companies adapting
green economy
1000 1000 1000 1000 1000 10M
Switch Africa green - - Adaption of green energy
technologies
Number of households
adapting use of green
energy
100 500 300 100 200 10M

181 Kisumu County Integrated Development Plan | 2018 – 2022
Programme Name COOPERATIVE DEVELOPMENT AND MANAGEMENT SERVICES
Objective: To empower co-operative members economically and socially to enhance processing and marketing agricultural and other related business products in the county
Outcome:
Sub Programme Key Outcome Baseline Key performance Indicators Planned Targets
Year
1
Year
2
Year
3
Year
4
Year
5
Total
Budget
Capacity building of
Cooperative Societies
Informed members and well
managed cooperative organization
No. of cooperative general and
board members trained
10 10 10 10 10 2.5M
Policy and legal and
institutional reforms
Existence of policies and legal
framework
No of polices and legal
framework developed.
1 1 2.5M
Mainstreaming participation
of youth, women and PWDs
in cooperative societies.
Increased enrolment of Youth,
Women and PWDs in cooperative
societies
No of youth, women and
PWDs participation in
cooperative societies
350 350 350 350 350 15M
Promotion of cooperative
marketing and value addition
No of marketing strategies
developed.
-No of opportunities for value
addition created
Ongoing Thriving Small and medium
enterprises.
5M
Mainstreaming HIV /AIDs in
cooperative.
Awareness of HIV/AIDS among
cooperative membership.
Ongoing -No. condoms distributed.
-Low level of new HIV
infections.
100 100 100 100 100 2M
Construction of office
building in the sub counties.
Existence of conducive working
environment
Ongoing No. of offices constructed. 14M
Programme Name ENTERPRISE DEVELOPMENT
Objective: TO PROMOTE DEVELOPMENT OF SMALL AND MEDIUM ENTERPRISES, INNOVATION, TRAINING AND CAPACITY DEVELOPMENT
Outcome:
Sub Programme Key Outcome Baseline Key performance Indicators Planned Targets
Year
1
Year
2
Year
3
Year
4
Year
5
Total
Budget
Constituency Industrial
Development Centers – Business
innovation and Incubation Centres
No. of persons of with
technical skills
operating in CIDCs.
6 Existence of thriving SMEs and value
addition. 10M
Development of Cottage
Industries under one village one
product.
No. of groups trained.
No of equipment grants
given.
Ongoing No of cottage industries operational.
-No of beneficiaries of enterprise
development funds.
5M
Establishment of Business process
outsourcing Training centers.
No. of youth youths
trained.
Ongoing No. of fully fledged training centers for
business process outsourcing
established.
5M

182 Kisumu County Integrated Development Plan | 2018 – 2022
ENERGY AND MINING
Programme Name: Energy production and audit
Objective Increase energy access
Outcome: Increased electricity to market centres and dispensaries
Sub Programme Key Outcome Baseline Key performance
Indicators
Planned Targets
Year
1
Year
2
Year
3
Year
4
Year
5
Total
Budget
Rural electrification Electrification of market
centres and dispensaries
54no. markets and
5no. dispensaries connected
Number of market centres,
dispensaries connected
20 20 20 20 20 GOK-REA
Energy audit Number of public
facilities audited
3No hospitals Audited Number of public facilities
audited
3 3 3 3 3 10M
Programme Name: Energy services and prospecting
Objective: To license and regulate downstream activities
Outcome: Compliance and enforcement of petroleum retail stations and LPG
Sub-programme Key outcome Baseline key performance indicators Year
1
Year
2
Year
3
Year
4
Year
5
Total
Budget
Energy regulation Number of new and existing
petrol stations inspected
50 No. petrol stations
inspected
Valid licenses issued
5M
Energy planning County energy master plan County energy master
plan in place
Copies of the master plan
availed to relevant stakeholders
1 10M
Programme name: Mining efficiency
Objective: To promote the exploration and development of mining activities
-Existence of fully equipped centers
with computers and library materials.
Identification and process of land
ownership documents for MSEs
worksites.
Ownership of land by
MSEs.
Ongoing. No of part developments created.
-Existence of allotment letters for
business sites.
-Existence of lease agreements and
titles for the sites.
5M

183 Kisumu County Integrated Development Plan | 2018 – 2022
Outcome: Inventory of minerals within Kisumu county.
Sub-programme Key outcome Baseline Key performance indicators Year 1 Year
2
Year
3
Year
4
Year
5
Total
Budget
Inventory of minerals
within Kisumu county
Mining inventory/GIS
mapping report
0 Copies of the mining report circulated
to relevant stakeholders.
1 5M
TOTAL 1.5295B
184 Kisumu County Integrated Development Plan | 2018 – 2022
4.4.10 PHYSICAL PLANNING, LANDS AND URBAN DEVELOPMENT
Sector Composition:
Lands and Physical planning,
Housing and Urban Development
Vision
To be a leading department in the physical planning & provision of efficient, sustainable,
equitable use of county land resources and provision of adequate housing to the residents of
Kisumu County.
Mission
To Champion sustainable land management, planned urban and rural development and decent
housing for all.

185 Kisumu County Integrated Development Plan | 2018 – 2022
4.4.10.1 Sector Programmes
Table 47: Physical Planning, Lands And Urban Development Sector Programmes
Programme Name: Land and Physical Planning
Objective-: Proper planning for land use
Outcome:
Sub Programme Key Outcome Baseline Key performance
Indicators
Planned Targets
Year
1
Year
2
Year
3
Year
4
Year
5
Total
Budget
Development of A 3-D IT enabled
County Spatial Plan (Development and
Maintenance of county geospatial
database through establishment of a
modern GIS lab).
Fully functional GIS lab
Improved development
control within the
County
0 County spatial plan
document/blueprint
50% 50% 300M
Prepare Integrated urban development
Plans for five upcoming towns Controlled planning and
zoning for urban
development
2
1 2
County Physical Planning Act and
County Land Use Policy
Harmonization and
standardization of
physical planning at the
county
1 1 10M
SUBTOTAL 310M
Programme: Land
Objective: To ensureownership and adequate land space for County development projects
Outcome: Ownership of County projects
Sub Programme Key Outcome Baseline Key performance
Indicators
Planned Targets
Year
1
Year
2
Year
3
Year
4
Year
5
Total
Budget
Purchase and establishment of the
County Land bank
Secured ownership for
County projects
50% Hectares of land
purchased. 10Ha 10Ha 10Ha 10Ha 10Ha 500M
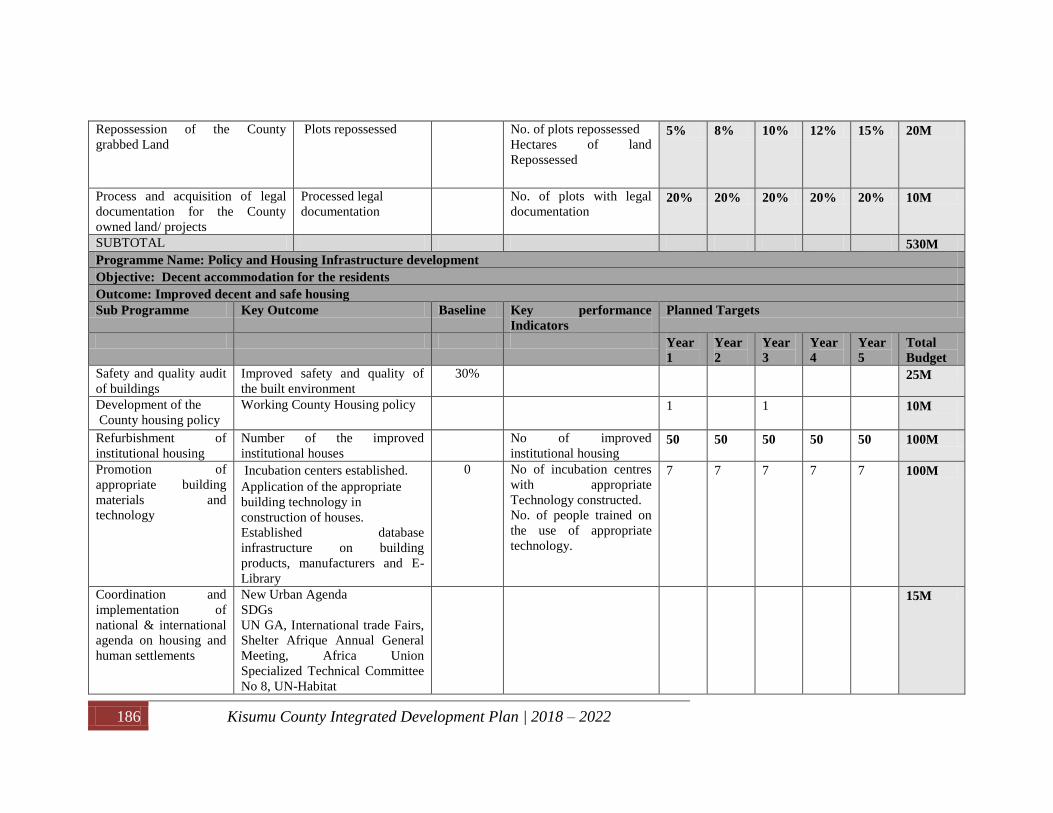
186 Kisumu County Integrated Development Plan | 2018 – 2022
Repossession of the County
grabbed Land
Plots repossessed No. of plots repossessed
Hectares of land
Repossessed
5% 8% 10% 12% 15% 20M
Process and acquisition of legal
documentation for the County
owned land/ projects
Processed legal
documentation
No. of plots with legal
documentation 20% 20% 20% 20% 20% 10M
SUBTOTAL 530M
Programme Name: Policy and Housing Infrastructure development
Objective: Decent accommodation for the residents
Outcome: Improved decent and safe housing
Sub Programme Key Outcome Baseline Key performance
Indicators
Planned Targets
Year
1
Year
2
Year
3
Year
4
Year
5
Total
Budget
Safety and quality audit
of buildings
Improved safety and quality of
the built environment
30% 25M
Development of the
County housing policy
Working County Housing policy 1 1 10M
Refurbishment of
institutional housing
Number of the improved
institutional houses
No of improved
institutional housing 50 50 50 50 50 100M
Promotion of
appropriate building
materials and
technology
Incubation centers established.
Application of the appropriate
building technology in
construction of houses.
Established database
infrastructure on building
products, manufacturers and E-
Library
0 No of incubation centres
with appropriate
Technology constructed.
No. of people trained on
the use of appropriate
technology.
7 7 7 7 7 100M
Coordination and
implementation of
national & international
agenda on housing and
human settlements
New Urban Agenda
SDGs
UN GA, International trade Fairs,
Shelter Afrique Annual General
Meeting, Africa Union
Specialized Technical Committee
No 8, UN-Habitat
15M

187 Kisumu County Integrated Development Plan | 2018 – 2022
Programme Name: : Policy and Housing Infrastructure development
Objective: Provision of affordable housing
Outcome:
Sub Programme Key Outcome Baseline Key performance
Indicators Planned Targets
Year 1 Year 2 Year 3 Year 4 Year
5
Total
Budget
Redevelopment of old
Government
housing/Urban renewal
Modernization of
government housing
0 No. of housing units
modernized
50 50 50 50 1.5B(PPP)
County Government Civil
Servants personnel housing
scheme
Affordable housing
units
Adequate housing units
100M GoK
–NHC
TOTAL 2.69B

188 Kisumu County Integrated Development Plan | 2018 – 2022
4.4.11: ROADS, TRANSPORT AND PUBLIC WORKS
4.4.11.1 Sector Introduction
Vision
A leading agency in the provision of transport infrastructure and public works services
Mission
To develop, operate and sustain transport infrastructure and public works activities that meet the
demands and expectations of the citizens
Sector Composition (Sub-sectors):
Roads
Effective and reliable infrastructure is critical in lowering the cost of doing business and
increasing the competitiveness in the County. The roads sub-sector is charged with the
responsibility of policy formulation, monitoring and evaluation of standards including
compliance with all environmental regulations during implementation of projects in construction,
maintenance and rehabilitation of roads, drainage works and bridges within the County. It
undertakes provision of appropriate education to the public on road safety, testing and advising
on material usage and providing technical education to the general public and private sector.
Public works
The sub-sector comprises of architectural, quantity surveys and contracts, structural, electrical
and mechanical sections. Its mandate is to facilitate provision and maintenance of buildings and
other public works within the County. It is charged with the responsibility of planning,
designing, construction and maintenance of government assets in built environment which
include hospitals, schools, colleges, technical institutes, prisons and courts. Assets in
infrastructure development include foot bridges, piers, breakwaters and jetties.
Transport
The function of this sub-sector includes; provision of road construction and maintenance of equipment
and plant, inspection and identification of private garages suitable for repairing government
vehicles, plant and equipment, valuation of vehicles, plant and equipment for the following
purposes, offering of loans to public servants desiring to purchase used vehicles,

189 Kisumu County Integrated Development Plan | 2018 – 2022
suitability/occupational testing of drivers, motorcyclist and plant operators for employment and
promotion within the County government, inspection of imported second hand vehicles for
conformity with Kenya Bureau of Standards KEBS 1515-2000 specifications for road
worthiness; inspection of government vehicles and equipment maintenance; repairs and disposal
of vehicles, plant and equipment, manufacture and repair of safes, cash boxes, strong room doors
and other fabrications, preparation of technical and tender documents for tools, equipment and
machinery and other related materials; pre-delivery inspections of vehicles, plant, tools,
equipment and machinery to ensure adherence to client's technical specifications.
The department has plants and equipment which are leased out to contractors and private
developers.

190 Kisumu County Integrated Development Plan | 2018 – 2022
4.4.11.2 Sector Programmes
Table 48: Roads, Transport and Public Works Sector Programmes
Programme Name: Roads
Objective: To improve accessibility, functionality & quality of roads
Goal: Enhanced socio-economic welfare of locals
Sub Programme
Key Outcome Baseline Key performance
Indicators
Planned Targets
Year
1
Year
2
Year
3
Year
4
Year
5
Total
Budget
Rehabilitation and Routine
maintenance of rural access
roads
Motorable roads, improved
economic activities
40% No. of Kms of roads graveled
to standards 200 200 200 200 200 2.5 B
Construction of new 1750 km of
gravel roads. Approximately 350
km of roads each financial year
Increased accessibility to social
amenities, trade through exchange
of commodities, improved security
0 No. of kilometers of new
gravel roads
175 175 175 175 175 800M
Construction of new 20 km of
tarmacked roads. Approximately
5 km of roads each financial year
Increased accessibility to social
amenities, trade, and improved
security
0 No. of KM of new tarmacked
roads 5KM 5KM 5KM 5KM 5KM 200M
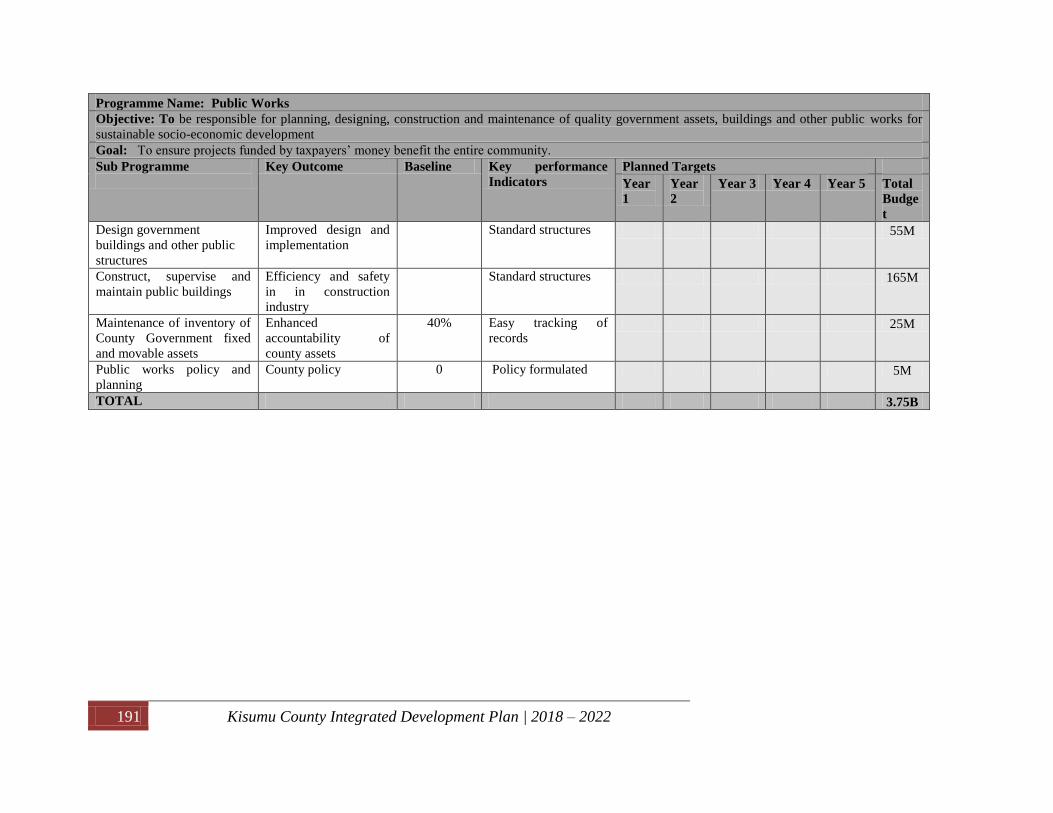
191 Kisumu County Integrated Development Plan | 2018 – 2022
Programme Name: Public Works
Objective: To be responsible for planning, designing, construction and maintenance of quality government assets, buildings and other public works for
sustainable socio-economic development
Goal: To ensure projects funded by taxpayers’ money benefit the entire community.
Sub Programme
Key Outcome Baseline Key performance
Indicators
Planned Targets
Year
1
Year
2
Year 3 Year 4 Year 5 Total
Budge
t
Design government
buildings and other public
structures
Improved design and
implementation
Standard structures
55M
Construct, supervise and
maintain public buildings
Efficiency and safety
in in construction
industry
Standard structures
165M
Maintenance of inventory of
County Government fixed
and movable assets
Enhanced
accountability of
county assets
40% Easy tracking of
records 25M
Public works policy and
planning
County policy 0 Policy formulated 5M
TOTAL 3.75B

192 Kisumu County Integrated Development Plan | 2018 – 2022
4.4.12 EDUCATION, TECHNOLOGY AND HUMAN RESOURCE
DEVELOPMENT
4.4.12.1 Sector Introduction
Sector/ Subsector composition:
Early Childhood Development Education (ECDE)
The total number of children in Public and private schools in Kisumu County as at September
2017 stood at 57,893 and 58,803 respectively against a trained teacher establishment of 1,344 in
public schools and 2,118 in private schools. Public schools have the highest total number of
orphans at 7,138 distributed as 2,486 for total and 4,652 for partial orphans against the private
schools’ total number of 4,676 distributed as 1,923 for total and 2,753 for partial orphans. There
is a total of 2,752 children with special needs (visual, hearing and speech) out of which 1,954 of
these children are in public schools.
There are 483 ECDE public schools in the County. Out of this, 217 are on permanent building
structures, 237 are on temporary structures while 29 fall under others. 187 of these schools have
tap water connections, 136 have wells and 59 depend on water vendors while 60 schools use
other water source. The County school feeding programme targets children in both private and
public schools
Vocational Training Centres
Education and Training (E&T) is the primary means of upward social mobility, national
cohesion and socio-economic development. However, the key to success lies in proactive
measures to ensure training of human resources in order to respond to the changes that are
triggered by economic transformation. The need to address issues related to access, equity,
quality, relevance, curriculum, teacher development and management as well as trainers in the
areas of technology and entrepreneurial skill development is important.
The county has a total of 19 operational vocational training centres / Village polytechnics, with a
total enrollment of approximately1500 students. The total number of instructors is 57 against the
expected number of 184 instructors. This implies that there is a serious personnel deficit of 127

193 Kisumu County Integrated Development Plan | 2018 – 2022
instructors. Other Vocational Training Centres yet to be registered and operationalized include:
Withur, Kochogo, Kandaria, Obwolo and Kiancha.
Technology
Administratively, these services are offered to the end users based on the following fronts:
Network and Infrastructure Component, Systems Development, Deployment and Integration
Component, Help-Desk Support and User Training, Disaster recovery, Backups and Data
Custody.
The directorate managed to roll out a structured Local Area Network (LAN) at the county
headquarters, designed and developed the county’s website, implemented a tier 3 data centre in
partnership with non-state actors and also conducted a digital literacy programme to more than
700 youths.
Human Resource Development (Gender, Youth and Vulnerable groups)
Youth
The youth (15-35) years comprise 36 percent of the national population while the County’s youth
is estimated to account for approximately 40 percent of the total county’s population.
Alarmingly, 61 percent of them remain unemployed. About 92 percent of the unemployed youth
lack vocational or professional skills demanded by the job market. The high unemployment
levels have led to increased dependency levels, slow economic growth, increasing poverty levels
and rising security challenge that negatively impacts on development. The unemployment
challenge is further compounded by low transition to and completion rates in secondary
education, as well as limited opportunities in technical and vocational skills training institutions
for the youth.
Human Resources and Skills development and engagement of the youth in projects such as road
and dam construction, disaster response, irrigation projects, environmental conservation and
community service or volunteerism are among the sustainable interventions that will be
employed towards reducing the youth unemployment.
Vulnerable Groups
The sector has been focusing on the improvement of livelihood of vulnerable groups specifically
the orphans and vulnerable children, the elderly, and persons with disability. Various
194 Kisumu County Integrated Development Plan | 2018 – 2022
interventions have been initiated by both the National and County Governments to support these
deserving vulnerable members of society. These include the establishment of Consolidated
Social Protection Fund which established three cash transfer interventions (Cash Transfer to the
Older Persons (CT-OP), Cash Transfer to the severely Disabled Persons and the Urban Food
Subsidy) in addition to the Cash Transfer programme to Orphans and Vulnerable Children (CT-
OVC) established in 2004 and National Fund for Persons with Disabilities (PWDs).
Vision:
To be a leading services provider in education, training, ICT and social services.
Mission
To improve the well-being of Kisumu residents through effective implementation of policies,
efficient use of resources and delivery of quality servic
Table 49:Education, Technology And Human Resource Developmentsector Programe
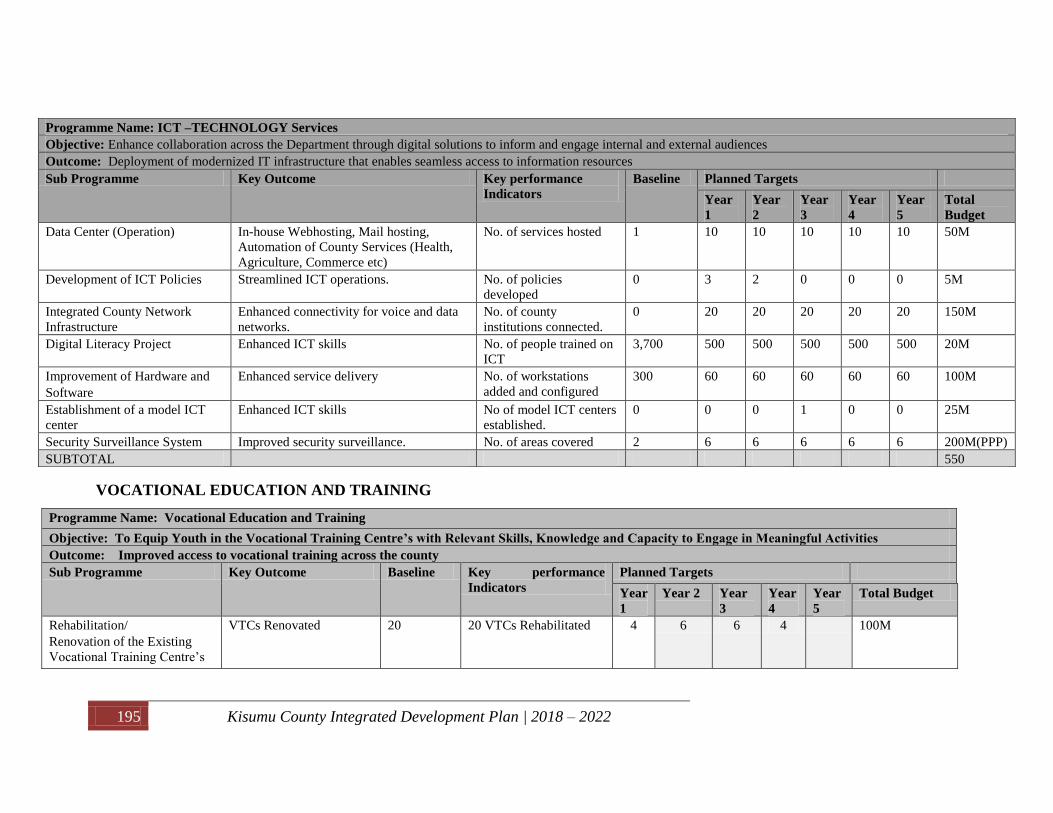
195 Kisumu County Integrated Development Plan | 2018 – 2022
VOCATIONAL EDUCATION AND TRAINING
Programme Name: Vocational Education and Training
Objective: To Equip Youth in the Vocational Training Centre’s with Relevant Skills, Knowledge and Capacity to Engage in Meaningful Activities
Outcome: Improved access to vocational training across the county
Sub Programme Key Outcome Baseline Key performance
Indicators
Planned Targets
Year
1
Year 2 Year
3
Year
4
Year
5
Total Budget
Rehabilitation/
Renovation of the Existing
Vocational Training Centre’s
VTCs Renovated 20 20 VTCs Rehabilitated 4 6 6 4 100M
Programme Name: ICT –TECHNOLOGY Services
Objective: Enhance collaboration across the Department through digital solutions to inform and engage internal and external audiences
Outcome: Deployment of modernized IT infrastructure that enables seamless access to information resources
Sub Programme Key Outcome Key performance
Indicators
Baseline Planned Targets
Year
1
Year
2
Year
3
Year
4
Year
5
Total
Budget
Data Center (Operation) In-house Webhosting, Mail hosting,
Automation of County Services (Health,
Agriculture, Commerce etc)
No. of services hosted 1 10 10 10 10 10 50M
Development of ICT Policies Streamlined ICT operations. No. of policies
developed
0 3 2 0 0 0 5M
Integrated County Network
Infrastructure
Enhanced connectivity for voice and data
networks.
No. of county
institutions connected.
0 20 20 20 20 20 150M
Digital Literacy Project Enhanced ICT skills No. of people trained on
ICT
3,700 500 500 500 500 500 20M
Improvement of Hardware and
Software
Enhanced service delivery No. of workstations
added and configured
300 60 60 60 60 60 100M
Establishment of a model ICT
center
Enhanced ICT skills No of model ICT centers
established.
0 0 0 1 0 0 25M
Security Surveillance System Improved security surveillance. No. of areas covered 2 6 6 6 6 6 200M(PPP)
SUBTOTAL 550
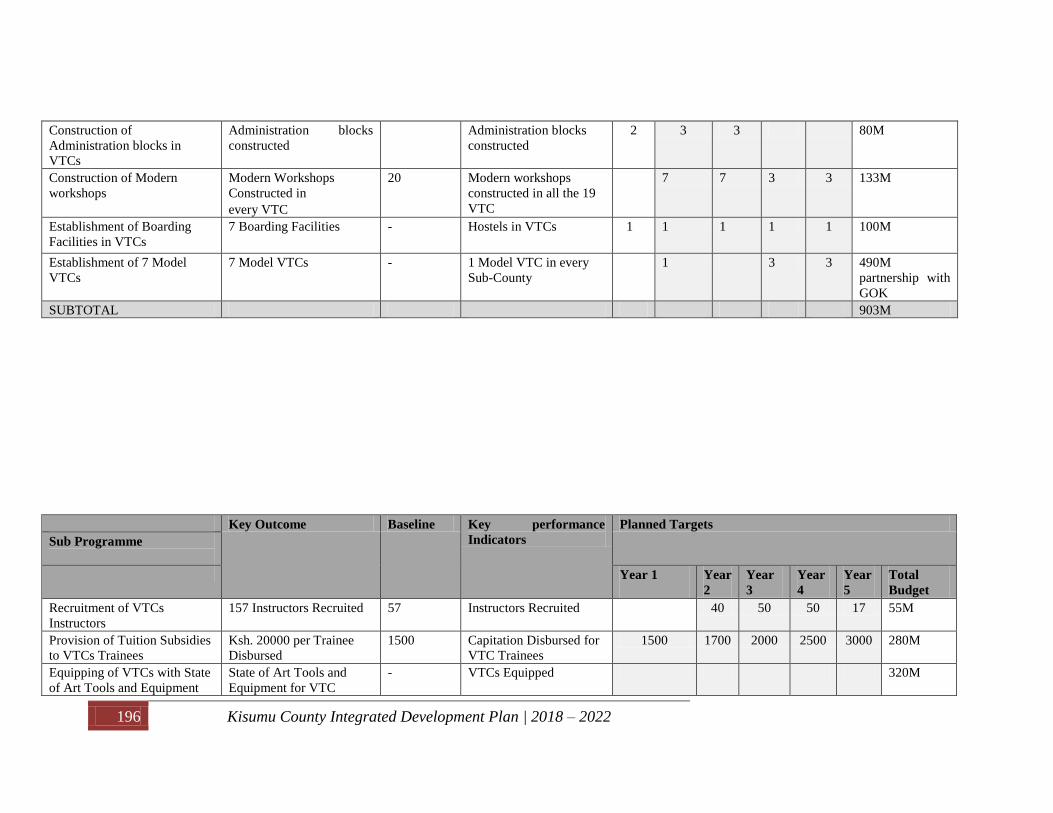
196 Kisumu County Integrated Development Plan | 2018 – 2022
Construction of
Administration blocks in
VTCs
Administration blocks
constructed
Administration blocks
constructed
2 3 3 80M
Construction of Modern
workshops
Modern Workshops
Constructed in
every VTC
20 Modern workshops
constructed in all the 19
VTC
7 7 3 3 133M
Establishment of Boarding
Facilities in VTCs
7 Boarding Facilities
- Hostels in VTCs 1 1 1 1 1 100M
Establishment of 7 Model
VTCs
7 Model VTCs - 1 Model VTC in every
Sub-County
1 3 3 490M
partnership with
GOK
SUBTOTAL 903M
Key Outcome Baseline Key performance
Indicators
Planned Targets
Sub Programme
Year 1
Year
2
Year
3
Year
4
Year
5
Total
Budget
Recruitment of VTCs
Instructors
157 Instructors Recruited 57 Instructors Recruited 40 50 50 17 55M
Provision of Tuition Subsidies
to VTCs Trainees
Ksh. 20000 per Trainee
Disbursed
1500 Capitation Disbursed for
VTC Trainees
1500 1700 2000 2500 3000 280M
Equipping of VTCs with State
of Art Tools and Equipment
State of Art Tools and
Equipment for VTC
- VTCs Equipped 320M

197 Kisumu County Integrated Development Plan | 2018 – 2022
Vehicle for County Office Vehicle for Monitoring&
Evaluation
- VET Vehicle 1 7M
62-seater bus for VTCs 7 VTCs Buses - 1 Bus per Sub-County 1 2 2 2 133M
7 vehicles for Sub County
VET Officers
1 Vehicle per Sub-County - Vehicles for VET&QAS
Officers per Sub-County
2 2 2 1 49M
County VTCs exhibitions
20 VTCs
Exhibiting.
- VTCs Exhibition 1 1 1 1 1 10.8M
County Sports
VTCs Sports at Sub-
Counties and County
Level
- VTCs County Sports 1 1 1 1 1 20M
County Annual Graduation Trainees Graduating from
VTCs
- Annual Graduation for
VTC Trainees
1 1 1 1 1 10M
Validation and
Implementation of Policies
VTC Policy
Capitation Policy
Tools and Infrastructure
Policy
- VTC Policies
8M
SUBTOTAL 892.8M
Sub Programme Key Outcome Baseline Key performance
Indicators
Planned Targets
Year
1
Year 2 Year 3 Year
4
Year 5 Total
Budget
Procurement of VTCs
Teaching Learning Materials
Teaching learning
materials procured
95M
Completion of New VTCs New VTCs completed 6 6 200M
SUBTOTAL 295M

198 Kisumu County Integrated Development Plan | 2018 – 2022
Programme Name: NITA IN PARTNERSHIP WITH COUNTY GOVERNMENT OF KISUMU
Outcome: Competitive & adequate workforce at all levels for growth & Development
Sub Programme Key Outcome Baseline Key performance
Indicators
Planned Targets
Year
1
Year 2 Year 3 Year
4
Year
5
Total
Budget
Youth Training in Technical
& Vocational Skills for self-
reliance
Self-Reliant and
Entrepreneurial skills
Reduced dependency
Self-employment
0 No. of Well trained artisans
and craftsmen
200 200 200 200 200 10M
Youth Internships/
Apprentices/Attachment
placements for all-rounded
training and experience
All-rounded trainees well-
equipped with workplace
experience and
expectations
0 No. of youths placed for
intership and apprenticeship
10M
Youth testing, grading and
certification on Government
Trade Tests
Graded and certified
artisans and craftsmen
ready for work
0 No. of juakali artisans graded
and certified
350 350 350 350 350 35M
Skill Upgrading Program for
the Vocational Training
Instructors
Refreshed instructors with
the latest workshop
equipment technology,
instructor guide
0 No. of VTC instructors
trained on teaching
technology and guide
57 - 57 3.0M
SUBTOTAL 58M
EARLY CHILDHOOD DEVELOPMENT EDUCATION
Programme Name: ECD Infrastructure Development
Objective: To provide effective and quality ECD programme for sustainable development
Outcome: Improved access to quality ECD service delivery
Sub Programme Key Outcome Baseline Key performance
Indicators
Planned Targets
Year
1
Year
2
Year
3
Year
4
Year 5 Total
Budget
ECD
infrastructure
development
Increased enrollment
and improved learning
environment
- No. of ECD classrooms
Completed.
No. of ECD training Centres
105 105 105 105 105 1.05B

199 Kisumu County Integrated Development Plan | 2018 – 2022
Constucted
No. of Plaing grounds
established
Equipping of
ECDE centers
Increased enrollment
and improved learning
environment
- No. of ECDE centres
equiped with play
equipment.
No. of ECDE centres
supported with learning and
teaching materials
100
655
150
655
150
655
150
655
105
655
100M
50
ECDE Sanitation
and hygiene
Improved Sanitation and
hygiene
- No of latrines constructed 300 600 650 570 500 262M
Increased clean and safe
water
- No. of water tanks and hand
washing facilities provided 100 150 150 150 105 65M
ECDE
personneling
Increased curriculum
implementation and
supervision of ECDE
centres
- 300 500 500 500 200 100M
No. of ECDE SUB- County
Quality Assurance and
Standard officers recruited
7
No. of ECDE ward advisors
recruited 35
National Scheme
Services adopted by the
County government
No. of ECDE teachers
recruited under the National
Scheme of service
Gok
ECDE advocacy Public education Forums
and increased awareness
of ECDE services
delivered
No. of ECDE shows,
sensitizations and
exhibitions
8 8 8 8 8 10M
ECDE outdoor
activities
development
Co-curriculum activities
pre -primary
No. of ECDE centers
supported 655 655 655 655
Scool Feeding
programme
Improved nutrition and
health for children.
Increased enrollment
Increased retention
No. of pupils benefiting from
the programme 58,00
0
65,00
0
75,00
0
85,00
0
105,00
0
105M
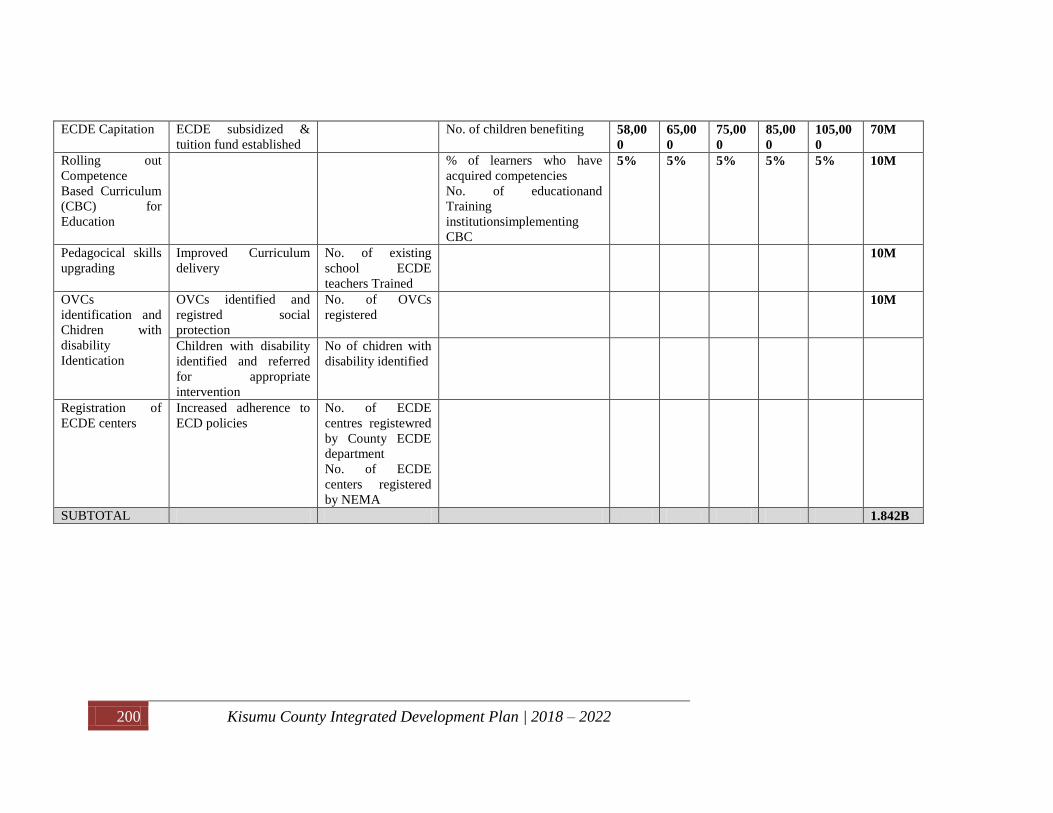
200 Kisumu County Integrated Development Plan | 2018 – 2022
ECDE Capitation ECDE subsidized &
tuition fund established
No. of children benefiting 58,00
0
65,00
0
75,00
0
85,00
0
105,00
0
70M
Rolling out
Competence
Based Curriculum
(CBC) for
Education
% of learners who have
acquired competencies
No. of educationand
Training
institutionsimplementing
CBC
5% 5% 5% 5% 5% 10M
Pedagocical skills
upgrading
Improved Curriculum
delivery
No. of existing
school ECDE
teachers Trained
10M
OVCs
identification and
Chidren with
disability
Identication
OVCs identified and
registred social
protection
No. of OVCs
registered
10M
Children with disability
identified and referred
for appropriate
intervention
No of chidren with
disability identified
Registration of
ECDE centers
Increased adherence to
ECD policies
No. of ECDE
centres registewred
by County ECDE
department
No. of ECDE
centers registered
by NEMA
SUBTOTAL 1.842B

201 Kisumu County Integrated Development Plan | 2018 – 2022
GENDER
Programme Name: Social Welfare
Objective: To improve livelihoods for the vulnerable groups in Kisumu County by 2022
Outcome: Improved living standards
Sub Programme Key Outcome Baseline Key performance
Indicators
Planned Targets
Year
1
Year
2
Year
3
Year
4
Year
5
Total
Budget
(KSHS)
Social Assistance
Provision of Basic Assistive
Devices
Enhanced Mobility of
2000 PLWDs
No. of Beneficiaries 250 300 400 500 550 6M
Social Assistance
Complimentary Cash Transfers
for OVCs headed households,
PLWSD and the Aged not
reached by the National
Government
Improved purchasing
power
No. of Beneficiaries 850 1020 1190 1360 1700
6.5M
Health Assistance (NHIF) for Special
Groups i.e. PLWSD and the Aged not
reached by the National Government
Improved Health
Access
No. of Beneficiaries 850 1020 1190 1360 1700 3M
Psychosocial Support Livelihood Recovery No. of & type of
Support Systems
5 5 5 5 5 6M
SUBTOTAL 21.5M
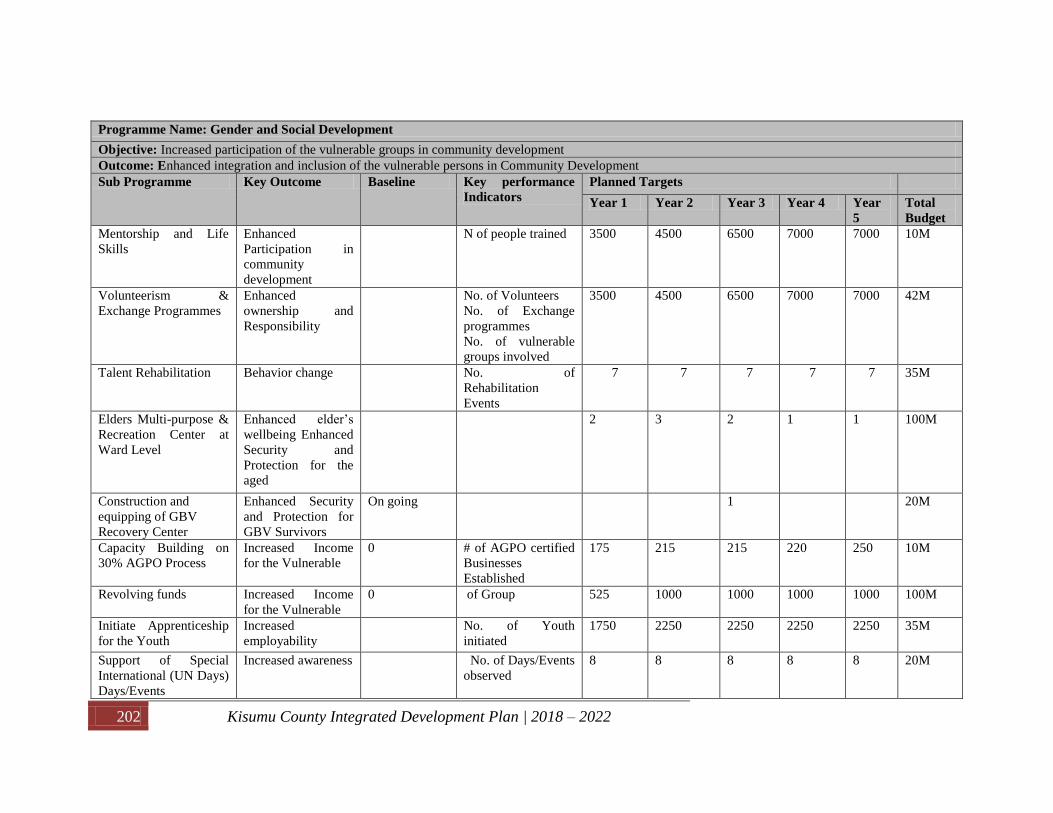
202 Kisumu County Integrated Development Plan | 2018 – 2022
Programme Name: Gender and Social Development
Objective: Increased participation of the vulnerable groups in community development
Outcome: Enhanced integration and inclusion of the vulnerable persons in Community Development
Sub Programme Key Outcome Baseline Key performance
Indicators
Planned Targets
Year 1 Year 2 Year 3 Year 4 Year
5
Total
Budget
Mentorship and Life
Skills
Enhanced
Participation in
community
development
N of people trained 3500 4500 6500 7000 7000 10M
Volunteerism &
Exchange Programmes
Enhanced
ownership and
Responsibility
No. of Volunteers
No. of Exchange
programmes
No. of vulnerable
groups involved
3500 4500 6500 7000 7000 42M
Talent Rehabilitation
Behavior change No. of
Rehabilitation
Events
7 7 7 7 7 35M
Elders Multi-purpose &
Recreation Center at
Ward Level
Enhanced elder’s
wellbeing Enhanced
Security and
Protection for the
aged
2 3 2 1 1 100M
Construction and
equipping of GBV
Recovery Center
Enhanced Security
and Protection for
GBV Survivors
On going 1 20M
Capacity Building on
30% AGPO Process
Increased Income
for the Vulnerable
0 # of AGPO certified
Businesses
Established
175 215 215 220 250 10M
Revolving funds Increased Income
for the Vulnerable
0 of Group 525 1000 1000 1000 1000 100M
Initiate Apprenticeship
for the Youth
Increased
employability
No. of Youth
initiated
1750 2250 2250 2250 2250 35M
Support of Special
International (UN Days)
Days/Events
Increased awareness No. of Days/Events
observed
8 8 8 8 8 20M

203 Kisumu County Integrated Development Plan | 2018 – 2022
Formulation, Review
and Dissemination of
Policies on Gender,
Youth and PLWD
Mainstreaming
Increased inclusion
awareness and
participation
No. of Policies
formulated and
Disseminated
1 10M
Creating
Correspondence Desk
Enhanced
Participation
No. of
correspondence
desks created
8 14 14
Civic Education Empowered
citizenry
No. of Forums
conducted
420 420 420 420 420 42M
SUBTOTAL 424M
Programme Name: ALCOHOLIC ADDICTION REHABILITATION
Programme Name: Child Protection
Objective: To improve the welfare of children
Outcome: Reduced number of children in the streets
Sub Programme Key Outcome Baseline Key performance
Indicators
Planned Targets
Year
1
Year
2
Year
3
Year
4
Year
5
Total
Budget
(KSHS)
Street Families Improved welfare No. of Street Families
rehabilitated
18 21 18 11 7 10M
Street Children Rehabilitation
and Integration
Enhanced Protection for
the Vulnerable Children
No. of Street Children
Rehabilitated
112 107 98 88 78 21M
Charitable Children Institution
Enhanced Safety and
protection for the
Vulnerable Children
No. of Charitable
Institutions established
and Supported
1 1 20M
SUBTOTAL 51M

204 Kisumu County Integrated Development Plan | 2018 – 2022
Objective: MITIGATE AGAINST ALCOHOL DRUGS AND SUBSTANCE ABUSE
Outcome: REDUCTION OF ADA CASES
Sub Programme Key Outcome Key performance
Indicators
Planned Targets
Year
1
Year
2
Year
3
Year
4
Year
5
Total Budget
Creation of public Education
awareness/ sensitization
Setting up rehabilitation centres
Reduction of alcohol and drug
intake and abuse.
No of persons
Rehabilitated
1 1 1 2 1 5M
Conducting research on effects of
alcohol and drug abuse in relation
to our society
Understand the right approach
in dealing with specific cases
of alcohol and drug abusers
and the affected
No of research conducted
and publications presented
1 1 1 1 10M
SUBTOTAL 15M
TOTAL 5.2633B

205 Kisumu County Integrated Development Plan | 2018 – 2022
4.4.13 FINANCE
4.5.3.1 Sector Introduction
Sector Composition:
Finance sector is one of the foundations upon which the achievement of the County Integrated
Development Plan II is based and it is a key instrument in resource mobilization and prudent
management of the County’s financial resources in implementation of programs and projects
identified in the CIDP. The sector plays a critical role in the development of the County by
providing intermediary services to all the departments/sectors within the County. The
department encompasses the following directorates; Budget; Revenue; Accounting services,
Debt & Asset Management, Internal audit and Supply Chain Management.
Budget directorate ensures that Financial activities in the budget cycle are planned for and
accomplished in compliance with the all the relevant statutes and regulations. The directorate in
consultations with department of Economic Planning compiles the forecasted resource envelope
and allocates departmental expenditure ceilings which are then compiled to form budget
estimates for a particular financial year. This process is done on a manual platform and is prone
to inherent errors of omission and commission associated with any manual data processing
system. In the formative years of devolution, formulation of over ambitious budgets driven by
unrealistic revenue targets resulted to cases of pending bills.
The directorate of Revenue is charged with collection of the County’s own source of revenue
which is categorized as main-stream and departmental revenue. Some of the challenges
experienced include setting of revenue targets without clear mechanisms, strategies, and policies
resulting in hidden revenue deficits, the automation did not cover all the revenue streams as
stipulated in the Finance Act leading to leakages, pilferages and undocumented revenue
associated with manual receipting and manual cash collection.
The directorate of accounting services is in charge of processing all payments, periodic reporting
and coordination of external audit exercises.
Supply chain management is charged with preparation of annual procurement plans and
procurement & disposal of goods and services in the County.

206 Kisumu County Integrated Development Plan | 2018 – 2022
Lake Region Economic Block was formed with an aim to promote multilateral co-operation
among the counties in and around the lake region. The block is to develop partnership through
which common challenges are addressed and development opportunities seized in a manner
which transcends County frontiers. The member- counties are expected to contribute towards the
Counties Development agenda. The lake region counties include Kisumu, Trans Nzoia,
Bungoma, Busia, Kakamega, Siaya Vihiga, Homabay, Kericho, Bomet, Nyamira, Kisii and
Migori. The Counties focus is on seven key interventions areas to spur economic growth in the
region as follows: Agriculture, Tourism, Education, Health, Financial services and Infrastructure.
Vision
To be a leader in resource mobilization and prudent financial management.
Mission
To ensure efficient and effective utilization of financial resources and assets management

207 Kisumu County Integrated Development Plan | 2018 – 2022
4.4.13.2 Sector Programmes
Table 50: Finance Sector Programmes
Programme Name: General Administration and Support Services
Objective: To improve and enhance service delivery
Outcome: Enhanced Efficiency and effective service delivery and improved environment
Sub Programme Key Outcome Baseline Key performance
Indicators
Planned Targets
Year
1
Year
2
Year
3
Year
4
Year
5
Total
Budget
Administrative
services Trained Personnel. 1 3.5 0 0 0 6.5M
Improved working environment. 1 1 1 6M
Improved and secure documentation 1 1 1 1 1 5M
Increased personnel performance 1 1 1 1 1 5M
Digitized records. 1 0 0 0 0 10M
SUB-TOTAL 32.5M
Programme Name: Public Finance Management
Objective: To improve Financial Management
Outcome: Efficient and Effective Public Finance Management
Sub Programme Key Outcome Baseline Key performance Indicators Planned Targets
Year
1
Year
2
Year
3
Year
4
Year
5
Total
Budget
Resource
Mobilization
Resource
Enhancement
Quarterly reports on revenue performance 4 4 4 4 4 2.5M
No. of revenue enhancement workshops 2 2 2 2 2 5M
No. of annual revenue conferences held 2 2 2 2 2 5M
No. of motor vehicles procured
Compliance to statutory requirements
0 4 4 3 70M
Compliance with
statutory requirement
Approved appropriation and financial bill 1 1 1 1 1 5M
Trained Personnel No. of personnel trained 50 50 50 50 50 10.5M
Improved working
environment
No. of offices renovated 1 1 1 1 1 5M
Updated rates and
records
Updated rates, records and valuation 0 1 1 1 70M

208 Kisumu County Integrated Development Plan | 2018 – 2022
County rates act Approved rates act 0 0 0 0 0 10M
Increased revenue
awareness
No. of awareness campaigns Cont’ Cont’ Cont’ Cont’ Cont’ 43M
Efficient office
operations
No. of computers and equipment
purchased
20 20 20 20 20 30M
SUB-TOTAL 256M
Sub Programme Key Outcome Baseline Key performance Indicators Planned Targets
Year
1
Year
2
Year
3
Year
4
Year
5
Total
Budget
Budget
Coordination and
Management
Working financial
operations
Approved budget estimates 1 1 1 1 1 26M
Enhanced budget
transparency and
accountability
No. of quarterly budget and expenditure
reports prepared
4 4 4 4 4 15M
No. of annual budget and expenditure
reports
1 1 1 1 1 15M
Operational medium-
term expenditure
No. of Medium-term expenditure report
prepared
4 4 4 4 4 15M
Approved County budget review outlook 1 1 1 1 1
Approved budget
formulation
No. of MTEF consultative forums held 85 85 85 85 85 45M
No. of annual budget conferences held 4 1 1 1 1 20M
No. of Sector Working Groups reports
prepared
10 10 10 10 10 75M
No. of workshops held on review of
budget documents
4 4 4 4 4 15M
No. of CBEF meetings held 4 4 4 4 4 25M
SUBTOTAL 251M
Sub Programme Key Outcome Baseline Key performance Indicators Planned Targets
Year
1
Year
2
Year
3
Year
4
Year
5
Total
Budget
Accounting services Quality financial
statements and
reporting
Improved debt
management
Annual financial report 1 1 1 1 1 27M
Quarterly reports prepared 4 4 4 4 4 26M
Improved debt management strategy
paper
1 1 1 1 1 19M
No. of debt management reports prepared 4 4 4 4 4 22M
Efficient credit
management
No. of updated creditors register 1

209 Kisumu County Integrated Development Plan | 2018 – 2022
Trained personnel No. of personnel trained on IFMIS 100
Updated personnel
records
Prompt audit query
report
6 4 4 4 4 8M
Decentralize
County treasury to
the Sub- Counties
Sub- County Treasury
established and
operationalized
0 Low threshold financial services offered
at the Sub County level
7 35M
SUBTOTAL 137M
Sub Programme Key Outcome Baseline Key performance Indicators Planned Targets
Year
1
Year
2
Year
3
Year
4
Year
5
Total
Budget
Asset Management
Services
Improved asset
management
Updated asset register 1 1 1 1 1 10M
Comprehensive asset register 355M
Financial asset management policy 5M
Operational asset management system 1 1 100M
No. of assets insured 1.3B
No. of sensitization forums held 2 3 3 3 10M
No. of asset management reports prepared 4 4 4 4 4 10M
Improved service
delivery
No. of personnel recruited 8 5 5 5 5 5M
No of personnel trained 10 1.5 15 15 5M
No. of motor vehicles procured 1 1 2 1 34M
SUBTOTAL 1.834B
Sub Programme Key Outcome Baseline Key performance Indicators Planned Targets
Year
1
Year
2
Year
3
Year
4
Year
5
Total
Budget
Decentralize Supply
Chain Management
to the Sub-
Counties
Low threshold project
contracts awarded at
the Sub County level
0 Procurement officers deployed at the Sub
counties
7 7M
Training of personnel No. of personnel trained 10 20 20 20 3.08M
To the Sub
countiesEfficient
office operations
No. of computers and equipment
purchased
20 20 20 20 20 30M
Motor vehicles 2 1 1 1 30M
SUBTOTAL 70.08M
TOTAL 2.58058B

210 Kisumu County Integrated Development Plan | 2018 – 2022
Flagship/ Transformative Projects
These are projects with high impact in terms of employment creation, increasing County competitiveness and revenue generation
Project Name Location Objective Output /Outcome Performance
indicators
Timeframe
(Start-
End)
Implementing
Agencies
Cost
(Ksh.)
Establishment of
Village Councils
County-wide To improve service delivery
to the grass-root
Enhanced public
participation and
accountability in
County projects
No. of village
Councils
established.
No. of Village
administrators
employed
(2018-
2019)
Governance and
Administration 500M
Construction of the
County Government
Headquarters
Kisumu City To improve personnel
efficiency by offering
adequate space for service
delivery
Enhanced efficiency
through adequate
spacing
County
Government head-
quarters
Constructed and
occupied
2018-2021 Public Works 1.5B
Construction of the
Ultra- Modern
County Assembly
Kisumu City To improve efficiency by
offering adequate space for
legislation and deliberations
of the assembly
Enhanced efficiency
through adequate
spacing
The Ultra-
Moderm assembly
constructed and
occupied
2018-2021 County
Assembly 800M
e-CIMES To improve tracking and
reporting of implementation
of development strategies
programmes and projects
Computerized
CIMES
e-CIMES
operationalzed (2018-
2019)
Economic
Planning and
Development
100M
Modernize 3 major
Markets
City (Jubilee,
Kibuye and
Otonglo)
To improve service delivery
and revenue collection
Modernized markets;
Improved service
delivery
Number of
markets improved/
mordernized
(2018-
2022)
City of Kisumu;
4.5 B
Estates/Urban
Renewal
Kibuye and
Lumumba
estates
To provide decent and
affordable housing to
residents of Kisumu
Increased access to
housing
Number of
housing units
constructed
(2018-
2022)
City of Kisumu 3.0B
PPP
Construction of 1
ultra- modern sports
complex
City To improve access to modern
sporting facilities
Improved
performance in
sports
Operational sports
complex
(2018-
2022)
Tourism,
Culture,
Creative arts and
Sports
1.0 B
Design and construct To enhance solid waste Clean environment Dumpsite in place (2018- City of Kisumu; 2.0B

211 Kisumu County Integrated Development Plan | 2018 – 2022
sanitary landfill
(SLF)
management 2022)
Lake front
development
Lake front To improve business activities
along the lake
Well planned lake
front
Public
infrastructure
constructed along
the lake front
(2018-
2022)
City of Kisumu;
Physical
Planning, Lands
and Urban
Development;
PPP
Design and construct
an International
Conference Centre
City To improve tourism and
conferencing
Increased tourism
earnings
Amount of tourist
earnings (Kshs)
(2018-
2022)
Touurism,
Culture,
Creative arts and
Sports
3.0B
Design and
Construct 3 bus
parks
Otonglo,
Nyamasariand
Mamboleo
(2018-
2022)
1.5 B
Automation of
County Government
Services (ERP)
County wide To enhance service delivery County Public
Services automated
Improved service
devery
(2018-
2020)
ICT 200M
7 No. Model Centres
of excellence
1 per Sub-
County
To enhance skills and
employability of youth.
Centres of
excellence
constructed in all the
seven Sub- Counties
Enhanced skills
Increased
enrollment rate of
the VTCs
(2018-
2022)
Education, ICT
& HRD
Expansion and
modernization of
Jaramogi Oginga
Odinga Teaching
and Referral
Hospital and
Victoria Hospital
including
establishment of a
comprehensive
cancer care center
and state of the art
ambulance.
Kisumu
Central Sub-
County
To improve health care
systems
A well-equiped
Cancer Unit
established
Improved referral
health system.
Established Referral
system
Cancer Unit
established.
No. of the state of
art ambulances
(2018-
2022)
Medical and
Bio-medical
services
2.5B
Structured
support/facilitation
County-wide To improve promotive and
preventive health care
Motivated and
strengthened
No. of CHVs
facilitated with
(2018-
2019)
Health 500M

212 Kisumu County Integrated Development Plan | 2018 – 2022
to Community
Health Volunteers
(Ksh 2000 per
month & NHIF
cover)
Community Health
Volunteers and CU
units respectively
their monthly
stipend and NHIF
cover.
Establishment of
medical scheme for
Universal Health
Care coverage for
the needy and
vulnerable
County-wide To promote affordable health-
care
Enhanced /improved
accescability to
affordable health-
care
No. of the needy
benefiting/ put on
the universal
health-care
scheme.
(2018-
2020)
Health
Construct and equip
one modern
operation theatre and
x-ray unit in Sub
county hospital in
each the Sub
Counties
Sub- Counties To improve health care
services offerd at the the Sub-
County hospitals.
Reduced costs of
health care and
enhanced services at
the Sub-Counties
No. of X-ray units
and operation
theatres
constructed
(2018-
2022)
Health 1B
Construction of an
International Sports
Stadium
Kisumu City To promote Kisumu as a
Sports destination
Increased sporting
activities hosted in
Kisumu
Rate of
Completion
(2018-
2022)
Tourism,
Culture,
Creative Arts
and Sports
2B
PPP
Construction of
Koru-Soin Dam
Muhoroni
Sub County
To enhance access to safe
clean water
Increased
accescability to clean
quality water
Rate of
Completion
2018-2022 GOK
County
Government-
Water
29B
Expansion of
Irrigation
Mboha, Nyamthoe
and Kano
Seme,
Kisumu East
and Nyando
Sub-Counties
To enhance food production Increased acreage
under irrigation
Number of
hectares under
expanded
irrigation
(2018-
2022)
Water and
Irrigation 2B
3-D IT enabled
County Spatial Plan
County-wide To promote proper planning
and zoning of the County
Enhanced physical
planning
County Spatial
Plan
(2018-
2020)
Physical
Planning, Lands,
Housing and
Urban
development
300M
Revitilize Cotton
Production
Nyakach and
Seme Sub-
To improve livelihoods of the
farmers
Increased production
of cotton
Acreage under
cotton production
(2018-
2022)
Agriculture
GOK 500M

213 Kisumu County Integrated Development Plan | 2018 – 2022
Counties
Rice Production
Development
Nyando and
Kisumu East
Sub- Counties
To enhance food security Enhanced rice
production
Acreage under rice
production
(2018-
2022)
Agriculture
GOK 500M

214 Kisumu County Integrated Development Plan | 2018 – 2022
CHAPTER FIVE:
IMPLEMENTATION FRAMEWORK
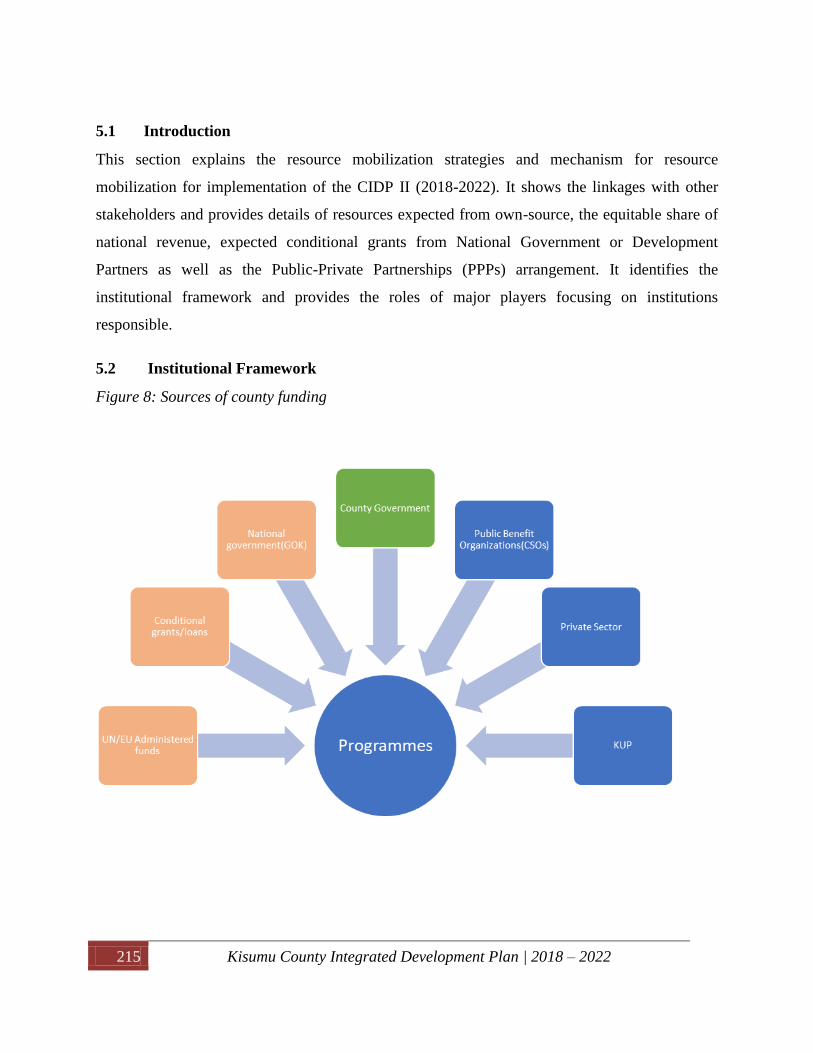
215 Kisumu County Integrated Development Plan | 2018 – 2022
5.1 Introduction
This section explains the resource mobilization strategies and mechanism for resource
mobilization for implementation of the CIDP II (2018-2022). It shows the linkages with other
stakeholders and provides details of resources expected from own-source, the equitable share of
national revenue, expected conditional grants from National Government or Development
Partners as well as the Public-Private Partnerships (PPPs) arrangement. It identifies the
institutional framework and provides the roles of major players focusing on institutions
responsible.
5.2 Institutional Framework
Figure 8: Sources of county funding

216 Kisumu County Integrated Development Plan | 2018 – 2022
5.3 Resource Requirement by Sector
Table 51: Summary of Proposed Budget by Sector
Sector Name Amount (Ksh.) %
Governance and Administration 3,434,000,000 5.18%
County Assembly 1,010,000,000 1.52%
County Public Service Board 250,000,000 0.38%
City of Kisumu 5,448,000,000 8.22%
Economic Planning and Development 3,241,000,000 4.89%
Physical Planning, Lands, Housing and Urban
development 3,750,000,000 5.66%
Finance 2,580,580,000 3.89%
Agriculture, Livestock and Fisheries 1,990,500,000 3.00%
Business, Energy and Industry 1,529,500,000 2.31%
Tourism Culture, Creative arts and Sports 1,716,200,000 2.59%
Roads, Transport and Public works 3,750,000,000 5.66%
Health and Sanitation 10,246,000,000 15.45%
Education, Human Resource Development and ICT 5,263,300,000 7.94%
Water, Irrigation, Environment and Natural resources 22,096,500,000 33.33%
Total 66,305,580,000 100.00%
5.4 Resource Mobilization Framework
Table 52: Resource Mobilization Implementation Strategy
Identification Engagement Negotiation Management and
reporting
Communication of
results
Map resource partner
interests thematic and
geographical
Identify where there is a
match with the County
Government
comparative advantage
and track record
Verify if the resource
partner is an acceptable/
reliable source
Promotion of
resource partners
meetings
Sectors should write
project proposals
and concept notes
Deliver presentation
to resource partners
Foster individual /
County contacts
Reach an
agreement on joint
interests
Agree on
conditions of
partnership
including
procedures, rules
and regulations on
use of resources
Develop and
formalize legal
agreements
Acknowledge
resource partners
contribution
Ensure efficient
and effective
operations/
management of
resources
Regularly report
on resource
partners
contribution
Disseminate
information on
lessons learnt
Develop advocacy
communication
tools
Advocate for
continued support
217 Kisumu County Integrated Development Plan | 2018 – 2022
Leadership
For successful implementation of the CIDP II (2018-2022), The County Government leadership
must strengthen the County institutions/sectors with clear demarcation of roles, responsibilities
and functions to avoid institutional overlaps and wastage of the scarce resources. Adherence to
the rule of law, Prudence and discipline in the management of fiscal risks, commitment to
eradication of corruption, promotion of integrity as the County seeks for partnership must be the
overall drive towards the achievement of this plan.
Policies
Suitable County specific policies will be reviewed, developed and enforced to ensure that the
County administration creates an enabling environment for economic growth. These policies will
advance/exploit the comparative advantage and enhance the competitiveness of Kisumu County.
This will require a multi-sectoral approach involving the National Government, the County
Executive, the County Assembly, the private sector and the civil society. The policies developed
should aim at increasing more resources towards development programmes, enhancing revenue
mobilization through expansion of the e-revenue scope, enforcement, identification of new
revenue streams and improvement of services; expenditure rationalization; expenditure
efficiency and effective implementation of budget programs and training, roll-out and use of
financial operations process manual.
Co-ordination and Partnership
The full involvement and engagement of the development partners within the County is
paramount and will build partnership in the delivery of the CIDP II. The Economic Planning and
Development department will develop a clear framework mapping all Public Benefit
Organizations and Non-Governmental Organizations clearly describing their respective thematic
and geographical areas for engagement and coordination of partners working within the County
to avoid duplication of efforts.

218 Kisumu County Integrated Development Plan | 2018 – 2022
Investments
The County Government will develop a clear investment policy highlighting key investment
advantages that the County offers being in the hub of East and the Great Lakes Region of Africa
to capture the advantages of globalization. The policy will ensure the mutual benefit of both
Kisumu residents and the investors. It will ensure ease of doing business is realized (one stop
licensing centre and quality administration backed by a robust ICT programme.
Table53: Revenue Projections
Type of
Revenue
2018/19 2019/20 2020/21 2021/22 2022/23 Total
a)Local
revenue
1,227,825,323 1,350,607,855 1,485,668,471 1,634,235,318 1,797,658,850 7,495,995,817
b)Equitable
share
6,684,468,000 7,352,914,800 8,088,206,280 8,897,026,908 9,786,729,599 40,809,363,587
c)Conditiona
l grants
807,322,093 888,054,302 976,859,732 1,074,545,705 1,182,000,276 4,928,782,108
d)
Equalization
fund
00 00 00 00 00 00
e)Other
sources
(Specify)
Total 8,719,615,416 9,591,576,957 10,550,734,483 11,605,807,931 12,766,388,725 53,234,141,512
5.5 Estimated Resource Gap and Measures of Addressing It
The County’s projections of revenue streams are at 10 per cent per annum. The programmes for
the entire plan period is estimated to cost Ksh66,305,580,000 (billions) against the County’s
projections of Ksh53,234,141,512 (billions) giving us budget gap of Ksh 13,071,438,488
(billions) which the County intend to raise through strategies as highlighted in 5.4

219 Kisumu County Integrated Development Plan | 2018 – 2022
CHAPTER SIX:
MONITORING AND EVALUATION FRAMEWORK

220 Kisumu County Integrated Development Plan | 2018 – 2022
6.1 Introduction
This chapter provides an overview of the County’s Monitoring and Evaluation framework.
Monitoring and Evaluation forms part of a results culture in the public service that is meant to
provide value and services for all citizenry. In the planning and implementation of development
efforts, Monitoring and Evaluation ensures that intended targets are achieved, remedies are taken
when projects are off-track, and that lesson learned are used to promote efficiency and
effectiveness.
6.2 The Legal framework for Monitoring and Evaluation
The constitution of Kenya 2010 heralds a transformation of public service delivery and public
financial management and accountability underpinned by a set of national values, principles of
governance and values and principles of public service. The Constitution has several
requirements for monitoring, evaluation and reporting from various public offices. The scope of
Monitoring and Evaluation is derived from the provisions related to planning under various
articles including schedule four (4). The CIDP II sets clear goals, objectives and outcomes and
targets which provide a good foundation for Monitoring and Evaluation.
6.3 Modalities and guiding principles of M&E
Monitoring and Evaluation will be mainstreamed into all development programmes and projects
across the County by all players. For accountability purposes, the government will disseminate
adequate information on development policies, programmes and projects, and information
regarding financial and other resources allocated to the same. The system shall build on
transparency and ownership- providing citizens with the opportunity to participate in the
different stages of M &E activities. Data collection, storage, analysis, report writing and
utilization of results will take place using standardized guidelines and formats. It is envisaged
that the M& E process will be guided by the principles of systematic inquiry, integrity and
honesty, ensuring accurate, timely and reliable reporting of findings. Lastly, the results and
lessons learnt will be disseminated to policy-makers, beneficiaries and other stakeholders and the
general public in order to serve their information needs and foster a results culture.

221 Kisumu County Integrated Development Plan | 2018 – 2022
6.4 Institutional Arrangement for M &E
The Governor as the chief executive will be the key champion for the County’s move to focusing
on results. Among the key functions and responsibilities for the County governor provided for in
the Constitution is submission of annual report on the implementation status of the County
policies and integrated development plan to the county assembly and promotion of the
competitiveness of the county. These functions are expected to make M&E reports a permanent
feature in the Governor’s meetings.
The institutional M&E structure will be inclusive and accommodative in order to provide
coverage and voice to all categories of institutions which co-exist within the County. This
includes the administration at the county and lower levels, local private sector organizations,
Civil Society Organizations and other non-state actors.
There will be established a County Monitoring and Evaluation Committee (CoMEC). The
various institutions/departments within the County will form M&E units to be represented in the
CoMEC.
At the lower level, there will be Sub-County M&E Committees (SCoMEC) that will be required
to follow up on the development progress at their level up to the village level, carry out routine
monitoring, collect and collate data and prepare progress reports that will be submitted to the
CoMEC on a quarterly basis.
6.4.1 The County M&E Unit
The responsibility for coordination and implementation of Monitoring and Evaluation function at
the county level will be under the County M&E unit within the department of Economic
Planning and Development.
6.5 The Citizenry Role in M&E
The Constitution requires citizens to be supplied with information. Consultation and dialogue
with the public is the responsibility of all actors and it is of specific importance for service
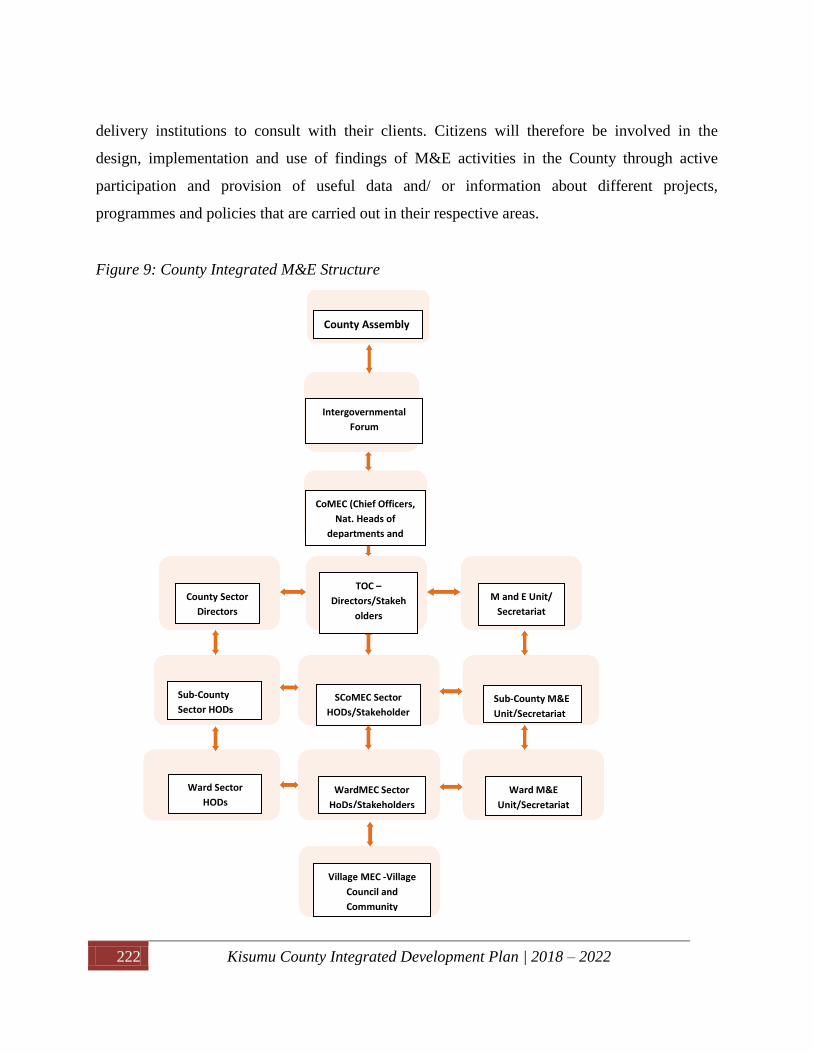
222 Kisumu County Integrated Development Plan | 2018 – 2022
delivery institutions to consult with their clients. Citizens will therefore be involved in the
design, implementation and use of findings of M&E activities in the County through active
participation and provision of useful data and/ or information about different projects,
programmes and policies that are carried out in their respective areas.
Figure 9: County Integrated M&E Structure
County Assembly
Intergovernmental
Forum
CoMEC (Chief Officers,
Nat. Heads of
departments and
other stakeholders
County Sector
Directors
TOC –
Directors/Stakeh
olders
M and E Unit/
Secretariat
Sub-County
Sector HODs SCoMEC Sector
HODs/Stakeholder
s
Sub-County M&E
Unit/Secretariat
Ward Sector
HODs WardMEC Sector
HoDs/Stakeholders
Ward M&E
Unit/Secretariat
Village MEC -Village
Council and
Community

223 Kisumu County Integrated Development Plan | 2018 – 2022
6.6 Data collection, Analysis, and Reporting
The County M&E unit will collaborate with other sector working groups in formulation of indicators for
tracking performance, develop data collection tools, conduct data collection and analysis. The M&E
department will train and capacity builds technical leads in the departments to support in data collection,
analysis and reporting. Data will be collected regularly and reports generated and disseminated on a
quarterly basis which will then inform the County Annual Budget Review and Outlook Paper (CBROP),
County Annual Progress Report (CAPR) and the County Annual M&E report (CAMER).
The County will strive to establish a computerized M&E platform to make the M&E processes simpler,
faster, more reliable and more transparent. Through such a system, data can be made available much
faster to the stakeholders. Data collection and reporting are likely to be much more efficient and the
validity of data will improve.
6.7 Utilization of M&E Data and Dissemination of Findings
The M&E reports, findings and results will be shared widely using different means of communication and
be disseminated to different stakeholders using print, electronic media, ICT and public participation
forums.
6.8 M&E Outcome Indicators
The M&E Outcome indicators and targets for the CIDP II are summarized in the Results Matrix below:

224 Kisumu County Integrated Development Plan | 2018 – 2022
Table 54: Summary of M&E Outcome Indicators
Sector Programme Outcome indicators Baseline
Source of Data Reporting
Responsibility
Mid-
term
Target
(2020)
End-term
Target
(2022)
Governance
and
Administrat
ion
Devolved
Administration
Number of functional administrative
structures at devolved units
Governance
reports
Directorate of
Administration
Human Resource
Management and
Development
Number of personnel equipped with
relevant skills
Human Resource
reports
Human Resource
Directorate
Percentage of harmonized pay
structures
30% Reports Human Resource
Directorate
County Legal
Services and
Administration of
Justice
Number of County bills drafted Legal reports Directorate of Legal
services and
Administration of Justice
Governor’s Press
Unit and
Communication
Percentage of the informed
population
Governance
Reports;
Public surveys
Governor’s office
Special Program Number of functional disaster
management units
0 Reports Directorate of special
programs
35
City of
Kisumu
Financial
Management
Percentage share of the revenue
collection
Consolidated
revenue
collection reports
Director of revenue
Engineering,
Planning and
Housing
Number of satellite bus parks
constructed
Annual reports City 3
Number of urban slums with
physical and social infrastructure
installed
Annual reports City
Environment and
natural resources
management
Percentage of tree cover within the
city/ Number of trees planted
Reports City 400,000 1,000,000

225 Kisumu County Integrated Development Plan | 2018 – 2022
Sector Programme Outcome indicators Baseline
Source of Data Reporting
Responsibility
Mid-
term
Target
(2020)
End-term
Target
(2022)
Public Health Number of CHVs recruited in
community units within the City
0 Public health
reports
City
Environme
nt &Natural
Resources
and Water
& Irrigation
Water service
provision and
management
% of population/households with
access to safe and clean water
58% UNICEF Report C.G.K(Water department 63% 68%
Storage per capita per day (Litres) 8 Litres Annual reports C.G.K(Water department 16.5
Litres
25Litres
Improved water production Volume
of water
produced
per day
40,000m3/day Internally computed-
2017 Annual report
C.O.K(
Water
departme
nt
70,000m3/
day
Sanitation service
provision and
management
% of sewerage coverage 16% LVWSB Report KIWASCO 18.5% 21%
Alternative
financing
Mechanism for
water Sector
Number of diversified sources of
funds.
2 Financial reports C.O.K(Water department 5 6
Institutional
Capacity
Strengthening
Properly regulated and coordinated
Water sector
Afforestation Percentage of Tree Cover in the
County and its water towers
<1 KFS County Department of
Environment. & KFS
2.5 5
Conservation and
rehabilitation of
degraded
landscapes
Number of degraded landscapes
conserved
Reports Environment and natural
resources department
Noise and Air
Pollution Control
Percentage of industries/institutions
complying with pollution control
standards
0 County department of
Environment

226 Kisumu County Integrated Development Plan | 2018 – 2022
Sector Programme Outcome indicators Baseline
Source of Data Reporting
Responsibility
Mid-
term
Target
(2020)
End-term
Target
(2022)
Irrigation and
Drainage
Area of land acreage under
Irrigation
15% Scheme
investigation and
preliminary
design 2017
Irrigation Directorate 33%
45%
Water storage and
Flood control
Quantity of water stored for
Irrigation purposes (m³)
0 Detailed design
report
Irrigation Directorate 10,120
m³
32,040 m³
Land Reclamation. Area of arable land reclaimed for
Agricultural production (Ha)
0 Irrigation and
Drainage
Department 1996
Data Inventory
(PIU)
Irrigation Directorate 80 Acres 160 Acres
Resource
mobilization for
Irrigation sector
Number of partnerships established 0 Departmental
reports
Irrigation Directorate 5 10
Capacity Building Number of personnel trained 0 Training needs
assessment
report
Irrigation Directorate 4 8
personnel
Health and
Sanitation
Preventive and
promotive Health
services
Percentage of incidences of
diarrheal diseases among residents
of Kisumu
3.8% DHIS2 MOH 3.0 2.0
Reduced rates of stunting among the
under-fives in Kisumu County
18 UNICEF/ MOH KAP
Survey, 2016, 2017
15 12
Percentage of children under 1 fully
immunized
84 DHIS 2 Health and Sanitation
Percentage of skilled attendant at
birth
69.7 DHIS 2 Health and Sanitation
Number of CHVs on stipend and
NHIF
2240 Health and
Sanitation sector
report
Health and Sanitation 2600 2720

227 Kisumu County Integrated Development Plan | 2018 – 2022
Sector Programme Outcome indicators Baseline
Source of Data Reporting
Responsibility
Mid-
term
Target
(2020)
End-term
Target
(2022)
Medical and
Biomedical
Services
Under 5 mortality rate (per 1000
births)
79 DHIS, Kisumu
Fact Sheet
MOH 50 35
Maternal mortality rate (per 100,000
births)
495 DHIS, Kisumu
Fact Sheet
Major
Communicable and
Non-
Communicable
diseases
Percentage of new HIV infections 0.4 Kenya AIDS
Estimates
0.3 0.2
Malaria prevalence rate (%) 27 Kenya Malaria
indicator survey
Kisumu
County
Assembly
Infrastructure
development
Ultra-modern assembly constructed
and operational
0 County
Assembly report
County Assembly 1
Speakers residence completed and
in use
0 Reports County Assembly 1
Economic
Planning
and
Developmen
t
Planning and
policy formulation
Number of planning policies
developed and operationalized
0 Reports Economic Planning and
Development department
1 1
Tracking of results % efficiency in use of resources Annual progress
reports;
Expenditure
reviews
County Monitoring and
Evaluation Unit
100 100
Rate of reporting by development
stakeholders (%)
Quarterly
Monitoring and
Evaluation
reports
County Monitoring and
Evaluation Unit
70 100
Grass-root support
development
Proportion of people with access to
basic/essential services
County Annual
Progress Reports
Economic Planning and
Development department
Poverty levels (% of population
below poverty line)
Economic
Surveys
Economic Planning and
Development
Business/Tr
ade, Energy
Trade
Development and
Number of modern markets
constructed and operational
Reports Directorate of trade 3
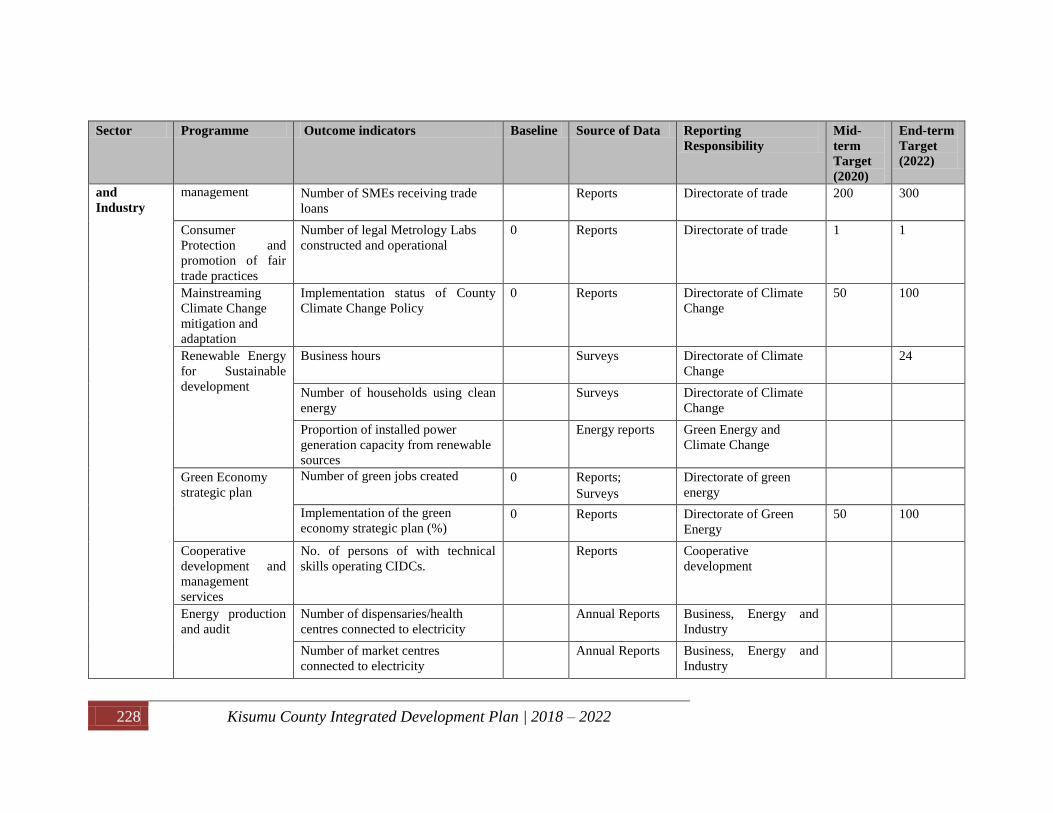
228 Kisumu County Integrated Development Plan | 2018 – 2022
Sector Programme Outcome indicators Baseline
Source of Data Reporting
Responsibility
Mid-
term
Target
(2020)
End-term
Target
(2022)
and
Industry
management Number of SMEs receiving trade
loans
Reports Directorate of trade 200 300
Consumer
Protection and
promotion of fair
trade practices
Number of legal Metrology Labs
constructed and operational
0 Reports Directorate of trade 1 1
Mainstreaming
Climate Change
mitigation and
adaptation
Implementation status of County
Climate Change Policy
0 Reports Directorate of Climate
Change
50 100
Renewable Energy
for Sustainable
development
Business hours Surveys Directorate of Climate
Change
24
Number of households using clean
energy
Surveys Directorate of Climate
Change
Proportion of installed power
generation capacity from renewable
sources
Energy reports Green Energy and
Climate Change
Green Economy
strategic plan
Number of green jobs created
0 Reports;
Surveys
Directorate of green
energy
Implementation of the green
economy strategic plan (%) 0 Reports Directorate of Green
Energy
50 100
Cooperative
development and
management
services
No. of persons of with technical
skills operating CIDCs.
Reports Cooperative
development
Energy production
and audit
Number of dispensaries/health
centres connected to electricity
Annual Reports Business, Energy and
Industry
Number of market centres
connected to electricity
Annual Reports Business, Energy and
Industry

229 Kisumu County Integrated Development Plan | 2018 – 2022
Sector Programme Outcome indicators Baseline
Source of Data Reporting
Responsibility
Mid-
term
Target
(2020)
End-term
Target
(2022)
Energy services
and prospecting
County energy master plan in place 0 Annual reports Business, Energy and
Industry
1 1
Mining efficiency Inventory of minerals within
Kisumu county/ GIS mapping report
0 Annual Reports Business, Energy and
Industry
1 1
Physical
Planning,
Lands and
Urban
Developmen
t
Physical planning County spatial plan in place 0 Reports Physical Planning, Lands
and Urban Development
1 0
Land Reforms Number of leasehold issued to
County lands
Reports Physical Planning, Lands
and Urban Development
Urban renewal Number of affordable and decent
housing units constructed
Reports Physical Planning, Lands
and Urban Development
4,000 10,000
Roads,
Transport
and Public
works
Roads Kilometre of new roads constructed 0 Reports Roads, Transport and
Public Works
1750
Kilometre of roads rehabilitated/
maintained 1,100 Reports Roads, Transport and
Public Works
1,100
Transport Fleet management system in place 0 Annual reports Roads, Transport and
Public Works
0 1
Public Works Public Works and Planning policy
in place 0 Reports Roads, Transport and
Public Works
1 1
Education,
ICT and
Human
Resource
Developmen
t.
Communication
Services
County communication policy in
place 0 ICT reports ICT 1 1
Information/resour
ce centers
Percentage of the population with
access to information/ resource
centres
ICT reports ICT
ICT –technology
services
% of Government services
automated 30 Reports ICT 50 70
Vocational
Education and
Training
Net Enrolment Rate (VTCs) -% Education
reports
CGK- VET Directorate

230 Kisumu County Integrated Development Plan | 2018 – 2022
Sector Programme Outcome indicators Baseline
Source of Data Reporting
Responsibility
Mid-
term
Target
(2020)
End-term
Target
(2022)
Early Childhood
Development and
Education
Net Enrolment Rate (Early
Childhood)
Education
reports
ECDE Directorate
Child Protection Number of street children
rehabilitated Reports Gender and Social
Development
219 483
Tourism
Culture,
Arts and
Sports
Tourism Product
Development and
Diversification
Earnings from the tourism sector
(Kshs) Tourism Reports Tourism, Culture, Arts
and Sports
Tourism Sector
Policy and Legal
Framework
Development
Tourism sector policy developed
and operational 0 Tourism Reports Tourism, Culture, Arts
and Sports
1 1
Development of
human resource in
Tourism, Culture,
Arts and Sports
Number of skilled tourism, culture,
arts and hospitality professionals Human Resource
development
reports
Human Resource
Development
Culture and Art
Infrastructure
Development
Number of infrastructural facilities
for artistic expression Annual reports Tourism, Culture, Arts
and Sports
Heritage Sites
Restoration and
Development
Number of well
managed/safeguarded and
documented heritage sites
Annual reports Tourism, Culture, Arts
and Sports
Sports
Infrastructure
Development
Number of County teams
participating in major national and
international sports competition
Annual reports Tourism, Culture, Arts
and Sports
Agriculture,
Livestock
and
Fisheries
Agricultural
productivity and
output
improvement
Number livestock production value
chains initiated Annual Reports Agriculture, Livestock
and Fisheries
900 1,100
Number of fisheries value chain
initiated 2 Annual reports Agriculture, Livestock
and Fisheries
0 3
Number of Agro-processing
technologies promoted Economic
Survey;
Agriculture, Livestock
and Fisheries
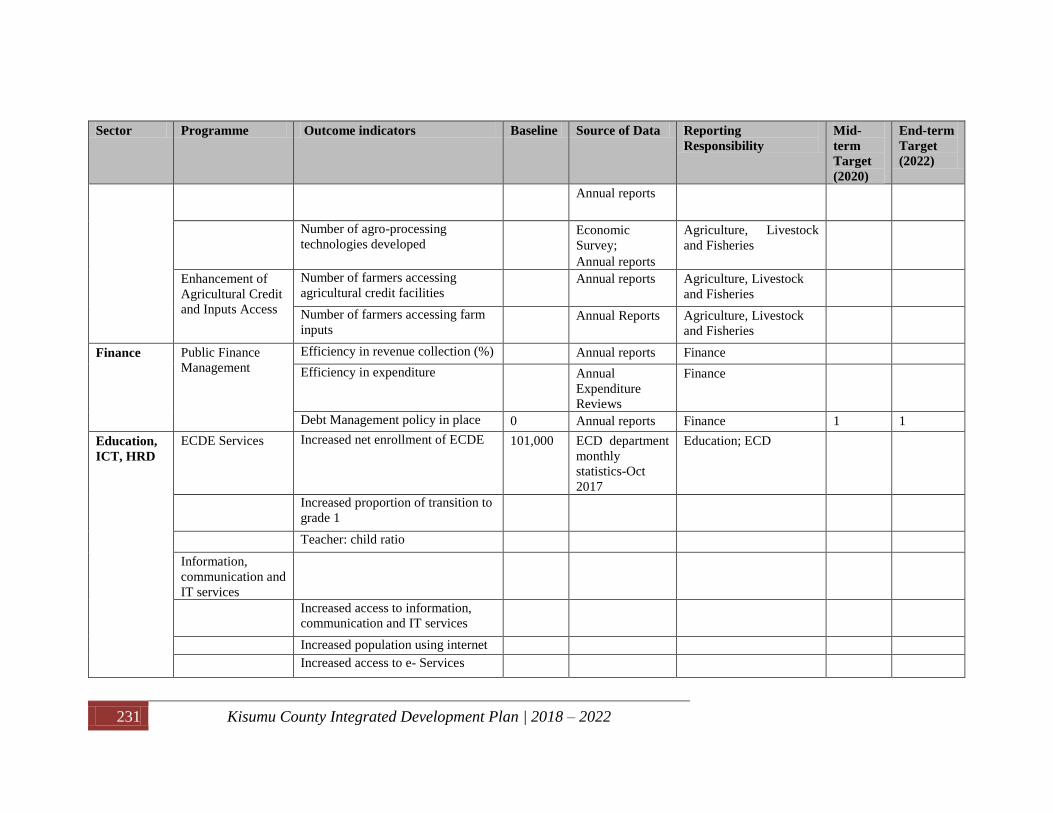
231 Kisumu County Integrated Development Plan | 2018 – 2022
Sector Programme Outcome indicators Baseline
Source of Data Reporting
Responsibility
Mid-
term
Target
(2020)
End-term
Target
(2022)
Annual reports
Number of agro-processing
technologies developed Economic
Survey;
Annual reports
Agriculture, Livestock
and Fisheries
Enhancement of
Agricultural Credit
and Inputs Access
Number of farmers accessing
agricultural credit facilities Annual reports Agriculture, Livestock
and Fisheries
Number of farmers accessing farm
inputs Annual Reports Agriculture, Livestock
and Fisheries
Finance Public Finance
Management
Efficiency in revenue collection (%) Annual reports Finance
Efficiency in expenditure Annual
Expenditure
Reviews
Finance
Debt Management policy in place 0 Annual reports Finance 1 1
Education,
ICT, HRD
ECDE Services Increased net enrollment of ECDE 101,000 ECD department
monthly
statistics-Oct
2017
Education; ECD
Increased proportion of transition to
grade 1
Teacher: child ratio
Information,
communication and
IT services
Increased access to information,
communication and IT services
Increased population using internet
Increased access to e- Services
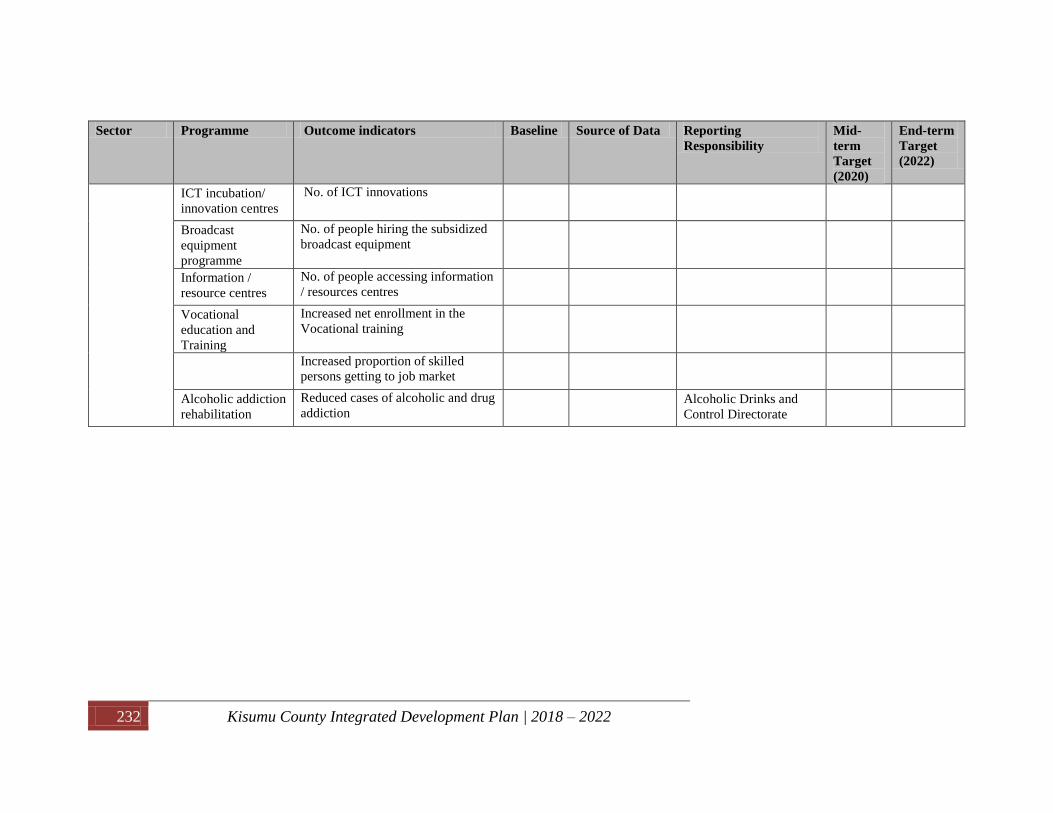
232 Kisumu County Integrated Development Plan | 2018 – 2022
Sector Programme Outcome indicators Baseline
Source of Data Reporting
Responsibility
Mid-
term
Target
(2020)
End-term
Target
(2022)
ICT incubation/
innovation centres
No. of ICT innovations
Broadcast
equipment
programme
No. of people hiring the subsidized
broadcast equipment
Information /
resource centres
No. of people accessing information
/ resources centres
Vocational
education and
Training
Increased net enrollment in the
Vocational training
Increased proportion of skilled
persons getting to job market
Alcoholic addiction
rehabilitation
Reduced cases of alcoholic and drug
addiction Alcoholic Drinks and
Control Directorate