kirkland lake gold investor presentation jan23 cibc final
TRANSCRIPT
January 2017
TONY MAKUCHPresident & Chief Executive Officer
KLGOLD.COM
TSX: KL
OTCQX: KLGDF
TIER ONE GOLD PRODUCTION | DISTRICT SCALE UPSIDE | VALUATION UPSIDE
1
KLGOLD.COM
TSX:KLCAUTIONARY LANGUAGE
Cautionary Note Regarding Forward-Looking Information
This presentation contains statements which constitute “forward-looking information” within the meaning of applicable securities laws, including statements regarding the plans,intentions, beliefs and current expectations of Kirkland Lake Gold Ltd. (“Kirkland Lake Gold”) with respect to future business activities and operating and financial performance.Forward-looking information is often identified by the words “may”, “would”, “could”, “should”, “will”, “intend”, “plan”, “anticipate”, “believe”, “estimate”, “expect” or similarexpressions and include information regarding: (i) expectations for the ability of the combined company to successfully achieve business objectives, including integrating thecompanies or the effects of unexpected costs, liabilities or delays, (iii) the potential benefits and synergies of the combined company, (iv) future production, cash costs, free cash flows,and operations, and (v) expectations for other economic, business, and/or competitive factors.
Investors are cautioned that forward-looking information is not based on historical facts but instead reflect management’s expectations, estimates or projections concerning future results or events basedon the opinions, assumptions and estimates of management considered reasonable at the date the statements are made. Although Kirkland Lake Gold believes that the expectations reflected in suchforward-looking information are reasonable, such information involves risks and uncertainties, and undue reliance should not be placed on such information, as unknown or unpredictable factors could havematerial adverse effects on future results, performance or achievements of the combined company. Among the key factors that could cause actual results to differ materially from those projected in theforward-looking information are the following: the ability of Kirkland Lake Gold to successfully integrate their respective operations and employees and realize synergies and cost savings at the times, and tothe extent, anticipated; the potential impact on exploration activities; the potential impact of the announcement or consummation of the transaction on relationships, including with regulatory bodies,employees, suppliers, customers and competitors; the re-rating potential of the combined company; changes in general economic, business and political conditions, including changes in the financialmarkets; changes in applicable laws; compliance with extensive government regulation; and the diversion of management time on the integration of the two companies. This forward-looking informationmay be affected by risks and uncertainties in the business of Kirkland Lake Gold market conditions. This information is qualified in its entirety by cautionary statements and risk factor disclosure contained infilings made by Kirkland Lake Gold Inc. (“KLG”) and Newmarket Gold Inc. (“Newmarket”), with the Canadian securities regulators, including KLG’s and Newmarket’s respective annual information forms,financial statements and related MD&A for the financial year ended December 31, 2015 and their interim financial reports and related MD&A for the period ended September 30, 2016 filed with thesecurities regulatory authorities in certain provinces of Canada and available at www.sedar.com.
Should one or more of these risks or uncertainties materialize, or should assumptions underlying the forward-looking information prove incorrect, actual results may vary materially from those describedherein as intended, planned, anticipated, believed, estimated or expected. Although Kirkland Lake Gold and Newmarket have attempted to identify important risks, uncertainties and factors which couldcause actual results to differ materially, there may be others that cause results not to be as anticipated, estimated or intended. Kirkland Lake Gold does not intend, and do not assume any obligation, toupdate this forward-looking information except as otherwise required by applicable law.
Use of Non-GAAP Measures
This Presentation refers to average realized price, operating costs, all-in sustaining costs per ounce of gold sold, free cash flow and cash costs of productionbecause certain readers may use this information to assess the Company’s performance and also to determine the Company’s ability to generate cash flow. Thisdata is furnished to provide additional information and are non-GAAP measures and do not have any standardized meaning prescribed by International FinancialReporting Standards (“IFRS”). These measures should not be considered in isolation as a substitute for measures of performance prepared in accordance with IFRSand are not necessarily indicative of operating costs presented under IFRS. Refer to each Company’s most recent MD&A for a reconciliation of these measures.
KLGOLD.COM
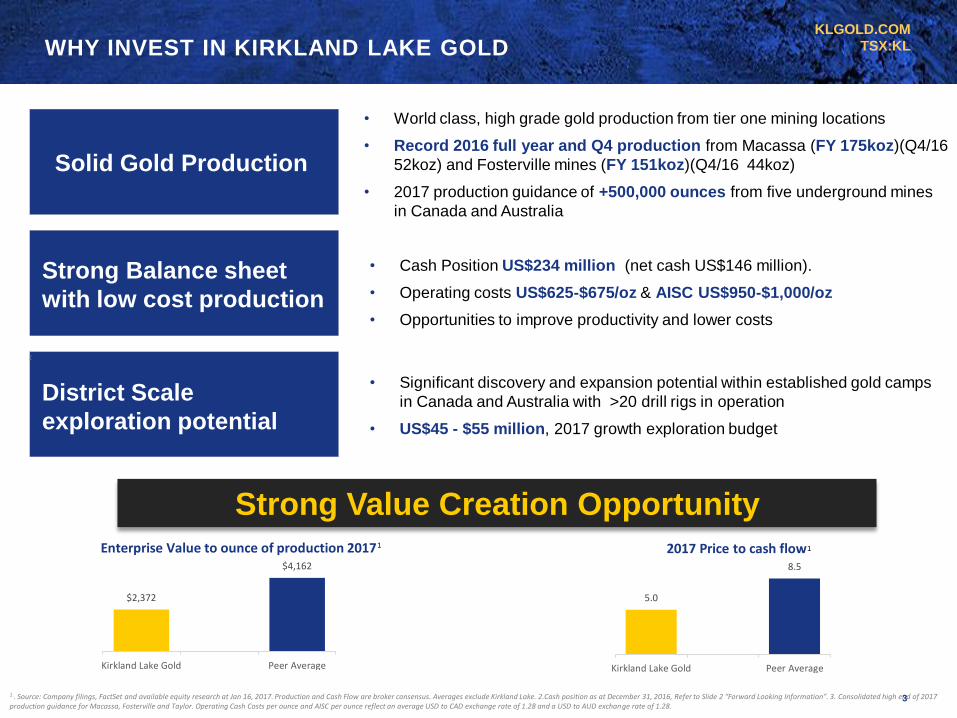
TSX:KLWHY INVEST IN KIRKLAND LAKE GOLD
Strong Value Creation Opportunity
1.. Source: Company filings, FactSet and available equity research at Jan 16, 2017. Production and Cash Flow are broker consensus. Averages exclude Kirkland Lake. 2.Cash position as at December 31, 2016, Refer to Slide 2 “Forward Looking Information”. 3. Consolidated high end of 2017 production guidance for Macassa, Fosterville and Taylor. Operating Cash Costs per ounce and AISC per ounce reflect an average USD to CAD exchange rate of 1.28 and a USD to AUD exchange rate of 1.28.
1
3
Solid Gold Production
• World class, high grade gold production from tier one mining locations
• Record 2016 full year and Q4 production from Macassa (FY 175koz)(Q4/16
52koz) and Fosterville mines (FY 151koz)(Q4/16 44koz)
• 2017 production guidance of +500,000 ounces from five underground mines
in Canada and Australia
Strong Balance sheet
with low cost production
District Scale
exploration potential
• Cash Position US$234 million (net cash US$146 million).
• Operating costs US$625-$675/oz & AISC US$950-$1,000/oz
• Opportunities to improve productivity and lower costs
• Significant discovery and expansion potential within established gold camps
in Canada and Australia with >20 drill rigs in operation
• US$45 - $55 million, 2017 growth exploration budget
5.0
8.5
Kirkland Lake Gold Peer Average
2017 Price to cash flow
$2,372
$4,162
Kirkland Lake Gold Peer Average
Enterprise Value to ounce of production 20171 1
KLGOLD.COM
TSX:KL
4
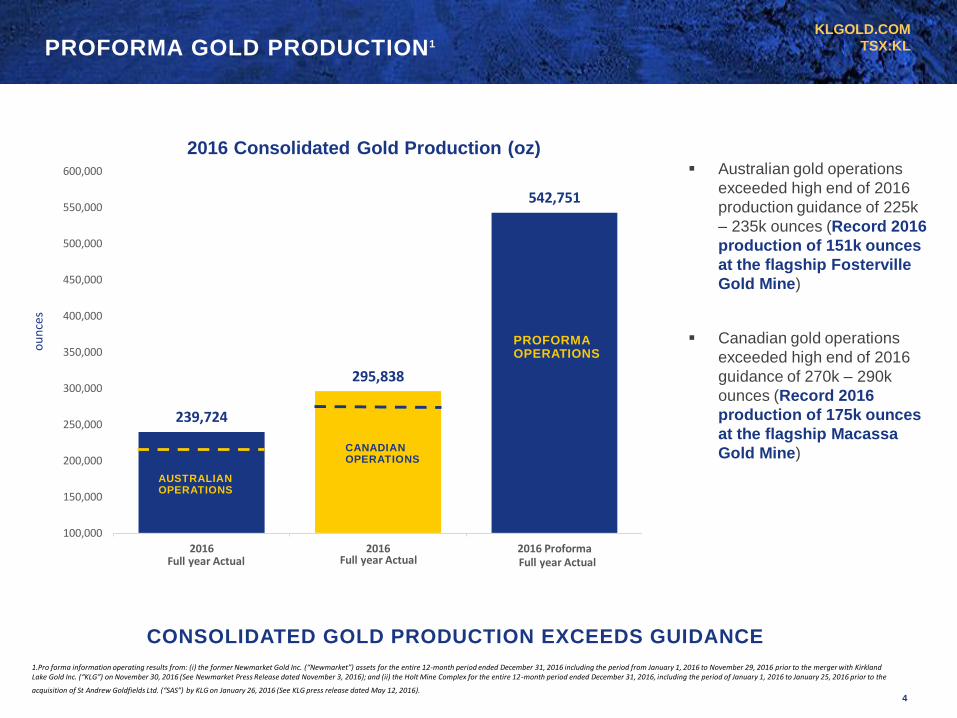
PROFORMA GOLD PRODUCTION1o
un
ces
1.Pro forma information operating results from: (i) the former Newmarket Gold Inc. (“Newmarket”) assets for the entire 12-month period ended December 31, 2016 including the period from January 1, 2016 to November 29, 2016 prior to the merger with Kirkland Lake Gold Inc. (“KLG”) on November 30, 2016 (See Newmarket Press Release dated November 3, 2016); and (ii) the Holt Mine Complex for the entire 12-month period ended December 31, 2016, including the period of January 1, 2016 to January 25, 2016 prior to the
acquisition of St Andrew Goldfields Ltd. (“SAS”) by KLG on January 26, 2016 (See KLG press release dated May 12, 2016).
CONSOLIDATED GOLD PRODUCTION EXCEEDS GUIDANCE
239,724
295,838
542,751
100,000
150,000
200,000
250,000
300,000
350,000
400,000
450,000
500,000
550,000
600,000
2016 2016 2016 Proforma
2016 Consolidated Gold Production (oz)
Full year Actual
Australian gold operations
exceeded high end of 2016
production guidance of 225k
– 235k ounces (Record 2016
production of 151k ounces
at the flagship Fosterville
Gold Mine)
Canadian gold operations
exceeded high end of 2016
guidance of 270k – 290k
ounces (Record 2016
production of 175k ounces
at the flagship Macassa
Gold Mine)
Full year Actual Full year Actual
CANADIANOPERATIONS
AUSTRALIANOPERATIONS
PROFORMAOPERATIONS
KLGOLD.COM
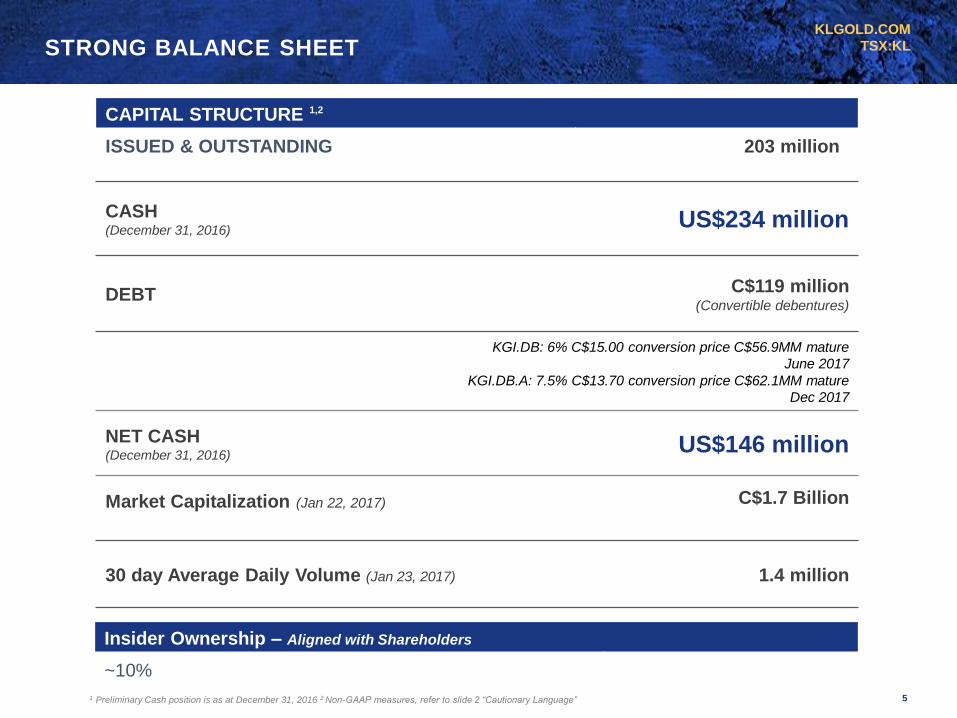
TSX:KLSTRONG BALANCE SHEET
Insider Ownership – Aligned with Shareholders
~10%
CAPITAL STRUCTURE 1,2
ISSUED & OUTSTANDING 203 million
CASH (December 31, 2016)
US$234 million
DEBT C$119 million (Convertible debentures)
KGI.DB: 6% C$15.00 conversion price C$56.9MM mature
June 2017
KGI.DB.A: 7.5% C$13.70 conversion price C$62.1MM mature
Dec 2017
NET CASH(December 31, 2016)
US$146 million
Market Capitalization (Jan 22, 2017) C$1.7 Billion
30 day Average Daily Volume (Jan 23, 2017) 1.4 million
1 Preliminary Cash position is as at December 31, 2016 2 Non-GAAP measures, refer to slide 2 “Cautionary Language” 5
KLGOLD.COM
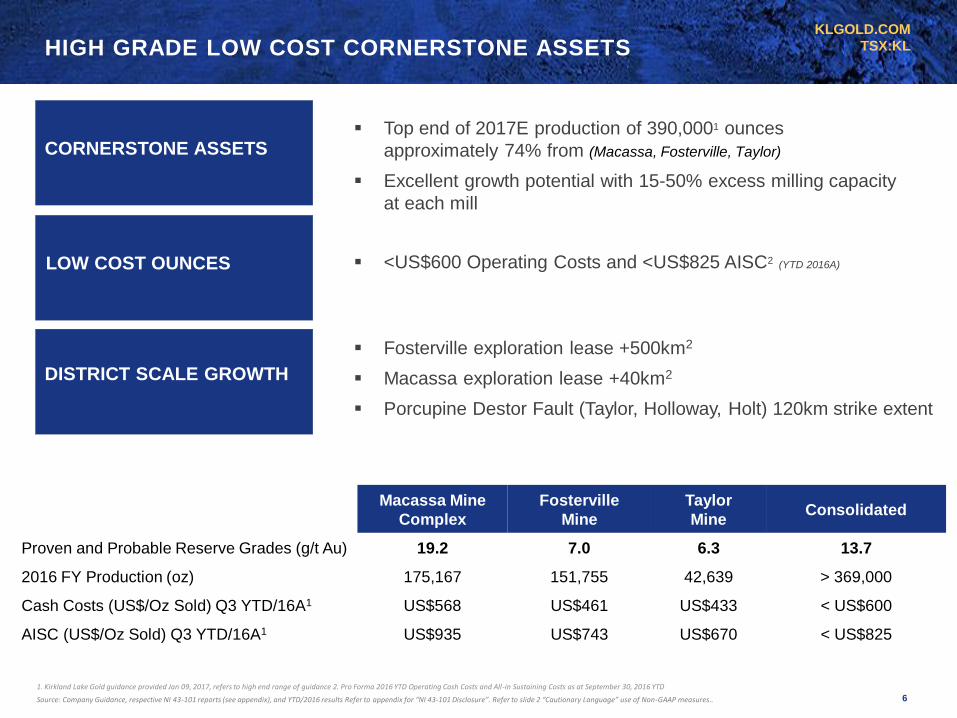
TSX:KLHIGH GRADE LOW COST CORNERSTONE ASSETS
Top end of 2017E production of 390,0001 ounces
approximately 74% from (Macassa, Fosterville, Taylor)
Excellent growth potential with 15-50% excess milling capacity
at each mill
Macassa Mine
Complex
Fosterville
Mine
Taylor
MineConsolidated
Proven and Probable Reserve Grades (g/t Au) 19.2 7.0 6.3 13.7
2016 FY Production (oz) 175,167 151,755 42,639 > 369,000
Cash Costs (US$/Oz Sold) Q3 YTD/16A1 US$568 US$461 US$433 < US$600
AISC (US$/Oz Sold) Q3 YTD/16A1 US$935 US$743 US$670 < US$825
CORNERSTONE ASSETS
LOW COST OUNCES <US$600 Operating Costs and <US$825 AISC2 (YTD 2016A)
DISTRICT SCALE GROWTH
Fosterville exploration lease +500km2
Macassa exploration lease +40km2
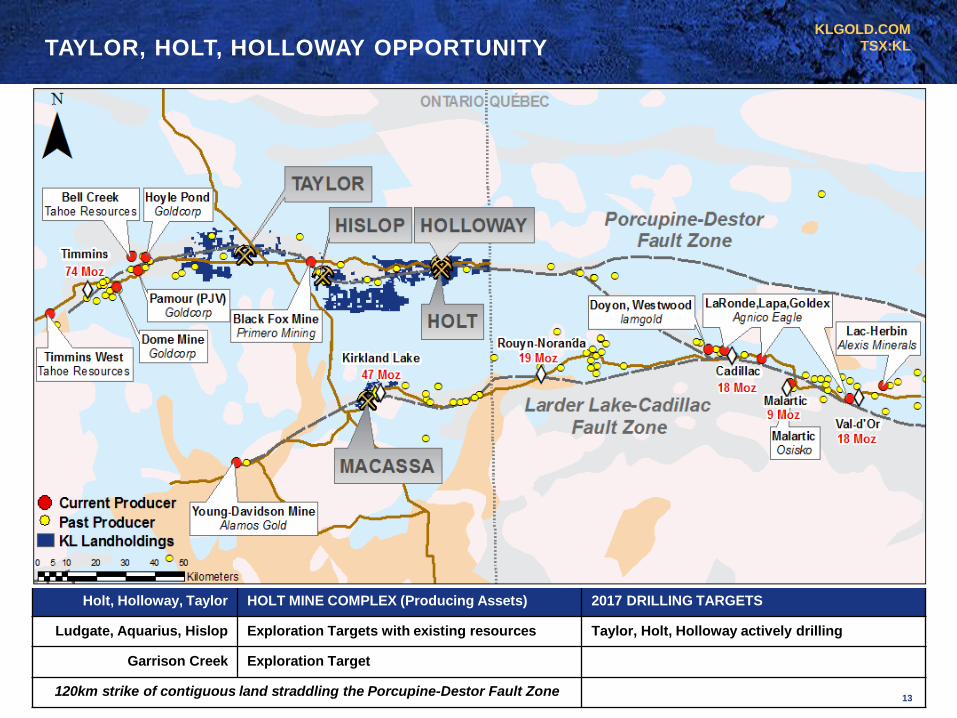
Porcupine Destor Fault (Taylor, Holloway, Holt) 120km strike extent
Source: Company Guidance, respective NI 43-101 reports (see appendix), and YTD/2016 results Refer to appendix for “NI 43-101 Disclosure”. Refer to slide 2 “Cautionary Language” use of Non-GAAP measures..
1. Kirkland Lake Gold guidance provided Jan 09, 2017, refers to high end range of guidance 2. Pro Forma 2016 YTD Operating Cash Costs and All-in Sustaining Costs as at September 30, 2016 YTD
6
KLGOLD.COM
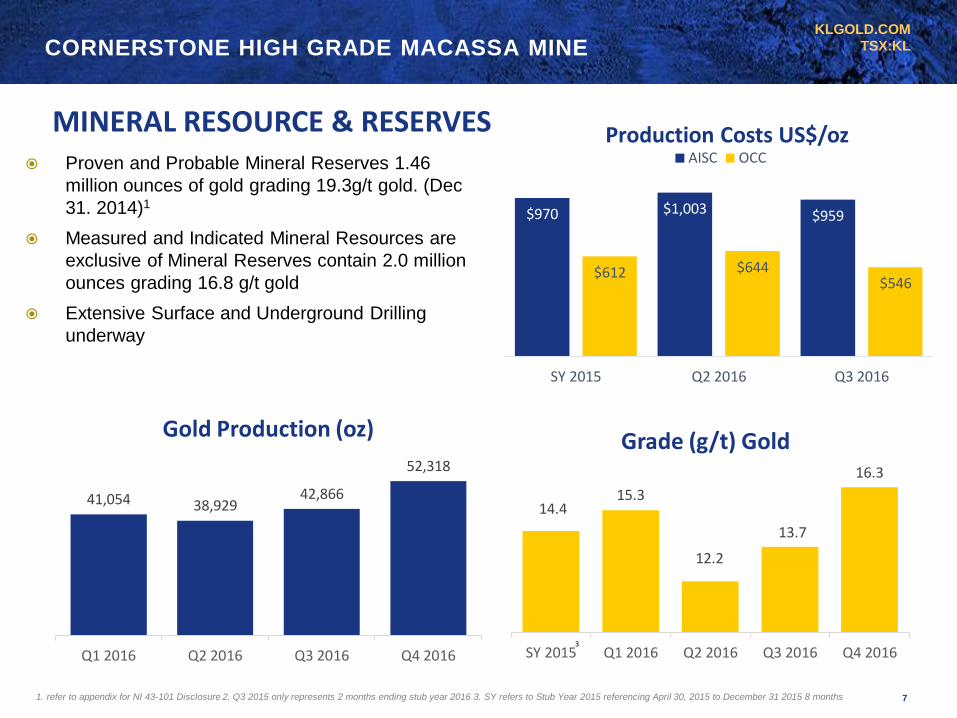
TSX:KLCORNERSTONE HIGH GRADE MACASSA MINE
41,054 38,92942,866
52,318
Q1 2016 Q2 2016 Q3 2016 Q4 2016
Gold Production (oz)
MINERAL RESOURCE & RESERVES Proven and Probable Mineral Reserves 1.46
million ounces of gold grading 19.3g/t gold. (Dec
31. 2014)1
Measured and Indicated Mineral Resources are
exclusive of Mineral Reserves contain 2.0 million
ounces grading 16.8 g/t gold
Extensive Surface and Underground Drilling
underway
14.415.3
12.2
13.7
16.3
SY 2015 Q1 2016 Q2 2016 Q3 2016 Q4 2016
Grade (g/t) Gold
1. refer to appendix for NI 43-101 Disclosure 2. Q3 2015 only represents 2 months ending stub year 2016 3. SY refers to Stub Year 2015 referencing April 30, 2015 to December 31 2015 8 months
3
7
$970 $1,003 $959
$612 $644$546
SY 2015 Q2 2016 Q3 2016
Production Costs US$/ozAISC OCC
KLGOLD.COM
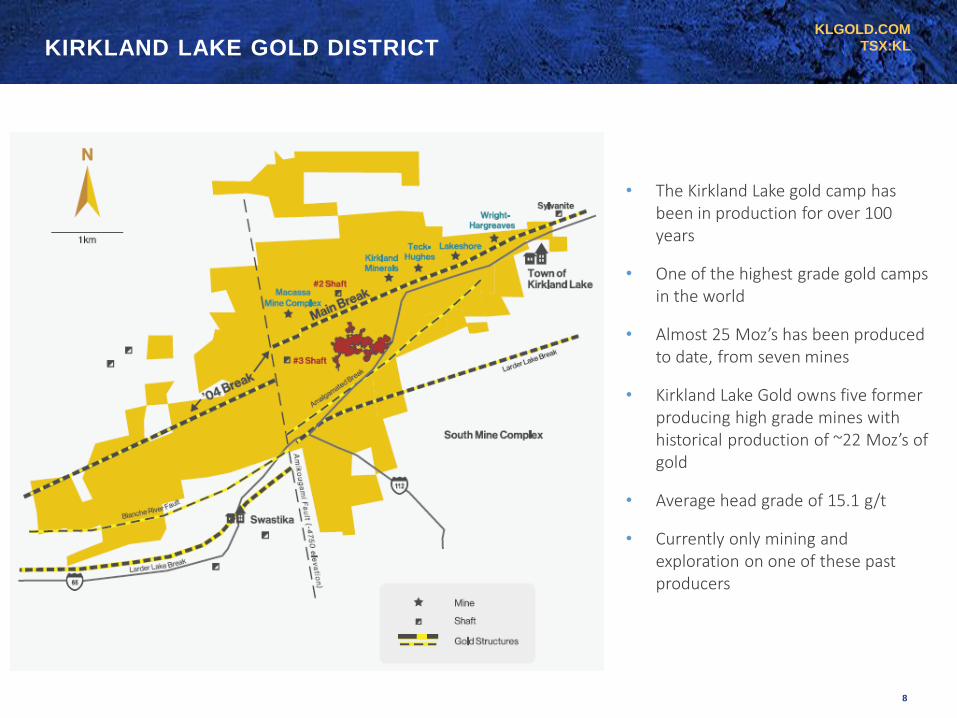
TSX:KLKIRKLAND LAKE GOLD DISTRICT
• The Kirkland Lake gold camp has been in production for over 100 years
• One of the highest grade gold camps in the world
• Almost 25 Moz’s has been produced to date, from seven mines
• Kirkland Lake Gold owns five former producing high grade mines with historical production of ~22 Moz’s of gold
• Average head grade of 15.1 g/t
• Currently only mining and exploration on one of these past producers
8
KLGOLD.COM
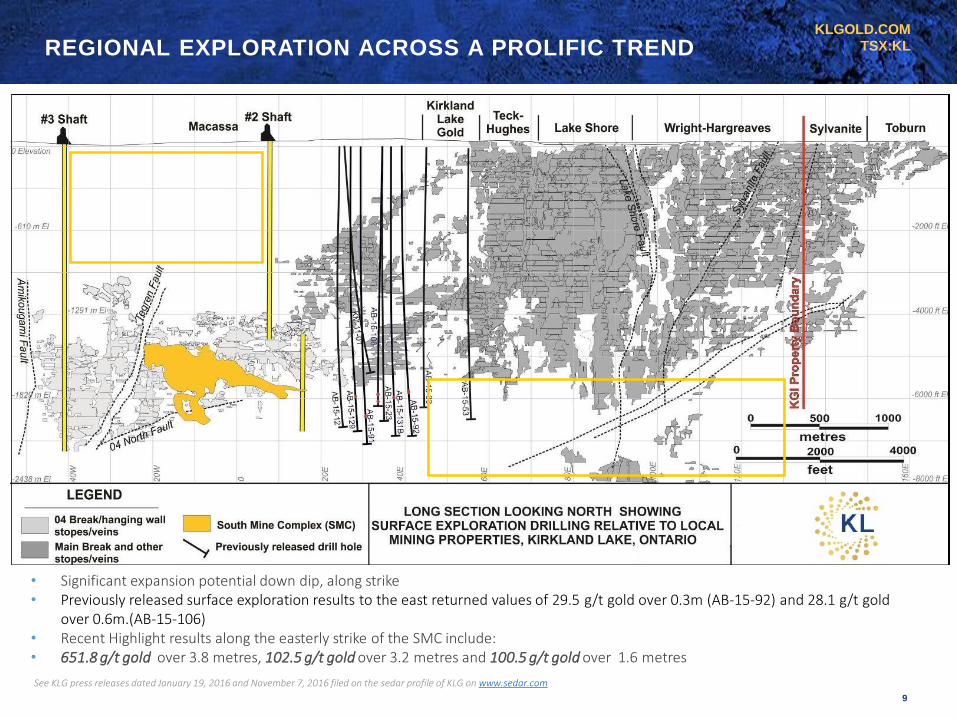
TSX:KLREGIONAL EXPLORATION ACROSS A PROLIFIC TREND
See KLG press releases dated January 19, 2016 and November 7, 2016 filed on the sedar profile of KLG on www.sedar.com
• Significant expansion potential down dip, along strike• Previously released surface exploration results to the east returned values of 29.5 g/t gold over 0.3m (AB-15-92) and 28.1 g/t gold
over 0.6m.(AB-15-106)• Recent Highlight results along the easterly strike of the SMC include:• 651.8 g/t gold over 3.8 metres, 102.5 g/t gold over 3.2 metres and 100.5 g/t gold over 1.6 metres
• UPDATED LONG SECTION COMING
9
KLGOLD.COM
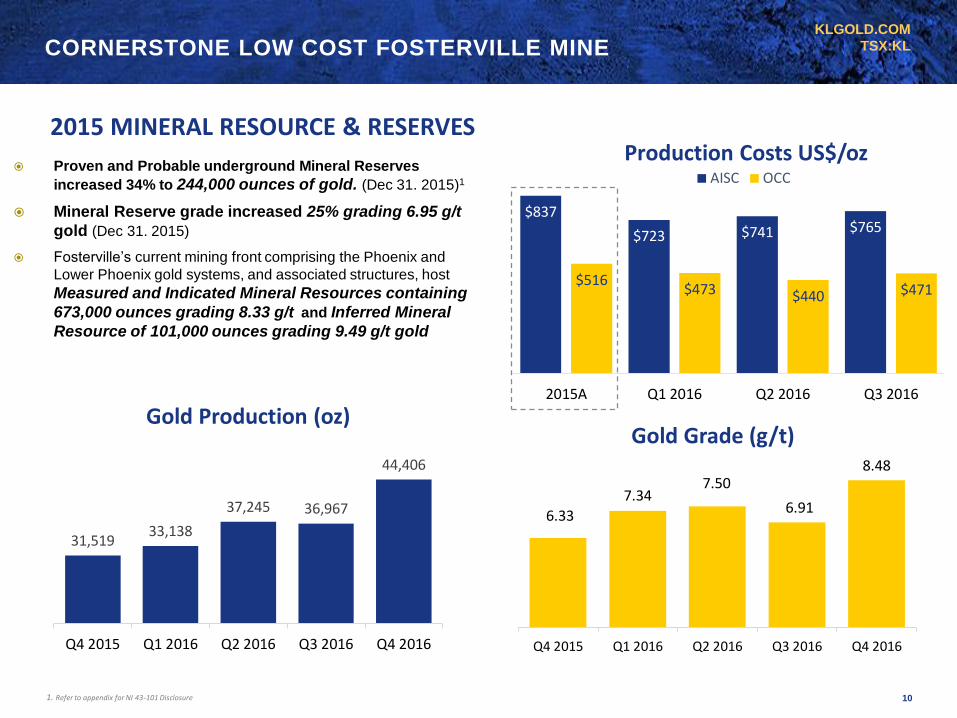
TSX:KLCORNERSTONE LOW COST FOSTERVILLE MINE
2015 MINERAL RESOURCE & RESERVES
Proven and Probable underground Mineral Reserves
increased 34% to 244,000 ounces of gold. (Dec 31. 2015)1
Mineral Reserve grade increased 25% grading 6.95 g/t
gold (Dec 31. 2015)
Fosterville’s current mining front comprising the Phoenix and
Lower Phoenix gold systems, and associated structures, host
Measured and Indicated Mineral Resources containing
673,000 ounces grading 8.33 g/t and Inferred Mineral
Resource of 101,000 ounces grading 9.49 g/t gold
$837
$723 $741 $765
$516$473 $440 $471
2015A Q1 2016 Q2 2016 Q3 2016
Production Costs US$/ozAISC OCC
31,51933,138
37,245 36,967
44,406
Q4 2015 Q1 2016 Q2 2016 Q3 2016 Q4 2016
Gold Production (oz)
6.33
7.347.50
6.91
8.48
Q4 2015 Q1 2016 Q2 2016 Q3 2016 Q4 2016
Gold Grade (g/t)
1. Refer to appendix for NI 43-101 Disclosure 10
KLGOLD.COM
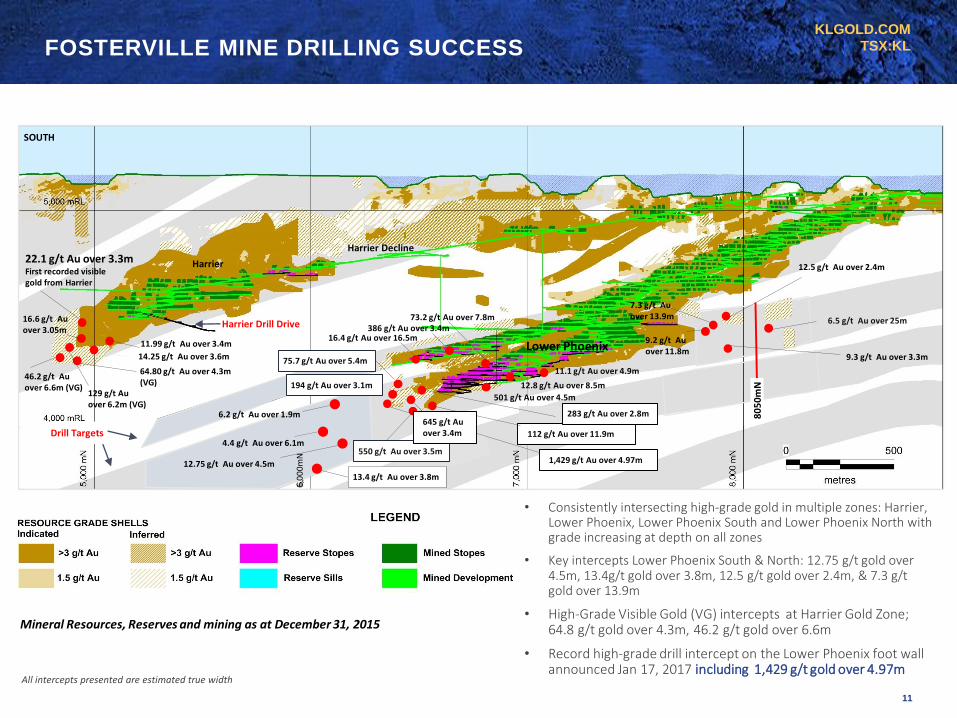
TSX:KLFOSTERVILLE MINE DRILLING SUCCESS
Harrier Drill Drive
12.5 g/t Au over 2.4m
12.75 g/t Au over 4.5m
Lower Phoenix
Drill Targets
SOUTH
Mineral Resources, Reserves and mining as at December 31, 2015
Harrier Decline
Harrier
• Consistently intersecting high-grade gold in multiple zones: Harrier, Lower Phoenix, Lower Phoenix South and Lower Phoenix North with grade increasing at depth on all zones
• Key intercepts Lower Phoenix South & North: 12.75 g/t gold over 4.5m, 13.4g/t gold over 3.8m, 12.5 g/t gold over 2.4m, & 7.3 g/t gold over 13.9m
• High-Grade Visible Gold (VG) intercepts at Harrier Gold Zone; 64.8 g/t gold over 4.3m, 46.2 g/t gold over 6.6m
• Record high-grade drill intercept on the Lower Phoenix foot wall announced Jan 17, 2017 including 1,429 g/t gold over 4.97m
4.4 g/t Au over 6.1m
6.5 g/t Au over 25m
9.3 g/t Au over 3.3m
6,0
00
mN
9.2 g/t Au over 11.8m
7.3 g/t Auover 13.9m
80
50
mN
6.2 g/t Au over 1.9m
22.1 g/t Au over 3.3mFirst recorded visible gold from Harrier
16.6 g/t Au over 3.05m
11.99 g/t Au over 3.4m
14.25 g/t Au over 3.6m
11.1 g/t Au over 4.9m
12.8 g/t Au over 8.5m
112 g/t Au over 11.9m
501 g/t Au over 4.5m
386 g/t Au over 3.4m16.4 g/t Au over 16.5m
73.2 g/t Au over 7.8m
64.80 g/t Au over 4.3m (VG)
46.2 g/t Au over 6.6m (VG)
283 g/t Au over 2.8m
13.4 g/t Au over 3.8m
75.7 g/t Au over 5.4m
194 g/t Au over 3.1m
550 g/t Au over 3.5m
129 g/t Au over 6.2m (VG)
All intercepts presented are estimated true width
11
645 g/t Au over 3.4m
1,429 g/t Au over 4.97m
KLGOLD.COM
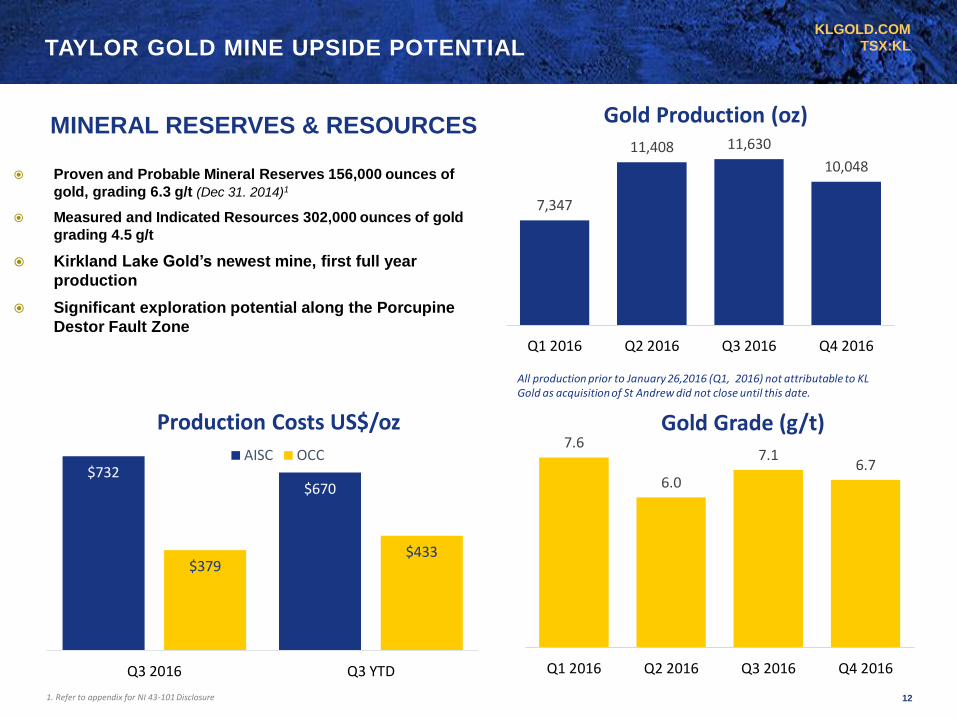
TSX:KLTAYLOR GOLD MINE UPSIDE POTENTIAL
7,347
11,408 11,630
10,048
Q1 2016 Q2 2016 Q3 2016 Q4 2016
Gold Production (oz)
All production prior to January 26,2016 (Q1, 2016) not attributable to KL Gold as acquisition of St Andrew did not close until this date.
7.6
6.0
7.16.7
Q1 2016 Q2 2016 Q3 2016 Q4 2016
Gold Grade (g/t)
MINERAL RESERVES & RESOURCES
Proven and Probable Mineral Reserves 156,000 ounces of
gold, grading 6.3 g/t (Dec 31. 2014)1
Measured and Indicated Resources 302,000 ounces of gold
grading 4.5 g/t
Kirkland Lake Gold’s newest mine, first full year
production
Significant exploration potential along the Porcupine
Destor Fault Zone
$732$670
$379$433
Q3 2016 Q3 YTD
Production Costs US$/oz
AISC OCC
1. Refer to appendix for NI 43-101 Disclosure 12
KLGOLD.COM
TSX:KLTAYLOR, HOLT, HOLLOWAY OPPORTUNITY
Holt, Holloway, Taylor HOLT MINE COMPLEX (Producing Assets) 2017 DRILLING TARGETS
Ludgate, Aquarius, Hislop Exploration Targets with existing resources Taylor, Holt, Holloway actively drilling
Garrison Creek Exploration Target
120km strike of contiguous land straddling the Porcupine-Destor Fault Zone
120km
13
KLGOLD.COM
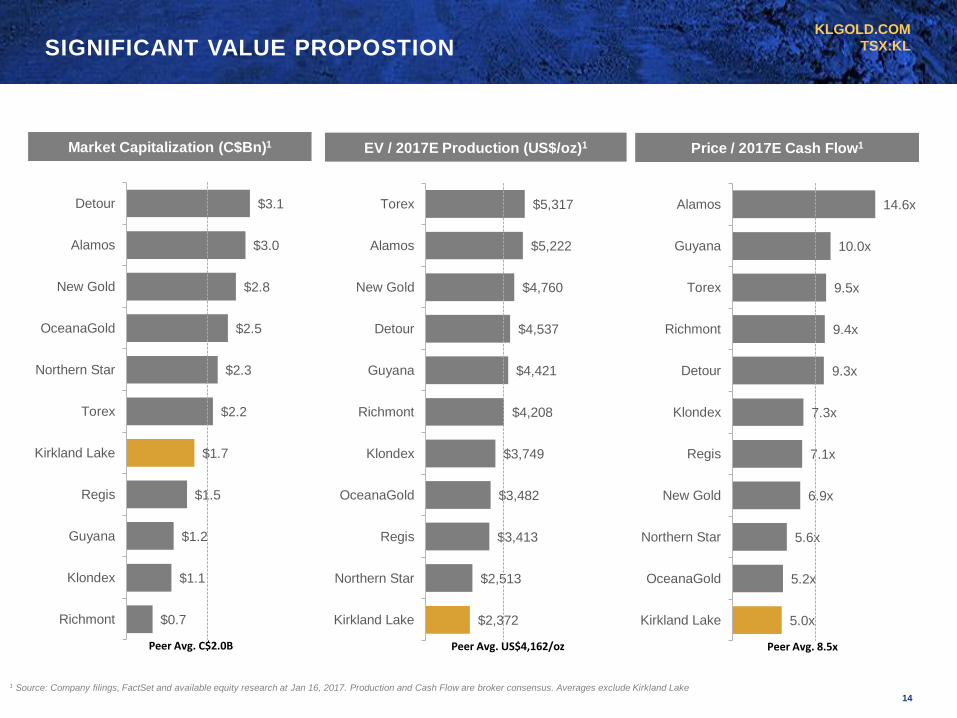
TSX:KLSIGNIFICANT VALUE PROPOSTION
14
Price / 2017E Cash Flow1Market Capitalization (C$Bn)1
1 Source: Company filings, FactSet and available equity research at Jan 16, 2017. Production and Cash Flow are broker consensus. Averages exclude Kirkland Lake
EV / 2017E Production (US$/oz)1
$5,317
$5,222
$4,760
$4,537
$4,421
$4,208
$3,749
$3,482
$3,413
$2,513
$2,372
Torex
Alamos
New Gold
Detour
Guyana
Richmont
Klondex
OceanaGold
Regis
Northern Star
Kirkland Lake
Peer Avg. US$4,162/oz
14.6x
10.0x
9.5x
9.4x
9.3x
7.3x
7.1x
6.9x
5.6x
5.2x
5.0x
Alamos
Guyana
Torex
Richmont
Detour
Klondex
Regis
New Gold
Northern Star
OceanaGold
Kirkland Lake
Peer Avg. 8.5x
$3.1
$3.0
$2.8
$2.5
$2.3
$2.2
$1.7
$1.5
$1.2
$1.1
$0.7
Detour
Alamos
New Gold
OceanaGold
Northern Star
Torex
Kirkland Lake
Regis
Guyana
Klondex
Richmont
Peer Avg. C$2.0B
KLGOLD.COM
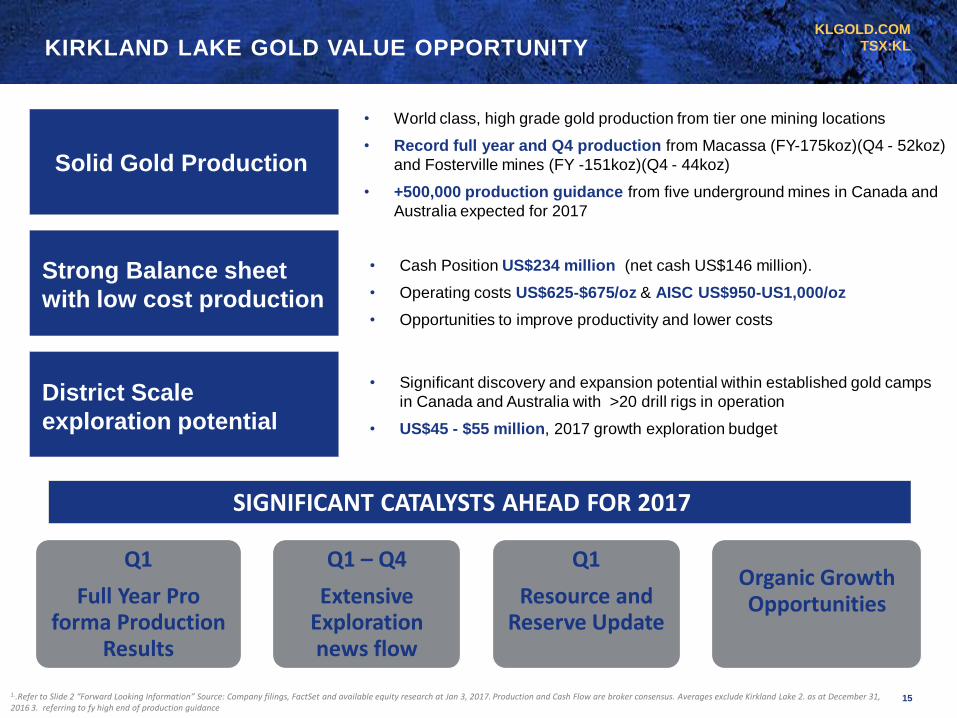
TSX:KLKIRKLAND LAKE GOLD VALUE OPPORTUNITY
1..Refer to Slide 2 “Forward Looking Information” Source: Company filings, FactSet and available equity research at Jan 3, 2017. Production and Cash Flow are broker consensus. Averages exclude Kirkland Lake 2. as at December 31, 2016 3. referring to fy high end of production guidance
Q1
Full Year Pro forma Production
Results
Q1 – Q4
Extensive Exploration news flow
Q1
Resource and Reserve Update
Organic Growth Opportunities
SIGNIFICANT CATALYSTS AHEAD FOR 2017
15
Solid Gold Production
• World class, high grade gold production from tier one mining locations
• Record full year and Q4 production from Macassa (FY-175koz)(Q4 - 52koz)
and Fosterville mines (FY -151koz)(Q4 - 44koz)
• +500,000 production guidance from five underground mines in Canada and
Australia expected for 2017
Strong Balance sheet
with low cost production
District Scale
exploration potential
• Cash Position US$234 million (net cash US$146 million).
• Operating costs US$625-$675/oz & AISC US$950-US1,000/oz
• Opportunities to improve productivity and lower costs
• Significant discovery and expansion potential within established gold camps
in Canada and Australia with >20 drill rigs in operation
• US$45 - $55 million, 2017 growth exploration budget
APPENDIX
Notes, additional disclosure and other information
KLGOLD.COM
TSX: KL
January 2017
KLGOLD.COM
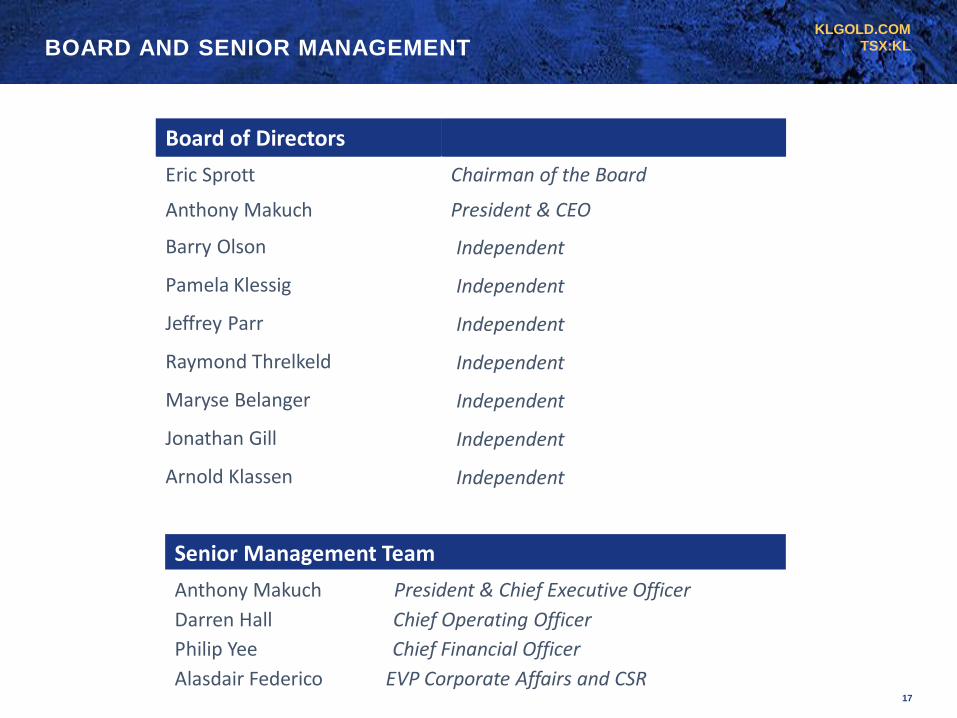
TSX:KLBOARD AND SENIOR MANAGEMENT
17
Board of Directors
Eric Sprott Chairman of the Board
Anthony Makuch President & CEO
Barry Olson Independent
Pamela Klessig Independent
Jeffrey Parr Independent
Raymond Threlkeld Independent
Maryse Belanger Independent
Jonathan Gill Independent
Arnold Klassen Independent
Senior Management Team
Anthony Makuch President & Chief Executive Officer
Darren Hall Chief Operating Officer
Philip Yee Chief Financial Officer
Alasdair Federico EVP Corporate Affairs and CSR
KLGOLD.COM
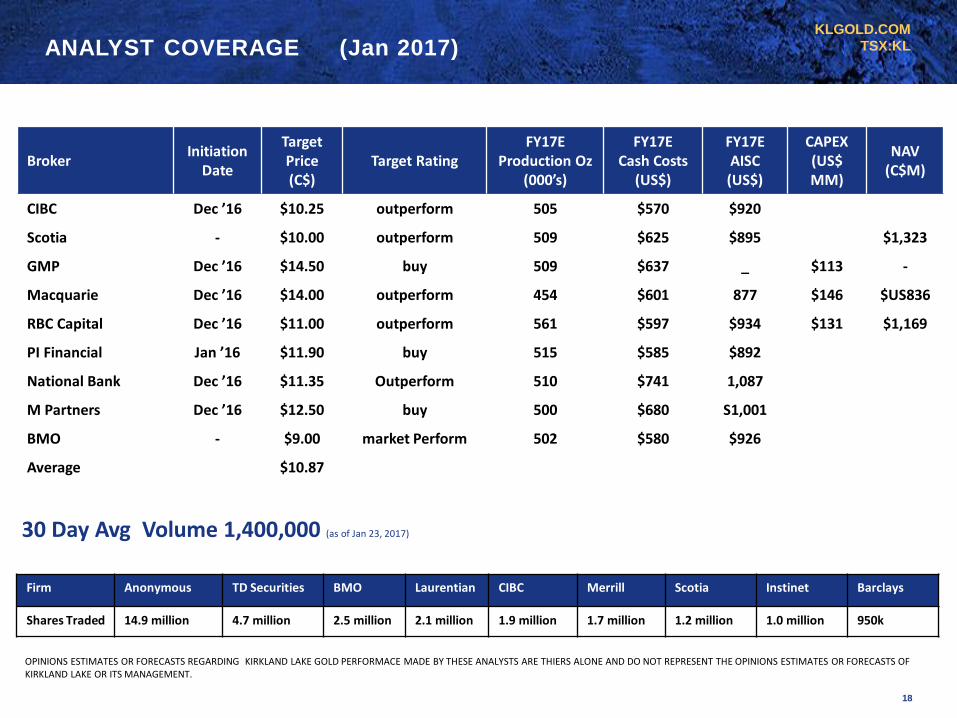
TSX:KLANALYST COVERAGE (Jan 2017)
18
Firm Anonymous TD Securities BMO Laurentian CIBC Merrill Scotia Instinet Barclays
Shares Traded 14.9 million 4.7 million 2.5 million 2.1 million 1.9 million 1.7 million 1.2 million 1.0 million 950k
30 Day Avg Volume 1,400,000 (as of Jan 23, 2017)
BrokerInitiation
Date
TargetPrice (C$)
Target RatingFY17E
Production Oz(000’s)
FY17ECash Costs
(US$)
FY17EAISC (US$)
CAPEX (US$ MM)
NAV (C$M)
CIBC Dec ’16 $10.25 outperform 505 $570 $920
Scotia - $10.00 outperform 509 $625 $895 $1,323
GMP Dec ’16 $14.50 buy 509 $637 _ $113 -
Macquarie Dec ’16 $14.00 outperform 454 $601 877 $146 $US836
RBC Capital Dec ’16 $11.00 outperform 561 $597 $934 $131 $1,169
PI Financial Jan ’16 $11.90 buy 515 $585 $892
National Bank Dec ’16 $11.35 Outperform 510 $741 1,087
M Partners Dec ’16 $12.50 buy 500 $680 S1,001
BMO - $9.00 market Perform 502 $580 $926
Average $10.87
OPINIONS ESTIMATES OR FORECASTS REGARDING KIRKLAND LAKE GOLD PERFORMACE MADE BY THESE ANALYSTS ARE THIERS ALONE AND DO NOT REPRESENT THE OPINIONS ESTIMATES OR FORECASTS OF KIRKLAND LAKE OR ITS MANAGEMENT.
KLGOLD.COM
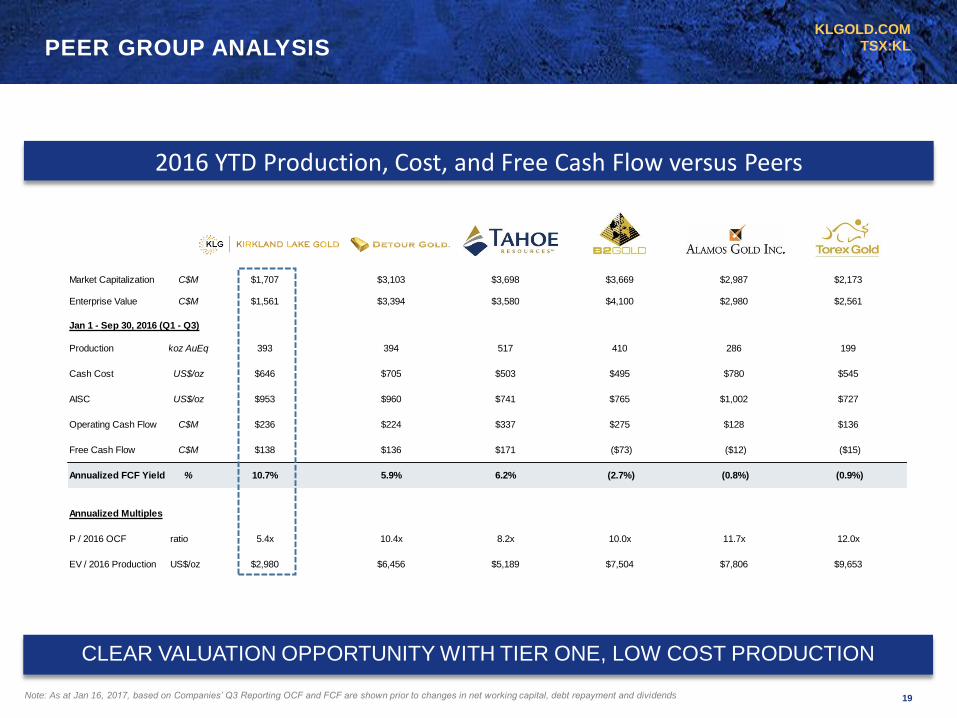
TSX:KLPEER GROUP ANALYSIS
Note: As at Jan 16, 2017, based on Companies’ Q3 Reporting OCF and FCF are shown prior to changes in net working capital, debt repayment and dividends
CLEAR VALUATION OPPORTUNITY WITH TIER ONE, LOW COST PRODUCTION
19
2016 YTD Production, Cost, and Free Cash Flow versus Peers
Market Capitalization C$M $1,707 $3,103 $3,698 $3,669 $2,987 $2,173
Enterprise Value C$M $1,561 $3,394 $3,580 $4,100 $2,980 $2,561
Jan 1 - Sep 30, 2016 (Q1 - Q3)
Production koz AuEq 393 394 517 410 286 199
Cash Cost US$/oz $646 $705 $503 $495 $780 $545
AISC US$/oz $953 $960 $741 $765 $1,002 $727
Operating Cash Flow C$M $236 $224 $337 $275 $128 $136
Free Cash Flow C$M $138 $136 $171 ($73) ($12) ($15)
Annualized FCF Yield % 10.7% 5.9% 6.2% (2.7%) (0.8%) (0.9%)
Annualized Multiples
P / 2016 OCF ratio 5.4x 10.4x 8.2x 10.0x 11.7x 12.0x
EV / 2016 Production US$/oz $2,980 $6,456 $5,189 $7,504 $7,806 $9,653
KLGOLD.COM
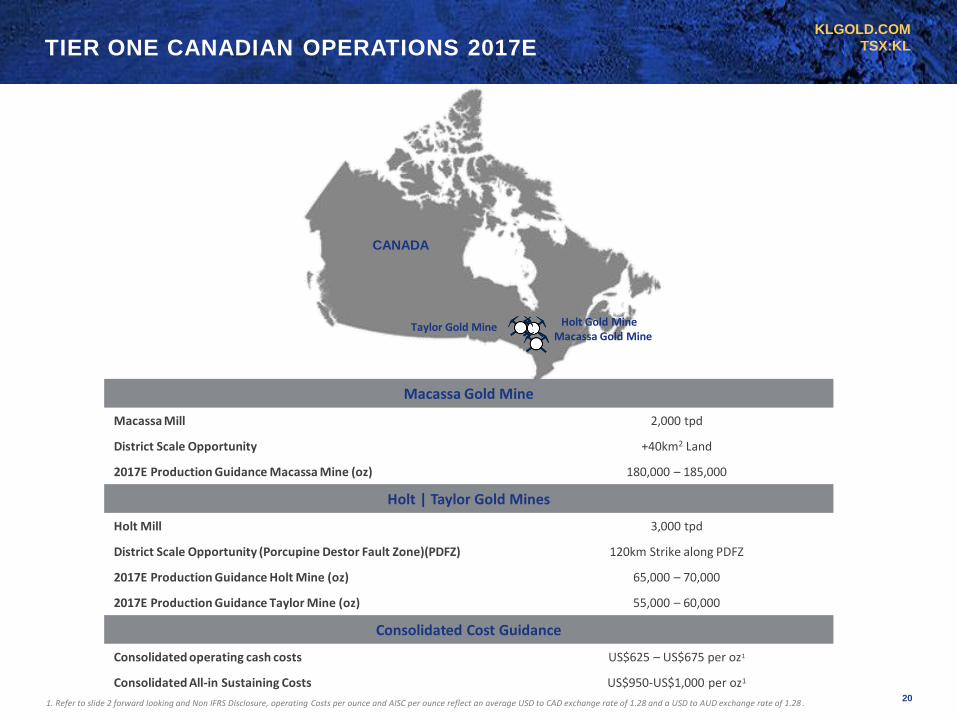
TSX:KLTIER ONE CANADIAN OPERATIONS 2017E
CANADA
Macassa Gold Mine Holt Gold Mine
Macassa Gold Mine
Macassa Mill 2,000 tpd
District Scale Opportunity +40km2 Land
2017E Production Guidance Macassa Mine (oz) 180,000 – 185,000
Holt | Taylor Gold Mines
Holt Mill 3,000 tpd
District Scale Opportunity (Porcupine Destor Fault Zone)(PDFZ) 120km Strike along PDFZ
2017E Production Guidance Holt Mine (oz) 65,000 – 70,000
2017E Production Guidance Taylor Mine (oz) 55,000 – 60,000
Consolidated Cost Guidance
Consolidated operating cash costs US$625 – US$675 per oz1
Consolidated All-in Sustaining Costs US$950-US$1,000 per oz1
Taylor Gold Mine
1. Refer to slide 2 forward looking and Non IFRS Disclosure, operating Costs per ounce and AISC per ounce reflect an average USD to CAD exchange rate of 1.28 and a USD to AUD exchange rate of 1.28 .20
KLGOLD.COM
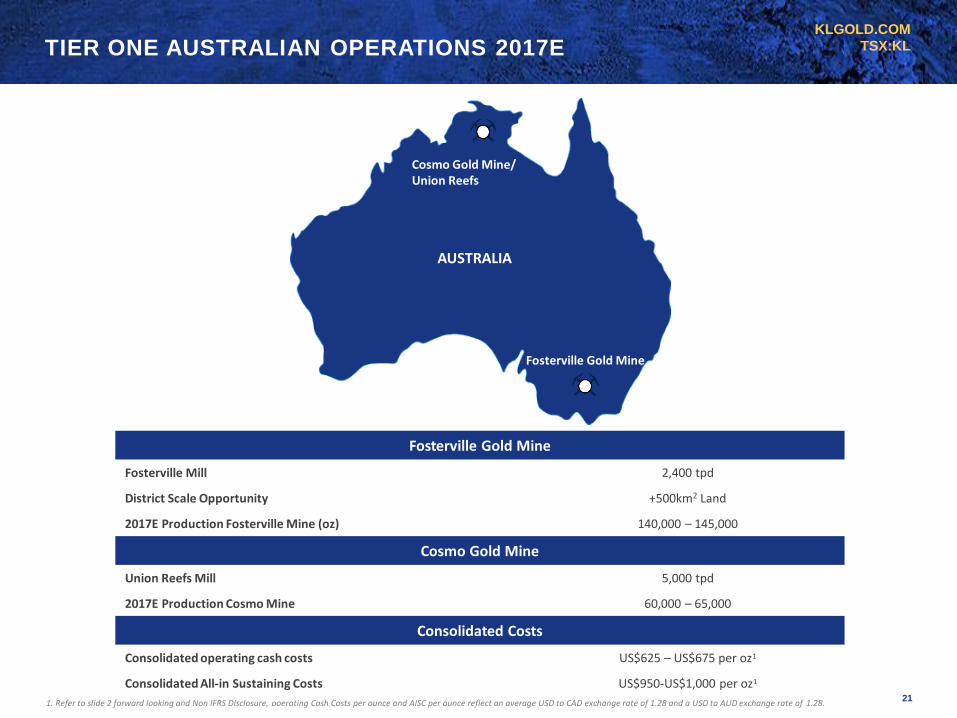
TSX:KLTIER ONE AUSTRALIAN OPERATIONS 2017E
Cosmo Gold Mine/ Union Reefs
Fosterville Gold Mine
AUSTRALIA
Fosterville Gold Mine
Fosterville Mill 2,400 tpd
District Scale Opportunity +500km2 Land
2017E Production Fosterville Mine (oz) 140,000 – 145,000
Cosmo Gold Mine
Union Reefs Mill 5,000 tpd
2017E Production Cosmo Mine 60,000 – 65,000
Consolidated Costs
Consolidated operating cash costs US$625 – US$675 per oz1
Consolidated All-in Sustaining Costs US$950-US$1,000 per oz1
1. Refer to slide 2 forward looking and Non IFRS Disclosure, ooerating Cash Costs per ounce and AISC per ounce reflect an average USD to CAD exchange rate of 1.28 and a USD to AUD exchange rate of 1.28.21
KLGOLD.COM
TSX:KL
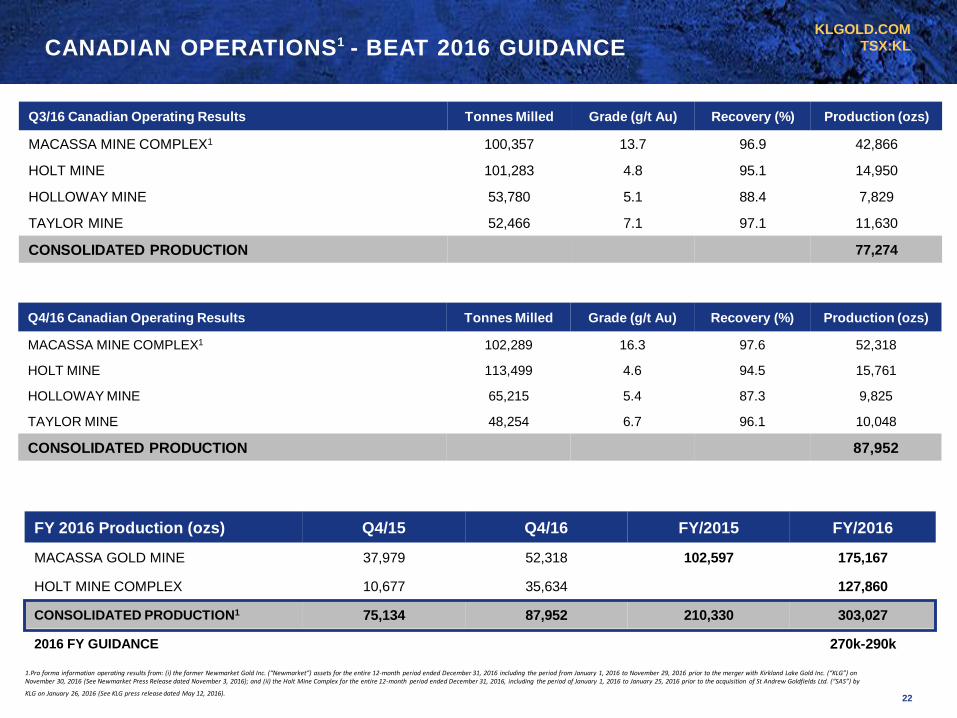
FY 2016 Production (ozs) Q4/15 Q4/16 FY/2015 FY/2016
MACASSA GOLD MINE 37,979 52,318 102,597 175,167
HOLT MINE COMPLEX 10,677 35,634 127,860
CONSOLIDATED PRODUCTION1 75,134 87,952 210,330 303,027
2016 FY GUIDANCE 270k-290k
Q3/16 Canadian Operating Results Tonnes Milled Grade (g/t Au) Recovery (%) Production (ozs)
MACASSA MINE COMPLEX1 100,357 13.7 96.9 42,866
HOLT MINE 101,283 4.8 95.1 14,950
HOLLOWAY MINE 53,780 5.1 88.4 7,829
TAYLOR MINE 52,466 7.1 97.1 11,630
CONSOLIDATED PRODUCTION 77,274
Q4/16 Canadian Operating Results Tonnes Milled Grade (g/t Au) Recovery (%) Production (ozs)
MACASSA MINE COMPLEX1 102,289 16.3 97.6 52,318
HOLT MINE 113,499 4.6 94.5 15,761
HOLLOWAY MINE 65,215 5.4 87.3 9,825
TAYLOR MINE 48,254 6.7 96.1 10,048
CONSOLIDATED PRODUCTION 87,952
CANADIAN OPERATIONS1 - BEAT 2016 GUIDANCE
22
1.Pro forma information operating results from: (i) the former Newmarket Gold Inc. (“Newmarket”) assets for the entire 12-month period ended December 31, 2016 including the period from January 1, 2016 to November 29, 2016 prior to the merger with Kirkland Lake Gold Inc. (“KLG”) on November 30, 2016 (See Newmarket Press Release dated November 3, 2016); and (ii) the Holt Mine Complex for the entire 12-month period ended December 31, 2016, including the period of January 1, 2016 to January 25, 2016 prior to the acquisition of St Andrew Goldfields Ltd. (“SAS”) by
KLG on January 26, 2016 (See KLG press release dated May 12, 2016).
KLGOLD.COM
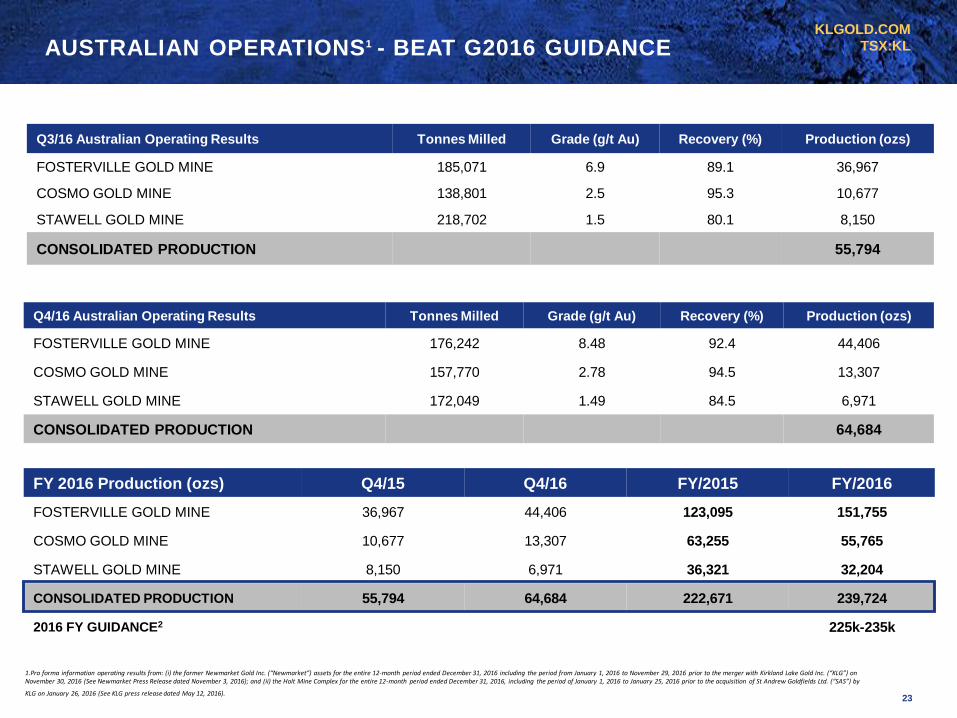
TSX:KLAUSTRALIAN OPERATIONS1 - BEAT G2016 GUIDANCE
Q4/16 Australian Operating Results Tonnes Milled Grade (g/t Au) Recovery (%) Production (ozs)
FOSTERVILLE GOLD MINE 176,242 8.48 92.4 44,406
COSMO GOLD MINE 157,770 2.78 94.5 13,307
STAWELL GOLD MINE 172,049 1.49 84.5 6,971
CONSOLIDATED PRODUCTION 64,684
FY 2016 Production (ozs) Q4/15 Q4/16 FY/2015 FY/2016
FOSTERVILLE GOLD MINE 36,967 44,406 123,095 151,755
COSMO GOLD MINE 10,677 13,307 63,255 55,765
STAWELL GOLD MINE 8,150 6,971 36,321 32,204
CONSOLIDATED PRODUCTION 55,794 64,684 222,671 239,724
2016 FY GUIDANCE2 225k-235k
Q3/16 Australian Operating Results Tonnes Milled Grade (g/t Au) Recovery (%) Production (ozs)
FOSTERVILLE GOLD MINE 185,071 6.9 89.1 36,967
COSMO GOLD MINE 138,801 2.5 95.3 10,677
STAWELL GOLD MINE 218,702 1.5 80.1 8,150
CONSOLIDATED PRODUCTION 55,794
23
1.Pro forma information operating results from: (i) the former Newmarket Gold Inc. (“Newmarket”) assets for the entire 12-month period ended December 31, 2016 including the period from January 1, 2016 to November 29, 2016 prior to the merger with Kirkland Lake Gold Inc. (“KLG”) on November 30, 2016 (See Newmarket Press Release dated November 3, 2016); and (ii) the Holt Mine Complex for the entire 12-month period ended December 31, 2016, including the period of January 1, 2016 to January 25, 2016 prior to the acquisition of St Andrew Goldfields Ltd. (“SAS”) by
KLG on January 26, 2016 (See KLG press release dated May 12, 2016).
KLGOLD.COM
TSX:KLLOW COST, HIGH MARGIN GOLD PRODUCTION
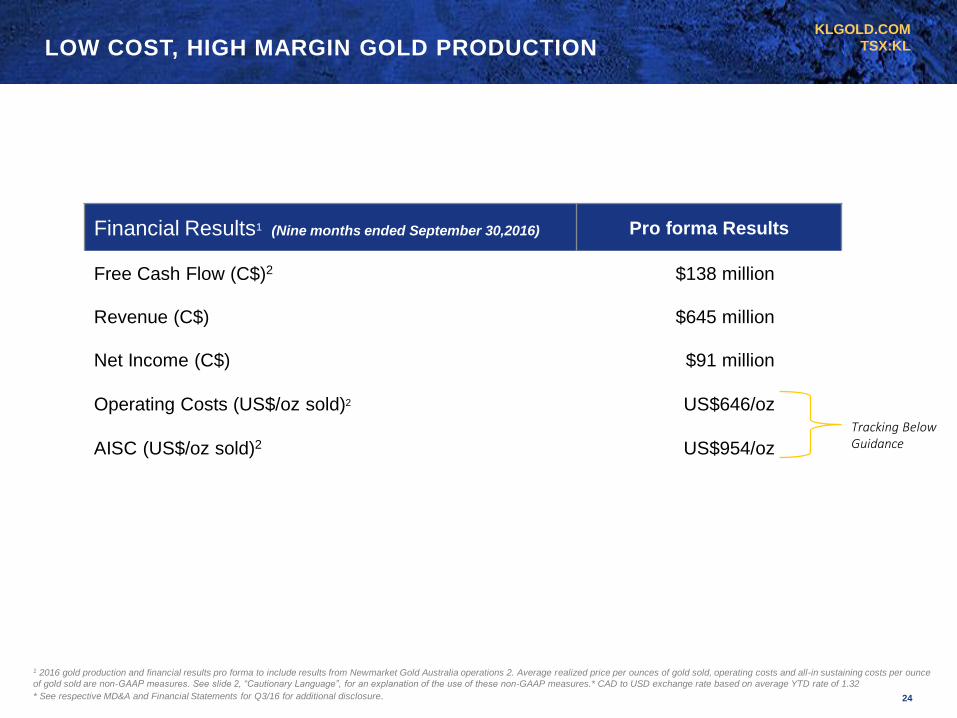
Financial Results1 (Nine months ended September 30,2016) Pro forma Results
Free Cash Flow (C$)2 $138 million
Revenue (C$) $645 million
Net Income (C$) $91 million
Operating Costs (US$/oz sold)2 US$646/oz
AISC (US$/oz sold)2 US$954/oz
Tracking Below Guidance
1 2016 gold production and financial results pro forma to include results from Newmarket Gold Australia operations 2. Average realized price per ounces of gold sold, operating costs and all-in sustaining costs per ounce
of gold sold are non-GAAP measures. See slide 2, “Cautionary Language”, for an explanation of the use of these non-GAAP measures.* CAD to USD exchange rate based on average YTD rate of 1.32
* See respective MD&A and Financial Statements for Q3/16 for additional disclosure. 24
KLGOLD.COM
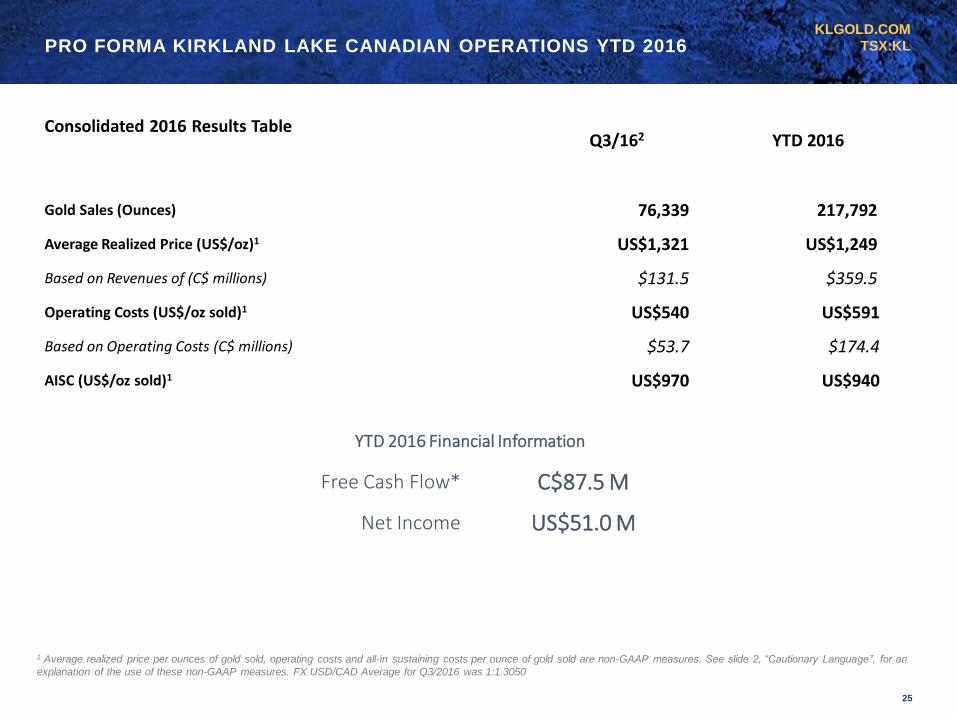
TSX:KLPRO FORMA KIRKLAND LAKE CANADIAN OPERATIONS YTD 2016
Consolidated 2016 Results TableQ3/162 YTD 2016
Gold Sales (Ounces) 76,339 217,792
Average Realized Price (US$/oz)1 US$1,321 US$1,249
Based on Revenues of (C$ millions) $131.5 $359.5
Operating Costs (US$/oz sold)1 US$540 US$591
Based on Operating Costs (C$ millions) $53.7 $174.4
AISC (US$/oz sold)1 US$970 US$940
1 Average realized price per ounces of gold sold, operating costs and all-in sustaining costs per ounce of gold sold are non-GAAP measures. See slide 2, “Cautionary Language”, for an
explanation of the use of these non-GAAP measures. FX USD/CAD Average for Q3/2016 was 1:1.3050
YTD 2016 Financial Information
Free Cash Flow* C$87.5 M
Net Income US$51.0 M
25
KLGOLD.COM
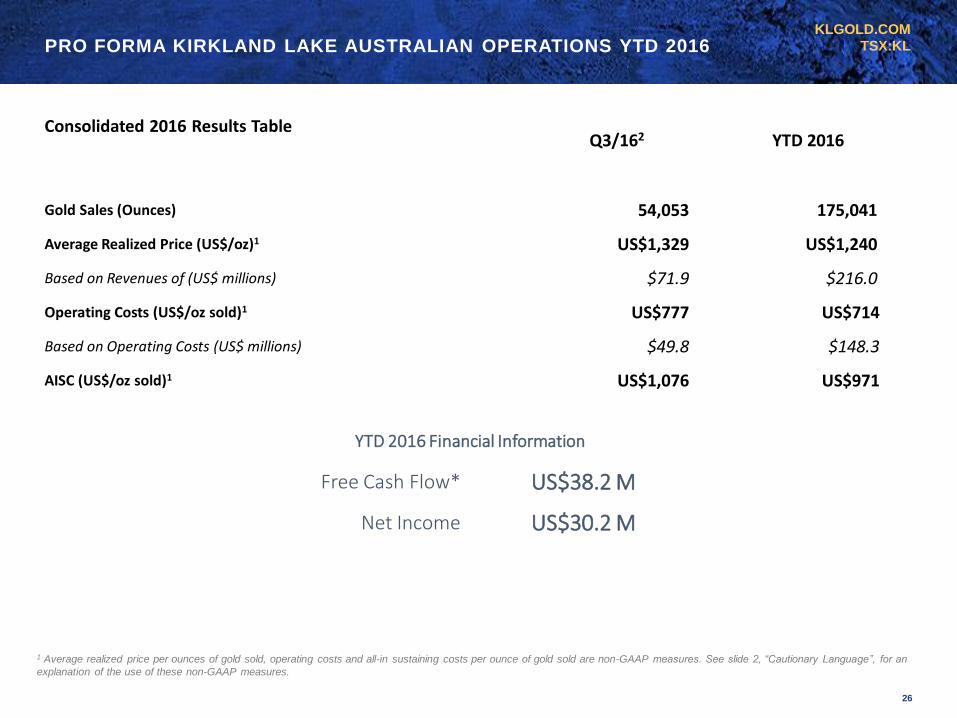
TSX:KLPRO FORMA KIRKLAND LAKE AUSTRALIAN OPERATIONS YTD 2016
Consolidated 2016 Results TableQ3/162 YTD 2016
Gold Sales (Ounces) 54,053 175,041
Average Realized Price (US$/oz)1 US$1,329 US$1,240
Based on Revenues of (US$ millions) $71.9 $216.0
Operating Costs (US$/oz sold)1 US$777 US$714
Based on Operating Costs (US$ millions) $49.8 $148.3
AISC (US$/oz sold)1 US$1,076 US$971
YTD 2016 Financial Information
Free Cash Flow* US$38.2 M
Net Income US$30.2 M
1 Average realized price per ounces of gold sold, operating costs and all-in sustaining costs per ounce of gold sold are non-GAAP measures. See slide 2, “Cautionary Language”, for an
explanation of the use of these non-GAAP measures.
26
KLGOLD.COM
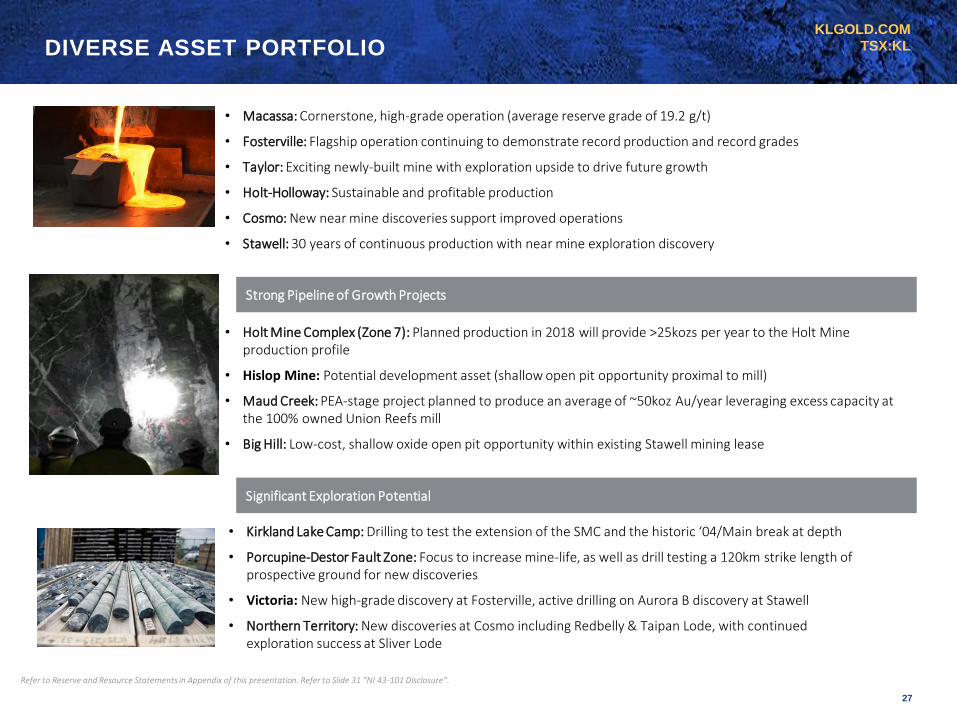
TSX:KLDIVERSE ASSET PORTFOLIO
Strong Pipeline of Growth Projects
Significant Exploration Potential
• Macassa: Cornerstone, high-grade operation (average reserve grade of 19.2 g/t)
• Fosterville: Flagship operation continuing to demonstrate record production and record grades
• Taylor: Exciting newly-built mine with exploration upside to drive future growth
• Holt-Holloway: Sustainable and profitable production
• Cosmo: New near mine discoveries support improved operations
• Stawell: 30 years of continuous production with near mine exploration discovery
• Holt Mine Complex (Zone 7): Planned production in 2018 will provide >25kozs per year to the Holt Mine production profile
• Hislop Mine: Potential development asset (shallow open pit opportunity proximal to mill)
• Maud Creek: PEA-stage project planned to produce an average of ~50koz Au/year leveraging excess capacity at the 100% owned Union Reefs mill
• Big Hill: Low-cost, shallow oxide open pit opportunity within existing Stawell mining lease
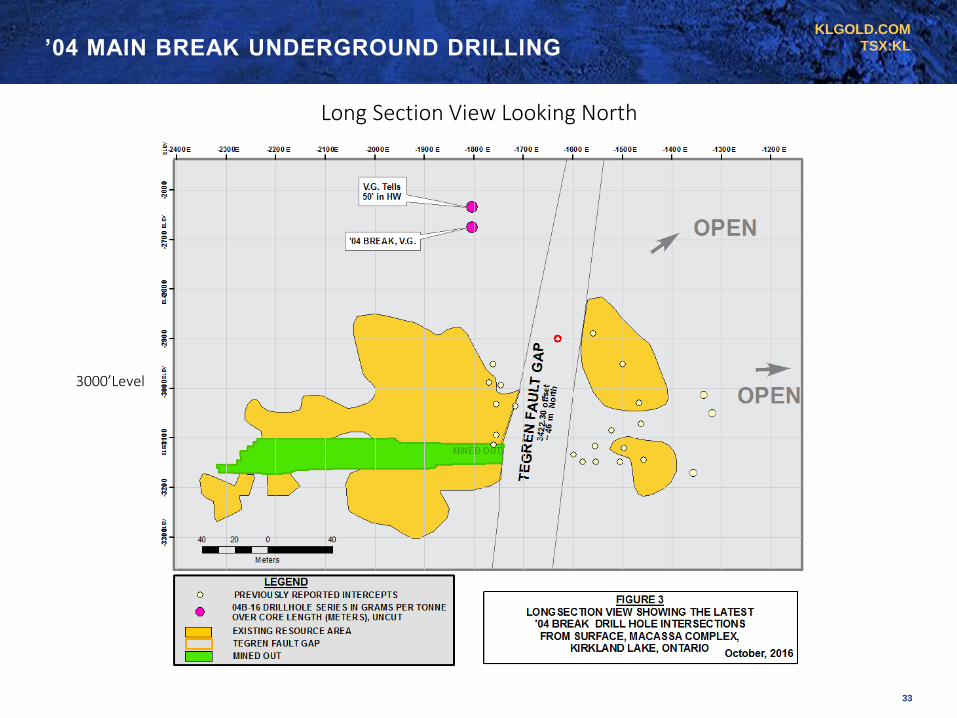
• Kirkland Lake Camp: Drilling to test the extension of the SMC and the historic ‘04/Main break at depth
• Porcupine-Destor Fault Zone: Focus to increase mine-life, as well as drill testing a 120km strike length of prospective ground for new discoveries
• Victoria: New high-grade discovery at Fosterville, active drilling on Aurora B discovery at Stawell
• Northern Territory: New discoveries at Cosmo including Redbelly & Taipan Lode, with continued exploration success at Sliver Lode
Refer to Reserve and Resource Statements in Appendix of this presentation. Refer to Slide 31 “NI 43-101 Disclosure”.
27
KLGOLD.COM
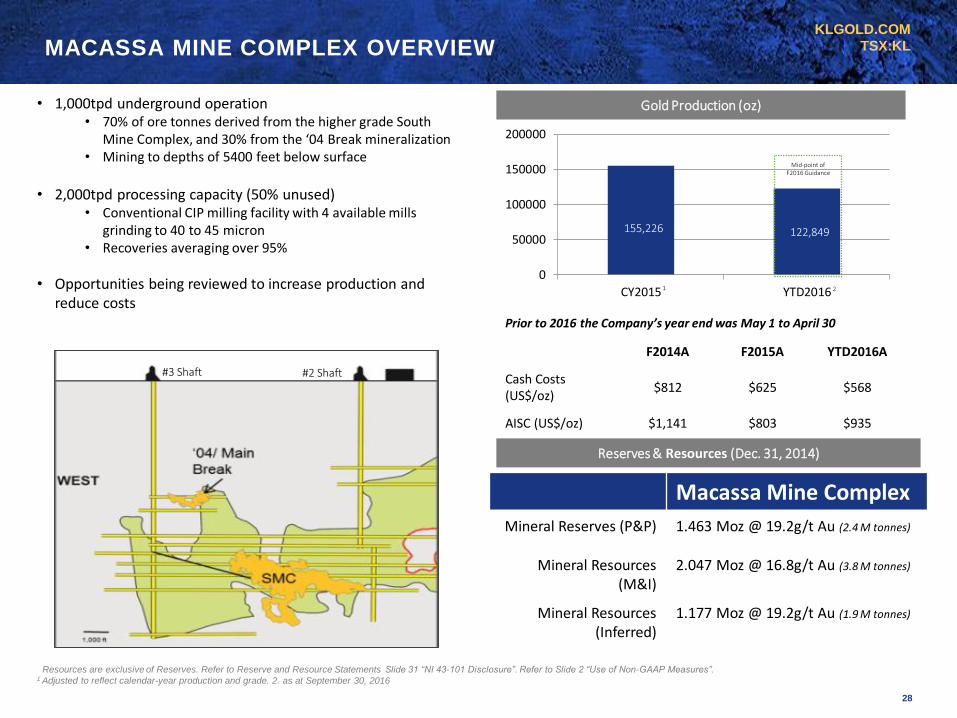
TSX:KLMACASSA MINE COMPLEX OVERVIEW
0
50000
100000
150000
200000
CY2015 YTD2016
Gold Production (oz)
Prior to 2016 the Company’s year end was May 1 to April 30
F2014A F2015A YTD2016A
Cash Costs (US$/oz)
$812 $625 $568
AISC (US$/oz) $1,141 $803 $935
• 1,000tpd underground operation • 70% of ore tonnes derived from the higher grade South
Mine Complex, and 30% from the ‘04 Break mineralization• Mining to depths of 5400 feet below surface
• 2,000tpd processing capacity (50% unused)• Conventional CIP milling facility with 4 available mills
grinding to 40 to 45 micron• Recoveries averaging over 95%
• Opportunities being reviewed to increase production and reduce costs
Resources are exclusive of Reserves. Refer to Reserve and Resource Statements Slide 31 “NI 43-101 Disclosure”. Refer to Slide 2 “Use of Non-GAAP Measures”.1 Adjusted to reflect calendar-year production and grade. 2. as at September 30, 2016
1
Reserves & Resources (Dec. 31, 2014)
Mid-point of F2016 Guidance
#3 Shaft #2 Shaft
155,226 122,849
2
Macassa Mine Complex
Mineral Reserves (P&P) 1.463 Moz @ 19.2g/t Au (2.4 M tonnes)
Mineral Resources (M&I)
2.047 Moz @ 16.8g/t Au (3.8 M tonnes)
Mineral Resources (Inferred)
1.177 Moz @ 19.2g/t Au (1.9 M tonnes)
28
KLGOLD.COM
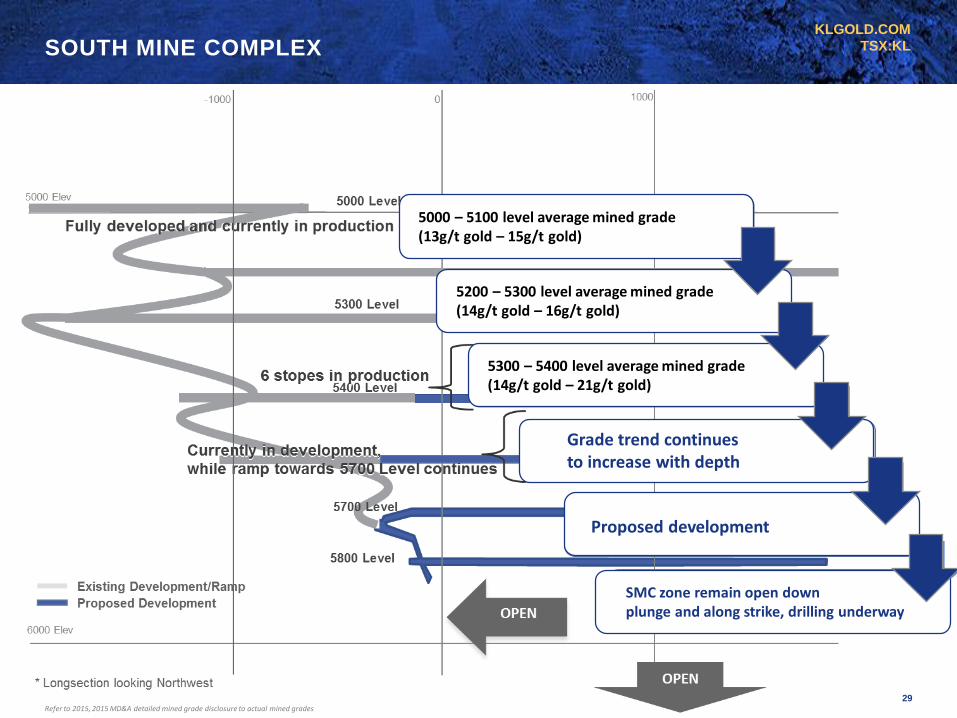
TSX:KLSOUTH MINE COMPLEX
Refer to 2015, 2015 MD&A detailed mined grade disclosure to actual mined grades29
5000 – 5100 level average mined grade (13g/t gold – 15g/t gold)
5200 – 5300 level average mined grade (14g/t gold – 16g/t gold)
5300 – 5400 level average mined grade (14g/t gold – 21g/t gold)
Grade trend continues to increase with depth
Proposed development
SMC zone remain open down plunge and along strike, drilling underway
KLGOLD.COM
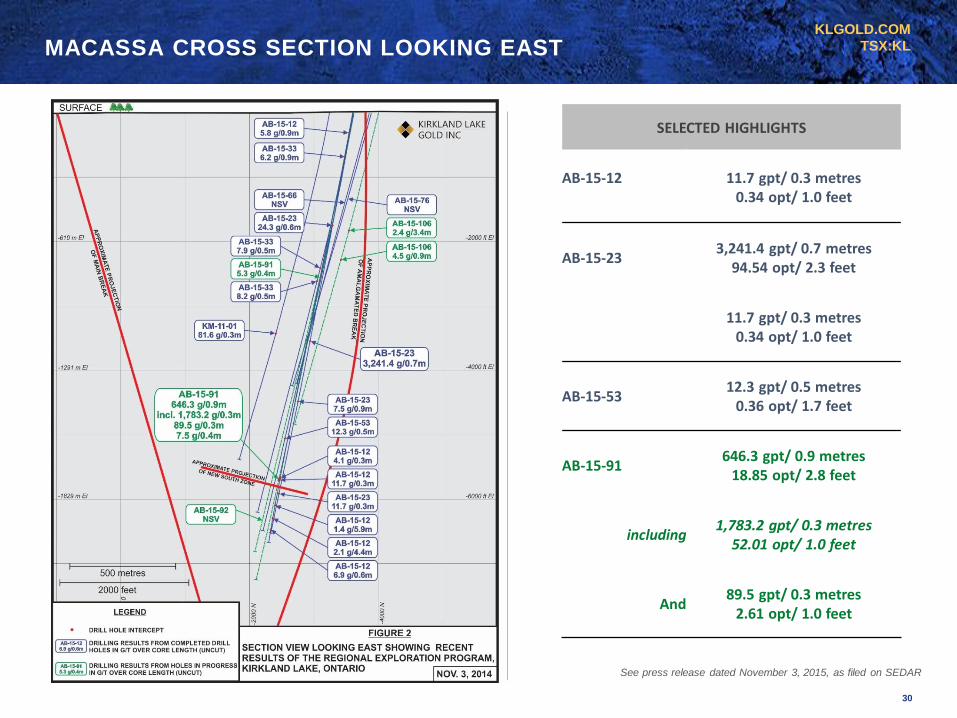
TSX:KLMACASSA CROSS SECTION LOOKING EAST
SELECTED HIGHLIGHTS
AB-15-12 11.7 gpt/ 0.3 metres0.34 opt/ 1.0 feet
AB-15-233,241.4 gpt/ 0.7 metres
94.54 opt/ 2.3 feet
11.7 gpt/ 0.3 metres0.34 opt/ 1.0 feet
AB-15-5312.3 gpt/ 0.5 metres
0.36 opt/ 1.7 feet
AB-15-91646.3 gpt/ 0.9 metres
18.85 opt/ 2.8 feet
including1,783.2 gpt/ 0.3 metres
52.01 opt/ 1.0 feet
And89.5 gpt/ 0.3 metres
2.61 opt/ 1.0 feet
See press release dated November 3, 2015, as filed on SEDAR
30
KLGOLD.COM
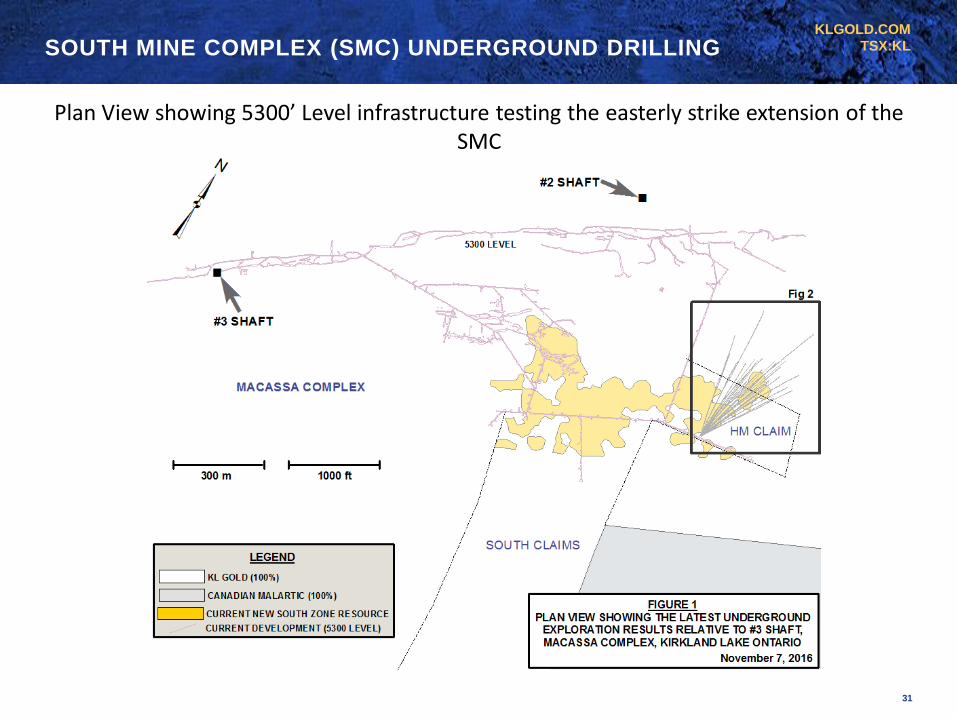
TSX:KLSOUTH MINE COMPLEX (SMC) UNDERGROUND DRILLING
Plan View showing 5300’ Level infrastructure testing the easterly strike extension of the SMC
31
KLGOLD.COM
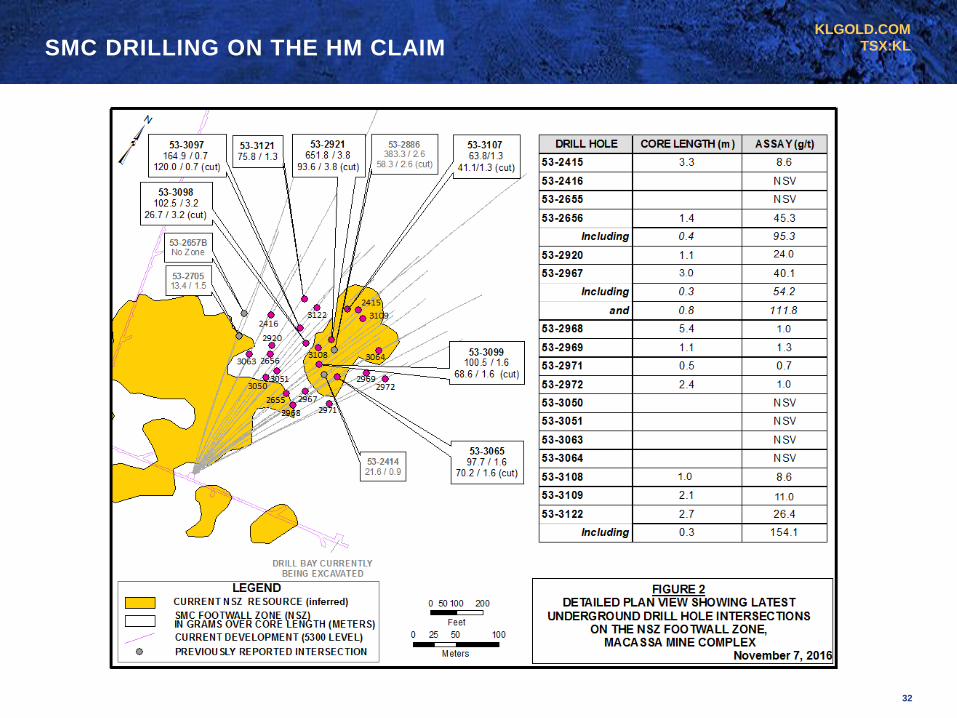
TSX:KLSMC DRILLING ON THE HM CLAIM
32
KLGOLD.COM
TSX:KL’04 MAIN BREAK UNDERGROUND DRILLING
3000’Level
Long Section View Looking North
33
KLGOLD.COM
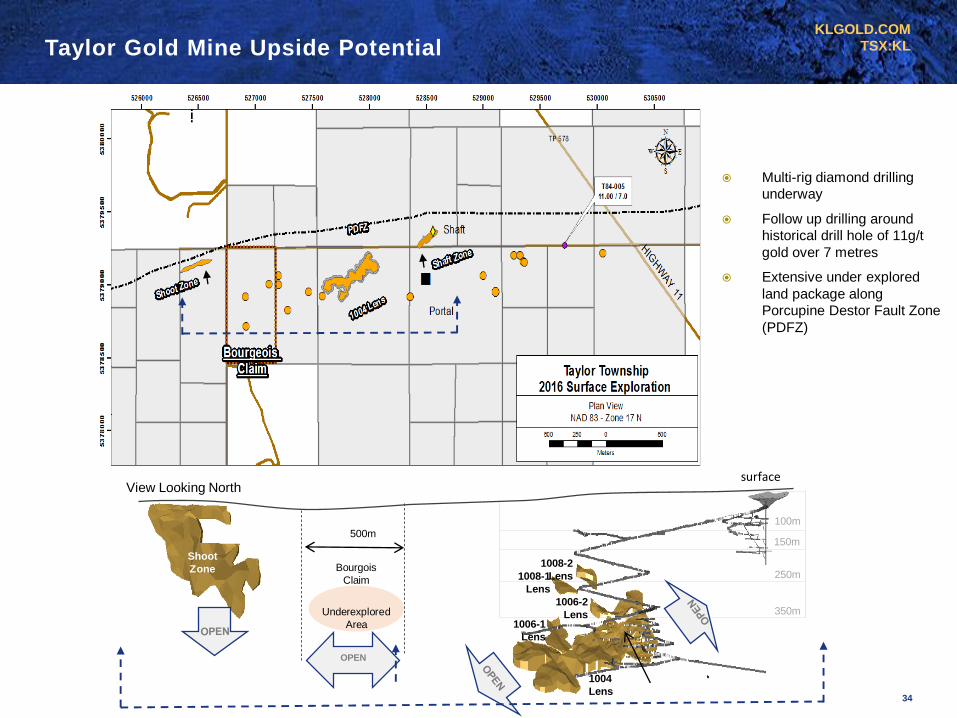
TSX:KLTaylor Gold Mine Upside Potential
150m
Bourgois
Claim
Shoot
Zone
1004
Lens
1006-1
Lens
1008-1
Lens
1008-2
Lens
100m
250m
350m 1006-2
Lens
500m
View Looking North
OPEN
Underexplored
Area
surface
7.6 g/t
6.0 g/t
7.1 g/t
1.5km1.5km
Multi-rig diamond drilling
underway
Follow up drilling around
historical drill hole of 11g/t
gold over 7 metres
Extensive under explored
land package along
Porcupine Destor Fault Zone
(PDFZ)
34
KLGOLD.COM
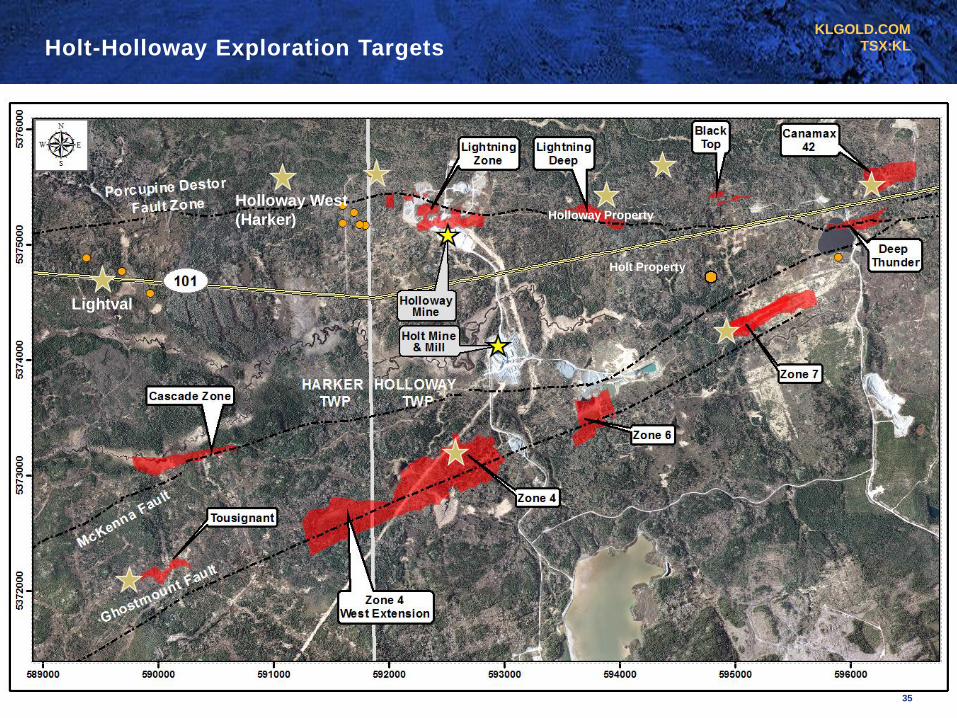
TSX:KLHolt-Holloway Exploration Targets
Holt Property
Holloway PropertyHolloway West
(Harker)
Lightval
35
KLGOLD.COM
TSX:KLHOLT MINE COMPLEX
36
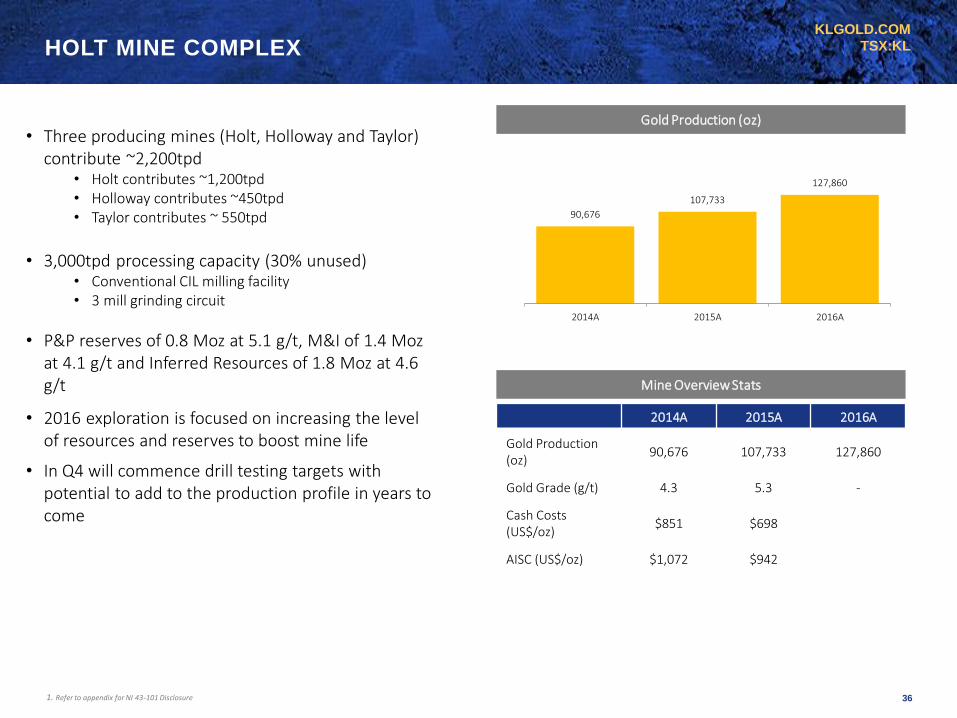
90,676
107,733
127,860
2014A 2015A 2016A
Gold Production (oz)
Mine Overview Stats
2014A 2015A 2016A
Gold Production(oz)
90,676 107,733 127,860
Gold Grade (g/t) 4.3 5.3 -
Cash Costs (US$/oz)
$851 $698
AISC (US$/oz) $1,072 $942
• Three producing mines (Holt, Holloway and Taylor) contribute ~2,200tpd
• Holt contributes ~1,200tpd• Holloway contributes ~450tpd• Taylor contributes ~ 550tpd
• 3,000tpd processing capacity (30% unused)• Conventional CIL milling facility• 3 mill grinding circuit
• P&P reserves of 0.8 Moz at 5.1 g/t, M&I of 1.4 Mozat 4.1 g/t and Inferred Resources of 1.8 Moz at 4.6 g/t
• 2016 exploration is focused on increasing the level of resources and reserves to boost mine life
• In Q4 will commence drill testing targets with potential to add to the production profile in years to come
1. Refer to appendix for NI 43-101 Disclosure
KLGOLD.COM
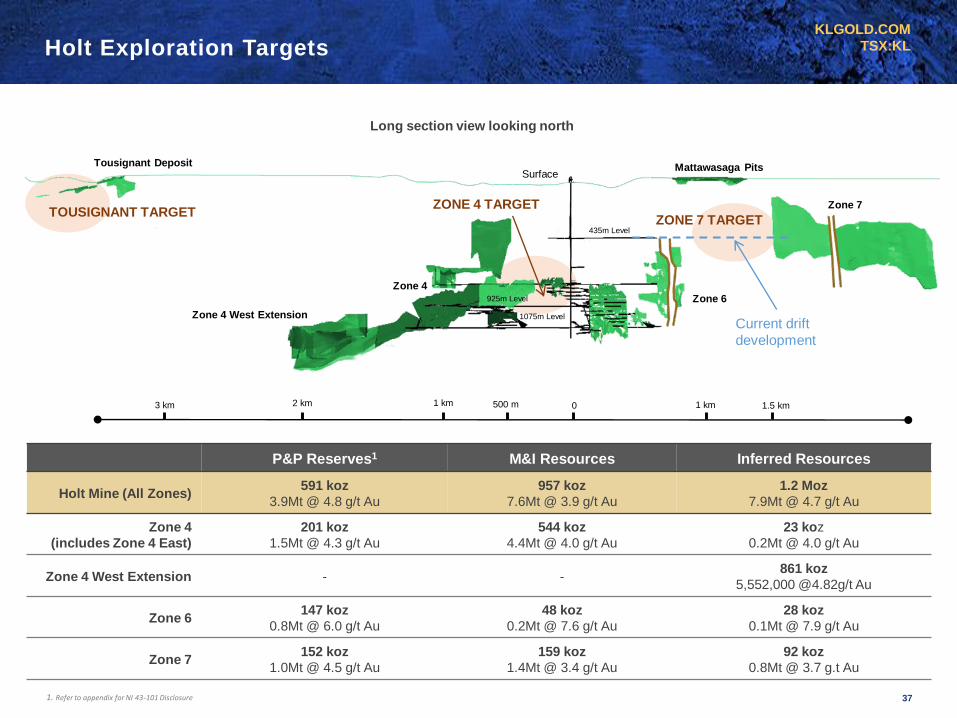
TSX:KLHolt Exploration Targets
Tousignant Deposit
Zone 6
Zone 4
Mattawasaga Pits
Zone 7
Surface
1075m Level
925m Level
435m Level
Current drift
development
Long section view looking north
Zone 4 West Extension
500 m1 km 02 km3 km 1 km 1.5 km
TOUSIGNANT TARGETZONE 7 TARGET
ZONE 4 TARGET
P&P Reserves1 M&I Resources Inferred Resources
Holt Mine (All Zones)591 koz
3.9Mt @ 4.8 g/t Au
957 koz
7.6Mt @ 3.9 g/t Au
1.2 Moz
7.9Mt @ 4.7 g/t Au
Zone 4
(includes Zone 4 East)
201 koz
1.5Mt @ 4.3 g/t Au
544 koz
4.4Mt @ 4.0 g/t Au
23 koz
0.2Mt @ 4.0 g/t Au
Zone 4 West Extension - -861 koz
5,552,000 @4.82g/t Au
Zone 6147 koz
0.8Mt @ 6.0 g/t Au
48 koz
0.2Mt @ 7.6 g/t Au
28 koz
0.1Mt @ 7.9 g/t Au
Zone 7152 koz
1.0Mt @ 4.5 g/t Au
159 koz
1.4Mt @ 3.4 g/t Au
92 koz
0.8Mt @ 3.7 g.t Au
371. Refer to appendix for NI 43-101 Disclosure
KLGOLD.COM
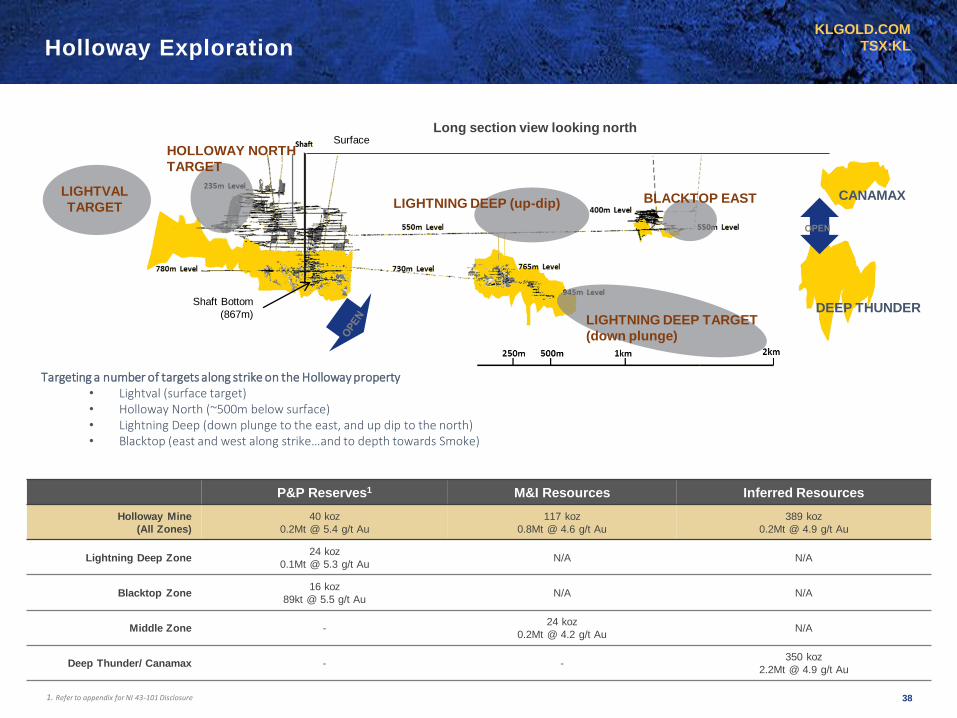
TSX:KLHolloway Exploration
Surface
Shaft Bottom
(867m)
Long section view looking north
LIGHTNING DEEP TARGET
(down plunge)
LIGHTNING DEEP (up-dip)
DEEP THUNDER
LIGHTVAL
TARGETCANAMAXBLACKTOP EAST
HOLLOWAY NORTH
TARGET
Targeting a number of targets along strike on the Holloway property• Lightval (surface target)• Holloway North (~500m below surface)• Lightning Deep (down plunge to the east, and up dip to the north)• Blacktop (east and west along strike…and to depth towards Smoke)
P&P Reserves1 M&I Resources Inferred Resources
Holloway Mine
(All Zones)
40 koz
0.2Mt @ 5.4 g/t Au
117 koz
0.8Mt @ 4.6 g/t Au
389 koz
0.2Mt @ 4.9 g/t Au
Lightning Deep Zone24 koz
0.1Mt @ 5.3 g/t AuN/A N/A
Blacktop Zone16 koz
89kt @ 5.5 g/t AuN/A N/A
Middle Zone -24 koz
0.2Mt @ 4.2 g/t AuN/A
Deep Thunder/ Canamax - -350 koz
2.2Mt @ 4.9 g/t Au
381. Refer to appendix for NI 43-101 Disclosure
KLGOLD.COM
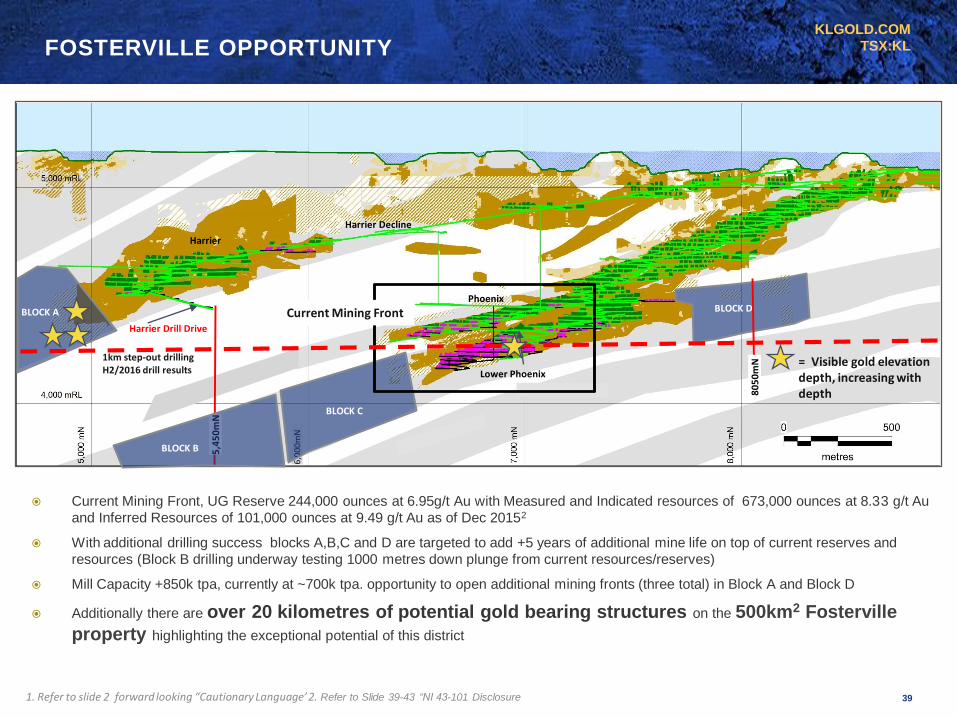
TSX:KLFOSTERVILLE OPPORTUNITY
Lower Phoenix
Phoenix
Mineral Resources, Reserves and MINING as at December 31, 2015
Harrier Decline
Harrier
6,0
00
mN
Harrier Drill Drive
1km step-out drillingH2/2016 drill results
5,4
50
mN
Current Mining Front, UG Reserve 244,000 ounces at 6.95g/t Au with Measured and Indicated resources of 673,000 ounces at 8.33 g/t Au
and Inferred Resources of 101,000 ounces at 9.49 g/t Au as of Dec 20152
With additional drilling success blocks A,B,C and D are targeted to add +5 years of additional mine life on top of current reserves and
resources (Block B drilling underway testing 1000 metres down plunge from current resources/reserves)
Mill Capacity +850k tpa, currently at ~700k tpa. opportunity to open additional mining fronts (three total) in Block A and Block D
Additionally there are over 20 kilometres of potential gold bearing structures on the 500km2 Fosterville
property highlighting the exceptional potential of this district
= Visible gold elevation depth, increasing with depth
Current Mining Front
80
50
mN
1. Refer to slide 2 forward looking “Cautionary Language’ 2. Refer to Slide 39-43 “NI 43-101 Disclosure
BLOCK A
BLOCK C
BLOCK D
BLOCK B
39
KLGOLD.COM
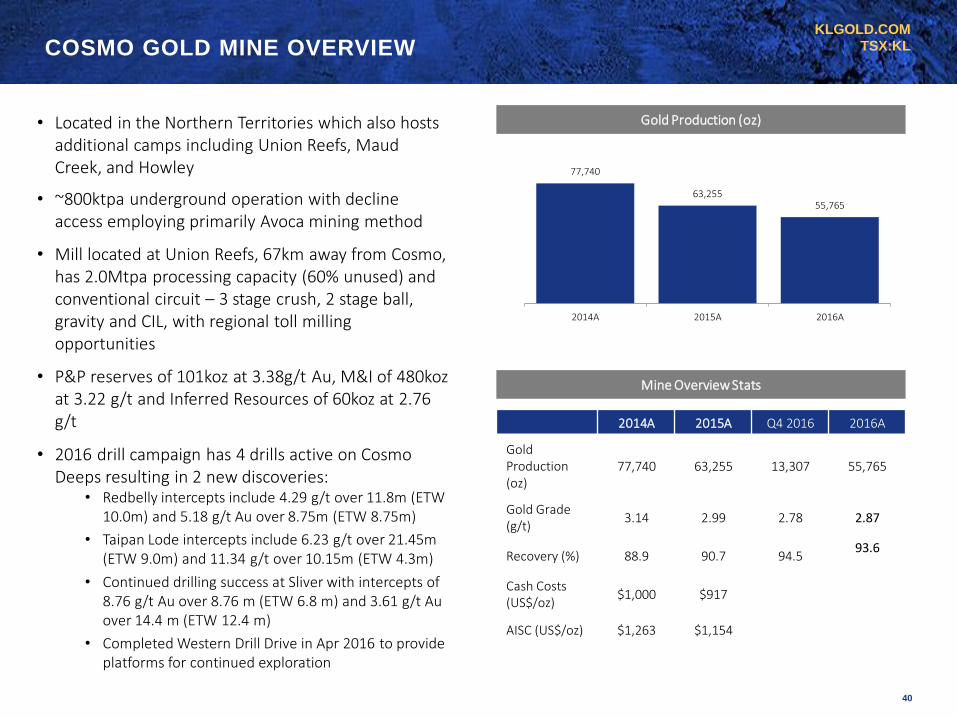
TSX:KLCOSMO GOLD MINE OVERVIEW
40
77,740
63,255 55,765
2014A 2015A 2016A
Gold Production (oz)
Mine Overview Stats
2014A 2015A Q4 2016 2016A
Gold Production(oz)
77,740 63,255 13,307 55,765
Gold Grade (g/t)
3.14 2.99 2.78 2.87
Recovery (%) 88.9 90.7 94.593.6
Cash Costs (US$/oz)
$1,000 $917
AISC (US$/oz) $1,263 $1,154
• Located in the Northern Territories which also hosts additional camps including Union Reefs, Maud Creek, and Howley
• ~800ktpa underground operation with decline access employing primarily Avoca mining method
• Mill located at Union Reefs, 67km away from Cosmo, has 2.0Mtpa processing capacity (60% unused) and conventional circuit – 3 stage crush, 2 stage ball, gravity and CIL, with regional toll milling opportunities
• P&P reserves of 101koz at 3.38g/t Au, M&I of 480koz at 3.22 g/t and Inferred Resources of 60koz at 2.76 g/t
• 2016 drill campaign has 4 drills active on Cosmo Deeps resulting in 2 new discoveries:
• Redbelly intercepts include 4.29 g/t over 11.8m (ETW 10.0m) and 5.18 g/t Au over 8.75m (ETW 8.75m)
• Taipan Lode intercepts include 6.23 g/t over 21.45m (ETW 9.0m) and 11.34 g/t over 10.15m (ETW 4.3m)
• Continued drilling success at Sliver with intercepts of 8.76 g/t Au over 8.76 m (ETW 6.8 m) and 3.61 g/t Au over 14.4 m (ETW 12.4 m)
• Completed Western Drill Drive in Apr 2016 to provide platforms for continued exploration
KLGOLD.COM
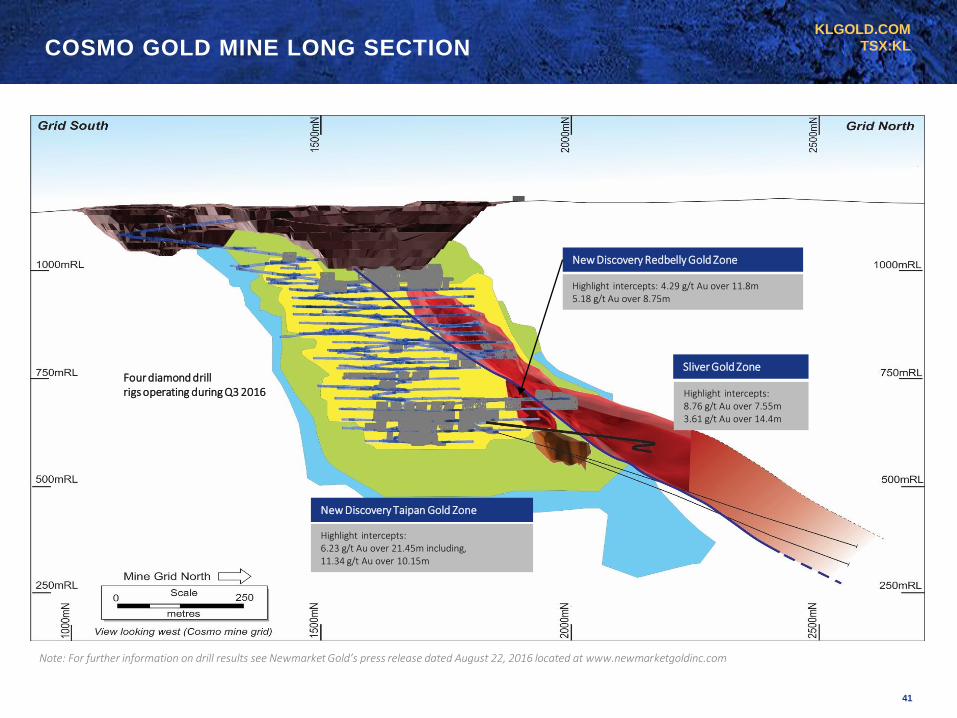
TSX:KLCOSMO GOLD MINE LONG SECTION
41
Note: For further information on drill results see Newmarket Gold’s press release dated August 22, 2016 located at www.newmarketgoldinc.com
New Discovery Redbelly Gold Zone
New Discovery Taipan Gold Zone
Sliver Gold Zone
Highlight intercepts:8.76 g/t Au over 7.55m3.61 g/t Au over 14.4m
Highlight intercepts: 4.29 g/t Au over 11.8m5.18 g/t Au over 8.75m
Highlight intercepts:6.23 g/t Au over 21.45m including,11.34 g/t Au over 10.15m
Four diamond drill rigs operating during Q3 2016
KLGOLD.COM
TSX:KLMAUD CREEK PROJECT OVERVIEW
42
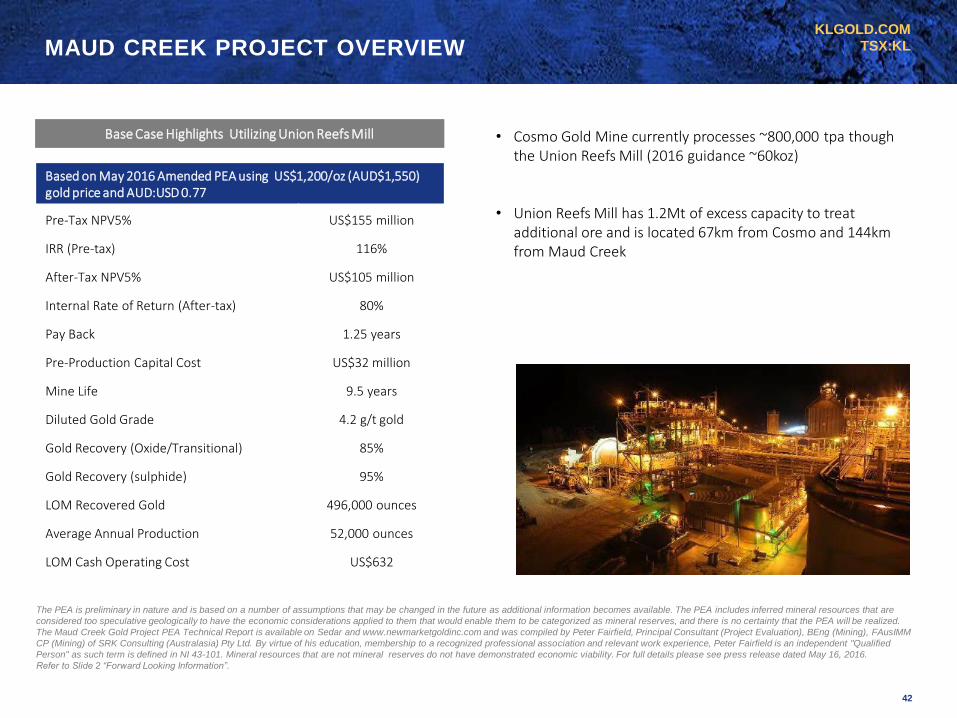
Base Case Highlights Utilizing Union Reefs Mill
Based on May 2016 Amended PEA using US$1,200/oz (AUD$1,550) gold price and AUD:USD 0.77
Pre-Tax NPV5% US$155 million
IRR (Pre-tax) 116%
After-Tax NPV5% US$105 million
Internal Rate of Return (After-tax) 80%
Pay Back 1.25 years
Pre-Production Capital Cost US$32 million
Mine Life 9.5 years
Diluted Gold Grade 4.2 g/t gold
Gold Recovery (Oxide/Transitional) 85%
Gold Recovery (sulphide) 95%
LOM Recovered Gold 496,000 ounces
Average Annual Production 52,000 ounces
LOM Cash Operating Cost US$632
• Cosmo Gold Mine currently processes ~800,000 tpa though the Union Reefs Mill (2016 guidance ~60koz)
• Union Reefs Mill has 1.2Mt of excess capacity to treat additional ore and is located 67km from Cosmo and 144km from Maud Creek
The PEA is preliminary in nature and is based on a number of assumptions that may be changed in the future as additional information becomes available. The PEA includes inferred mineral resources that are
considered too speculative geologically to have the economic considerations applied to them that would enable them to be categorized as mineral reserves, and there is no certainty that the PEA will be realized.
The Maud Creek Gold Project PEA Technical Report is available on Sedar and www.newmarketgoldinc.com and was compiled by Peter Fairfield, Principal Consultant (Project Evaluation), BEng (Mining), FAusIMM
CP (Mining) of SRK Consulting (Australasia) Pty Ltd. By virtue of his education, membership to a recognized professional association and relevant work experience, Peter Fairfield is an independent "Qualified
Person" as such term is defined in NI 43-101. Mineral resources that are not mineral reserves do not have demonstrated economic viability. For full details please see press release dated May 16, 2016.
Refer to Slide 2 “Forward Looking Information”.
KLGOLD.COM
TSX:KLSTAWELL GOLD MINE
43
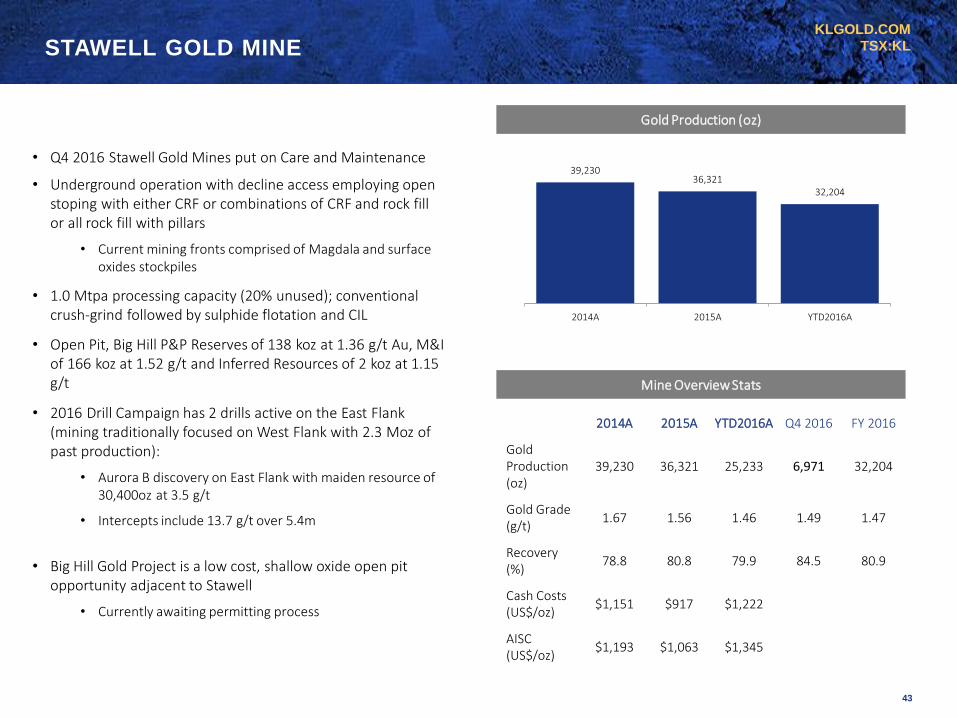
39,230 36,321
32,204
2014A 2015A YTD2016A
Gold Production (oz)
Mine Overview Stats
2014A 2015A YTD2016A Q4 2016 FY 2016
Gold Production(oz)
39,230 36,321 25,233 6,971 32,204
Gold Grade (g/t)
1.67 1.56 1.46 1.49 1.47
Recovery (%)
78.8 80.8 79.9 84.5 80.9
Cash Costs (US$/oz)
$1,151 $917 $1,222
AISC (US$/oz)
$1,193 $1,063 $1,345
• Q4 2016 Stawell Gold Mines put on Care and Maintenance
• Underground operation with decline access employing open stoping with either CRF or combinations of CRF and rock fill or all rock fill with pillars
• Current mining fronts comprised of Magdala and surface oxides stockpiles
• 1.0 Mtpa processing capacity (20% unused); conventional crush-grind followed by sulphide flotation and CIL
• Open Pit, Big Hill P&P Reserves of 138 koz at 1.36 g/t Au, M&I of 166 koz at 1.52 g/t and Inferred Resources of 2 koz at 1.15 g/t
• 2016 Drill Campaign has 2 drills active on the East Flank (mining traditionally focused on West Flank with 2.3 Moz of past production):
• Aurora B discovery on East Flank with maiden resource of 30,400oz at 3.5 g/t
• Intercepts include 13.7 g/t over 5.4m
• Big Hill Gold Project is a low cost, shallow oxide open pit opportunity adjacent to Stawell
• Currently awaiting permitting process
KLGOLD.COM
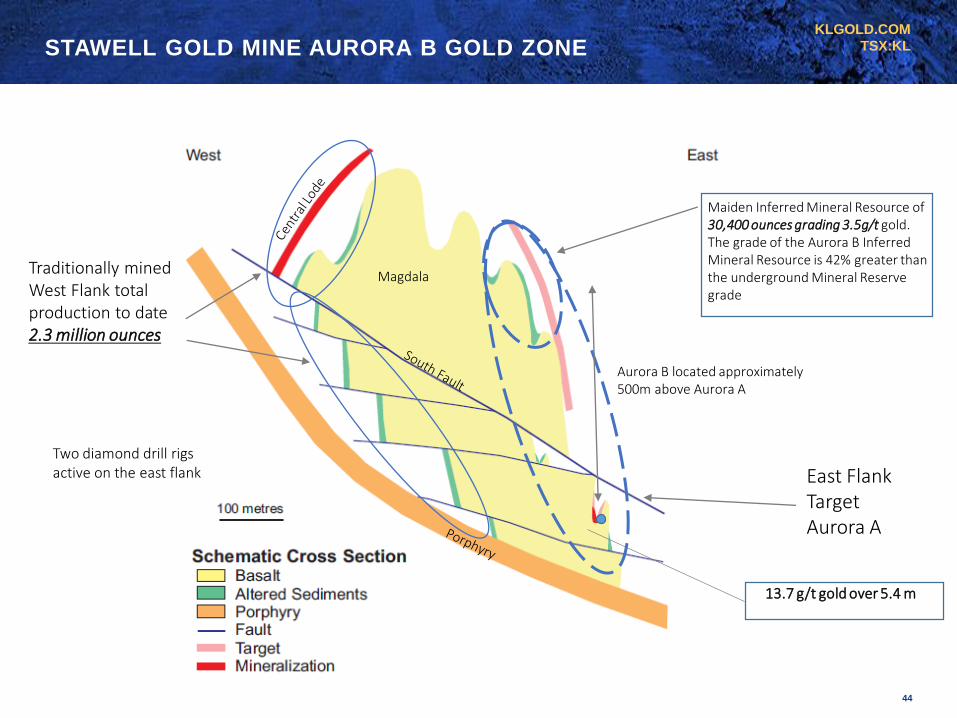
TSX:KLSTAWELL GOLD MINE AURORA B GOLD ZONE
44
Maiden Inferred Mineral Resource of 30,400 ounces grading 3.5g/t gold. The grade of the Aurora B Inferred Mineral Resource is 42% greater than the underground Mineral Reserve grade
East Flank TargetAurora A
Traditionally mined West Flank total production to date 2.3 million ounces
Magdala
13.7 g/t gold over 5.4 m
Aurora B located approximately 500m above Aurora A
Two diamond drill rigs active on the east flank
KLGOLD.COM
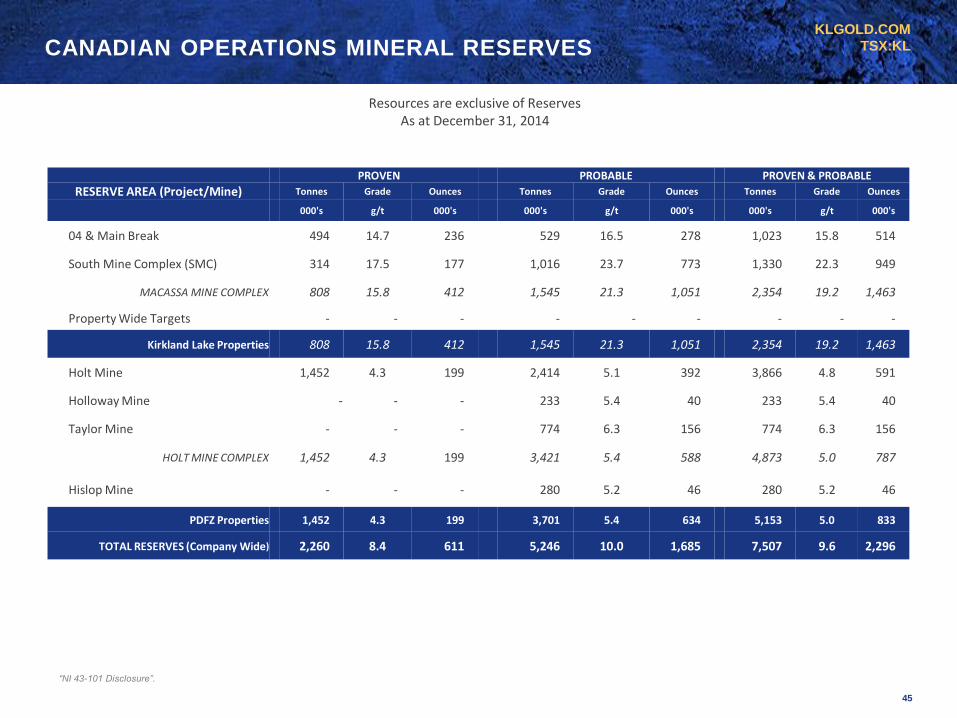
TSX:KLCANADIAN OPERATIONS MINERAL RESERVES
PROVEN PROBABLE PROVEN & PROBABLE
RESERVE AREA (Project/Mine) Tonnes Grade Ounces Tonnes Grade Ounces Tonnes Grade Ounces
000's g/t 000's 000's g/t 000's 000's g/t 000's
04 & Main Break 494 14.7 236 529 16.5 278 1,023 15.8 514
South Mine Complex (SMC) 314 17.5 177 1,016 23.7 773 1,330 22.3 949
MACASSA MINE COMPLEX 808 15.8 412 1,545 21.3 1,051 2,354 19.2 1,463
Property Wide Targets - - - - - - - - -
Kirkland Lake Properties 808 15.8 412 1,545 21.3 1,051 2,354 19.2 1,463
Holt Mine 1,452 4.3 199 2,414 5.1 392 3,866 4.8 591
Holloway Mine - - - 233 5.4 40 233 5.4 40
Taylor Mine - - - 774 6.3 156 774 6.3 156
HOLT MINE COMPLEX 1,452 4.3 199 3,421 5.4 588 4,873 5.0 787
Hislop Mine - - - 280 5.2 46 280 5.2 46
PDFZ Properties 1,452 4.3 199 3,701 5.4 634 5,153 5.0 833
TOTAL RESERVES (Company Wide) 2,260 8.4 611 5,246 10.0 1,685 7,507 9.6 2,296
“NI 43-101 Disclosure”.
Resources are exclusive of ReservesAs at December 31, 2014
45
KLGOLD.COM
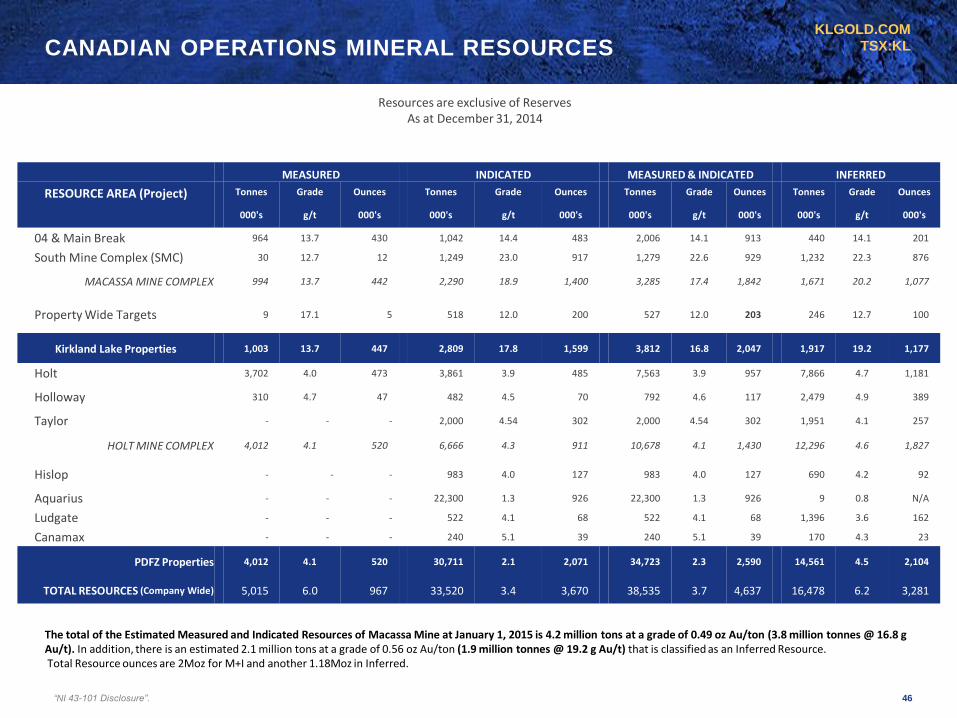
TSX:KLCANADIAN OPERATIONS MINERAL RESOURCES
MEASURED INDICATED MEASURED & INDICATED INFERRED
RESOURCE AREA (Project) Tonnes Grade Ounces Tonnes Grade Ounces Tonnes Grade Ounces Tonnes Grade Ounces
000's g/t 000's 000's g/t 000's 000's g/t 000's 000's g/t 000's
04 & Main Break 964 13.7 430 1,042 14.4 483 2,006 14.1 913 440 14.1 201
South Mine Complex (SMC) 30 12.7 12 1,249 23.0 917 1,279 22.6 929 1,232 22.3 876
MACASSA MINE COMPLEX 994 13.7 442 2,290 18.9 1,400 3,285 17.4 1,842 1,671 20.2 1,077
Property Wide Targets 9 17.1 5 518 12.0 200 527 12.0 203 246 12.7 100
Kirkland Lake Properties 1,003 13.7 447 2,809 17.8 1,599 3,812 16.8 2,047 1,917 19.2 1,177
Holt 3,702 4.0 473 3,861 3.9 485 7,563 3.9 957 7,866 4.7 1,181
Holloway 310 4.7 47 482 4.5 70 792 4.6 117 2,479 4.9 389
Taylor - - - 2,000 4.54 302 2,000 4.54 302 1,951 4.1 257
HOLT MINE COMPLEX 4,012 4.1 520 6,666 4.3 911 10,678 4.1 1,430 12,296 4.6 1,827
Hislop - - - 983 4.0 127 983 4.0 127 690 4.2 92
Aquarius - - - 22,300 1.3 926 22,300 1.3 926 9 0.8 N/A
Ludgate - - - 522 4.1 68 522 4.1 68 1,396 3.6 162
Canamax - - - 240 5.1 39 240 5.1 39 170 4.3 23
PDFZ Properties 4,012 4.1 520 30,711 2.1 2,071 34,723 2.3 2,590 14,561 4.5 2,104
TOTAL RESOURCES (Company Wide) 5,015 6.0 967 33,520 3.4 3,670 38,535 3.7 4,637 16,478 6.2 3,281
Resources are exclusive of ReservesAs at December 31, 2014
“NI 43-101 Disclosure”. 46
The total of the Estimated Measured and Indicated Resources of Macassa Mine at January 1, 2015 is 4.2 million tons at a grade of 0.49 oz Au/ton (3.8 million tonnes @ 16.8 g Au/t). In addition, there is an estimated 2.1 million tons at a grade of 0.56 oz Au/ton (1.9 million tonnes @ 19.2 g Au/t) that is classified as an Inferred Resource.Total Resource ounces are 2Moz for M+I and another 1.18Moz in Inferred.
KLGOLD.COM
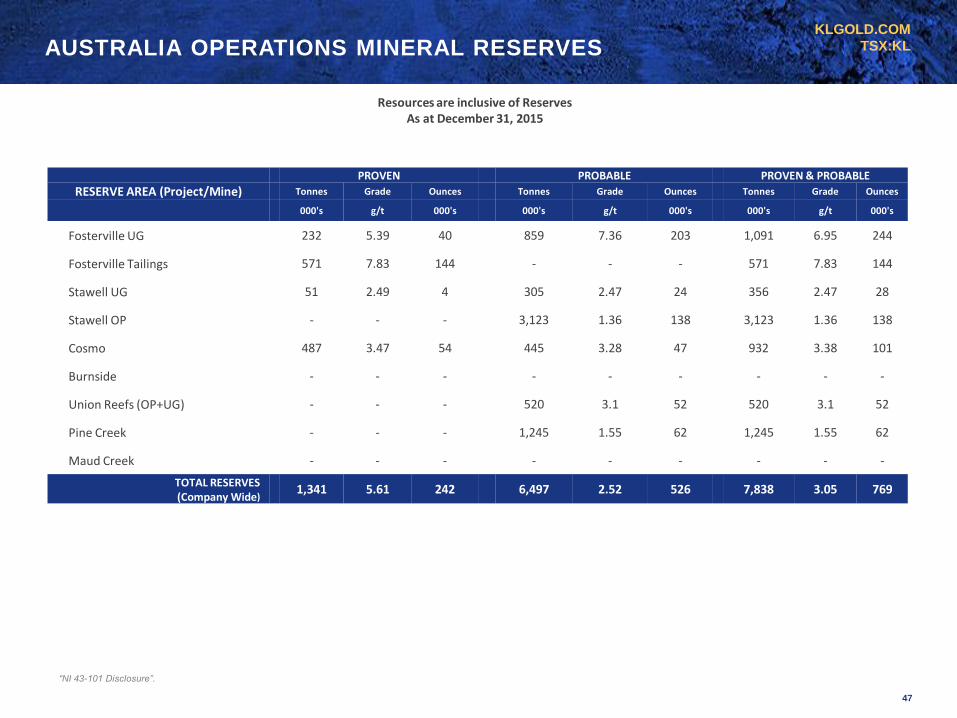
TSX:KLAUSTRALIA OPERATIONS MINERAL RESERVES
PROVEN PROBABLE PROVEN & PROBABLE
RESERVE AREA (Project/Mine) Tonnes Grade Ounces Tonnes Grade Ounces Tonnes Grade Ounces
000's g/t 000's 000's g/t 000's 000's g/t 000's
Fosterville UG 232 5.39 40 859 7.36 203 1,091 6.95 244
Fosterville Tailings 571 7.83 144 - - - 571 7.83 144
Stawell UG 51 2.49 4 305 2.47 24 356 2.47 28
Stawell OP - - - 3,123 1.36 138 3,123 1.36 138
Cosmo 487 3.47 54 445 3.28 47 932 3.38 101
Burnside - - - - - - - - -
Union Reefs (OP+UG) - - - 520 3.1 52 520 3.1 52
Pine Creek - - - 1,245 1.55 62 1,245 1.55 62
Maud Creek - - - - - - - - -
TOTAL RESERVES(Company Wide)
1,341 5.61 242 6,497 2.52 526 7,838 3.05 769
Resources are inclusive of ReservesAs at December 31, 2015
“NI 43-101 Disclosure”.
47
KLGOLD.COM
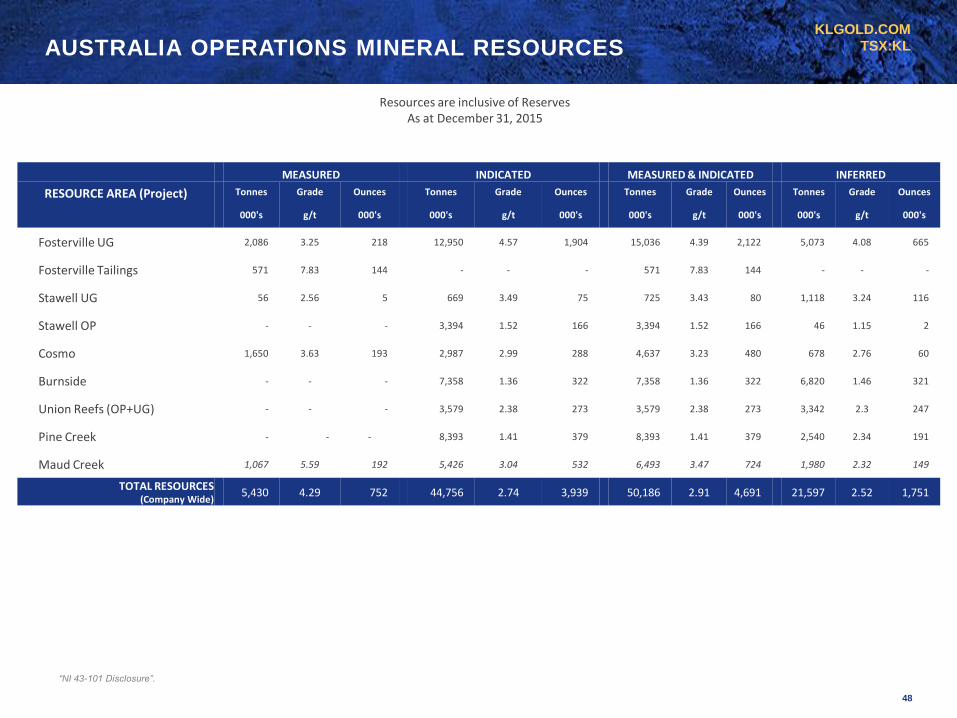
TSX:KLAUSTRALIA OPERATIONS MINERAL RESOURCES
MEASURED INDICATED MEASURED & INDICATED INFERRED
RESOURCE AREA (Project) Tonnes Grade Ounces Tonnes Grade Ounces Tonnes Grade Ounces Tonnes Grade Ounces
000's g/t 000's 000's g/t 000's 000's g/t 000's 000's g/t 000's
Fosterville UG 2,086 3.25 218 12,950 4.57 1,904 15,036 4.39 2,122 5,073 4.08 665
Fosterville Tailings 571 7.83 144 - - - 571 7.83 144 - - -
Stawell UG 56 2.56 5 669 3.49 75 725 3.43 80 1,118 3.24 116
Stawell OP - - - 3,394 1.52 166 3,394 1.52 166 46 1.15 2
Cosmo 1,650 3.63 193 2,987 2.99 288 4,637 3.23 480 678 2.76 60
Burnside - - - 7,358 1.36 322 7,358 1.36 322 6,820 1.46 321
Union Reefs (OP+UG) - - - 3,579 2.38 273 3,579 2.38 273 3,342 2.3 247
Pine Creek - - - 8,393 1.41 379 8,393 1.41 379 2,540 2.34 191
Maud Creek 1,067 5.59 192 5,426 3.04 532 6,493 3.47 724 1,980 2.32 149
TOTAL RESOURCES (Company Wide)
5,430 4.29 752 44,756 2.74 3,939 50,186 2.91 4,691 21,597 2.52 1,751
Resources are inclusive of ReservesAs at December 31, 2015
“NI 43-101 Disclosure”.
48
KLGOLD.COM
TSX:KLNI 43-101 DISCLOSURE
Kirkland Lake Gold Qualified Person and QA/QC
All production information and other scientific and technical information in this presentation with respect to Kirkland Lake Gold and its assets were prepared in accordance with the standards of the Canadian Institute of Mining, Metallurgy and Petroleum and National Instrument 43-101 – Standards of Disclosure for Mineral Projects (“NI 43-101”) and were prepared, reviewed, verified and compiled by Kirkland Lake Gold’s mining staff under the supervision of, Pierre Rocque P. Eng., Kirkland Lake Gold’s Vice President of Mining
The exploration programs across Kirkland Lake Gold’s land holdings in Kirkland Lake were prepared, reviewed, verified and compiled by Kirkland Lake Gold’s geological staff under the supervision of Doug Cater, P.Geo., the Company’s Vice President of Exploration. All reserve and resource estimates for the Kirkland Lake Properties have been audited and verified, and the technical disclosure has been approved, by Kirkland Lake Gold’s independent reserve and resource engineer, Glenn R. Clark, P. Eng., of Glenn R. Clark & Associates Limited. Mr. Clark is a ‘qualified person’ under NI 43-101. The QP’s for the mineral reserves and resources outlined under the PDFZ Properties are Doug Cater, P. Geo, and,Pierre Rocque P. Eng., the Vice President of Exploration and the Vice President of mine engineering respectively, and not considered independent under NI 43-101.
Sample preparation, analytical techniques, laboratories used and quality assurance-quality control protocols used during the exploration drilling programs are done consistent with industry standards and independent certified assay labs.
REFER TO KIRKLAND LAKE GOLD ANNUAL INFORMATION FORM DATED MARCH 10, 2016, AND ST ANDREW GOLDFIELDS LTD. ANNUAL INFORMATION FORM DATED MARCH 27, 2015, AVAILABLE ON SEDAR (www.sedar.com) FOR COMPLETE NI 43-101 NOTES AND DISCLOSURE PERTAINING TO THE RESOURCE AND RESERVE STATEMENTS QUOTED HEREIN.
Newmarket Qualified Person and QA/QC
All production information and other scientific and technical information in this presentation with respect to Newmarket and its assets were prepared in accordance with the standards of the Canadian Institute of Mining, Metallurgy and Petroleum and NI 43-101 and were prepared, reviewed, verified and compiled by Newmarket’s mining staff under the supervision of Mark Edwards, MAusIMM (CP), MAIG and Newmarket’s General Manager, Exploration, who is the qualified person for the purpose of NI 43-101.
Simon Hitchman, FAusIMM (CP), MAIG, Exploration Manager, Newmarket Gold, is a "qualified person" as such term is defined in National Instrument 43-101 and has reviewed and approved the technical information and data included in this Investor Presentation.
Troy Fuller, MAIG, Geology Manager, Fosterville Gold Mine, Newmarket Gold, is a "qualified person" as such term is defined in National Instrument 43-101 and has reviewed and approved the technical information and data included in this presentation.
Sample preparation, analytical techniques, laboratories used and quality assurance-quality control protocols used during the exploration drilling programs are done consistent with industry standards and independent certified assay labs.
REFER TO NEWMARKET’S ANNUAL INFORMATION FORM DATED MARCH 21, 2016, AVAILABLE ON SEDAR (www.sedar.com) FOR COMPLETE NI 43-101 NOTES AND DISCLOSURE PERTAINING TO THE RESOURCE AND RESERVE STATEMENTS QUOTED HEREIN.
49
KLGOLD.COM
TSX: KL
TONY MAKUCHPresident & Chief Executive OfficerJanuary 2017
200 Bay Street, Suite 3120
RBC Plaza - South Tower
Toronto ON M5J 2J1
Main Telephone: 416-840-7884
Ryan King, Vice President Investor Relations
D:778 372 5611
50