king s research portal · 10.1128/mcb.00236-16 ... 101 staining for the ... 133 migration of the...
TRANSCRIPT

King’s Research Portal
DOI:10.1128/MCB.00236-16
Document VersionPeer reviewed version
Link to publication record in King's Research Portal
Citation for published version (APA):Guentsch, A., Beneke, A., Swain, L., Farhat, K., Nagarajan, S., Wielockx, B., ... Katschinski, D. M. (2017). PHD2is a regulator for glycolytic reprogramming in macrophages. Molecular and Cellular Biology, 37(1), [e00236-16].DOI: 10.1128/MCB.00236-16
Citing this paperPlease note that where the full-text provided on King's Research Portal is the Author Accepted Manuscript or Post-Print version this maydiffer from the final Published version. If citing, it is advised that you check and use the publisher's definitive version for pagination,volume/issue, and date of publication details. And where the final published version is provided on the Research Portal, if citing you areagain advised to check the publisher's website for any subsequent corrections.
General rightsCopyright and moral rights for the publications made accessible in the Research Portal are retained by the authors and/or other copyrightowners and it is a condition of accessing publications that users recognize and abide by the legal requirements associated with these rights.
•Users may download and print one copy of any publication from the Research Portal for the purpose of private study or research.•You may not further distribute the material or use it for any profit-making activity or commercial gain•You may freely distribute the URL identifying the publication in the Research Portal
Take down policyIf you believe that this document breaches copyright please contact [email protected] providing details, and we will remove access tothe work immediately and investigate your claim.
Download date: 27. Jul. 2018

1
PHD2 is a regulator for glycolytic reprogramming in macrophages 1
Annemarie Guentsch a, Angelika Beneke a, Lija Swain a, Katja Farhat a, Shunmugam 2
Nagarajan a, Ben Wielockx b, Kaamini Raithatha c, Jan Dudek d, Peter Rehling d, Anke 3
Zieseniss a, Aline Jatho a, Mei Chong e, Celio XC Santos e, Ajay M Shah e, Dörthe M 4
Katschinski a 5
a Institute for Cardiovascular Physiology, Georg August University Göttingen, Göttingen, 6
Germany. 7
b Department of Clinical Pathobiochemistry, Institute of Clinical Chemistry and Laboratory 8
Medicine, Technical University Dresden, Dresden, Germany. 9
c Microarray and Deep-Sequencing Core Facility, University Medical Center Göttingen, 10
Göttingen, Germany. 11
d Institute for Cellular Biochemistry, Georg August University Göttingen, Göttingen, 12
Germany. 13
e Department of Cardiology, King's College London British Heart Foundation Centre, 14
London, United Kingdom. 15
Running title 16
PHD2, metabolism and macrophages 17
Correspondence to 18
Dörthe M. Katschinski, Institute of Cardiovascular Physiology, University Medical Centre 19
Göttingen, Humboldtallee 23, 37073 Göttingen, Germany, Telephone: 0049 551 39 9778, 20
FAX: 0049 551 39 5895, e-mail: [email protected] 21
Characters excluding spaces (Abstract, introduction, results, discussion, figure legends): 22
35.443 23
Word count (Abstract): 176 24
Number of references: 37 25
2
Abstract 26
The prolyl-4-hydroxylase domain (PHD) enzymes are regarded as the molecular oxygen 27
sensors. There is an interplay between oxygen availability and cellular metabolism, which in 28
turn has significant effects on the functionality of innate immune cells like macrophages. If 29
and how PHDs affect macrophage metabolism however is enigmatic. We hypothesized that 30
via manipulation of PHD2 macrophage metabolism and function can be controlled. We 31
characterized the metabolic phenotype of PHD2-deficient RAW cells and primary PHD2 32
knock out bone marrow derived macrophages (BMDM). Both showed typical features of 33
anaerobic glycolysis, which were paralleled by increased pyruvate dehydrogenase kinase 34
(PDK)1 protein levels and a decreased pyruvate dehydrogenase enzyme activity. Metabolic 35
alterations were associated to an impaired cellular functionality. Inhibition of PDK1 or knock 36
out of the Hypoxia inducible factor (HIF)-1α reversed the metabolic phenotype and impaired 37
functionality of the PHD2-deficient RAW cells and BMDM. Taken together we identified a 38
critical role of PHD2 for a reversible glycolytic reprogramming in macrophages with a direct 39
impact on their function. We suggest that PHD2 serves as an adjustable switch to control 40
macrophage behavior. 41

3
Introduction 42
Macrophages are an essential component of innate immunity and well recognized to play a 43
critical role in inflammation, tumor progression and tissue repair for example after an 44
ischemic insult (1). In aerobic conditions the oxidative breakdown of pyruvate within the 45
mitochondria is the prevalent source of energy in most cells. Upon a decrease in oxygen 46
availability cells shift the metabolism towards anaerobic glycolysis. In line, macrophages can 47
use aerobic or anaerobic glycolysis for energy production depending on the context. There is 48
growing understanding that macrophage function can be altered by cellular metabolism (2). 49
One of the key factors at the transcriptional level in switching aerobic to anaerobic 50
metabolism is the hypoxia-inducible factor (HIF). HIF comprises two subunits, i.e. the 51
constitutively regulated HIFβ subunit and one of three oxygen-regulated HIFα subunits (HIF-52
1α, HIF-2α or HIF-3α) (3). The protein stability of HIFα is regulated by the three prolyl-4-53
hydroxylase domain (PHD) enzymes PHD1, 2 and 3, which hydroxylate HIFα in an oxygen-54
dependent manner (for review (4,5)). The hydroxylated product is recognized by the pVHL 55
protein, which results in ubiquitination and proteasomal degradation of the α-subunit. In 56
hypoxia the hydroxylation and degradation is inhibited and thus HIFα is stabilized, which 57
finally results in HIF-dependent transcriptional activation of a repertoire of target genes. 58
Besides many others, glycolytic enzymes and the pyruvate dehydrogenase kinase 1 (PDK1) 59
belong to the target genes (6,7). Both determine the glycolytic cellular program. PHD 60
enzymes are of interest for the ongoing development of small molecule inhibitors, which 61
would allow stimulating HIF-dependent gene expression in normoxia (8). 62
PHD1-3 have common but also non redundant functions (9). In case of innate immunity the 63
role of PHD3 has been analyzed in detail (10-12). The role of PHD2 however is less 64
understood. Especially, if and how PHD2 affects macrophage metabolism has not been 65
described before. We therefore analyzed the consequences of a knock out of PHD2 in bone 66
marrow derived macrophages (BMDM) isolated from LysM Cre+/- x Phd2fl/fl (named 67

4
conditional knock out, PHD2 cKO in the following text) mice and the monocyte/macrophage 68
cell line RAW264 for their cell metabolism and function. 69
70

5
Materials and Methods 71
Chemicals 72
The oxoglutarate analogue dimethyloxalylglycine (DMOG, Enzo) and the PDK inhibitor 73
dichloroacetate (DCA, Sigma) were used in final concentrations of 1 mM and 5 mM, 74
respectively. LPS (Enzo Life Sciences, Lörrach, Germany), IFN and IL-4 (Peprotech, 75
Hamburg, Germany) were applied in a concentration of 100 ng/mL, 20 nM and 20 nM, 76
respectively or as indicated. 77
78
Myeloid-specific conditional knock out mice 79
All animals in this study were backcrossed to C57BL/6 mice at least five times. Phd2flox/flox x 80
LysMcre+/- mice were crossed with Phd2flox/flox mice to obtain PHD2 cKO (Phd2flox/flox x 81
LysMcre+/-) mice and littermate control wild type mice (Phd2flox/flox). Generation of 82
Phd3flox/flox x LysMcre+/- (PHD3 cko) mice is described in (12). To obtain PHD2/HIF-1α 83
double knock out macrophages Phd2flox/flox x LysMcre+/- were crossed with Hif-1αflox/flox mice 84
(B6.129-Hif1atm3Rsjo/J, Jackson Laboratories) to obtain PHD2flox/flox x HIF-1αflox/flox x 85
LysMcre+/- mice (dcKO). 86
87
Isolation and differentiation of BMDM 88
Bone marrow cells were isolated from the femur. After 24 h of culturing the cells non 89
adherent monocytes were harvested and seeded in Pluznik´s medium (DMEM supplemented 90
with 0.2 mM L-glutamine, 0.1 mM sodium pyruvate, 50 U/mL penicillin G, 50 μg/mL 91
streptomycin, 10% heat-inactivated fetal calf serum, 5% heat-inactivated horse serum (Pan 92
Biotech, Aidenbach, Germany), 0.05% 1:1000 diluted ß-mercaptoethanol (Carl Roth GmbH, 93
Karlsruhe, Germany), and 15% L929 cell-conditioned medium (13)) and differentiated for 7 94

6
days. Adherent bone marrow-derived macrophages (BMDM) were detached with 3.5 mL 95
accutase (PAA Laboratories, Cölbe, Germany) and resuspended in culture medium (DMEM 96
supplemented with, 0.2 mM L-glutamine, 0.1 mM sodium pyruvate, 1 mM HEPES, 50 U/mL 97
penicillin G, 50 μg/mL streptomycin and 10% heat-inactivated fetal calf serum). For 98
analyzing lactate production without addition of glucose, glucose-free medium (Pan Biotech) 99
was used as indicated. Successful differentiation of the BMDM was controlled by FACS-100
staining for the macrophage marker F4/80. 101
102
Generation of shPHD2 RAW cells 103
The mouse macrophage cell line RAW 264.7 was infected with Lentivirus encoding shRNA 104
targeting mPHD2 (5’-ATTCGAAGAATACCTCCAC-3’) and cotransfected with EGFP as 105
described earlier (14). Cells were used as a pool of sorted EGFP+ cells and knock-down 106
efficiency was tested via qPCR. 107
108
Preparation of MDA-MB231 conditioned medium 109
5 flasks each with 1x10⁶ MDA-MB231 cells were cultivated in 15 ml culture medium for 4 110
days. The medium was transferred to a reaction tube and centrifuged at 4000 g for 20 min at 4 111
ºC. The supernatant was pooled and frozen at -80 ºC. 112
113
Hypoxic incubation 114
For culturing cells in defined hypoxic conditions (1% O2) an invivo Hypoxia workstation was 115
used (Ruskinn Technologies). 116
117

7
Phagocytosis 118
Fluorescent beads (ProtonexTM Red 600-Latex Beads, AAT Bioquest, Sunnyvale, USA) were 119
administered to cells for 4 h. After washing, uptake of fluorescent beads was analyzed by 120
FACS (BD FACS Canto II, BD Biosciences). 121
122
Quantification of apoptotic cells 123
Supernatant and detached cells were collected. Samples were centrifuged and washed in PBS. 124
Subsequently, cells were stained for 30 min at 4°C with Pacific Blue Annexin V (70 µg/ml) 125
per sample (640918, Biolegend, San Diego, USA) diluted 1:150 in the dark. Samples were 126
washed in Annexin V binding buffer (422201, Biolegend) and analyzed by FACS (BD FACS 127
Canto II, BD Biosciences). 128
129
Single cell migration 130
2.5 x 10⁴ RAW cells or 5 x 10⁴ BMDMs were seeded in a 6-well plate. The next day the 131
medium was replaced with either normal medium or MDA-MB231 conditioned medium. The 132
migration of the cells was investigated using the T1-5M Nikon microscope inside the Sci-tive 133
work station (Ruskinn, Bridgend, South Wales) at normoxic (20% O2) or hypoxic (1% O2) 134
conditions. An image was taken every 10 min for in total 6 h. The migration was analyzed 135
using the chemotaxis plug-in installed in ImageJ. 136
137
138
139

8
Boyden chamber assay 140
0.7 x 10⁵ BMDM or RAW cells were seeded in 500 µL culture medium into inserts (BD 141
Biosciences, Heidelberg, Germany) containing 3 µm pores. Inserts were placed into 24-well 142
plates containing either 500 µl MDA-MB 231 conditioned medium or 500 µL cell culture 143
medium as control. 18 h later inserts were placed into medium with 5 µM calcein. Cells that 144
had not migrated were removed by scraping of the upper side of the insert after 1 h, while 145
migrated macrophages on the lower side were analyzed by fluorescence microscopy (Axio 146
Observer D1, Carl Zeiss, Göttingen, Germany). 147
148
RNA isolation and qRT PCR 149
Cells were washed once with PBS and harvested in Trizol (Invitrogen, Darmstadt, Germany). 150
RNA was isolated according to the manufacturer’s instructions and 1 µg was transcribed 151
using the First Strand cDNA Synthesis Kit (Fermentas, St. Leon-Rot, Germany). Transcript 152
levels were analyzed by qRT PCR amplifying 1 µL of cDNA with Brilliant II SYBR Green 153
qPCR Master Mix in an MX3005Pro light cycler (Agilent, Böblingen, Germany). Applied 154
primer sequences were: ms12 for 5´-GAAGCTGCCAAGGCCTTAGA -3´, rev 5´-155
AACTGCAACCAACCACCTTC-3´; phd2 for 5´-TTGCTGACATTGAACCCAAA-3´, 156
rev 5´-GGCAACTGAGAGGCTGTAGG-3´; phd3 for 5´-GGCCGCTGTATCACCTGTAT-157
3´, rev 5´-TTCTGCCCTTTCTTCAGCAT -3´; glut1 for 5´-158
TGGCCTTGCTGGAACGGCTG-3´, rev 5´-TCCTTGGGCTGCAGGGAGCA -3´; pfk1 for 159
5´-ACGAGGCCATCCAGCTCCGT-3´, rev 5´-160
TGGGGCTTGGGCAGTGTCCT -3´; pdk1 for 5´-TTCACGTCACGCTGGGCGAG -3´, rev161
5´-GGCTGGGCACACACCAGTCG -3´; cox4.2for 5´-162
CAGAGAAGGTGGCCTTGTACC -3´, rev 5´-AGAAGAAGACGCAGCCCATC -3´; LonP163
for 5´-CATCGCCTTGAACCCTCTGT-3´, rev 5´-164

9
AGCCGCTTAAGGATGTTGGT-3´; BNIP3 for 5´-GTCCAGTGTCGCCTGGCCTC -3´, 5´-165
TGGGAGCGAGGTGGGCTGTC -3´, mCCR2 for 5´-CCACACCCTGTTTCGCTG-3´, 166
mCCR2 rev 5´-ACCTCTTCAGCACTTGC-3´; mCCR4 for 167
5´-GCCTCTTGTTCAGCACTTGC-3´, mCCR4 rev 5´-ATAAGCAGCCCCAGGACG-3´; 168
mCCR5 for 5´-CCAGAGGAGGTGAGACATCCGTTC-3´, mCCR5 rev 5´-169
GGCAGGAGCTGAGCCGCAATTT -3´; mCCR7 for 5´- 170
ATGGACCCAGGGAAACCCAGGAA-3´, 171
mCCR7 rev 5´-GCACACCGACTCGTACAGGG-3´; mCXCR4 for 5´-172
GCTCCGGTAACCACCACGGC-3´, mCXCR4 rev 5´-GCGAGGTACCGGTCCAGGCT-3´. 173
174
Microarray-Based Gene Expression 175
Microarray-based gene expression was analysed as described before (12). 176
177
Western blots 178
Cells were lysed with 50 mM Tris, 150 mM NaCl, 0.5 mM PMSF, 100 mM MgCl2, 1% NP-179
40 supplemented with protease inhibitors (Roche). Protein samples were resolved by SDS-180
PAGE and transferred onto nitrocellulose membranes (Amersham Biosciences). Primary 181
antibodies used were: anti-HIF-1α (NB-100-479, Novus), anti-HIF-2α (AF2997, R&D 182
Systems), anti-PHD2 (NB-100-2219, Novus), anti-phospho pyruvate dehydrogenase 183
(ABS204, Merck), anti-pyruvate dehydrogenase (3205, Cell Signaling), anti-PDK1 (ADI-184
KAP-PK112-D, Stressgene), and anti-β-actin (A5441, Sigma). For detection of 185
immunocomplexes horseradish peroxidase-conjugated secondary goat anti-rabbit or goat anti-186
mouse antibodies (Santa Cruz Biotechnology) were used and membranes were incubated with 187
chemilumiescent HRP substrate (Millipore). 188

10
ATP and lactate measurements 189
Supernatant of 0.75 x 10⁵ BMDM or RAW cells cultivated for 24 h in 24-well plates was 190
analyzed for lactate production using a l-lactate kit according to the manufacturer’s 191
instructions (R-Biopharm, Darmstadt, Germany). For determination of ATP levels 0.2 x 10⁵ 192
BMDM or RAW cells were seeded. ATP levels were determined using the Cell titer-Glo ATP 193
kit (Promega, Madison, USA). 194
195
PDH activity assay 196
For determining PDH activity, the MAK183 kit (Sigma, St. Louis, USA) was used. 197
198
Oxygen consumption rate and extracellular acidification rate 199
Oxygen consumption rate (OCR) and extracellular acidification rate (ECAR) were analyzed 200
in the Seahorse XF96 extracellular flux analyzer (Seahorse Bioscience, Billerica, MA, USA). 201
For OCR 2.5 x 10⁴ RAW or 4.0 x 10⁴ BMDM cells per well were seeded. The medium was 202
replaced with XF assay medium supplemented with 4.5 g/L glucose and 1 mM sodium 203
pyruvate and incubated without CO2 for 30 min. After measuring basal respiration, the 204
oxygen consumption was analyzed after sequential addition of 1.5 µM oligomycin, 1 µM 205
FCCP, 2 µM rotenone and 1 µM antimycin A. 206
For determining the ECAR, 2.5 x 10⁴ (RAW) or 8 x 10⁴ (BMDM) cells per well were seeded. 207
Cells were washed with XF Glycostress-medium (DMEM D 5030, 134 mM NaCl, 3 mg 208
Phenol Red, 2 mM L-glutamine, pH 7.35). The cells were incubated for 15 min at 37ºC 209
without CO2. ECAR was analyzed after sequential addition of 10 mM glucose, 1.5-3 µM 210
oligomycin, and 100 mM 2-deoxy-glucose (2-DG). 211
212

11
Statistical analyses 213
Statistical analyses were performed using Student`s two-tailed t-test. Data are shown as 214
means ± SEM. Values of p < 0.05 were considered statistically significant. 215
216
217

12
Results 218
PHD2-deficient macrophages induce a hypoxic gene expression pattern in normoxia 219
including PDK1, a central regulator of the pyruvate dehydrogenase 220
BMDM isolated from PHD2fl/fl x LysMCre mice (PHD2 cKO) and RAW cells, which were 221
transfected with a constitutively active shRNA targeting PHD2 (shPHD2) showed an 80% 222
reduction of PHD2 RNA with a consequential increase of PHD3 RNA expression compared 223
to wt BMDM and wt RAW cells (Fig. 1A). The compensatory increase of the HIF-1 target 224
gene PHD3 is in line with other cell/tissue-specific PHD2 knock out mouse models (15). 225
Besides PHD3 other metabolism-related HIF target genes like Glut-1, PFK1, PDK1, COX4-2, 226
LonP and BNIP3 were upregulated. The gene expression pattern of the PHD2 cKO and 227
shPHD2 cells resembled the pattern of HIF target genes in wt BMDMs and wt RAW cells 228
after incubation in hypoxia. In quantitative means, however the levels of the HIF target genes 229
were lower in the shPHD2 and PHD2 cKO cells in normoxia compared to the respective wt 230
cells in hypoxia, which indicates that the reduction of PHD2 induced a partial HIF-response 231
possibly due to the fact that the other PHDs, i.e. PHD1 and PHD3 are still active. This 232
assumption was further supported by the fact that after hypoxic incubation of shPHD2 and 233
PHD2 cKO cells the RNA levels of the HIF target genes were further increased to a similar 234
extent as the respective wt cells in hypoxia. Cell viability/cell death, as determined by the 235
number of AV single-positive cells, were not different in untreated wt BMDM and wt RAW 236
cells compared to PHD2 cKO and shPHD2, respectively or after treatment with 1 mM 237
DMOG (Fig. 1B). 238
PHD2 protein levels were decreased in PHD2 cKO and shPHD2 cells likewise (Fig. 239
1C). Whereas HIF-1 and HIF-2α were detectable in BMDM isolated from wt mice in 240
hypoxia only, PHD2 cKO BMDM revealed high HIF-1 and HIF-2α protein levels in 241
normoxia. In the RAW cells HIF-2α was not detectable with the antibodies applied. For HIF-242
13
1α a similar pattern as in the BMDM was observed. Comparable to the HIF target RNA 243
expression HIF-1α and HIF-2α protein levels were further increased after exposing the PHD2 244
cKO cells and shPHD2 RAW cells to hypoxia. Taken together this demonstrates a 245
biologically relevant reduction of PHD2 with subsequent stabilization of the HIF- proteins 246
and induction of HIF target genes like PDK1 in the cell line model and the genetically 247
modified primary macrophages partially mimicking hypoxia. The increased expression of 248
PDK1 was further analyzed at protein level. PDK1 is a major regulator in central metabolic 249
pathways including glucose consumption. It acts in part by regulating the activity of the 250
pyruvate dehydrogenase (PDH) by phosphorylation, which results in inactivation of the 251
enzyme. PDH is one part of a mitochondrial multi-enzyme complex that catalyzes the 252
oxidative decarboxylation of pyruvate and is one of the major enzymes responsible for the 253
regulation of homeostasis of carbohydrate fuels in mammals. The induction of PDK1 in the 254
PHD2-deficient cells in normoxia was also detectable at the protein level (Fig. 1D). In line, 255
PDH was found to be more phosphorylated in the shPHD2 RAW cell and the PHD2 cKO 256
BMDM compared to their wild type cells. In hypoxia both, wt and the PHD2-deficient cells, 257
showed increased PDK1 protein level and phosphorylation of PDH. In parallel we determined 258
the PDH activity in cell extracts isolated from wt cells and PHD2-deficient cells after 259
exposure to normoxia or hypoxia (Fig. 1E). shPHD2 cells exhibited a significantly lower 260
PDH activity in normoxia, which was also observed in wt cells after treatment with the PHD 261
inhibitor DMOG. In hypoxia, a decreased PDH activity was observed in wt and shPHD2 262
cells, still with significantly lower levels in the knock down cells. Since PDK1 is a critical 263
regulator of cellular metabolism, we next analyzed the glycolytic capacity in the PHD2-264
deficient cells. 265
266
267
268
14
PHD2-deficient macrophages show a switch to glycolytic metabolism 269
Glycolysis utilization for energy demand can be characterized by the oxygen consumption 270
and the extracellular acidification rate after stimulation. Basal oxygen consumption rate and 271
maximal respiration after uncoupling the mitochondria with FCCP were significantly 272
decreased in the PHD2-deficient cells or after treating wt cells with DMOG, which indicates 273
that as a consequence of inhibiting PHD activity macrophages shift their source of energy to 274
anaerobic glycolysis (Fig. 2A and B). This was further supported by a significantly increased 275
glycolytic function as determined by the extracellular acidification rate after glucose or 276
oligomycin treatment, which reflects basal glycolysis and the overall glycolytic capacity, 277
respectively (Fig. 2C-F). In line we found increased lactate levels in the supernatant of 278
shPHD2 RAW cells and PHD2 cKO BMDM compared to their respective wt cells (Fig. 2G). 279
Lactate levels were likewise increased after DMOG treatment or exposure of the cells to 280
hypoxia. Incubating wt and PHD2 cKO BMDM without glucose at 20% O2 abolished the 281
lactate production demonstrating that the glucose in the culture medium is indeed the major 282
source for lactate production (Fig. 2H). 283
A fully operative cellular metabolism of macrophages is important to provide the 284
necessary amount of ATP. Aerobic versus anaerobic glycolysis are differing in the net 285
production of ATP. In line with the less efficient anaerobic glycolysis, levels of ATP were 286
significantly diminished in the PHD2 cKO BMDM, shPHD2 RAW cells as well as after 287
treating RAW wt cells with DMOG or exposing them to hypoxia (Fig. 3A), which might 288
impact their functionality namely polarization, migration and phagocytosis. Macrophages 289
display remarkable plasticity and can change their phenotype upon stimulation (16). The most 290
prominent macrophage populations are the M1- and M2-polarized macrophages. To analyze if 291
the metabolic alterations in the PHD2-deficient cells affects macrophage polarization we 292
analysed RNA levels of the M1 markers TNFα, iNOS, and MCP-1 as well as the the M2 293
markers Ym1 and Fizz in wt and PHD2 cKO BMDM. Arginase, which is also a M2 marker, 294

15
was not detectable in non-stimulated wt BMDM. None of the M1 or M2 markers were 295
changed in the PHD2 cKO BMDMs (Fig. 3B). Subsequently, we stimulated the cells with 296
LPS and the Th1 cytokine IFN or the Th2 cytokine IL-4 to functionally characterize M1- and 297
M2-polarization, respectively (Fig. 3C). Successful M1- and M2-polarization after stimulation 298
was verified by increased RNA levels of TNFα, iNOS and MCP-1 after treatment with LPS as 299
well as the Ym1, arginase and Fizz after treatment with IL-4. Expression levels of the M1 and 300
M2-marker RNAs were not different comparing wild type and PHD2 cKO BMDM. A lack in 301
macrophage polarization in the PHD2 cKO BMDM was additionally confirmed by a non-302
biased RNA microarray gene expression assay (Suppl. Table 1 and Table 2). In total 42 genes 303
were found to be significantly upregulated in PHD2 cKO BMDM including PHD3, BNIP3, 304
PFK1, and PDK1 and 56 were found to be significantly downregulated. Pathway analysis of 305
the RNAs identified to be up- or downregulated in the PHD2 cKO BMDM versus wt BMDM 306
did not reveal any indications for a macrophage polarization. Likewise treatment of wt or 307
PHD2 cKO BMDM with DMOG resulted in altered RNA expression but no clear pattern of 308
M1 or M2 associated genes (Fig. 3D). Whereas DMOG resulted in significantly decreased 309
RNA levels of TNFα and MCP1, iNOS, FIZZ and arginase were significantly increased in wt 310
as well as cKO BMDM. Taken collectively, the metabolic alterations in consequence if 311
DMOG treatment results in the downregulation of RNAs of some M1 associated genes, 312
however no stringent impact on the polarization of macrophages was observed in cKO 313
BMDM. 314
315
Impaired migratory and phagocytic capacity of PHD2 cKO BMDM and shPHD2 RAW 316
cells 317
Whereas most cells in the body are fixed in place, macrophages are motile and able to migrate 318
into surrounding tissues, where one of their major tasks is phagocytosis of invading pathogens 319
or cell debris. We analyzed the migration capacity of the PHD2 cKO BMDM and shPHD2 320
16
RAW cells by confronting the macrophages with conditioned supernatant of the MDA-321
MB231 breast carcinoma cells in a Boyden chamber and in single cell migration experiments. 322
Significantly less PHD2 cKO BMDM and shPHD2 RAW cells migrated compared to their 323
respective wt cells in the Boyden chamber (Fig. 4A). Additionally the accumulated distance 324
in the single cell migration experiments was found to be reduced (Fig. 4B). The impaired 325
migration capacity of the PHD2-deficient RAW cells could be mimicked by treating wt RAW 326
cells with the PHD inhibitor DMOG or exposure to hypoxia (Fig. 4C). In line with the 327
migration deficit, phagocytosis capacity was disturbed in the shPHD2 RAW cells and the 328
PHD2 cKO BMDM (Fig. 4D). Comparable to the migration capacity the decreased 329
phagocytosis could be mimicked in wt RAW cells by incubating the cells in hypoxia or by 330
treatment with DMOG. 331
Differential migration was not due to a modulated chemokine receptor expression since 332
quantifying CCR2, CCR4, CCR5, CCR7 and CXCR4 RNA levels by RT-PCR after exposing 333
wild type and PHD2 cKO BMDM to 20% O2 or 1% O2 did not reveal any difference between 334
the cell types besides an upregulation of CCR1 in the PHD2 cKO cells (Fig. 4E). We however 335
observed a significant upregulation of CCR1 and CCR5 and a slight upregulation of CXCR4 336
in hypoxia, which is in line with the literature (17,18). Since the migration deficit was not due 337
to a striking differential expression of chemokine receptors we further analyzed the impact of 338
the metabolic alterations for the migratory and phagocytosis capacity. 339
340
Regulation of PHD activity by PDK is critical for macrophage function 341
To obtain insight into the importance of the altered PDK1 levels and PDH activity for the 342
functional impairment of the PHD2-deficient macrophages, we treated cells with the PDK 343
inhibitor DCA. DCA binds to PDK1 near the helix bundle in the N-terminal part. Bound DCA 344
promotes local conformational changes that are communicated to both nucleotide-binding and 345
lipoyl-binding pockets of PDK1, leading to the inactivation of kinase activity (19). DCA 346

17
treatment reestablished the decreased PDH activity in the shPHD2 RAW cells (Fig. 5A). In 347
line with this shPHD2 and PHD2 cKO BMDM produced less lactate and demonstrated 348
significantly increased ATP levels after DCA treatment (Fig. 5B and C). Reversal of the 349
metabolic reprogramming after DCA treatment was also observed when analyzing the ECAR. 350
Whereas the non-treated shPHD2 cells and PHD2 cKO BMDM had a significantly increased 351
glycolysis and glycolytic capacity, this was significantly decreased in the DCA treated cells 352
(Fig. 5D). Finally, we tested if DCA treatment is able to normalize the migration and 353
phagocytosis deficit (Fig. 5E and F). Most interestingly, DCA treatment indeed was able to 354
increase the impaired migration and phagocytosis capacity in the shPHD2 RAW and PHD2 355
cKO cells to comparable levels of the wild type cells, strongly indicating that the metabolic 356
programming via PDK1 per se is responsible for the functional alterations in consequence of 357
downregulating PHD2 expression. 358
PDK1 has been described to be a HIF target gene (7). In a previous report, we demonstrated 359
that in PHD3 cKO BMDM HIF-1α is not stabilized in normoxia (12), which is in sharp 360
contrast to the effect seen in the PHD2 cKO BMDM described here. This was further 361
supported by the fact, that HIF target genes including PDK1 were not significantly increased 362
in PHD3 cKO BMDM other than PHD2 cKO or wt BMDMs in normoxia and hypoxia (Fig. 363
6A). The genes identified in the gene array analysis (PHD2 cKO versus wt BMDM) were 364
additionally compared to PHD3 regulated genes described earlier (12). Most interestingly just 365
13 genes were found to be regulated in the PHD2 cKO as well as in the PHD3 cKO BMDM, 366
indicating PHD isoform specific effects (Suppl. Table 3). In line ATP and lactate levels as 367
well as accumulated migration difference were not altered in PHD3 cKO versus wt BMDM 368
(Fig. 6B). To further analyze, if PHD2 mediates its effects via HIF-1α we generated dcKO 369
mice. dcKO BMDM had a blunted response in RNA levels of the HIF target genes PHD3, 370
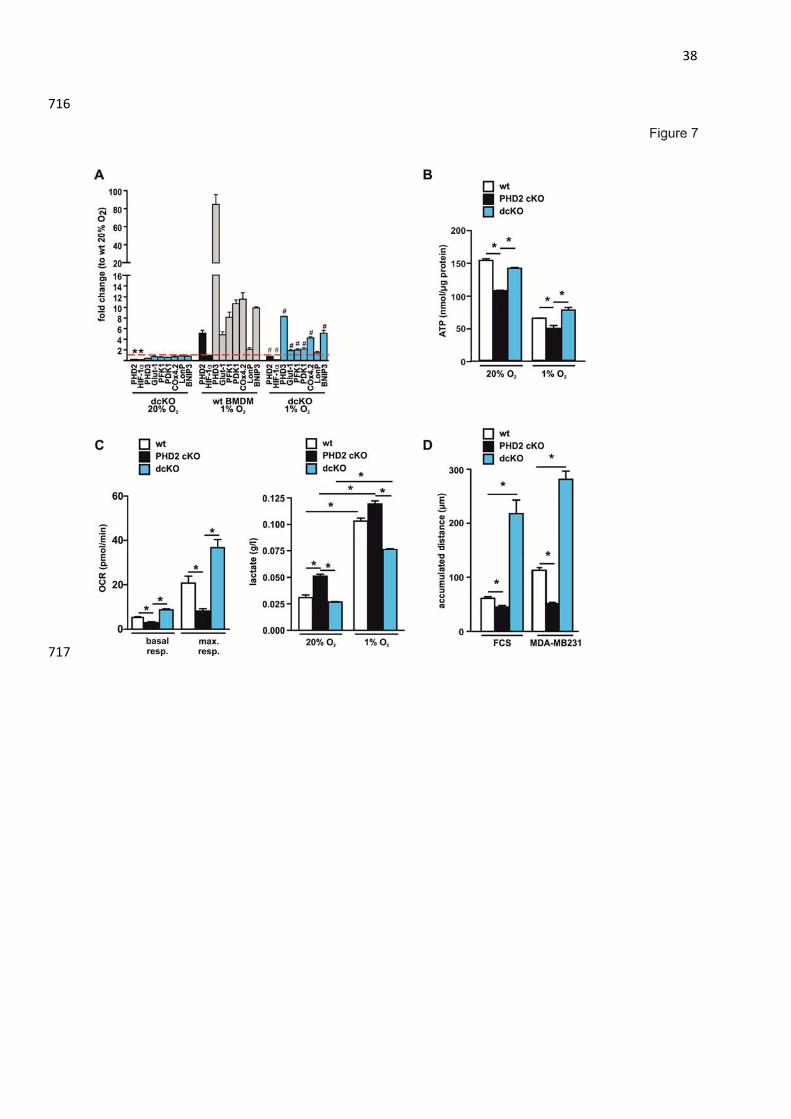
Glut-1, PDK1, PDK1, Cox4.2 and LonP in hypoxia (Fig. 7A). The metabolic phenotype of 371
the PHD2 cKO BMDM, i.e. decreased ATP levels, increased lactate levels, decreased OCR 372

18
and decreased migration was rescued in consequence of the HIF-1α knock out demonstrating 373
that HIF-1 and PDK1 are the two main mediators for the PHD2-induced metabolic alterations 374
(Fig. 7B-D). 375
376
Discussion 377
Macrophages are critical effector cells for innate immunity but also adaptive immune function 378
by recruiting further cells to the inflamed tissue (20). To fulfill their functions macrophages 379
need to efficiently migrate into the affected tissue and phagocytose invading pathogens or cell 380
debris. Both characteristic features were severely impaired in the PHD2-deficient RAW cell 381
line model as well as in the primary BMDM in our study. The impaired migration is in line 382
with two previous studies analyzing the migratory capacity of PHD2-deficient peritoneal 383
macrophages as well as shPHD2 RAW cells towards MCP-1 as a stimulus (21,22). Infiltrating 384
inflammatory cells including macrophages play an important role in tissue remodeling after 385
an insult. In line with this, LysM Cre PHD2fl/fl animals showed less macrophage infiltration in 386
the aorta during hypertensive cardiovascular remodeling (21). This was associated with a 387
protection from hypertension-induced left ventricular hypertrophy and reduced ejection 388
fraction. The basis for the impaired macrophage migration, however, has not been analyzed in 389
further depth so far. 390
Functionality of macrophages is significantly affected by their polarization as well as 391
their metabolic phenotype. Macrophages can be generally classified into two major groups, 392
i.e. the M1- (classically activated) and M2- (alternatively activated) macrophages (23). Both 393
subgroups have specific functions for the inflammatory clearance of pathogens and tissue 394
repair, respectively (24). HIF-1α and HIF-2α are known to affect macrophage polarization 395
with a predominant role of HIF-1α for M1-macrophages and HIF-2α for M2-macrophages 396

19
(25). Since the PHD enzymes regulate HIFα stability it is tempting to speculate that inhibition 397
of their enzymatic activity would also affect macrophage polarization. Characterization of 398
resting as well as stimulated wt and PHD2 cKO macrophages, however, did not reveal any 399
striking pattern, which would indicate a clear polarization. It is important to note that this 400
observation is not in contrast with the study by Takeda et al, in which an M2-polarization has 401
been described as a consequence of a PHD2 knock out (26). M2-polarization was observed in 402
heterozygous but not homozygous PHD2-deficient macrophages by Takeda et al., which 403
matches our observations with the homozygous PHD2-deficient macrophages. 404
In stark contrast to the unaltered polarization, we found an influence of PHD2 on 405
reprogramming of mitochondrial metabolism. This effect was mediated via PHD2 dependent 406
regulation of PDK1 expression. This is in accordance with a recent report showing in 407
livers/hepatocytes that PHD2 can regulate PDK1 (27). In line with higher levels of PDK1 and 408
higher phosphorylation of its target PDH, the basal and stimulated oxygen consumption was 409
significantly lower in the PHD2-deficient cells accompanied by an increased glycolytic 410
capacity. PDK1 is a key regulatory enzyme in glucose metabolism. The PDH complex, which 411
is regulated by PDK1, converts pyruvate produced from the glycolytic flux to acetyl-CoA. 412
Pyruvate-derived acetyl-CoA then enters the TCA cycle that generates NADH that fuels the 413
electron transport chain for oxidative phosphorylation. In hypoxia PDH activity is inhibited 414
via PDK1 mediated phosphorylation, which induces the anaerobic glucose metabolic 415
homeostasis under limited oxygen availability. This mechanism is widely used by tumor cells 416
and is part of the so-called Warburg effect. Warburg described that unlike most normal 417
tissues, cancer cells tend to “ferment” glucose into lactate even in the presence of sufficient 418
oxygen to support mitochondrial oxidative phosphorylation (28). In case of immune cells the 419
metabolic adaptation however is part of their physiological response. Innate immune cells like 420
neutrophils likewise depend on anaerobic glycolysis for ATP production, which is also 421
resembled by the fact, that they harbor only few mitochondria (29). In contrast macrophages 422
20
have comparable numbers of mitochondria like other body cells and thus a higher metabolic 423
flexibility, which allows a quick metabolic switch from aerobic to anaerobic glycolysis. 424
Hallmarks of anaerobic glycolysis are a reduced ATP production, increased lactate levels and 425
decreased oxygen consumption (30). All three features were significantly altered in the 426
PHD2-deficient macrophages indicating an anaerobic metabolic shift. Neutrophils and 427
monocytes/macrophages fulfill their physiological function in severely hypoxic areas like 428
inflammation or ischemia. Unlike short-lived neutrophils, macrophages survive longer in the 429
body up to a maximum of several months. Compared to the oxygenated blood the pO2 in 430
most tissues is significantly lower. Thus, compared to monocytes, macrophages need to be 431
able to adapt to the hypoxic conditions, which reflect their physiological environment. In 432
contrast, short lived neutrophils enter inflamed hypoxic tissue where they die quickly to fulfill 433
their function. This is also reflected by the fact that in contrast to other cells, they die upon 434
exposure to hypoxia. Most interestingly the metabolic phenotype observed in the shPHD2 435
RAW cells and cKO BMDM mimicked the effects seen in wt cells in hypoxia. The metabolic 436
adaptation thus might ensure function and viability of the cells as long as possible in the 437
hypoxic conditions. A lower migration rate as a consequence helps to keep the cells in place 438
until they are stimulated during the course of an acute inflammation. 439
Recent evidence suggests an intricate link between metabolism and macrophage activation 440
(31). To this end it becomes important to know what kind of metabolic changes occur after 441
immune cell activation and if the altered metabolism per se can serve as a controller of the 442
immunomodulatory functionality. Analyzing metabolic aspects as a consequence of blocking 443
PHD2 thus might answer the question about what changes in the regulation of energy 444
metabolism are necessary for macrophages and if these can be targeted to control innate 445
immune function. In this regard our data clearly indicate that deleting PHD2 in macrophages 446
is sufficient to drive an anaerobic glycolytic phenotype in normoxia and interferes with 447
migration and phagocytosis. PHD enzyme activity can be inhibited with competitive 448

21
oxoglutarate analogues. Respective inhibitors are being developed to specifically interfere 449
with the PHD/HIF signaling pathway (32). Short term treatment of wt macrophages with the 450
PHD inhibitor DMOG or exposing the cells to hypoxia was indeed sufficient to mimic the 451
metabolic features of the genetically modified macrophages. Moreover, the metabolic switch 452
in the PHD2-deficient macrophages was readily reversible by inhibition of PDK1 453
demonstrating that PHD2-mediated metabolic changes are not decretory. DCA treatment 454
rescued all hallmarks of anaerobic glycolysis in the PHD2-deficient cells including the 455
impaired functionality. A critical role of PDK1 for macrophage metabolism and function has 456
been described earlier and is in line with our findings (33). Via altering PDK1 activity the 457
cellular ATP levels as well as extracellular lactate levels are modulated. ATP as well as a 458
lactate-enriched environment has been demonstrated to add to immunomodulatory functions 459
by altering the migratory activity of defense cells (34,35). PDK1 as a molecule to target 460
deregulated energy metabolism is an emerging strategy for cancer therapy (36). Redirection of 461
glucose metabolism from glycolysis to oxidation, which reverses the Warburg effect, leads to 462
inhibition of proliferation and induction of caspase-mediated apoptosis in tumor cells. Thus 463
far, DCA is the most extensively studied PDK1 inhibitor; however, it has limited use for 464
therapeutic purposes because of its low potency and high toxicity. PHD inhibitors on the other 465
side have entered pre-clinical models and clinical trials and thus interfering with PHD2 466
activity might serve as better strategy to influence immune functions via metabolic 467
reprogramming (37). 468
Taken collectively our study shows that while PHD2 is not required for macrophage 469
polarization it controls macrophage metabolism and function. Mechanistically the balance 470
between aerobic and anaerobic glycolysis is affected by PHD2 via the expression and activity 471
of PDK1. This adds to our understanding of the functionality of macrophages in normoxia 472
and hypoxia. In addition our finding might point to a possibility to specifically interfere with 473
the inflammatory function of macrophages by inhibiting PHD2 activity. 474
22
475
Acknowledgements 476
We thank Annette Hillemann for expert technical support. 477
Contribution: A.G., A.B., L.S., K.F., S.N., B.W., A.Z., A.J. and M.C. designed and performed 478
research, analyzed data and wrote the manuscript; J.D. performed research and analyzed data; 479
P.R., C.X.C.S. and A.M.S. evaluated the data and corrected the paper; D.M.K. designed 480
research and wrote the manuscript; and all authors read and edited the manuscript. 481
Conflict-of-interest disclosure The authors declare no competing financial interests. 482
Funding information 483
This study was supported by research funding from the Deutsche Forschungsgemeinschaft 484
(IRTG1816) to A.G. and A.B.; P.R. is supported by the SFB1002; M.C., C.X.C.S. and A.M.S. 485
are supported by the British Heart Foundation. 486
487
488

23
References 489
1. Wynn, TA, Vannella, KM. 2016. Macrophages in Tissue Repair, Regeneration, and 490
Fibrosis. Immunity. 44: 450-462. 491
2. Goda, N, Kanai, M. 2012. Hypoxia-inducible factors and their roles in energy 492
metabolism. Int J Hematol. 95: 457-463. 493
3. Bishop, T, Ratcliffe, PJ. 2015. HIF hydroxylase pathways in cardiovascular 494
physiology and medicine. Circ Res. 117: 65-79. 495
4. Kaelin Jr, WG. 2004. Proline Hydroxylation and Gene Expression. Annu Rev 496
Biochem. 19: 19. 497
5. Schofield, CJ, Ratcliffe, PJ. 2004. Oxygen sensing by HIF hydroxylases. Nat Rev 498
Mol Cell Biol. 5: 343-354. 499
6. Papandreou, I, Cairns, RA, Fontana, L, Lim, AL, Denko, NC. 2006. HIF-1 500
mediates adaptation to hypoxia by actively downregulating mitochondrial oxygen 501
consumption. Cell Metab. 3: 187-197. 502
7. Kim, JW, Tchernyshyov, I, Semenza, GL, Dang, CV. 2006. HIF-1-mediated 503
expression of pyruvate dehydrogenase kinase: a metabolic switch required for cellular 504
adaptation to hypoxia. Cell Metab. 3: 177-185. 505
8. Katschinski, DM. 2009. In vivo functions of the prolyl-4-hydroxylase domain oxygen 506
sensors: direct route to the treatment of anaemia and the protection of ischaemic 507
tissues. Acta Physiol (Oxf). 195: 407-414. 508
9. Myllyharju, J. 2013. Prolyl 4-hydroxylases, master regulators of the hypoxia 509
response. Acta Physiol (Oxf). 208: 148-165. 510
10. Walmsley, SR, Chilvers, ER, Thompson, AA, Vaughan, K, Marriott, HM, 511
Parker, LC, Shaw, G, Parmar, S, Schneider, M, Sabroe, I, Dockrell, DH, Milo, 512
M, Taylor, CT, Johnson, RS, Pugh, CW, Ratcliffe, PJ, Maxwell, PH, Carmeliet, 513
P, Whyte, MK. 2011. Prolyl hydroxylase 3 (PHD3) is essential for hypoxic regulation 514
of neutrophilic inflammation in humans and mice. J Clin Invest. 121: 1053-1063. 515
11. Kiss, J, Mollenhauer, M, Walmsley, SR, Kirchberg, J, Radhakrishnan, P, 516
Niemietz, T, Dudda, J, Steinert, G, Whyte, MK, Carmeliet, P, Mazzone, M, 517
Weitz, J, Schneider, M. 2012. Loss of the oxygen sensor PHD3 enhances the innate 518
immune response to abdominal sepsis. J Immunol. 189: 1955-1965. 519
12. Swain, L, Wottawa, M, Hillemann, A, Beneke, A, Odagiri, H, Terada, K, Endo, 520
M, Oike, Y, Farhat, K, Katschinski, DM. 2014. Prolyl-4-hydroxylase domain 3 521

24
(PHD3) is a critical terminator for cell survival of macrophages under stress 522
conditions. J Leukoc Biol. 96: 365-375. 523
13. Burgess, AW, Metcalf, D, Kozka, IJ, Simpson, RJ, Vairo, G, Hamilton, JA, Nice, 524
EC. 1985. Purification of two forms of colony-stimulating factor from mouse L-cell-525
conditioned medium. J Biol Chem. 260: 16004-16011. 526
14. Klotzsche-von Ameln, A, Muschter, A, Mamlouk, S, Kalucka, J, Prade, I, 527
Franke, K, Rezaei, M, Poitz, DM, Breier, G, Wielockx, B. 2011. Inhibition of HIF 528
prolyl hydroxylase-2 blocks tumor growth in mice through the antiproliferative 529
activity of TGFbeta. Cancer Res. 71: 3306-3316. 530
15. Hölscher, M, Silter, M, Krull, S, von Ahlen, M, Hesse, A, Schwartz, P, Wielockx, 531
B, Breier, G, Katschinski, DM, Zieseniss, A. Cardiomyocyte-specific Prolyl-4-532
hydroxylase Domain 2 Knock Out Protects from Acute Myocardial Ischemic Injury. J 533
Biol Chem. 286: 11185-11194. 534
16. Mosser, DM, Edwards, JP. 2008. Exploring the full spectrum of macrophage 535
activation. Nat Rev Immunol. 8: 958-969. 536
17. Bosco, MC, Puppo, M, Santangelo, C, Anfosso, L, Pfeffer, U, Fardin, P, Battaglia, 537
F, Varesio, L. 2006. Hypoxia modifies the transcriptome of primary human 538
monocytes: modulation of novel immune-related genes and identification of CC-539
chemokine ligand 20 as a new hypoxia-inducible gene. J Immunol. 177: 1941-1955. 540
18. Dong, F, Khalil, M, Kiedrowski, M, O'Connor, C, Petrovic, E, Zhou, X, Penn, 541
MS. 2010. Critical role for leukocyte hypoxia inducible factor-1alpha expression in 542
post-myocardial infarction left ventricular remodeling. Circ Res. 106: 601-610. 543
19. Kato, M, Li, J, Chuang, JL, Chuang, DT. 2007. Distinct structural mechanisms for 544
inhibition of pyruvate dehydrogenase kinase isoforms by AZD7545, dichloroacetate, 545
and radicicol. Structure. 15: 992-1004. 546
20. Shi, C, Pamer, EG. 2011. Monocyte recruitment during infection and inflammation. 547
Nat Rev Immunol. 11: 762-774. 548
21. Ikeda, J, Ichiki, T, Matsuura, H, Inoue, E, Kishimoto, J, Watanabe, A, Sankoda, 549
C, Kitamoto, S, Tokunou, T, Takeda, K, Fong, GH, Sunagawa, K. 2013. Deletion 550
of phd2 in myeloid lineage attenuates hypertensive cardiovascular remodeling. J Am 551
Heart Assoc. 2: e000178. 552
22. Mamlouk, S, Kalucka, J, Singh, RP, Franke, K, Muschter, A, Langer, A, Jakob, 553
C, Gassmann, M, Baretton, GB, Wielockx, B. 2014. Loss of prolyl hydroxylase-2 in 554

25
myeloid cells and T-lymphocytes impairs tumor development. Int J Cancer. 134: 849-555
858. 556
23. Mantovani, A, Sica, A, Sozzani, S, Allavena, P, Vecchi, A, Locati, M. 2004. The 557
chemokine system in diverse forms of macrophage activation and polarization. Trends 558
Immunol. 25: 677-686. 559
24. Lawrence, T, Natoli, G. 2011. Transcriptional regulation of macrophage polarization: 560
enabling diversity with identity. Nat Rev Immunol. 11: 750-761. 561
25. Takeda, N, O'Dea, EL, Doedens, A, Kim, JW, Weidemann, A, Stockmann, C, 562
Asagiri, M, Simon, MC, Hoffmann, A, Johnson, RS. 2010. Differential activation 563
and antagonistic function of HIF-{alpha} isoforms in macrophages are essential for 564
NO homeostasis. Genes Dev. 24: 491-501. 565
26. Takeda, Y, Costa, S, Delamarre, E, Roncal, C, Leite de Oliveira, R, Squadrito, 566
ML, Finisguerra, V, Deschoemaeker, S, Bruyere, F, Wenes, M, Hamm, A, 567
Serneels, J, Magat, J, Bhattacharyya, T, Anisimov, A, Jordan, BF, Alitalo, K, 568
Maxwell, P, Gallez, B, Zhuang, ZW, Saito, Y, Simons, M, De Palma, M, Mazzone, 569
M. 2011. Macrophage skewing by Phd2 haplodeficiency prevents ischaemia by 570
inducing arteriogenesis. Nature. 479: 122-126. 571
27. Suhara, T, Hishiki, T, Kasahara, M, Hayakawa, N, Oyaizu, T, Nakanishi, T, 572
Kubo, A, Morisaki, H, Kaelin, WG, Jr., Suematsu, M, Minamishima, YA. 2015. 573
Inhibition of the oxygen sensor PHD2 in the liver improves survival in lactic acidosis 574
by activating the Cori cycle. Proc Natl Acad Sci U.S.A. 112: 11642-11647. 575
28. Warburg, O. 1956. On respiratory impairment in cancer cells. Science. 124: 269-270. 576
29. Kelly, B, O'Neill, LA. 2015. Metabolic reprogramming in macrophages and dendritic 577
cells in innate immunity. Cell Res. 25: 771-784. 578
30. Pavlova, NN, Thompson, CB. 2016. The Emerging Hallmarks of Cancer 579
Metabolism. Cell Metab. 23: 27-47. 580
31. Mills, EL, O'Neill, LA. 2016. Reprogramming mitochondrial metabolism in 581
macrophages as an anti-inflammatory signal. Eur J Immunol. 46: 13-21. 582
32. Myllyharju, J. 2009. HIF prolyl 4-hydroxylases and their potential as drug targets. 583
Curr Pharm Des. 15: 3878-3885. 584
33. Tan, Z, Xie, N, Cui, H, Moellering, DR, Abraham, E, Thannickal, VJ, Liu, G. 585
2015. Pyruvate dehydrogenase kinase 1 participates in macrophage polarization via 586
regulating glucose metabolism. J Immunol. 194: 6082-6089. 587
588

26
34. Haas, R, Smith, J, Rocher-Ros, V, Nadkarni, S, Montero-Melendez, T, 589
D'Acquisto, F, Bland, EJ, Bombardieri, M, Pitzalis, C, Perretti, M, Marelli-Berg, 590
FM, Mauro, C. 2015. Lactate Regulates Metabolic and Pro-inflammatory Circuits in 591
Control of T Cell Migration and Effector Functions. PLoS Biol. 13: e1002202. 592
35. Gottfried, E, Kunz-Schughart, LA, Ebner, S, Mueller-Klieser, W, Hoves, S, 593
Andreesen, R, Mackensen, A, Kreutz, M. 2006. Tumor-derived lactic acid 594
modulates dendritic cell activation and antigen expression. Blood. 107: 2013-2021. 595
36. Barile, E, De, SK, Pellecchia, M. 2012. PDK1 inhibitors. Pharm Pat Anal. 1: 145-596
163. 597
37. Chan, MC, Holt-Martyn, JP, Schofield, CJ, Ratcliffe, PJ. 2016. Pharmacological 598
targeting of the HIF hydroxylases - A new field in medicine development. Mol 599
Aspects Med. 47-48: 54-75. 600
601
602
603

27
Figure legends 604
Fig. 1: PHD2 knock down RAW cells and PHD2 knock out (PHD2 cKO) BMDMs display 605
increased PDK1 expression and activity. (A) wt RAW and shPHD2 knock down cells as well 606
as wt BMDM and PHD2 cKO macrophages were incubated for 24 hrs at 20% or 1% O2. RNA 607
levels of the indicated genes were analyzed by qRT-PCR. RNA levels of wt RAW and wt 608
BMDM cells were set to one. Fold change of the RNA levels of shPHD2 or the PHD2 cKO 609
BMDM or wt cells in hypoxia of the indicated genes compared to the wt cells in normoxia 610
was analyzed. n = 3-6 independent samples per condition. (B) Annexin V (AV) single-611
positive cells were analyzed in wt BMDM and PHD2 cKO macrophages with and without 612
treatment with 1 mM DMOG for 24 hrs. (C) HIF-1α, HIF-2α, PHD2 and β-actin protein 613
levels of wt RAW and shPHD2 as well as wt BMDM and PHD2 cKO macrophages in 614
normoxia (20% O2) or hypoxia (1% O2 for 24 hrs). (D) phospho-PDH, total PDH, PDK and 615
β-actin protein levels of wt RAW and shPHD2 cells as well as wt BMDM and PHD2 cKO 616
macrophages in normoxia (20% O2) or hypoxia (1% O2 for 24 hrs). (E) PDH activity in wt 617
RAW, shPHD2 RAW cells and wt RAW cells treated with 1 mM DMOG for 24 hrs in 618
normoxia or hypoxia (1% O2 for 24 hrs). n = 6 independent samples per condition. mean ± 619
SEM, * p<0.05. 620
Fig. 2: As a consequence of a reduction of PHD2 expression macrophages shift their 621
metabolism towards anaerobic glycolysis. (A) wt RAW, shPHD2 RAW, wt BMDM and 622
PHD2 cKO cells or wt RAW cells treated with 1 mM DMOG for 24 hrs were tested for their 623
oxygen consumption rate (OCR) after addition of oligomycin, FCCP as well as rotenone and 624
antimycin A (Rot + AA). n = 6 (RAW) and n = 10 (BMDM) independent samples per 625
condition. (B) Basal respiration and maximum respiration were analyzed in wt RAW, 626
shPHD2 RAW, wt BMDM and PHD2 cKO cells based on the experiments shown in A. OCR 627
after addition of Rot + AA was subtracted from the OCR after addition of oligomycin and 628

28
FCCP to obtain basal respiration and maximum respiration values, respectively. (C) 629
Extracellular acidification rate (ECAR) was determined in wt RAW and shPHD2 RAW as 630
well as (D) wt BMDM and PHD2 cKO cells or wt RAW cells treated with 1 mM DMOG for 631
24 hrs after addition of glucose, oligomycine and 2-desoxy glucose (2-DG). n = 7 independent 632
samples per condition. (E, F) Glycolysis and anaerobic glycolytic capacity were analyzed 633
based on the experiments shown in C and D. The ECAR after addition of 2-DG was 634
subtracted from the ECAR after addition of glucose or oligomycine to obtain glycolysis and 635
glycolytic capacity values, respectively. (G) Lactate levels were determined in the supernatant 636
of wt RAW, shPHD2 RAW, wt BMDM and PHD2 cKO cells after incubation of the cells at 637
the indicated conditions. n = 4 independent samples per condition. mean ± SEM, * p<0.05. 638
(H) Lactate levels were determined in the supernatant of wt BMDM and cKO cells after 639
incubation of the cells at 20% O2, 1% O2 with or without addition of glucose in the cell 640
culture medium. Cells were incubated for 24 hrs in the respective cell culture medium, n = 4 641
independent samples per condition. 642
Fig. 3: Decreased ATP levels and unaltered polarization in PHD2 deficient macrophages. 643
(A) wt RAW, shPHD2 RAW, wt BMDM and PHD2 cKO cells were incubated at 20% O2 or 644
1% O2 for 24 hrs. Subsequently intracellular ATP levels were determined. n = 6 independent 645
samples per condition. Right panel: wt RAW cells were incubated for the indicated times with 646
1 mM DMOG and ATP levels were determined. n = 6-7 independent samples per condition. 647
(B) RNA levels of M1- and M2-markers in resting wt BMDM and cKO cells or (C) after 648
stimulation with IL-4 (20 nM) or LPS (100 ng/ml) and IFN (20 nM) for 24 hrs. (D) RNA 649
levels of M1 and M2-markers in resting wt BMDM and PHD2 cKO cells were analyzed after 650
treatment of the cells with 1mM DMOG for 24 hrs. Fold change of the RNA levels of DMOG 651
treated wt or cKO BMDM of the indicated genes compared to the non-treated cells was 652
analyzed. n = 3-6 independent samples per condition. mean ± SEM, * p<0.05. 653
29
Fig. 4: A reduction of PHD2 expression in RAW cells or BMDMs results in a defect in 654
macrophage migration and phagocytosis. (A) wt RAW, shPHD2 RAW, wt BMDM and 655
PHD2 cKO cells were tested for their migration capacity in Boyden chambers using FCS or 656
conditioned medium of MDA-MB231 cells as stimulants. n = 4 (RAW cells), n = 4 (BMDM) 657
independent samples. (B) The accumulated migration distance over 6 hrs of wt RAW, 658
shPHD2 RAW, wt BMDM and PHD2 cKO cells was tested in single cell migration 659
experiments using FCS or conditioned medium of MDA-MB231 cells as stimulants. n = 59-660
64 cells per condition (RAW cells), n = 51-71 cells per conditions (BMDM cells). (C) wt 661
RAW cells were incubated at 20% O2 ± 1 mM DMOG or 1% O2 for 6 hrs. The accumulated 662
migration distance was tested in single cell migration experiments using FCS or conditioned 663
medium of MDA-MB231 cells as stimulants. For cells analyzed at 1% O2 the hypoxic 664
conditions were kept during the single cell migration experiments without reoxygenation. n = 665
50-53 cells per condition. (D) wt RAW, shPHD2 RAW, wt BMDM and PHD2 cKO cells 666
were incubated at 20% O2 ± 1 mM DMOG or 1% O2 in total for 20 hrs. Subsequently, the 667
capacity of the cells to phagocytose labeled beads was analyzed. Fluorescence beads were 668
added to the cells for 4 hrs without reoxygenation. n = 5 independent samples per condition. 669
mean ± SEM, * p<0.05. (E) RNA levels of chemokine receptors in resting wt BMDM and 670
PHD2 cKO cells after incubation in normoxia or hypoxia (1% O2) for 24 hrs. Fold change of 671
the RNA levels in the PHD2 cKO BMDM of the indicated genes compared to the wt cells in 672
normoxia was analyzed. n = 3 independent samples per condition. mean ± SEM. *p<0.05. 673
Fig. 5: Inhibition of PDK1 by dichloroacetate (DCA) reverses the metabolic phenotype and 674
the migration defect in PHD2-deficient macrophages. (A) PDH activity was determined in 675
lysates of wt RAW, shPHD2 RAW cells after incubation of the cells ± 5 mM DCA for 24 hrs. 676
n = 6 independent samples per condition. Lactate levels in the supernatants and intracellular 677
ATP levels of wt RAW and shPHD2 RAW (B) as well as wt BMDM and cKO macrophages 678
(C) after incubation of the cells ± 5 mM DCA for 24 hrs. (D) Glycolysis and glycolytic 679

30
capacity were analyzed in wt RAW, shPHD2 RAW, wt BMDM and PHD2 cKO after 680
incubating the cells ± 5 mM DCA for 24 hrs. n = 6-10 independent samples per condition. (E) 681
The accumulated migration distance over 6 hrs of wt RAW and shPHD2 RAW cells after 682
incubation of the cells ± 5 mM DCA for 24 hrs was determined in single cell migration 683
experiments using FCS or conditioned medium of MDA-MB231 cells as stimulants. n = at 684
least 20 cells per condition. (F) wt RAW, shPHD2 RAW, wt BMDM and PHD2 cKO cells 685
were incubated ± 5 mM DCA for 24 hrs. Subsequently, the capacity of the cells to 686
phagocytose labeled beads was analyzed. n = 5-8 independent samples per condition. mean ± 687
SEM, * p<0.05. 688
Fig. 6: No metabolic phenotype in PHD3-deficient macrophages. (A) wt BMDM and PHD3 689
cKO macrophages were incubated for 24 hrs at 20% or 1% O2. RNA levels of the indicated 690
genes were analyzed by qRT-PCR. RNA levels of wt BMDM cells were set to one. Fold 691
change of the RNA levels of PHD3 cKO BMDM or wt cells in hypoxia of the indicated genes 692
compared to the wt cells in normoxia was analyzed. n = 3 independent samples per condition. 693
(B) ATP (n = 5 independent samples) and lactate levels (n = 4 independent samples) as well 694
as accumulated migration distance were determined in wt BMDM and PHD3 cKO 695
macrophages. 696
Fig. 7: HIF-1α mediates the metabolic alterations in PHD2-deficient macrophages. (A) wt 697
BMDM and dcKO macrophages were incubated for 24 hrs at 20% or 1% O2. RNA levels of 698
the indicated genes were analyzed by qRT-PCR. RNA levels of wt BMDM cells were set to 699
one. Fold change of the RNA levels of dcKO BMDM or wt cells in hypoxia of the indicated 700
genes compared to the wt cells in normoxia was analyzed. n = 3 independent samples per 701
condition. mean ± SEM, * p<0.05 compared to wt 20% O2, # p<0.05 compared to wt 1% O2. 702
(B) Intracellular ATP levels were determined in wt BMDM, PHD2 cKO and dcKO cells after 703
incubation for 24 hrs in 20% O2 or 1% O2. (C) Oxygen consumption rate (OCR) and lactate in 704

31
the supernatants of wt BMDM PHD2 cKO and dcKO cells were analyzed. (D) The 705
accumulated migration distance over 6 hrs of wt BMDM, PHD2 cKO and dcKO cells was 706
determined in single cell migration experiments using FCS or conditioned medium of MDA-707
MB231 cells as stimulants. n = at least 20 cells per condition. mean ± SEM, * p<0.05. 708
709

32
710

33
711

34
712

35
713

36
714

37
715
38
716
717