kinetics of ligand substitution reactions of a pt(ii)...
TRANSCRIPT
1
Copyright Scott D. Cummings, 2010
Created by Scott D. Cummings ([email protected]) and posted on VIPEr in XXX 2010. Copyright Scott D. Cummings, 2010. This work is licensed under the Creative Commons Attribution Non-commercial Share Alike License. To view a copy of this license visit {http://creativecommons.org/licenses/by-nc-sa/3.0/}.
Kinetics of Ligand Substitution Reactions of a Pt(II) Complex
Background The complex cation [Pt(terpy)Cl]+ has a rich history of serving as a “tag” of biomolecules such as DNA and proteins.1 The complex can intercalate between base pairs of DNA via non-covalent hydrophobic interactions, as well as bind covalently through a ligand substitution reaction in which the chloride ligand is displaced by a nucleobase. Likewise, [Pt(terpy)Cl]+ has proven to be a useful spectroscopic tag of proteins by covalently coordinating to cysteine, histidine and argenine residues, with a strong preference for the former. Some classic papers in the inorganic chemistry research literature report that the thiol side chain of the amino acid cysteine (Cys) reacts rapidly with [Pt(terpy)Cl]+ to displace chloride and coordinate via a sulfur atom. Preparation and elemental analysis of the complex [Pt(terpy)Cys]+ was first reported by Lippard and coworkers.2 Later, Ratilla et al. reported on an observation of an immediate color change upon mixing equimolar (1-5 mM) platinum and cysteine3 and similar results are observed for homocysteine and reduced glutathione. These thiols react even in neutral and weakly acidic solution, in which the thiol (having pKa = 8.3) exists mostly in the protonated form. Several other research teams also have investigated the kinetics of chloride ligand substitution by thiols for [Pt(terpy)Cl]+.4 You will investigate the reaction shown in Scheme C-1. Some additional useful background readings on ligand substitution reactions and the kinetic trans effect (see Schriver, Atkins Inorganic Chemistry, 2nd Ed. p. 618-629) may be useful to review.
1 Cummings, Scott D. Coordination Chemistry Reviews 2009, 253(9-11), 1495-1516. 2 Howe-Grant, M.; Wu, K. C.; Bauer, W. R.; Lippard, S. J. Biochemistry 1976, 15, 4339-46. 3 Ratilla, E. M. A.; Brothers, H. M.; Kostic, N. M. Journal of the American Chemical Society 1987, 109, 4592-4599. 4 Cummings, S. D. Coordination Chemistry Reviews 2009, 253(3-4), 449-478.
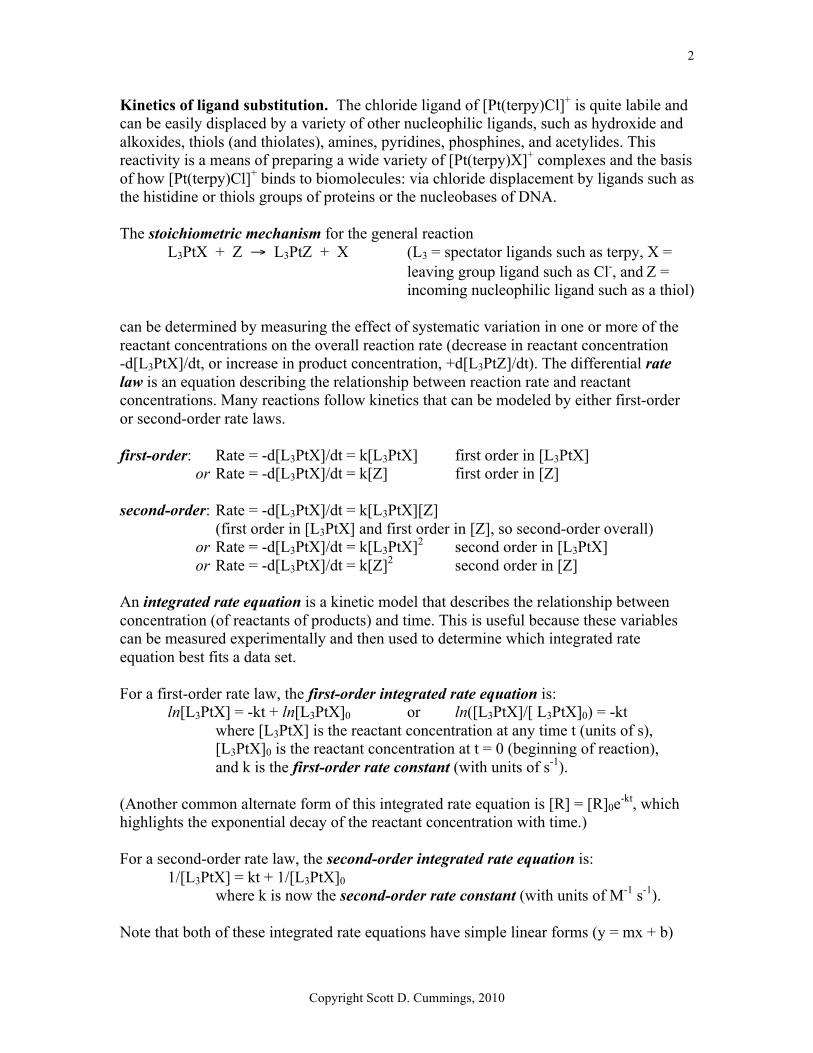
Scheme C-1: The ligand substitution reaction of [Pt(terpy)Cl]+ with a thiol RSH.
2
Copyright Scott D. Cummings, 2010
Kinetics of ligand substitution. The chloride ligand of [Pt(terpy)Cl]+ is quite labile and can be easily displaced by a variety of other nucleophilic ligands, such as hydroxide and alkoxides, thiols (and thiolates), amines, pyridines, phosphines, and acetylides. This reactivity is a means of preparing a wide variety of [Pt(terpy)X]+ complexes and the basis of how [Pt(terpy)Cl]+ binds to biomolecules: via chloride displacement by ligands such as the histidine or thiols groups of proteins or the nucleobases of DNA. The stoichiometric mechanism for the general reaction
L3PtX + Z → L3PtZ + X (L3 = spectator ligands such as terpy, X = leaving group ligand such as Cl-, and Z = incoming nucleophilic ligand such as a thiol)
can be determined by measuring the effect of systematic variation in one or more of the reactant concentrations on the overall reaction rate (decrease in reactant concentration -d[L3PtX]/dt, or increase in product concentration, +d[L3PtZ]/dt). The differential rate law is an equation describing the relationship between reaction rate and reactant concentrations. Many reactions follow kinetics that can be modeled by either first-order or second-order rate laws. first-order: Rate = -d[L3PtX]/dt = k[L3PtX] first order in [L3PtX]
or Rate = -d[L3PtX]/dt = k[Z] first order in [Z] second-order: Rate = -d[L3PtX]/dt = k[L3PtX][Z]
(first order in [L3PtX] and first order in [Z], so second-order overall) or Rate = -d[L3PtX]/dt = k[L3PtX]2 second order in [L3PtX] or Rate = -d[L3PtX]/dt = k[Z]2 second order in [Z]
An integrated rate equation is a kinetic model that describes the relationship between concentration (of reactants of products) and time. This is useful because these variables can be measured experimentally and then used to determine which integrated rate equation best fits a data set. For a first-order rate law, the first-order integrated rate equation is:
ln[L3PtX] = -kt + ln[L3PtX]0 or ln([L3PtX]/[ L3PtX]0) = -kt where [L3PtX] is the reactant concentration at any time t (units of s), [L3PtX]0 is the reactant concentration at t = 0 (beginning of reaction), and k is the first-order rate constant (with units of s-1).
(Another common alternate form of this integrated rate equation is [R] = [R]0e-kt, which highlights the exponential decay of the reactant concentration with time.) For a second-order rate law, the second-order integrated rate equation is:
1/[L3PtX] = kt + 1/[L3PtX]0 where k is now the second-order rate constant (with units of M-1 s-1).
Note that both of these integrated rate equations have simple linear forms (y = mx + b)
3
Copyright Scott D. Cummings, 2010
The rate law for a reaction can be established from experimental kinetic measurements, but keep in mind that orders of a rate law may or may not have a direct connection to the stoichiometry of the equation describing the overall reaction. Collecting data for [L3PtX] as a function of time and fitting possible integrated rate equations to the data set may reveal which integrated rate equation best models the reactions kinetics. Specifically, a plot of ln[L3PtX] vs. t should be linear for a reaction following a first-order rate law, while a plot of 1/[L3PtX] vs. t should be linear for a reaction following a second-order rate law. Also, the rate constant k can be obtained from the slope of the linear fit. Finally, keep in mind that some reactions follow neither simple first or second order rate laws, such that experimental data will not fit either of these equations. Often, one reactant is present in excess concentration (10-fold or greater) over the other reactant concentration, such that its concentration changes very little throughout the course of the reaction. A common approximation is that the concentration of the excess reactant is constant and it can be grouped with the rate constant k. For example, if [Z] >> [L3PtX], then a second-order rate law of the form:
Rate = -d[L3PtX]/dt = k[L3PtX][Z] could be written as: Rate = -d[L3PtX]/dt = k’[L3PtX] where k’ = k[Z]. Under this experimental condition, the reaction appears to follow first-order kinetics (i.e. a plot of ln[L3PtX] vs t will be linear) even though the reaction is actually second-order. This situation is commonly called pseudo-first order kinetics. (Note that k is a second-order rate constant, while k’ is a first order rate constant.) But, the pseudo-first order rate constant k’ depends on [Z], which offers an experimental method for determining both the rate law and the second-order rate constant. By systematically varying [Z]—but always keeping it in excess—the reaction rate and pseudo-first order rate constant k’ should vary accordingly. Using results from several kinetic trials, a plot of k’ vs. [Z] can be used to determine k and establish the order with respect to [Z]. Information about the stoichiometric mechanism can be elucidated from the experimentally-determined rate law. Species appearing in the rate law contribute to the formation of the transition state for the rate-determining step(s). Ligand-substitution reactions of coordination compounds often follow mechanisms that are:
• dissociative (D), by which a ligand (X) leaves the coordination sphere in one step, resulting in the formation of an intermediate of reduced coordination number, and an entering group (Z) coordinates in a second step.
• associative (A), by which an entering group (Z) coordinates in a first step, resulting in the formation of an intermediate of increased coordination number, a second ligand (X) leaves the coordination sphere in a second step.
• interchange (I), by which an entering group (Z) coordinates as another ligand (X) leaves the coordination sphere, in one step without the formation of an intermediate.
4
Copyright Scott D. Cummings, 2010
Different mechanisms may involve different rate laws, so experimental kinetic data is a useful way to establish the nature of the reaction mechanism. Also, we may consider the nature of square-planar Pt(II) complexes to eliminate unlikely mechanisms. Let us consider three mechanisms that match the overall reaction under investigation: L3PtX + Z → L3PtZ + X Your goal for this experiment is to obtain experimental evidence to support one of them. First, consider a dissociative mechanism (Scheme C-2). The ligand X may reversibly dissociate to yield a three-coordinate complex intermediate, which then reacts with the incoming nucleophilic ligand Z to form the product.
From this mechanism, we can derive a rate law. Consider the rate of the reaction to be the rate of product formation (you’ll see that this is experimentally simple to detect):
Rate of reaction = +d[L3PtZ]/dt The product forms in the second step of the mechanism, which is a bimolecular reaction between the three-coordinate intermediate L3Pt and nucleophilic entering ligand Z, and has a second-order rate law:
Rate of reaction = +d[L3PtZ]/dt = k2[L3Pt][Z]
But, a rate law should not be written in terms of the concentration of an intermediate. With a little chemical intuition, we can guess that this three-coordinate intermediate is highly reactive. After all, four-coordinate square-planar complexes are already coordinatively unsaturated. So, this may be a good candidate for applying the Steady-State Approximation (SSA), which assumes that the concentration of a reactive intermediate is approximately constant: the rate or rates that form it are equal to the rate or rates that deplete it. Applying the SSA to [L3Pt]: k1[L3Pt-X] = k-1[L3Pt][X] + k2[L3Pt][Z]
so [L3Pt] = k1[L3Pt-X] / k-1[X] + k2[Z] Substituting this expression back into the overall reaction rate law yields:
Rate of reaction = k1k2[L3PtX][Z] / k-1[X] + k2[Z]
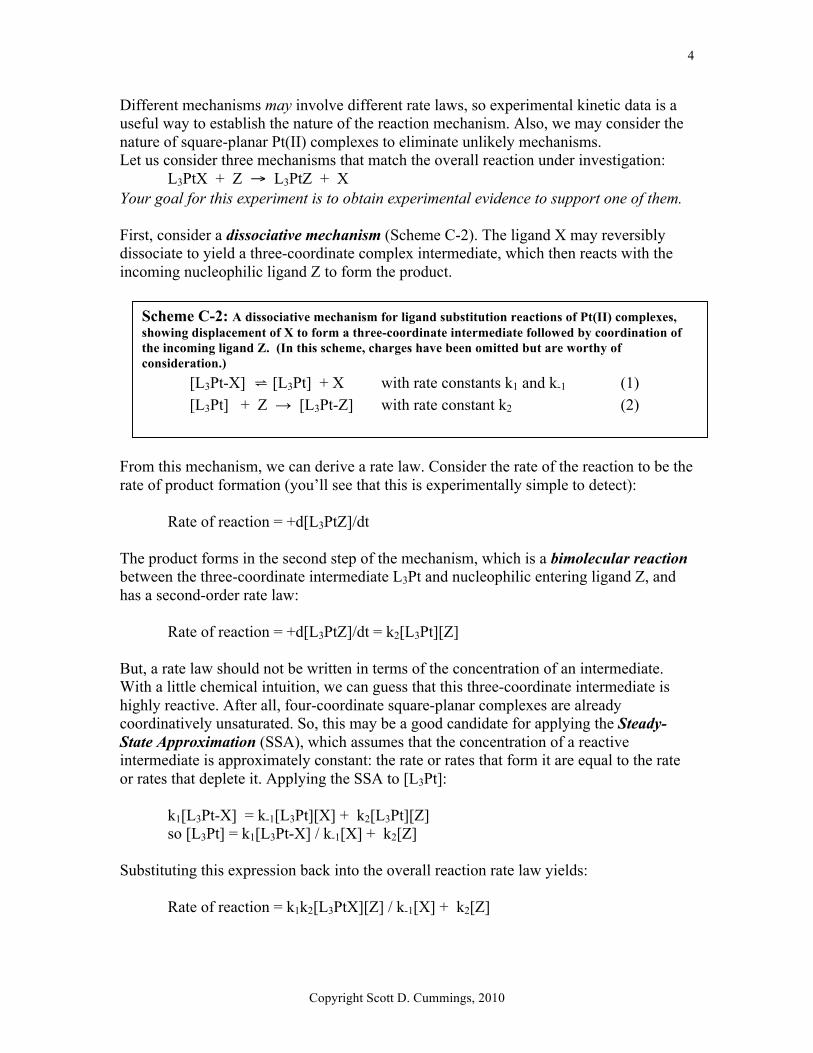
Scheme C-2: A dissociative mechanism for ligand substitution reactions of Pt(II) complexes, showing displacement of X to form a three-coordinate intermediate followed by coordination of the incoming ligand Z. (In this scheme, charges have been omitted but are worthy of consideration.)
[L3Pt-X] ⇌ [L3Pt] + X with rate constants k1 and k-1 (1) [L3Pt] + Z → [L3Pt-Z] with rate constant k2 (2)
5
Copyright Scott D. Cummings, 2010
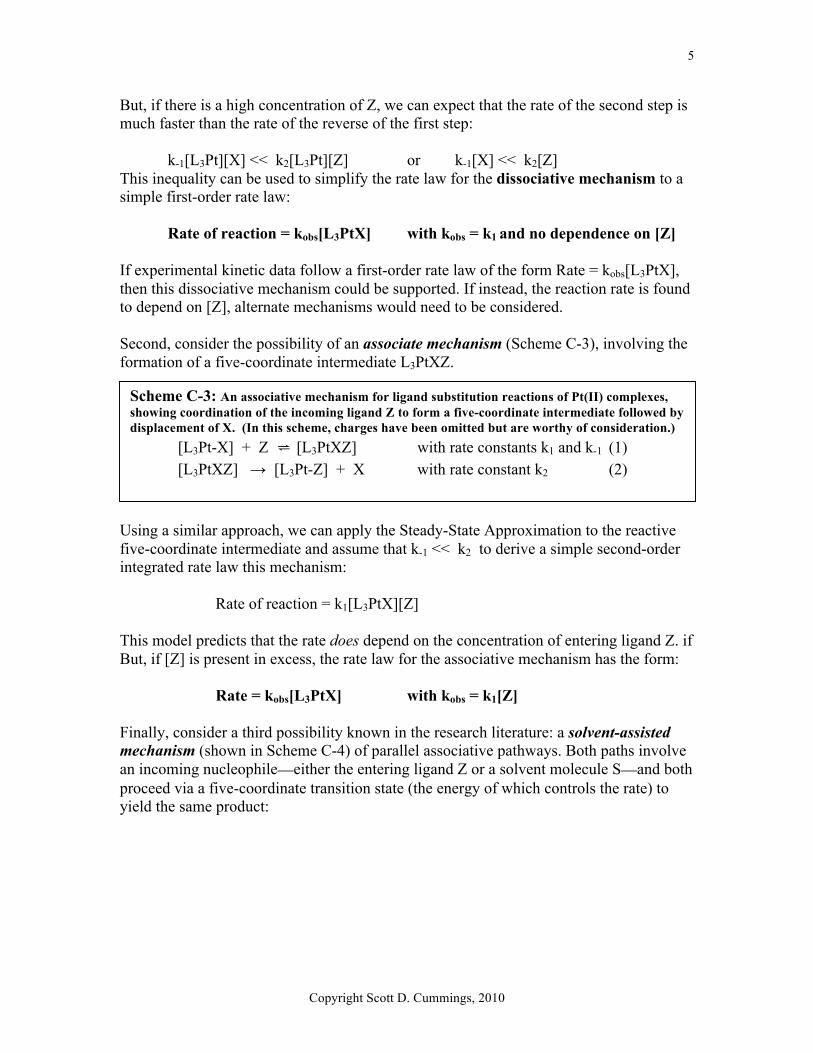
But, if there is a high concentration of Z, we can expect that the rate of the second step is much faster than the rate of the reverse of the first step:
k-1[L3Pt][X] << k2[L3Pt][Z] or k-1[X] << k2[Z]
This inequality can be used to simplify the rate law for the dissociative mechanism to a simple first-order rate law:
Rate of reaction = kobs[L3PtX] with kobs = k1 and no dependence on [Z] If experimental kinetic data follow a first-order rate law of the form Rate = kobs[L3PtX], then this dissociative mechanism could be supported. If instead, the reaction rate is found to depend on [Z], alternate mechanisms would need to be considered. Second, consider the possibility of an associate mechanism (Scheme C-3), involving the formation of a five-coordinate intermediate L3PtXZ.
Using a similar approach, we can apply the Steady-State Approximation to the reactive five-coordinate intermediate and assume that k-1 << k2 to derive a simple second-order integrated rate law this mechanism:
Rate of reaction = k1[L3PtX][Z] This model predicts that the rate does depend on the concentration of entering ligand Z. if But, if [Z] is present in excess, the rate law for the associative mechanism has the form:
Rate = kobs[L3PtX] with kobs = k1[Z] Finally, consider a third possibility known in the research literature: a solvent-assisted mechanism (shown in Scheme C-4) of parallel associative pathways. Both paths involve an incoming nucleophile—either the entering ligand Z or a solvent molecule S—and both proceed via a five-coordinate transition state (the energy of which controls the rate) to yield the same product:
Scheme C-3: An associative mechanism for ligand substitution reactions of Pt(II) complexes, showing coordination of the incoming ligand Z to form a five-coordinate intermediate followed by displacement of X. (In this scheme, charges have been omitted but are worthy of consideration.)
[L3Pt-X] + Z ⇌ [L3PtXZ] with rate constants k1 and k-1 (1) [L3PtXZ] → [L3Pt-Z] + X with rate constant k2 (2)
6
Copyright Scott D. Cummings, 2010
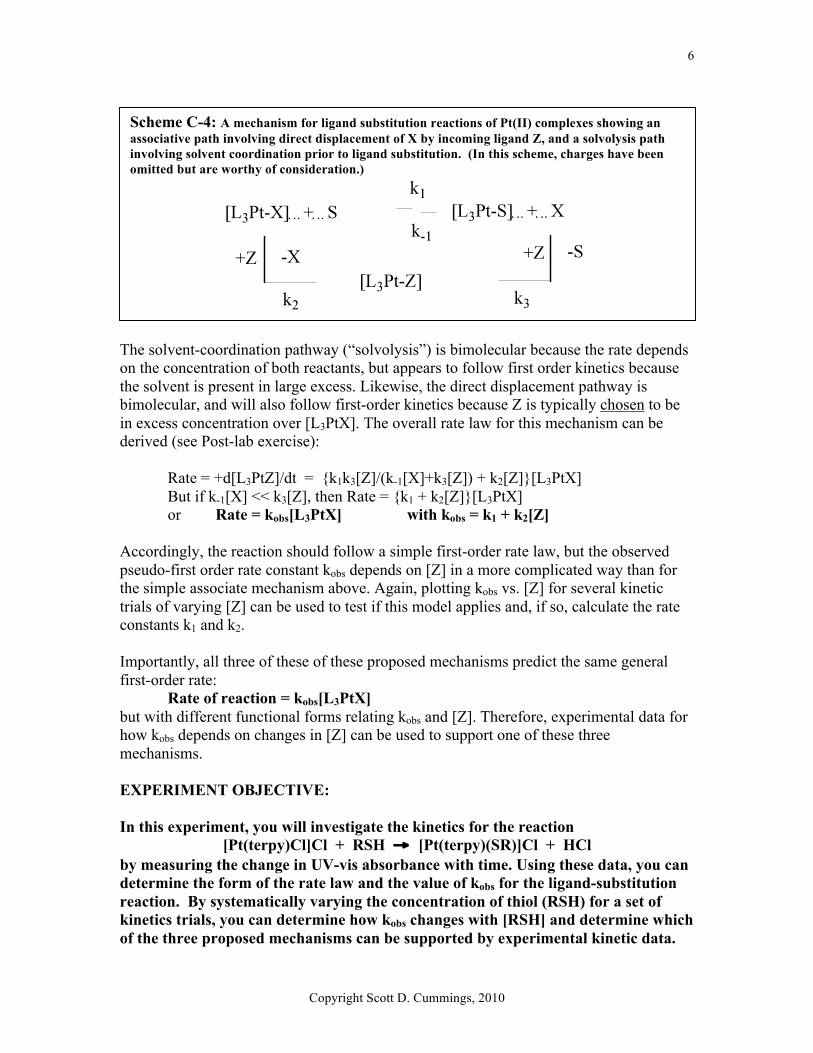
The solvent-coordination pathway (“solvolysis”) is bimolecular because the rate depends on the concentration of both reactants, but appears to follow first order kinetics because the solvent is present in large excess. Likewise, the direct displacement pathway is bimolecular, and will also follow first-order kinetics because Z is typically chosen to be in excess concentration over [L3PtX]. The overall rate law for this mechanism can be derived (see Post-lab exercise):
Rate = +d[L3PtZ]/dt = {k1k3[Z]/(k-1[X]+k3[Z]) + k2[Z]}[L3PtX] But if k-1[X] << k3[Z], then Rate = {k1 + k2[Z]}[L3PtX] or Rate = kobs[L3PtX] with kobs = k1 + k2[Z]
Accordingly, the reaction should follow a simple first-order rate law, but the observed pseudo-first order rate constant kobs depends on [Z] in a more complicated way than for the simple associate mechanism above. Again, plotting kobs vs. [Z] for several kinetic trials of varying [Z] can be used to test if this model applies and, if so, calculate the rate constants k1 and k2. Importantly, all three of these of these proposed mechanisms predict the same general first-order rate:
Rate of reaction = kobs[L3PtX] but with different functional forms relating kobs and [Z]. Therefore, experimental data for how kobs depends on changes in [Z] can be used to support one of these three mechanisms. EXPERIMENT OBJECTIVE: In this experiment, you will investigate the kinetics for the reaction
[Pt(terpy)Cl]Cl + RSH → [Pt(terpy)(SR)]Cl + HCl by measuring the change in UV-vis absorbance with time. Using these data, you can determine the form of the rate law and the value of kobs for the ligand-substitution reaction. By systematically varying the concentration of thiol (RSH) for a set of kinetics trials, you can determine how kobs changes with [RSH] and determine which of the three proposed mechanisms can be supported by experimental kinetic data.
Scheme C-4: A mechanism for ligand substitution reactions of Pt(II) complexes showing an associative path involving direct displacement of X by incoming ligand Z, and a solvolysis path involving solvent coordination prior to ligand substitution. (In this scheme, charges have been omitted but are worthy of consideration.)
7
Copyright Scott D. Cummings, 2010
Experimental Procedure: Physical data:
• MeSO3H: 96.11 g/mol, δ =1.039 g/mL • [Pt(terpy)Cl]Cl⋅2H2O: 535.29 g/mol • PrSH: 76.16 g/mol, δ = 0.841 g/mL
_____________________________________________________________________ Safety notes: • Goggles must be work at all times you are in the lab. • Gloves must be worn when working with all platinum reagents. • All work involving thiols must be done in a fume hood. Quench glassware & gloves
with H2O2/OH-(aq) _____________________________________________________________________ Adapted from Annibale, G.; Brandolisio, M.; Bugarcic Z. and Cattalini, L.* “Nucleophilicity of Thiols Towards Planar Tetracoordinated Platinum(II) Complexes” Transition Metal Chemistry 1998, 23, 715-719. The reaction of [Pt(terpy)Cl]+ with thiols (RSH) is sufficiently slow to be followed spectrophotometrically by measuring the changing absorbance at a suitable wavelength as a function of time. Because most reaction rates depend on temperature, you need a method for controlling the T of all reaction solutions before and throughout the kinetic trials. A circulating water bath can be connected to the UV-vis spectrophotometer, and also used to adjust the temperature of stock solutions. You will prepare a series of solutions having a constant [Pt] and a varying [RSH] for kinetics trials to: (1) determine the order of the reaction with respect to [thiol], and (2) elucidate the mechanism of the reaction. Thiols smell very bad. Work with these solutions in a fume hood and keep vials and cuvettes capped tightly when not in a hood. Quench residual thiol on glassware and gloves with a solution of H2O2/OH-(aq). Part 1: preparation of reactant solutions All solutions for kinetic trials should be run at constant acidity and ionic strength using 0.10 M MeSO3H in MeOH·H2O (95-5, v/v) solvent mixture. This acid concentration ensures that all RSH is present in thiol (not thiolate) form and that the Pt complex does not undergo any appreciable solvolysis. You will need ~45 mL of this solvent mixture, so prepare 50 mL total. BEFORE COMING TO LAB, calculate what volumes of MeSO3H, MeOH and H2O are needed and prepare 0.10 M MeSO3H in MeOH·H2O (95-5, v/v). Use this mixture as the solvent for all subsequent solutions and dilutions, so as to maintain the proper pH.
8
Copyright Scott D. Cummings, 2010
You will need to devise methods for preparing stock solutions of [Pt(terpy)Cl]+ (“Pt”) and thiol (“RSH”) and a series of kinetic trial solutions. Here are some important considerations: • You should conduct at least 6 trials, having a constant [Pt] and a varying [RSH]. • An appropriate concentration of [Pt(terpy)Cl]+ is determined by its absorption
properties. Ideally, the [Pt] for the trial solutions should such that absorption bands in the ~330-350 nm range have a maximum absorbance of ~0.5. The molar absorptivity for [Pt(terpy)Cl]+(aq) is ε340 = 13,300 M-1 cm-1.5 Recall how to determine [Pt] from its absorption spectrum.
• Appropriate RSH concentrations are in the range of ~2 × 10⁻³ < [RSH] < ~4 × 10⁻² for reasonable reaction rates. Keep in mind that for all the kinetic trials in the series, the concentration of the entering thiol ligand should be in large enough excess over [Pt] and systematically varied in order to determine how the rate is affected by [RSH].
• As soon as the “Pt” and “RSH” reactant solutions are mixed, the reaction starts and you should immediately begin the kinetics measurements. So, consider the order you use to mix solutions.
• The minimum volume of the cuvette is 3.0 mL and maximum volume is ~3.9 mL. You should aim for 3.1-3.4 mL total volume for a trial solution.
• Try to conserve the amount of solvent (MeOH) and [Pt(terpy)Cl]+ you use as much as possible.
• Prepare slightly more solution than you need, in case you spill or want to repeat a trial. • Take care to prevent solvent evaporation! Store solutions in tightly sealed containers
(vials, volumetric flasks) and use parafilm. • To check that your Pt stock solution has not decomposed over the course of days or
weeks, obtain a new absorption spectrum of sample solution 0 and compare to the original. A change in the absorbance or band shape may indicate decomposition.
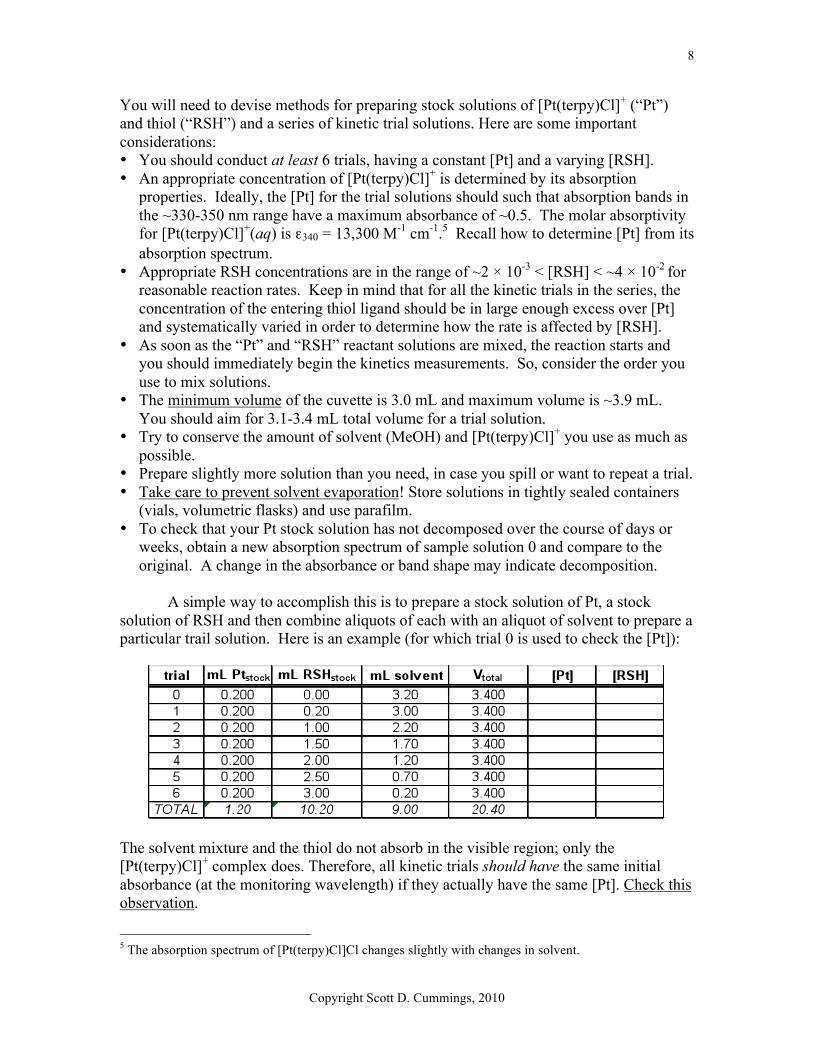
A simple way to accomplish this is to prepare a stock solution of Pt, a stock
solution of RSH and then combine aliquots of each with an aliquot of solvent to prepare a particular trail solution. Here is an example (for which trial 0 is used to check the [Pt]):
The solvent mixture and the thiol do not absorb in the visible region; only the [Pt(terpy)Cl]+ complex does. Therefore, all kinetic trials should have the same initial absorbance (at the monitoring wavelength) if they actually have the same [Pt]. Check this observation.
5 The absorption spectrum of [Pt(terpy)Cl]Cl changes slightly with changes in solvent.
9
Copyright Scott D. Cummings, 2010
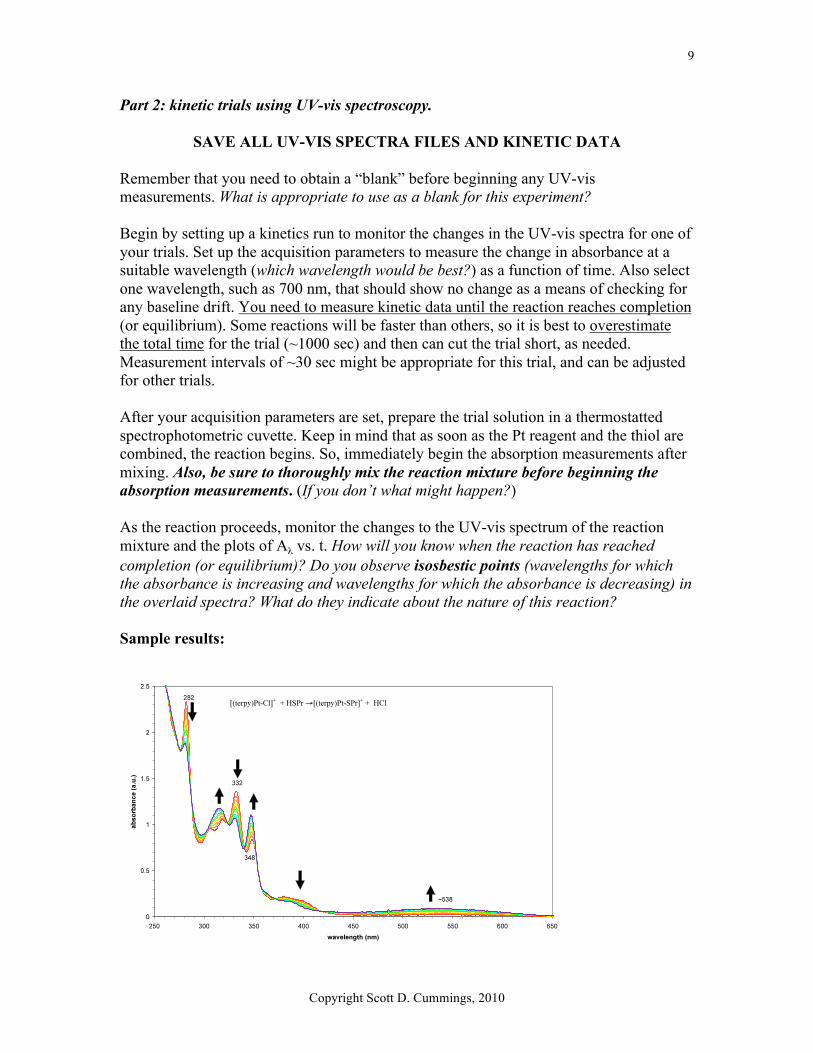
Part 2: kinetic trials using UV-vis spectroscopy.
SAVE ALL UV-VIS SPECTRA FILES AND KINETIC DATA Remember that you need to obtain a “blank” before beginning any UV-vis measurements. What is appropriate to use as a blank for this experiment? Begin by setting up a kinetics run to monitor the changes in the UV-vis spectra for one of your trials. Set up the acquisition parameters to measure the change in absorbance at a suitable wavelength (which wavelength would be best?) as a function of time. Also select one wavelength, such as 700 nm, that should show no change as a means of checking for any baseline drift. You need to measure kinetic data until the reaction reaches completion (or equilibrium). Some reactions will be faster than others, so it is best to overestimate the total time for the trial (~1000 sec) and then can cut the trial short, as needed. Measurement intervals of ~30 sec might be appropriate for this trial, and can be adjusted for other trials. After your acquisition parameters are set, prepare the trial solution in a thermostatted spectrophotometric cuvette. Keep in mind that as soon as the Pt reagent and the thiol are combined, the reaction begins. So, immediately begin the absorption measurements after mixing. Also, be sure to thoroughly mix the reaction mixture before beginning the absorption measurements. (If you don’t what might happen?) As the reaction proceeds, monitor the changes to the UV-vis spectrum of the reaction mixture and the plots of Aλ vs. t. How will you know when the reaction has reached completion (or equilibrium)? Do you observe isosbestic points (wavelengths for which the absorbance is increasing and wavelengths for which the absorbance is decreasing) in the overlaid spectra? What do they indicate about the nature of this reaction? Sample results:
10
Copyright Scott D. Cummings, 2010
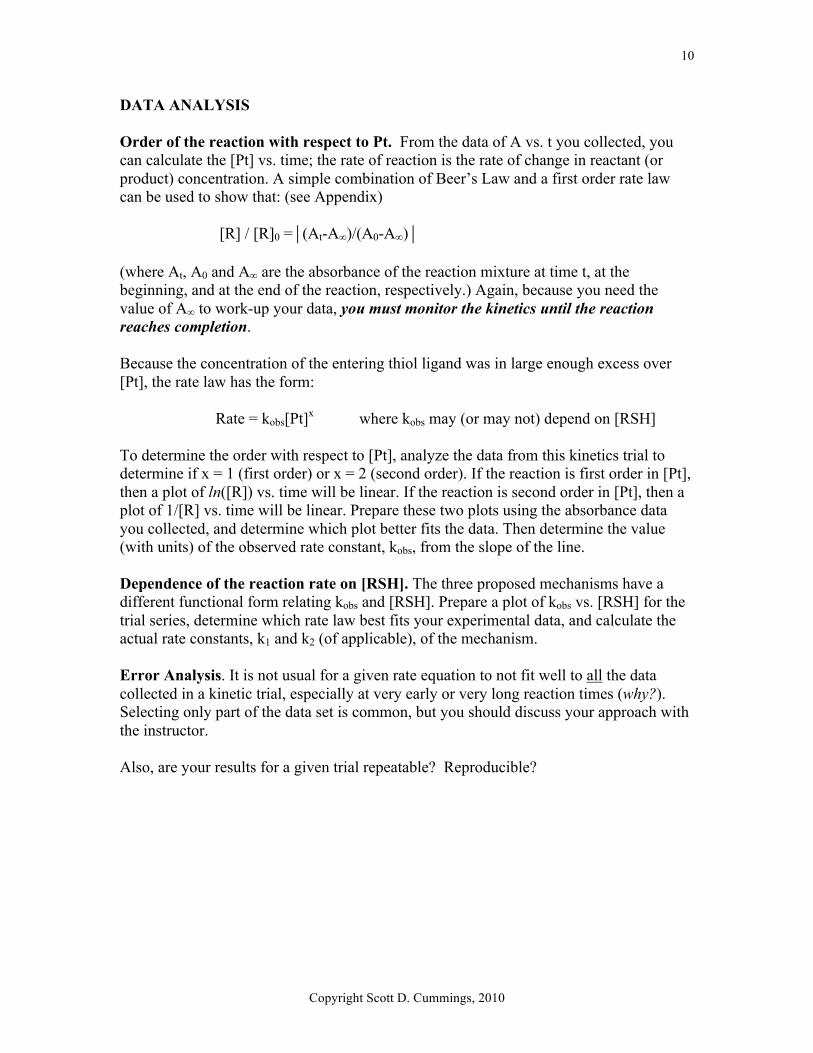
DATA ANALYSIS Order of the reaction with respect to Pt. From the data of A vs. t you collected, you can calculate the [Pt] vs. time; the rate of reaction is the rate of change in reactant (or product) concentration. A simple combination of Beer’s Law and a first order rate law can be used to show that: (see Appendix)
[R] / [R]0 =(At-A∞)/(A0-A∞) (where At, A0 and A∞ are the absorbance of the reaction mixture at time t, at the beginning, and at the end of the reaction, respectively.) Again, because you need the value of A∞ to work-up your data, you must monitor the kinetics until the reaction reaches completion. Because the concentration of the entering thiol ligand was in large enough excess over [Pt], the rate law has the form:
Rate = kobs[Pt]x where kobs may (or may not) depend on [RSH]
To determine the order with respect to [Pt], analyze the data from this kinetics trial to determine if x = 1 (first order) or x = 2 (second order). If the reaction is first order in [Pt], then a plot of ln([R]) vs. time will be linear. If the reaction is second order in [Pt], then a plot of 1/[R] vs. time will be linear. Prepare these two plots using the absorbance data you collected, and determine which plot better fits the data. Then determine the value (with units) of the observed rate constant, kobs, from the slope of the line. Dependence of the reaction rate on [RSH]. The three proposed mechanisms have a different functional form relating kobs and [RSH]. Prepare a plot of kobs vs. [RSH] for the trial series, determine which rate law best fits your experimental data, and calculate the actual rate constants, k1 and k2 (of applicable), of the mechanism. Error Analysis. It is not usual for a given rate equation to not fit well to all the data collected in a kinetic trial, especially at very early or very long reaction times (why?). Selecting only part of the data set is common, but you should discuss your approach with the instructor. Also, are your results for a given trial repeatable? Reproducible?
11
Copyright Scott D. Cummings, 2010
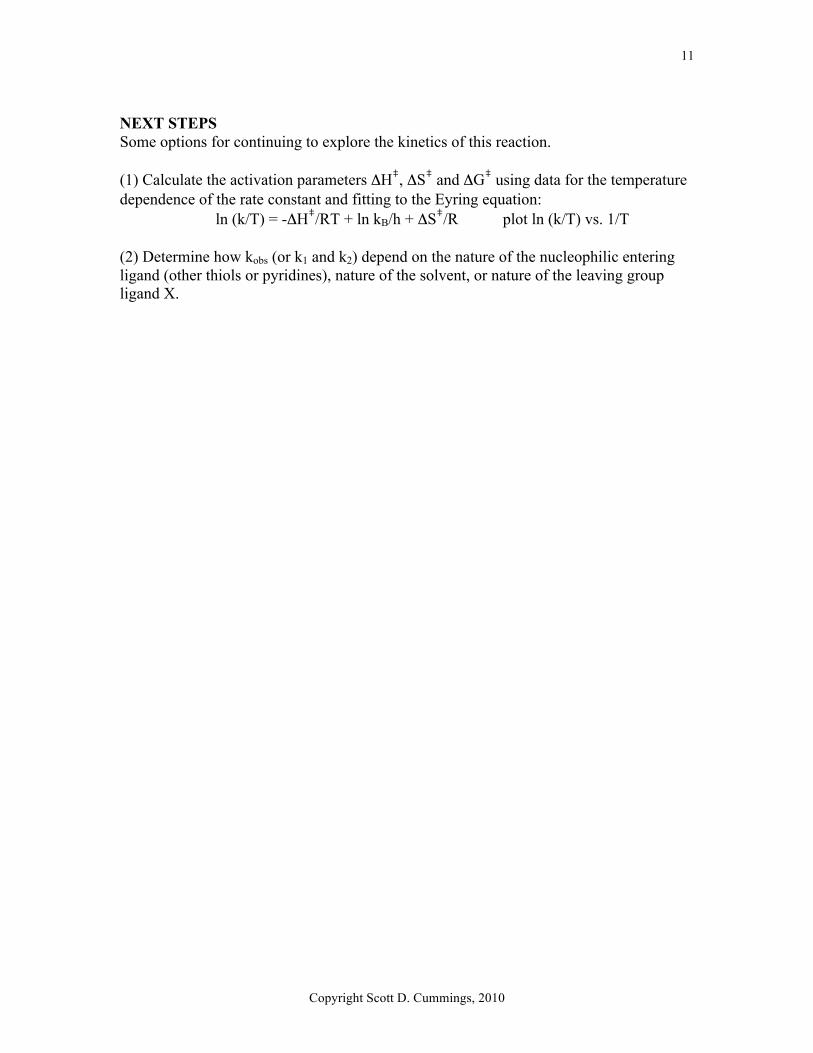
NEXT STEPS Some options for continuing to explore the kinetics of this reaction. (1) Calculate the activation parameters ΔH‡, ΔS‡ and ΔG‡ using data for the temperature dependence of the rate constant and fitting to the Eyring equation:
ln (k/T) = -ΔH‡/RT + ln kB/h + ΔS‡/R plot ln (k/T) vs. 1/T (2) Determine how kobs (or k1 and k2) depend on the nature of the nucleophilic entering ligand (other thiols or pyridines), nature of the solvent, or nature of the leaving group ligand X.
12
Copyright Scott D. Cummings, 2010
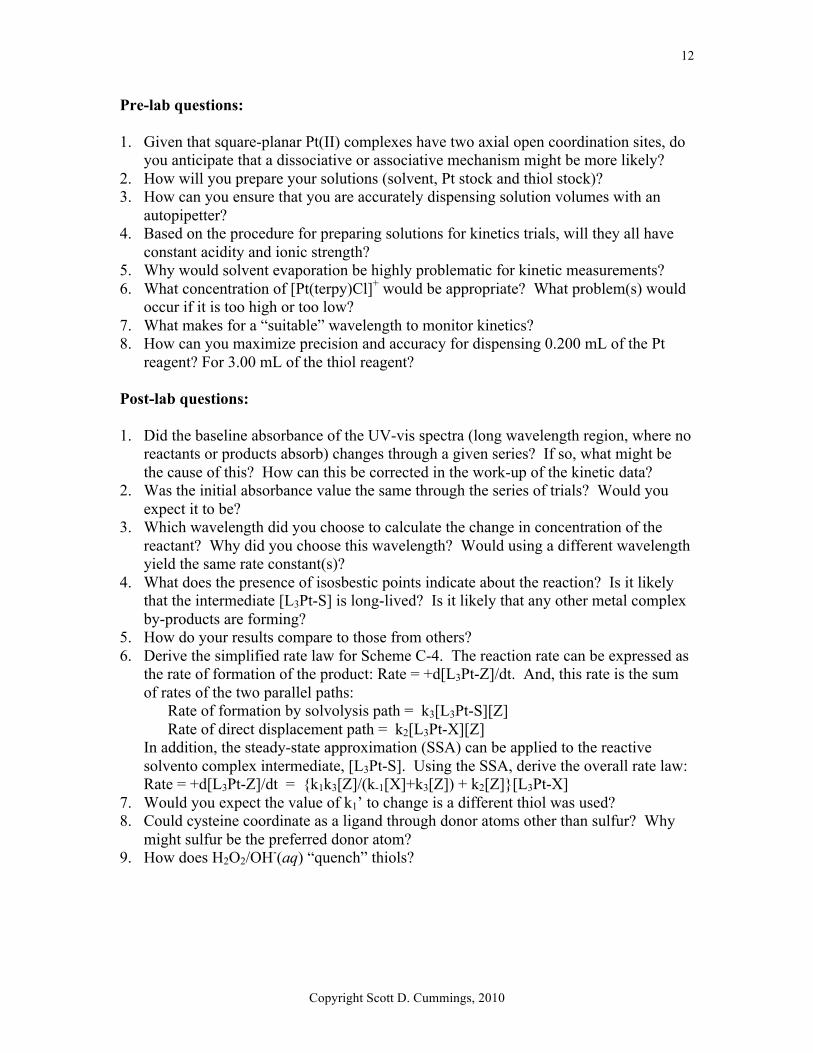
Pre-lab questions: 1. Given that square-planar Pt(II) complexes have two axial open coordination sites, do
you anticipate that a dissociative or associative mechanism might be more likely? 2. How will you prepare your solutions (solvent, Pt stock and thiol stock)? 3. How can you ensure that you are accurately dispensing solution volumes with an
autopipetter? 4. Based on the procedure for preparing solutions for kinetics trials, will they all have
constant acidity and ionic strength? 5. Why would solvent evaporation be highly problematic for kinetic measurements? 6. What concentration of [Pt(terpy)Cl]+ would be appropriate? What problem(s) would
occur if it is too high or too low? 7. What makes for a “suitable” wavelength to monitor kinetics? 8. How can you maximize precision and accuracy for dispensing 0.200 mL of the Pt
reagent? For 3.00 mL of the thiol reagent? Post-lab questions: 1. Did the baseline absorbance of the UV-vis spectra (long wavelength region, where no
reactants or products absorb) changes through a given series? If so, what might be the cause of this? How can this be corrected in the work-up of the kinetic data?
2. Was the initial absorbance value the same through the series of trials? Would you expect it to be?
3. Which wavelength did you choose to calculate the change in concentration of the reactant? Why did you choose this wavelength? Would using a different wavelength yield the same rate constant(s)?
4. What does the presence of isosbestic points indicate about the reaction? Is it likely that the intermediate [L3Pt-S] is long-lived? Is it likely that any other metal complex by-products are forming?
5. How do your results compare to those from others? 6. Derive the simplified rate law for Scheme C-4. The reaction rate can be expressed as
the rate of formation of the product: Rate = +d[L3Pt-Z]/dt. And, this rate is the sum of rates of the two parallel paths:
Rate of formation by solvolysis path = k3[L3Pt-S][Z] Rate of direct displacement path = k2[L3Pt-X][Z]
In addition, the steady-state approximation (SSA) can be applied to the reactive solvento complex intermediate, [L3Pt-S]. Using the SSA, derive the overall rate law: Rate = +d[L3Pt-Z]/dt = {k1k3[Z]/(k-1[X]+k3[Z]) + k2[Z]}[L3Pt-X]
7. Would you expect the value of k1’ to change is a different thiol was used? 8. Could cysteine coordinate as a ligand through donor atoms other than sulfur? Why
might sulfur be the preferred donor atom? 9. How does H2O2/OH-(aq) “quench” thiols?

13
Copyright Scott D. Cummings, 2010
Kinetics measurements using the HP/Agilent 8453 UV-vis spectrophotometer I. Set-up A. Turn on UV-vis spectrophotometer and temperature-controlled sample holder B. Enter KINETICS mode of software. In Setup, select the following parameters:
1. wavelengths (nm): select one (or more) wavelength of maximum change and select one (or more) wavelengths that should remain at 0 to monitor any drift in the baseline.
2. select view as all spectra (not last spectrum) 3. select a total time*, start time = 0, interval*, and increment = 5%
* the total time and interval depend on the reaction rate. You will need a value for A∞, so it is better to overestimate the total time than to have the kinetic data collection end before the reaction reaches completion. Typically, try to collect ~10-20 spectra for the full trial; more than 50 spectra is excessive.
C. Allow lamps to warm up for at least 15 minutes before making quantitative measurements.
D. Take a blank spectrum using the same cuvette (with same orientation) and solvent as the sample.
II. Prepare sample solutions and run kinetics A. In a clean quartz UV-vis cuvette, add one reagent (solution #1) and a micro spinbar
and place in the thermostatted cuvette holder to equilibrate the temperature. B. Prepare the second reagent (solution #2) and allow it to equilibrate to the same T. C. Select Time Based Measurements, give or change a file name (*.kd). D. Add solution #2 to solution #1 and mix. Begin the kinetics trial as soon as possible
after mixing the solutions by pressing START. E. The absorbance value at the monitoring wavelength should be between ~0.4 and ~1.5.
If far outside of this range, do not continue with the kinetics trial; prepare a new stock solution #2 of more appropriate concentration.
F. Monitor the absorption change until it reaches a steady value. If the kinetics total time has not yet been reached, press ABORT and then go to File → load data to open the partial kinetics data file.
G. After the kinetics trial is complete, go to View → All Spectra and inspect the full UV-vis absorption spectra for isosbestic points and a steady baseline.
H. To export date: click on data set you want to export (it will be highlighted), the select File → export to save as a *.csv file, which can be opened in Excel.
I. You can save your kinetic trial parameters as a method file (*.m) for making repeated measurements simpler.
14
Copyright Scott D. Cummings, 2010
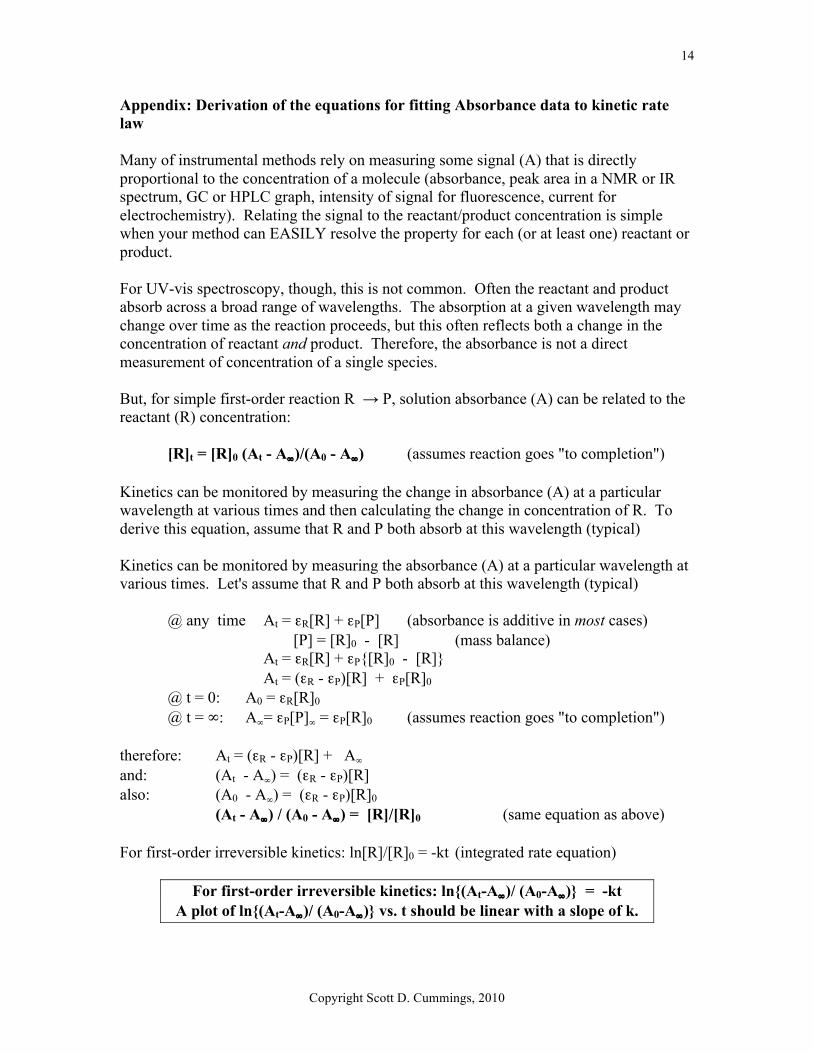
Appendix: Derivation of the equations for fitting Absorbance data to kinetic rate law Many of instrumental methods rely on measuring some signal (A) that is directly proportional to the concentration of a molecule (absorbance, peak area in a NMR or IR spectrum, GC or HPLC graph, intensity of signal for fluorescence, current for electrochemistry). Relating the signal to the reactant/product concentration is simple when your method can EASILY resolve the property for each (or at least one) reactant or product. For UV-vis spectroscopy, though, this is not common. Often the reactant and product absorb across a broad range of wavelengths. The absorption at a given wavelength may change over time as the reaction proceeds, but this often reflects both a change in the concentration of reactant and product. Therefore, the absorbance is not a direct measurement of concentration of a single species. But, for simple first-order reaction R → P, solution absorbance (A) can be related to the reactant (R) concentration:
[R]t = [R]0 (At - A∞)/(A0 - A∞) (assumes reaction goes "to completion") Kinetics can be monitored by measuring the change in absorbance (A) at a particular wavelength at various times and then calculating the change in concentration of R. To derive this equation, assume that R and P both absorb at this wavelength (typical) Kinetics can be monitored by measuring the absorbance (A) at a particular wavelength at various times. Let's assume that R and P both absorb at this wavelength (typical)
@ any time At = εR[R] + εP[P] (absorbance is additive in most cases) [P] = [R]0 - [R] (mass balance)
At = εR[R] + εP{[R]0 - [R]} At = (εR - εP)[R] + εP[R]0
@ t = 0: A0 = εR[R]0 @ t = ∞: A∞= εP[P]∞ = εP[R]0 (assumes reaction goes "to completion")
therefore: At = (εR - εP)[R] + A∞ and: (At - A∞) = (εR - εP)[R] also: (A0 - A∞) = (εR - εP)[R]0 (At - A∞) / (A0 - A∞) = [R]/[R]0 (same equation as above) For first-order irreversible kinetics: ln[R]/[R]0 = -kt (integrated rate equation)
For first-order irreversible kinetics: ln{(At-A∞)/ (A0-A∞)} = -kt A plot of ln{(At-A∞)/ (A0-A∞)} vs. t should be linear with a slope of k.