kinetic study of crystallisation of sol-gel derived calcia...
TRANSCRIPT

1
Kinetic study of crystallisation of sol-gel derived calcia-
alumina binary compounds
Marjan Zahedi, Nima Roohpour and Asim K. Ray1
School of Engineering and Materials Science, Queen Mary, University of London,
Mile End Road London E1 4NS
Abstract
In-situ High Temperature X-Ray Diffraction (HTXRD) and Differential Scanning Calorimetric
(DSC) studies were performed on a sol-gel derived binary compound of a calcia-alumina
(C12A7) system consisting of calcium oxide (CaO) and aluminum oxide (Al2O3) in a ratio of
12:7 for in-situ investigation into the phase transformations under progressively increasing
thermal activation from room-temperature to 1200°C. The crystallisation of amorphous samples
formulated at room-temperature on magnesium oxide (MgO) single crystal (100) substrates was
found to be complete on heat treatment at 1100°C for 3 hours. This observation was further
supported by independent Fourier Transform Infrared (FTIR) and Raman Spectroscopies. Values
of 348 kJ/mol and 375 kJ/mol were estimated from Kissinger plots for activation energies of
crystallisation of CaO and Al2O3 constituents, respectively.
Keywords: sol-gel growth, heat treatment, Fourier transform infrared spectroscopy (FTIR),
Raman spectroscopy and scattering, thermogravimetric analysis (TGA), crystallisation,
1 Present address: The Wolfson Centre For Materials Processing, Brunel University, Uxbridge,
Middlesex UB8 3PH, UK Direct Line +44 (0)1895 267794, Fax +44 (0)1895 269737, Email

2
1. Introduction
Transparent oxides are extensively used in a wide range of applications in electronic and
optoelectronic systems including fully transparent high performance transistors, ultraviolet (UV)
light emitting diodes (LED) [1], invisible circuits [2], flat-panel displays, solar cells [3] and energy
conservation (smart windows) devices [4]. One promising transparent oxide that can be used as an
insulating, semiconducting or metallic layer, is the zeolite-like metal oxide compound
12CaO.7Al2O3 (C12A7). This novel oxide exhibits physically interesting properties by exploiting
its high-density intrinsic defect nanostructure [5].
The crystal growth of C12A7 is similar to that of zeolite crystals, where the oxygen ions work as
templates to grow the framework. Unlike zeolite crystals, these oxygen ions remain inside the
crystal as free ions trapped inside nano-sized cages. In each unit cell the framework is composed
of 116 atoms in the form of 12 Ca-O-Al cages, capable of taking up two O2-
ions into its
structure. The cages have an entrance of 0.1nm in diameter, which controls the elemental
substitution within the cages. Only a limited number of ions meet the criteria to be substituted for
the oxygen ions, inducing a wide range of exceptional characteristics into this oxide material [6-
8]. C12A7 single nanoparticles have been synthesized through different routes including solid-
state reaction at high temperature [9] and self-propagating combustion at low temperature [10].
We have recently reported the synthesis of C12A7 thin films on magnesium oxide (MgO) single
crystal (100) substrates using room temperature sol-gel technique [11]. The partial crystallisation
of the C12A7 thin film was observed at 800 0C and the crystallisation was completed on heat
treatment at 1100 0C for 3 hours. UV-visible optical spectra showed two absorption peaks at
5.3eV and 6.1eV. The peak at 5.3eV is believed to be associated with an O2-
- Cage Conduction
Band type transition whereas the Framework Valence Band to Framework Conduction Band
transition was found to be responsible for the peak at 6.1eV [12]. This sol-gel route produces
crystalline C12A7 nanoparticles loaded with O2-
/OH- ions through hydrolysis and condensation
process of precursor materials. The mono-dispersed, stable solution formed undergoes a series of
chemical reactions and phase transformations during hydrolysis, condensation and thermal
treatment. In this present investigation, an attempt has been made to study the effect of the
heating rate on crystallisation behavior and the activation energy of structural relaxation and
crystallisation has been determined. The peak temperature of crystallisation is known to depend
strongly upon the heating rate [13].

3
This paper reports the results of in situ X-Ray diffraction studies on the C12A7 samples as they
were vacuum annealed at different rates by progressively increasing the temperature from 25 0C
to 1200 0C. Differential scanning calorimetric (DSC) studies were performed to investigate the
crystallisation behavior. Further evidence for crystallisation of sol-gel synthesised C12A7
materials was obtained from FTIR and Raman spectroscopies. A range of chemical reactions and
phase transformations was identified through these structural and analytical characterisations to
be associated with sol-gel synthesis of C12A7, building on our previous work in this field of
study [11].
2. Experimental
The method consists of the preparation of binary compound of a calcia-alumina (C12A7) from
appropriate chemicals and spectroscopic studies for phase changes.
2.1 Materials
Aluminum sec-butoxide (Al[OCH(CH3)C2H5]3) known as (Al(OBu)3) with purity of 99.99% ,
ethyl acetoacetate (CH3COCH2COOC2H5) known as Etac with purity of ≥90.0% , calcium nitrate
tetrahydrate (Ca(NO3)2 · 4H2O) with purity of ≥90.0%, hydrochloric acid 1M (HCl) and ethanol
(CH3CH2OH) with purity of ≥98.0%, all chemicals were purchased from Sigma Aldrich Chemicals
Ltd., UK.
2.2 Sol-Gel synthesis of C12A7
C12A7 sol was synthesized through hydrolysis of two separate solutions. Aluminium oxide
hydroxide (AlOOH) sol was prepared using aluminium sec-butoxide Al(OBu)3 as the precursor. In
order to avoid precipitation this precursor was modified using ethyl acetoacetate (Etac), forming
Al(OBu)3 that is hydrolytically unstable and its hydrolysis leads to immediate precipitation.
However, the modification of Al(OBu)3 using ethyl acetoacetate (Etac) mediates the hydrolysis of
Al3+
ions, through substitution of monodentate butoxy ligands of Al(OBu)3 with Etac groups. Etac
groups will be bonded to Al atoms in an enolic form [14].
O O + Al+++
O
3
O
O
Al
O
O
2
(etac) + Al(OBu)3 Al(OBu)2(etac)

4
Al(OBu)3 was mixed with Etac with a molar ratio of Al(OBu)2 : Etac = 1:1. The mixture was
magnetically stirred for 30 minutes followed by 1 hour of ultrasonic mixing in an Ultrawave U50
Bath for 1 h in order to achieve the formation of a stable transparent C12A7 solution. An
Al(OBu)2 (Etac) complex was formed through this stage. This new precursor was diluted with
ethanol (Al(OBu)2 : ethanol = 1:4) prior to hydrolysis. In the final step, distilled water was
diluted with ethanol followed by pH regulation using hydrogen chloride (HCl) acid and
(Al(OBu)3: H2O :HCl = 1: 3: 0.15). Diluted distilled water was then added to the Al(OBu)2
(Etac) solution initiating the hydrolysis process. The hydrolysis was performed under vigorous
stirring using an ultrasonic bath at 1000Hz, followed by gentle stirring (~400 r.p.m) at room
temperature for 24 hours using a RCT basic safety control IKAMA magnetic stirrer. During
hydrolysis of the modified Al(OBu)2(Etac) compound, Etac groups will be separated from the
compound in both enolic and ketonic forms. Following the separation of butoxy ligands, AlO
bonding will be exposed to OH bonding of water, resulting in the formation of boehmite ((γ-
AlO(OH))). The reaction at this water content may be derived as:
OHH2CetacO)AlOOH(HO3H(etac))HAl(OC 9422294
The acid concentration used in the synthesis of AlOOH particles was chosen at molar ratio of
Al(OBu)3 : HCl = 1 : 0.15, thereby reducing the pH of the solution from 10.4 to 8 [15,16], well
below the isoelectric point of boehmite particles. Such acid regulation will reduce the chance of
agglomeration due to Columbic interactions between particles [17, 18]. The final product was
AlOOH molecules dissolved in ethanol. A second solution was prepared using Ca(NO3)2 . 4H2O
dissolved in ethanol. Additional water was added to the solution (Ca(NO3)2, 4H2O : H2O = 3:4) to
initiate partial hydrolysis. Addition of water expels some salt ions to form HNO3, decreasing the
pH of the solution to 4 [6]. The dispersion of calcium nitrate in the solvent was facilitated using an
ultrasonic bath (1000 Hz) followed by 24 hours of magnetic stirring (400 r.p.m). The solution
formed required no further acid addition since HNO3 was formed within the solution.
The sol-gel process starts with a homogenous solution of AlOOH and Ca(NO3)2 in ethanol solvent
with the concentrations meeting the nominal composition of C12A7 compound. The AlOOH and
Ca(NO3)2 solution were mixed allowing the formation of a homogenous C12A7 amorphous
solution. C12A7 nanoparticles were prepared by dispensing a thin layer of sol in a petri dish
followed by a 72 hour drying process at room temperature. During drying, evaporation of ethanol
progressively facilitates the formation of an amorphous phase from the solution. Continued drying

5
of the sol and evaporation of the solvent promotes the inorganic precursors and organic additives
into the desired structure. The powders were then subjected to a heat treatment at ambient
atmosphere with the annealing temperature set to 1100°C for the duration of 3 hours. Thermal
treatment of the dried gel at 1100°C will lock in the nano-caged structure of C12A7 and develops
covalent bonds of Ca-O-Al to form the framework. The crystalline C12A7 formed along with
amorphous C12A7 dried gels were used for various characterizations.
2.3 Characterisation
High Temperature X-Ray Diffraction (HTXRD) was performed at variable temperature using a
D5000 X-Ray diffractometer equipped with an Anton Paar HTK-16 vacuum furnace using CuKα
radiation (λ=1.54A°). An Anton Parr TCU 2000 temperature control unit provided direct
temperature control. The detector was a Panalytical X’Celerator solid-state detector, which scans
continuously. Samples were placed on a pre-stressed platinum strip. Experiments were
performed from room temperature up to 1200°C with a heating rate of 10°C/min, in the 5°-65°
2θ domain. The dried C12A7 gel was placed in a small crucible and fitted inside the STA1500
(Thorn Scientific, UK) differential scanning calorimeter (DSC) and exposed to heat treatment at
various rates over a programmed temperature range from 25°C to 1200°C.
Fourier transform infrared spectroscopy (FTIR) measurements were carried out using a Nicolet
8700 FTIR spectrometer (Thermo Electron Corporation, UK) in conjunction with an MTEC
Photoacoustic Spectrum (PAS) cell. Spectra were obtained in the mid infrared region (4000-400
cm-1
) at 4 cm-1
resolution and averaging of 256 scans on two different samples; one with
amorphous C12A7 dried gel and the other with crystallized C12A7 powder.
Raman Spectroscopy was carried out using a Nicolet Almega XR dispersive Raman
spectrophotometer (Thermo Fisher Scientific, Madison Wisconsin, USA), equipped with 532nm
and 785nm lasers on two different samples; one with amorphous C12A7 dried gel and the other
with crystallized C12A7 powder. All the spectra were collected in the range of 400 cm-1
-4000cm-1
using a 10X objective and over an average of 256 scans, with 1 second exposure time at low
resolution.
3. Results and discussions
3.1 HTXRD and DSC
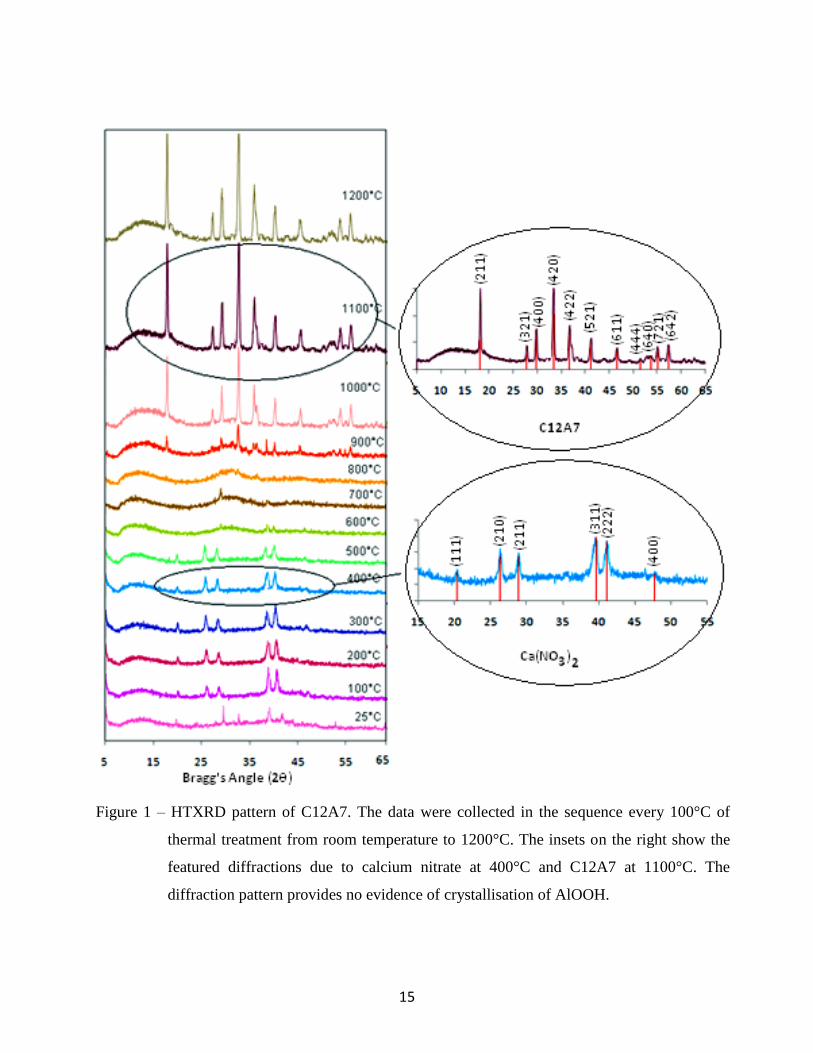
Figure 1 shows a sequence of data collected from the HTXRD performed on amorphous C12A7
dried gel in the temperature range of 25°C-1200°C. The phase transformations at different
6
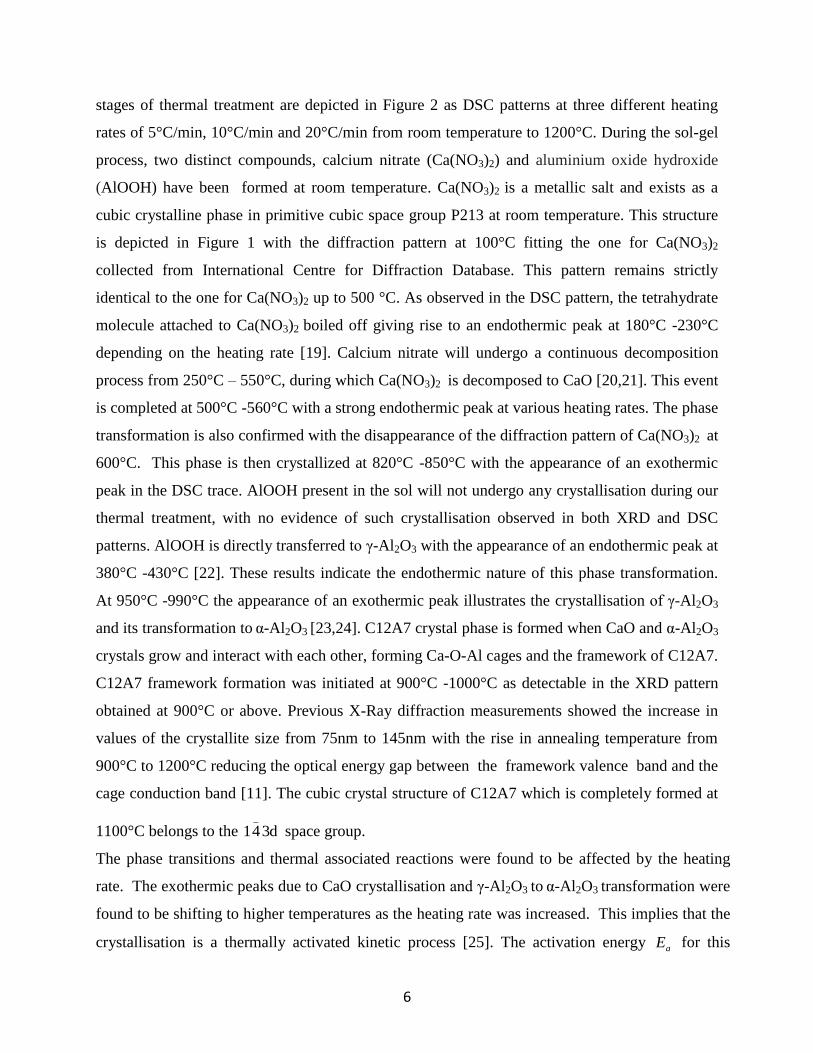
stages of thermal treatment are depicted in Figure 2 as DSC patterns at three different heating
rates of 5°C/min, 10°C/min and 20°C/min from room temperature to 1200°C. During the sol-gel
process, two distinct compounds, calcium nitrate (Ca(NO3)2) and aluminium oxide hydroxide
(AlOOH) have been formed at room temperature. Ca(NO3)2 is a metallic salt and exists as a
cubic crystalline phase in primitive cubic space group P213 at room temperature. This structure
is depicted in Figure 1 with the diffraction pattern at 100°C fitting the one for Ca(NO3)2
collected from International Centre for Diffraction Database. This pattern remains strictly
identical to the one for Ca(NO3)2 up to 500 °C. As observed in the DSC pattern, the tetrahydrate
molecule attached to Ca(NO3)2 boiled off giving rise to an endothermic peak at 180°C -230°C
depending on the heating rate [19]. Calcium nitrate will undergo a continuous decomposition
process from 250°C – 550°C, during which Ca(NO3)2 is decomposed to CaO [20,21]. This event
is completed at 500°C -560°C with a strong endothermic peak at various heating rates. The phase
transformation is also confirmed with the disappearance of the diffraction pattern of Ca(NO3)2 at
600°C. This phase is then crystallized at 820°C -850°C with the appearance of an exothermic
peak in the DSC trace. AlOOH present in the sol will not undergo any crystallisation during our
thermal treatment, with no evidence of such crystallisation observed in both XRD and DSC
patterns. AlOOH is directly transferred to γ-Al2O3 with the appearance of an endothermic peak at
380°C -430°C [22]. These results indicate the endothermic nature of this phase transformation.
At 950°C -990°C the appearance of an exothermic peak illustrates the crystallisation of γ-Al2O3
and its transformation to α-Al2O3 [23,24]. C12A7 crystal phase is formed when CaO and α-Al2O3
crystals grow and interact with each other, forming Ca-O-Al cages and the framework of C12A7.
C12A7 framework formation was initiated at 900°C -1000°C as detectable in the XRD pattern
obtained at 900°C or above. Previous X-Ray diffraction measurements showed the increase in
values of the crystallite size from 75nm to 145nm with the rise in annealing temperature from
900°C to 1200°C reducing the optical energy gap between the framework valence band and the
cage conduction band [11]. The cubic crystal structure of C12A7 which is completely formed at
1100°C belongs to the d341_
space group.
The phase transitions and thermal associated reactions were found to be affected by the heating
rate. The exothermic peaks due to CaO crystallisation and γ-Al2O3 to α-Al2O3 transformation were
found to be shifting to higher temperatures as the heating rate was increased. This implies that the
crystallisation is a thermally activated kinetic process [25]. The activation energy aE for this

7
crystallisation process under nonisothermal conditions can often be described by the Kissinger
equation in the form [26]:
)1(lnln
2
p
aap
RT
E
R
ET
where , pT , R and are the heating rate, the peak temperature, the universal gas constant
and the frequency factor, respectively.
.The Kissinger plots of
2
lnpT
against pT
1 are shown in the inset of Figure 2. Values of aE were
estimated from the slope of the plots to be 348 kJ/mol and 375 kJ/mol for crystallisation of CaO
and the γ-Al2O3 to α-Al2O3 transition, respectively. The value of molkJEa 348 is consistent
with the highly endothermic character of the overall decomposition of calcium nitrate [27]. The
activation from γ-Al2O3 to α-Al2O3 represents the transformation from metastable to stable state
and the value of aE agrees well within the reported range [28]. The transition temperature,
however, may be susceptible to various factors, such as purity, the degree of crystallinity and the
presence of foreign ionic impurities [29,30].
3.2 FTIR and Raman Spectroscopy
FTIR measurements were carried out using two different samples; one with amorphous C12A7
dried gel and the other with crystallized C12A7 powder. Figure 3 shows the FTIR pattern for both
samples, where the FTIR spectrum of amorphous C12A7 dried gel provides evidence of the
presence of AlOOH, Ca(NO3)2, Etac and butoxy groups separated from Al atoms.
Table I shows the most characteristic bands for each of these compounds, followed by the
corresponding Raman shifts. Hydrolysis of Al(OBu)2(Etac) is initiated by the separation of both
Etac and butoxy groups attached to AlO. The observation of the absorption peaks at 1735 cm-1
and 1615 cm-1
corresponding to stretching vibrations of C-C bonds for free Etac groups in
ketonic and enolic forms respectively, conclusively suggests that Etac is present in the dried gel
as a separate phase in both possible forms [14]. If attached to AlO, Etac would be present only in
enolic form. Comparing the FTIR spectra for amorphous and crystalline C12A7 provides
evidence of the removal of all organic compounds as a result of thermal treatment. Such
comparison is also an asset to demonstrate the cage formation in crystalline C12A7. Four

8
featured bands at 740, 815, 1060 and 1370 cm-1
in the FTIR pattern of amorphous C12A7 are
assigned to Ca-O-NO2 vibrations. As a bivalent metallic nitrate, Ca(NO3)2 follows a C2v
symmetry rather than the D3h that would normally occur in monovalent metallic nitrates [31].
These absorption bands, as well as the ones in the range of 400-700 cm-1
arising from the
presence of AlOOH, virtually disappear in the FTIR pattern of crystalline C12A7. Typical
reported peaks for crystalline C12A7 phase are observed in our data. As stated above there is no
evidence of individual Ca-O or Al-O bonding in the FTIR spectrum of crystalline C12A7. Ca, Al
and O atoms are confined together to form the Ca-O-Al cage structure with the vibration peak at
530cm-1
exclusively. The peak at 790cm-1
is believed to be associated with the free oxygen ions
(O22–
) which are trapped inside the cages [32]. Such phase transformation and crystallisation is
also noticeable in the HTXRD pattern of amorphous to crystalline C12A7, providing more
details about these phenomena. Finally the thermal treatment of C12A7 in air is favourable for
incorporation of OH- ions inside the cages. These ions are identified with the absorption band at
3620 cm-1
. The upshift of the absorption peaks due to OH vibration compared to hydroxyl groups
in amorphous phase is believed to be due to the fact that OH- ions inside the cage are loosely
bound to cage wall, vibrating at lower energy levels and higher wavelengths [33].
All of the normal modes of vibration in a molecule cannot be excited by FTIR. Accordingly our
FTIR experimental findings are supported and complemented by Raman spectroscopy that was
carried out on the same samples as FTIR. Corresponding Raman shifts are presented in Table I,
which are in complete agreement with FTIR data. Figure 4 and Figure 5 illustrate the Raman
shifts due to the disappearance from the crystalline sample of organic and inorganic compounds
that were present in amorphous dried gel. Two strong Raman shifts at 520nm and 780nm are
visible in Figure 4 due to the crystal structure of C12A7. This pattern demonstrates that the
thermal treatment was sufficient to remove all other compounds and form the desired bondings.
4 Conclusions
The sol-gel derived binary compound, C12A7 of the CaO-Al2O3 system was fabricated with
precise control over the chemical composition of precursors, concentration of solvents and water
and the pH of the sol. The high level of homogeneity and transparency of the C12A7 solution in
ethanol was achieved by optimizing pH values, reaction dynamics and modified precursor
structures. In-situ High Temperature X-Ray Diffraction (HTXRD) and Differential Scanning
Calorimetry (DSC) studies on phase transformations of the C12A7 powder over wide range of

9
temperature from 250C to 1200
0C showed that the sample was amorphous at room temperature
but it became completely crystallized on heat treatment at 1100°C for 3 hours. The exothermic
peak temperatures due to crystallisation of γ-Al2O3 and its transformation to α-Al2O3 were found
to have risen with increase in the heating rate from 5°C/min to 20°C/min. The purity of the
C12A7 and the removal of redundant chemical by-products were confirmed by independent
Fourier Transform Infrared (FTIR) and Raman Spectroscopic measurements on amorphous and
crystalline C12A7. In conclusion, heat treatment of sol-gel derived C12A7 shows 1100°C is the
optimum temperature for complete crystallization.
Acknowledgements
The one of the authors (MZ) thank the LP Displays, Blackburn, UK for the PhD studentship with
their financial support. This work was carried out at the School of Engineering and Materials
Science of Queen Mary, University of London. We are also grateful to Dr Lesley Hanna of the
Wolfson Centre for Materials Processing, Brunel University for fruitful discussions and input.
References
1 T. Kamiya, H. Hiramatsu, K. Nomura, H. Hosono, J. Electroceram. 17 (2006) 267.
2 J. E. Medvedeva, A. J. Freeman, Europhysic. Lett, 69 (2005) 583.
3. K. Nomura, H. Ohta, K. Ueda, T. Kamiya, M. Hirano, H. Hosono, Science 300 (2003) 1269.
4. P. V. Shushko, A. L. Shluger, K. Hayashi, M. Hirano, H. Hosono, Thin Solid Films, 445
(2003) 161.
5. P. V. Shushko, A. L. Shluger, K. Hayashi, M. Hirano, H. Hosono, Phys. Rev. B, 73 (2006)
014101.
6. P. M. Nikolic, D. Lukovic, S. Savic, D. Urosevic, S. Djuric, Science of Sintering 35
(2003)147.
7. H. Harimochi, J. Kitagawa, M. Ishizaka, Y. Kadoya, M. Yamanishi, S. Matsuishi, H.
Hosono, Phys. Rev. B, 70 (2004) 193104.
8. M. Zahedi, A. K. Ray, D. S. Barratt, Science of Advanced Materials 1(2) (2009) 107.
9. C.H. Jung, P.H. Tai,. Y.K. Kang, D.S. Jang, D.H. Yoon, Surface and Coatings Technology,
202 (2008) 5421.
10. A. C. Tas, J.Am. Ceram. Soc, 81 (1998) 2853.
11. M. Zahedi, A. K. Ray, D. S. Barratt, J. Phys. D: Appl. Phys., 41 (2008) 035404
10
12. M. Zahedi, A. K. Ray, J. Sol-Gel. Sci. Technol, 55 (2010) 317.
13. N. B. Maharajan, N. S. Saxena, D. Bhandari, M. M. Imran, D. D. Paudya , Bull. Mater. Sci.,
23(5) (2000) 369.
14. L. B. Coury, F. Babonneau , J. Livage, J. sol-gel. Sci. Technol, 3 (1994) 157.
15. J. Escobar, J. A. De Los Reyes, T. Viveros, Applied Catalysis A: General, 253 (2003) 151.
16. L. Shi, N. B. Wong, J. Mater. Res, 14 (1999) 3599.
17. X. Changrong, W. Feng, M. Zhaojing, L. Fanqing, P. Dingkun, M. Guangyao, Journal of
Membrane Science, 116 (1996) 9.
18. J. Ma, C. H. Liang, L. B. Kong, C. Wang, Journal of Materials Science: Materials in
Medicine, 14 (2003) 797.
19. A. Elliot, Infrared Spectra and Structure of Organic Long-chain Polymers, 1969, UK,
Edward Arnold Ltd pp: 83-106.
20. E. Garreta, T. Fernandez, S. Borros, J. Esteve, C. Colominas, L. Kempf, Mat. Res Soc.
Symp. Proc., 724 (2002) 173.
21 A. K. Galwey, C. Ettarh, Thermochimica Acta, 316 (1998) 57.
22. M. Thiruchitrambalam, V. R. Palkar, V. Gopinathan, Mater. Lett, 58 (2004) 3063.
23. M. Mazloumi, R. Khalifehzadeh, S. K. Sadrnezhaad , H. Arami, J. Am. Ceram. Soc, 89
(2006) 3654.
24. K. Okada, A.Hattori, Y. Kameshima, A . Yasumori and R. N. Das, J. Am. Ceram. Soc., 83
(2000) 1233.
25. Y. X. Zhuang, P. F. Xing, H. Y. Shi, J. Chen, P. W. Wang, J. C. He, J. Appl. Phys. 108
(2010) 033515 _
26. H.M. Kissinger, Analytical Chem, 29 (1957)1702.
27, C, Ettarh and A.K . Galwey, Thermochim. Acta, 288 (1996) 203 DOI: 10.1016/S0040-
6031(96)03052-3.
28. L. Baca, J. Plewa, L. Pach and J. Opfermann, J. Therm. Anal. Calorim. 66 (2001) 803 DOI:
10.1023/A:1013148223203
29. K. Okada, A. Hattori, Y. Kameshima and A. Yasumori, Mater. Lett. 42 (2000) 175.
30. F. Nahif, , D. Music, S. Mraz, M. T. Baben and J. M. Schneider, J. Phys.-Condes. Matter
25 (2013) Article Number: 125502 DOI: 10.1088/0953-8984/25/12/125502
31. S. D. Ross, Inorganic Infrared and Raman Spectroscopy,1972, UK, McGraw-Hill Book

11
Company Ltd, pp: 95-112.
32. D. Wang, Y. X. Liu, C.S. Xu, Y. C. Liu, G. R. Wang, X. H. Li, J. Rare Earths, 26 (2008) 433.
33. K. Nakanishi, Infrared Absorption Spectroscopy,1962, Japan, Nankodo Company Ltd .

12
Table Caption:
Table I – Featured FTIR Absorption bands (cm-1
) of FTIR pattern illustrated in figure 3 and
Raman shifts (cm-1
) for Raman spectroscopy with different laser intensities at 532nm and 785nm
illustrated in figures 4 and 5, showing the main peaks for each compounds present in amorphous
and crystalline C12A7.
Figure Captions:
Figure 1: HTXRD pattern of C12A7. The data were collected in the sequence every 100°C of
thermal treatment from room temperature to 1200°C. The insets on the right show the
featured diffractions due to calcium nitrate at 400°C and C12A7 at 1100°C. The
diffraction pattern provides no evidence of crystallisation of AlOOH.
Figure 2: DSC pattern of C12A7 dried gel heated at the rate of (a) 5°C/min (b) 10°C/min and
(c) 20°C/min from room temperature to 1200°C. Inset showing Kissinger plots for CaO
crystallisation ( ) and () γ-Al2O3 to α-Al2O3 transformation.
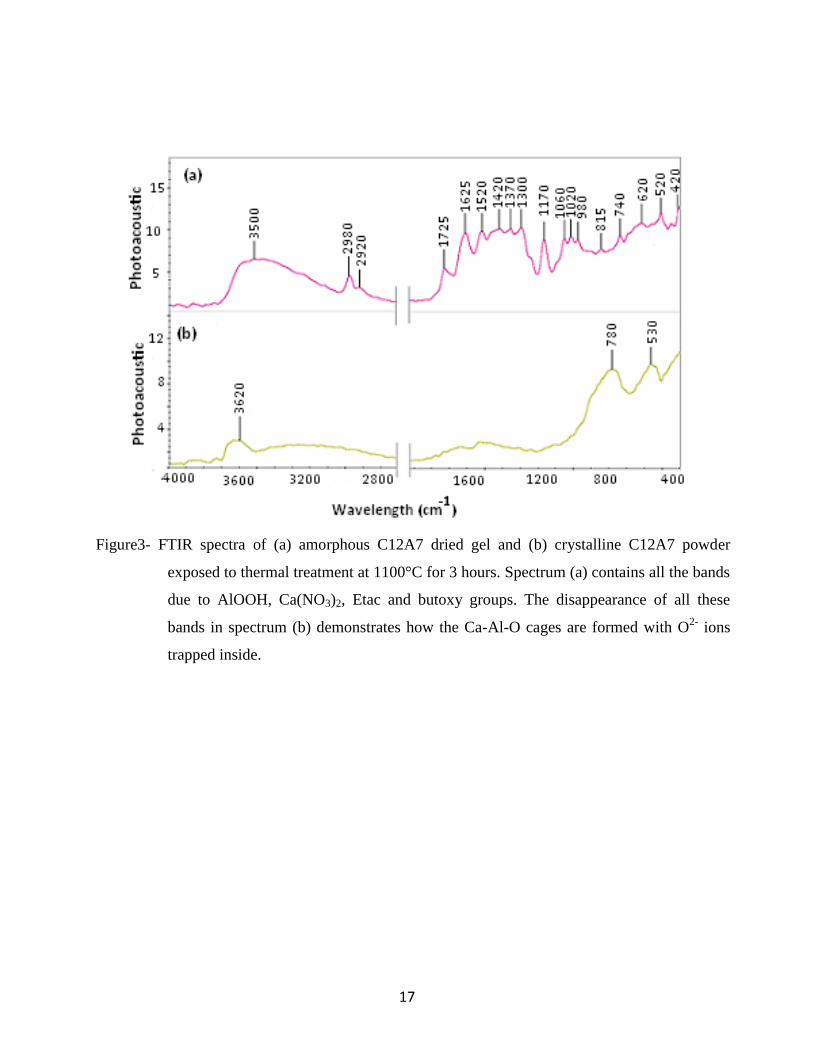
Figure3: FTIR spectra of (a) amorphous C12A7 dried gel and (b) crystalline C12A7 powder
exposed to thermal treatment at 1100°C for 3 hours. Spectrum (a) contains all the bands
due to AlOOH, Ca(NO3)2, Etac and butoxy groups. The disappearance of all these
bands in spectrum (b) demonstrates how the Ca-Al-O cages are formed with O2-
ions
trapped inside.
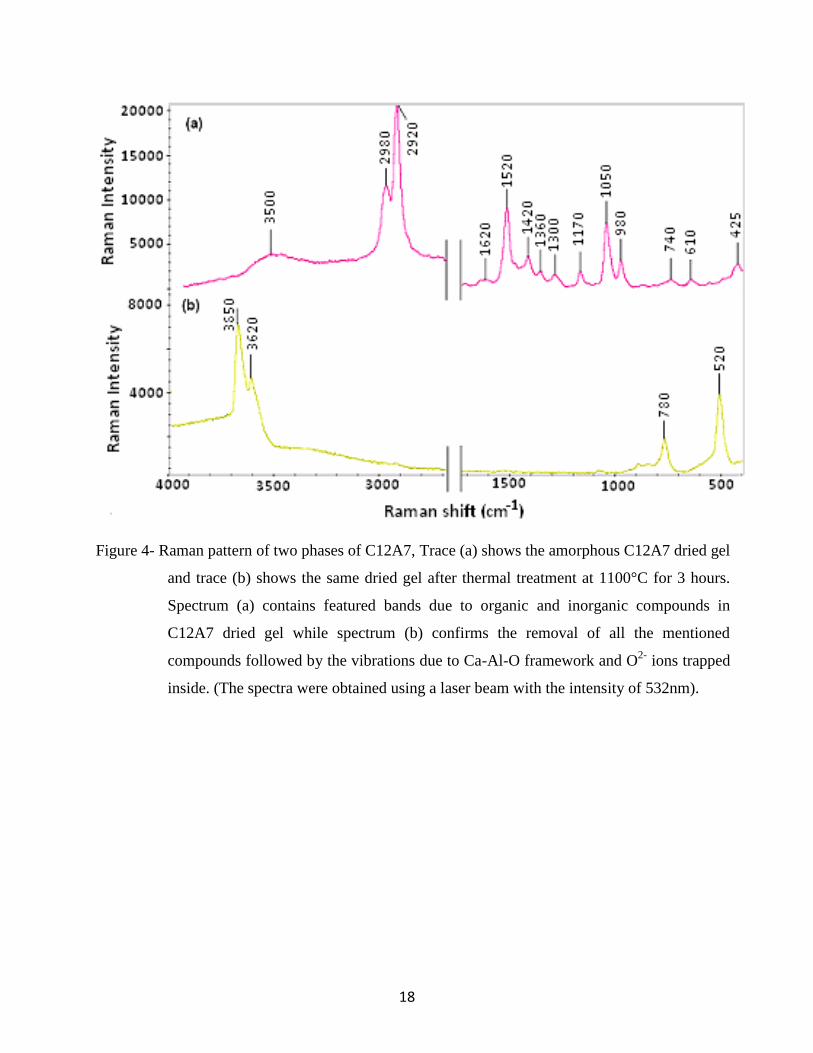
Figure 4: Raman pattern of two phases of C12A7, Trace (a) shows the amorphous C12A7 dried
gel and trace (b) shows the same dried gel after thermal treatment at 1100°C for 3
hours. Spectrum (a) contains featured bands due to organic and inorganic compounds in
C12A7 dried gel while spectrum (b) confirms the removal of all the mentioned
compounds followed by the vibrations due to Ca-Al-O framework and O2-
ions trapped
inside. (The spectra were obtained using a laser beam with the intensity of 532nm).
Figure 5: Raman pattern of two phases of C12A7, Trace (a) shows the amorphous C12A7 dried
gel and trace (b) shows the same dried gel after thermal treatment at 1100°C for 3
hours. (The spectra were obtained using a laser beam with the intensity of 785nm).

13
Table I
Compound FTIR Raman
(532nm)
Raman
(785nm)
Bonding References
Ca(NO3)2 740 740 740 Ca-O-No2(C2v symmetry) [16], [17]
815 - 815 Ca-O-No2(C2v symmetry) [16], [17]
1060 1050 1050 Ca-O-No2(C2v symmetry) [16], [17]
1370 1360 1360 Ca-O-No2(C2v symmetry) [16], [17]
Boehmite
(AlOOH)
420 425 425 Al-O vibration [18], [19]
520 - 520 Al-O vibration [18], [19]
620 610 610 Al-O vibration [18], [19]
740 740 740 Al-O vibration [18], [19]
980 980 980 Bending vibration of OH [18], [19]
1020 - - Bending vibration of OH [18], [20]
1060 1050 1050 Bending vibration of OH [18], [20]
3500 3500 - Stretching vibration of OH [18], [20]
Ethyl
acetoacetate
1170 1170 1170 Stretching vibration of C-H [10], [17]
1300 1300 1300 Bending vibration of C-C [10], [17]
1370 1360 1360 Stretching vibration of CH3 [10], [17]
1420 1420 1420 Stretching vibration of CH3 [10], [17]
1520 1520 1520 Bending vibration of C=C [10], [17]
1615 1620 - Stretching vibration of C-O for
enolic form
[10]
1735 - - Stretching vibration of C-O for
ketonic form
[10]
14
2920 2920 2920 vibration of CH2 [10], [17]
2980 2980 - vibration of CH2 [10], [17]
Butoxy ligands 1060 1050 1050 Stretching vibration of C-O [17]
1370 1360 1360 Stretching vibration of CH3 [17]
1420 1420 1420 Stretching vibration of CH3 [17]
2920 2920 2920 vibration of CH2 [17]
2980 2980 - vibration of CH2 [17]
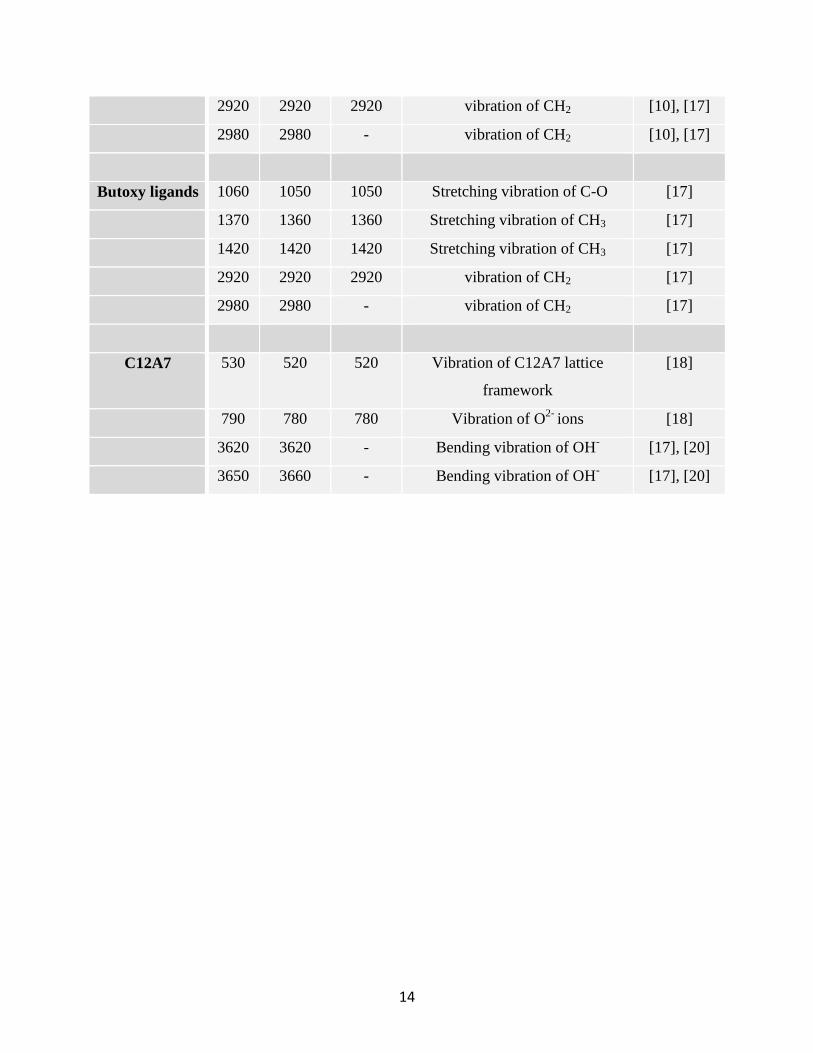
C12A7 530 520 520 Vibration of C12A7 lattice
framework
[18]
790 780 780 Vibration of O2-
ions [18]
3620 3620 - Bending vibration of OH-
[17], [20]
3650 3660 - Bending vibration of OH- [17], [20]
15
Figure 1 – HTXRD pattern of C12A7. The data were collected in the sequence every 100°C of
thermal treatment from room temperature to 1200°C. The insets on the right show the
featured diffractions due to calcium nitrate at 400°C and C12A7 at 1100°C. The
diffraction pattern provides no evidence of crystallisation of AlOOH.

16
Figure 2 - DSC pattern of C12A7 dried gel heated at the rate of (a) 5°C/min (b) 10°C/min and (c)
20°C/min from room temperature to 1200°C. Inset showing Kissinger plots for CaO
crystallisation ( ) and () γ-Al2O3 to α-Al2O3 transformation.
17
Figure3- FTIR spectra of (a) amorphous C12A7 dried gel and (b) crystalline C12A7 powder
exposed to thermal treatment at 1100°C for 3 hours. Spectrum (a) contains all the bands
due to AlOOH, Ca(NO3)2, Etac and butoxy groups. The disappearance of all these
bands in spectrum (b) demonstrates how the Ca-Al-O cages are formed with O2-
ions
trapped inside.
18
Figure 4- Raman pattern of two phases of C12A7, Trace (a) shows the amorphous C12A7 dried gel
and trace (b) shows the same dried gel after thermal treatment at 1100°C for 3 hours.
Spectrum (a) contains featured bands due to organic and inorganic compounds in
C12A7 dried gel while spectrum (b) confirms the removal of all the mentioned
compounds followed by the vibrations due to Ca-Al-O framework and O2-
ions trapped
inside. (The spectra were obtained using a laser beam with the intensity of 532nm).

19
Figure 5- Raman pattern of two phases of C12A7, Trace (a) shows the amorphous C12A7 dried gel
and trace (b) shows the same dried gel after thermal treatment at 1100°C for 3 hours.
(The spectra were obtained using a laser beam with the intensity of 785nm).

20