kinetic monte carlo simulation of the effect of … monte carlo simulation of the effect of...
TRANSCRIPT
JOURNAL OF CHEMICAL PHYSICS VOLUME 119, NUMBER 6 8 AUGUST 2003
Kinetic Monte Carlo simulation of the effect of coalescence energy releaseon the size and shape evolution of nanoparticles grown as an aerosol
D. Mukherjee, C. G. Sonwane, and M. R. Zachariaha)
Departments of Mechanical Engineering and Chemistry, University of Minnesota, Minneapolis,Minnesota 55455
~Received 28 October 2002; accepted 15 April 2003!
We develop a kinetic Monte Carlo algorithm to describe the growth of nanoparticles by particle–particle collision and subsequent coalescence. The unique feature of the model is its ability toaccount for the exothermic nature of particle coalescence events and to show how the resultingnonisothermal behavior can be used to change the primary particle size and the onset of aggregationin a growing nanoaerosol. The model shows that under certain conditions of gas pressure,temperature, and particle volume loadings, the energy release from two coalescing nanoparticles issufficient to cause the particle to exceed the background gas temperature by many hundreds ofdegrees. This in turn results in an increase in the microscopic transport properties~e.g., atomicdiffusivity! and drive the coalescence process even faster. The model compares the characteristictimes for coalescence and collision to determine what conditions will lead to enhanced growth rates.The results, which are presented for silicon and titania as representative nanoparticle systems, showthat increasing volume loading and decreasing pressure result in higher particle temperatures andenhanced sintering rates. In turn, this results in a delay for the onset of aggregate formation andlarger primary particles. These results suggest new strategies for tailoring the microstructure ofnanoparticles, through the use of process parameters heretofore not considered as important indetermining primary particle size. ©2003 American Institute of Physics.@DOI: 10.1063/1.1580098#
nthoe
kscleleod
pe
nde
arhe
trahno
oin
lerm
ea.low
ikendiate
lti-ble
ofy of
ndfory ofusel to
edof
beenare
ensolandandtorail
INTRODUCTION
The study of the coagulation and coalescence of nasized aerosols resulting in agglomerate formation andgrowth characteristics, morphology and size distributionsprimary particles in agglomerates have been an area oftensive study in both theoretical and experimental worThe coalescence of particles resulting in spherical partican be of importance in predicting the uniformity of particsizes required for pigment synthesis, chemical vapor deption, carbon black, etc. On the other hand, clusters of invidual primary particles forming aggregates of higher scific surface area are known to enhance catalytic activity1 orthe rate of energy release in propellants.2 Indeed many ther-mal, mechanical and optical properties3 are determined bythe size of primary particles. Thus, the ability to predict acontrol primary particle sizes of nanostructured materialsther in the free state or stabilized in an aggregate is of pmount importance in the implementation of many of ttechnologies that envisage a size-dependent property.
Typically in many aerosol processes, a high concention of very small particles undergoes rapid coagulation. Tmay lead to the formation of fractal-like agglomerates cosisting of a large number of spherical primary particlesapproximately uniform diameter.4 The size of the primaryparticles ultimately is determined by the relative ratesparticle–particle collision and coalescence of a grow
a!Corresponding author: Michael R. Zachariah. Electronic [email protected]; Telephone: 612-626-9081; Fax: 612-625-6069.
3390021-9606/2003/119(6)/3391/14/$20.00
Downloaded 04 Aug 2003 to 128.101.142.157. Redistribution subject to
o-efx-.s
si-i--
i-a-
-is-f
fg
aerosol.5 At very high temperatures for example, particcoalescence occurs almost on contact, resulting in unifospherical primary particles of relatively small surface arAt low temperatures, the rate of coalescence may be so sthat particles undergo many collisions, leading to fractal-lagglomerates consisting of very small primary particles athus large surface area. Of most interest is those intermedconditions where neither process is rate controlling. Umately controlling the coalescence rate is only possithrough knowledge of the material properties and the usea programmed and understood time–temperature historthe growth environment.6
There have been other efforts of both experimental atheoretical nature for predicting primary particle sizesnanoparticles grown from a vapor. These include the studtitania nanoparticle sintering kinetics in free jets and theof a simple coalescence-collision time crossover modedetermine shapes of primary particles;7,8 TEM observationsfor Titania primary particle sizes during sintering in heatgas flows;9 or the analysis of the growth characteristicssilica10–12 nanoparticles in aerosol reactor cells.13 Models ofnanoparticle coalescence in nonisothermal flames havedeveloped that employ population balance equations thatvariants of the Smoluchowski equation have bedeveloped.14 Sectional based models for aggregate aerodynamics accounting for a gas-phase chemical reactionsintering have also been developed to determine primaryaggregate particle size distributions under varying reactemperatures.10
:
1 © 2003 American Institute of Physics
AIP license or copyright, see http://ojps.aip.org/jcpo/jcpcr.jsp

ri-
n
asotaexrk
-ltethv
thanp
nno
reoarecome
inesharapoa
fealeponirsofs
eomcgeg
tori-
fov
arorsizv
ssoder-
he
o-igates al-
sthef ace
tingof
aryili-
y ofon-ce
sololu-
r-Forfree
reeolli-ofsed
par-thethe
3392 J. Chem. Phys., Vol. 119, No. 6, 8 August 2003 Mukherjee, Sonwane, and Zachariah
All the aforementioned works on the prediction of pmary particle sizes have been constructedwith the underly-ing assumption that particles were always at the backgrougas temperatures. Freund and Bauer15 possibly carried outthe closest experimental work dealing with energy releduring condensation of aerosol clusters for homogenenucleation in metal vapors. Certainly on the experimenside, the determination of particle temperature overtremely short time scales, as we will encounter in this wowould require a determined effort to probe this effect.
More recently we showed6,21 that the coalescence process, which is exothermic in nature, could significantly athe sintering rate of nanoparticles. Moreover, we showedvery surprising result that background gas pressures andume loading of the material could significantly changeoverall temporal energy balance of coalescing particles,could be used as process parameters to control primaryticle size and the onset of aggregation.21 The motivation forthis discovery was an earlier study by Zachariah aCarrier17 on the coalescence characteristics of silicon naparticles using molecular dynamics~MD! simulation meth-ods. That work showed that when particles coalesce, thea significant increase in particle temperature. Following clision, the formation of new chemical bonds between pticles results in heat release and the formation of a nbetween the particles. This heat release may, under sconditions, result in an increase in particle temperature wabove the background gas. In the recent papers of Lehtand Zachariah,6,21 it was shown that since these particlcoalesce predominantly by a solid-state diffusion mecnism, which is an extremely sensitive function of tempeture, the increase in particle temperature itself has an imtant effect on the coalescence dynamics. In fact, it wshown that for silicon nanoparticle coalescence this efreduced, in some cases, the coalescence time by severders of magnitude!However, these studies did not considensemble aerosols effects, which is the subject of this pa.Here, by ensemble effects we refer to the random collisicoalescence processes between particle/aggregate paany size and shape, where simultaneous coalescencethe system agglomerates that have undergone collisionany instant of time are allowed to take place.
Monte Carlo methods have recently been shown to buseful tool for simulating coagulation–coalescence phenena. They have the advantage that both length and time sphenomena can be simultaneously solved without a sinunifying governing multivariate equation. FurthermorMonte Carlo methods provide an intuitive tool in simulatinthe random coagulation process without anya priori as-sumption of the aerosol size distribution.
Rosner and Yu18 have used Monte Carlo methodsdemonstrate the ‘‘self preserving’’ asymptotic pdf for bivaate populations in free molecular regime. Kruiset al.19 haveused Monte Carlo methods to establish its suitabilitysimulating complex particle dynamics. These works haclearly demonstrated the statistical accuracy of Monte Cmethod by comparing it with the theoretical solutions faggregation and the asymptotic self-preserving particle-distribution5 for coagulation. In a parallel work, Efendie
Downloaded 04 Aug 2003 to 128.101.142.157. Redistribution subject to
d
eusl-,
re
ol-ed
ar-
d-
isl--ke
llen
--r-sctor-
rer/of
allat
a-
alele,
relo
e
and Zachariah20 had recently demonstrated the effectiveneof the method, by developing a hybrid Monte Carlo methfor simulating two-component aerosol coagulation and intnal phase-segregation.
In this paper we develop a Monte Carlo model on tlines of earlier works of Efendiev and Zachariah20 to extendtheir work on particle coagulation by incorporating nonisthermal finite rate coalescence processes. We also investthe inter-relationships of heat release and coalescence aready proposed by Lehtinen and Zachariah.6,21 We will use akinetic Monte Carlo~KMC! method to study the effect of gatemperature, pressure, and material volume loading onheat release phenomenon during the time evolution onanoparticle cloud growing by random collision/coalescenprocesses. We then analyze their significance in predicthe primary particle growth rates. We describe the rolenonisothermal coalescence process in controlling primparticle growth rates and aggregate formation for typical scon and titania nanoparticles. As seen by the large bodearlier works, these two materials have been subjects of csiderable interest, primarily due to the industrial importanof these particles.
MATHEMATICAL MODEL AND THEORY
Smoluchowski equation and collision kernelformulation
The particle size distribution of a polydisperse aeroundergoing coagulation can be described by the Smchowski equation as
dN~ t,Vj !
dt5
1
2 E0
VjK~Vi ,Vj2Vi !N~ t,Vi !N~ t,Vj2Vi !dVi
2N~ t,Vj !E0
`
K~Vj ,Vi !N~ t,Vi !dVi , ~1!
wheret is the time,K(Vi ,Vj )5Ki , j is the kinetic coagulationkernel for the particles chosen with volumeVi andVj , andN (t,Vj ) is the number density of the$j% cluster.5
The appropriate form of the coagulation or collision kenel depends on the Knudsen size regime of the growth.our interest, the kernel need only be considered for themolecule regime and takes the form5
Ki jF 5KF~Vi ,Vj !
5S 3
4p D 1/6S 6kBTp
rpD 1/2S 1
Vi1
1
VjD 1/2
~Vi1/31Vj
1/3!2, ~2!
where,kB denotes the Boltzmann constant,Tp is the particletemperature considered for collision, andrp is the particledensity~assumed constant!.
For our purposes one has to bear in mind that in fmolecular regime the temperature dependence of the csion kernel (Ki j
F }Tp1/2) arises from the mean thermal speed
the nanoparticles derived from kinetic theory and expresin the form ci5(8kBTp /prpVi)
1/2. Although the kernel hasa weak dependence on the temperature, in our case theticle temperatures can become significantly higher thanbackground gas temperature. Thus, while formulating
AIP license or copyright, see http://ojps.aip.org/jcpo/jcpcr.jsp

tn
le
thapm
ac1.rore
llyurent
d
ai
c-
Unthi
by, ortion
-
.
feous
rgyingon
e toly,ora-
er-
ar-ralla
al
ed
g-in
he
em
3393J. Chem. Phys., Vol. 119, No. 6, 8 August 2003 Shape evolution of nanoparticles grown as an aerosol
collision kernel, we have considered its dependence onparticle temperature during the coalescence process. Hethe above collision kernel takes the form
Ki jF 5KF~Vi ,Vj !
5S 3
4p D 1/6S 6kB
rpD 1/2S Ti
Vi1
Tj
VjD 1/2
~Vi1/31Vj
1/3!2, ~3!
whereTi andTj are the respective temperatures of particin the system considered for collision.
Energy equations for coalescence process
During coalescence, a neck rapidly forms betweenparticles, which transforms into a spherule, and slowlyproaches a sphere coupled with which is the particle teperature rise due to heat release, as demonstrated by Zriah and Carrier17 and indicated by the schematic in Fig.Let us consider the case where, based on the collision pabilities, a typical collision event has successfully occurbetween two spherical particles of sizes,Vi and Vj . Thenupon coagulation it forms a new particle of volumeVi
1Vj . It consists of N atoms or units that would essentiaundergo the coalescence process and, hence, would befor formulating the typical energy equations and the corsponding heat release associated with modeling the eprocess for all such particles. We assume that the energyE ofa particle throughout the coalescence process can bescribed with bulk and surface contribution terms:22
~4!
whereap is the surface area of the coalescing particle pss the surface tension,«b(0) the bulk binding energy~nega-tive! at zero temperature,cv the constant volume heat capaity ~mass specific, J/kg K! andNw is the equivalent mass~kg!of N atoms in the particle pair undergoing coalescence.der adiabatic conditions considered over a particle pair,energyE would be constant, while the coalescence event wresult in a decrease in the surface area,ap and therefore anincrease in particle temperature.
FIG. 1. Schematic representation of the temporal evolution of particle tperature and shape in the nanoparticle coalescence process.
Downloaded 04 Aug 2003 to 128.101.142.157. Redistribution subject to
hece,
s
e--ha-
b-d
sed-ire
e-
r,
-e
ll
Any change in total energy,E, of the particle~or aggre-gate! can only result from energy loss to the surroundings,convection, conduction to the surrounding gas, radiationevaporation. Thus, for the temporal energy conservaequation for a particle~or, aggregate! we may write
dE
dt5Nwcv
dTp
dt1ss
dap
dt
52Zcmgcg~Tp2Tg!2«sSBap~Tp42Tg
4!
2DHvap
NAvZev, ~5!
whereTp is the particle temperature,Tg is the gas temperature ~K!; cg the mass specific heat capacity, andmg is themass of gas molecules~kg!. The emissivity of particles is«,sSB is the Stefan–Boltzmann constant,DHvap is the enthalpyof vaporization~J/mole!, and NAv is the Avogadro numberZc is the collision rate~s21! of gas–particle interactions inthe free-molecule range, andZev is the evaporation rate osurface atoms based on the calculation of the heterogencondensation rate~s21! of atoms on the particle surface.
The second term on the left-hand side of the eneequation~5! is the heat release due to coalescence arisfrom surface area reduction. The first and second termsthe right-hand side of the equation are heat losses ducollisions with gas molecules, and radiation, respectivewhile the last term represents the heat loss due to evaption from the particle surface.
We evaluate the surface area reduction term in Eq.~5!with the well-known linear rate law23 for the final stages ofcoalescence:
dap
dt52
1
t f~ap2asph!, ~6!
where the driving force for area reduction is the area diffence between the area of coalescing particlesap and that ofan equivalent volume sphere,asph. Equation~6! has beenwidely used to model the entire process from spherical pticles in contact to complete coalescence, since the ovesintering stage is rate controlled by the initial growth tospheroid.23
With the substitution we get the nonlinear differentiequation for particle temperature as
Nwcv
dTp
dt5
ss
t f~ap2asph!2Zcmgcg~Tp2Tg!
2«sSBap~Tp42Tg
4!2DHvap
NAvZev, ~7!
wheret f is characteristic coalescence, or fusion time definas
t f53kBTpN
64pssDeff, where Deff5DGBS d
dp~small!D , ~8!
Deff being the atomic diffusion coefficient that brings in sinificant nonlinearity in the above equation, as discusseddetail later in this section. The above formulation forDeff isderived based on the earlier works of Wuet al.24 DGB is thesolid-state grain boundary diffusion coefficient having tArrhenius fromDGB5A exp(2B/Tp), wheress is the particle
-
AIP license or copyright, see http://ojps.aip.org/jcpo/jcpcr.jsp
3394 J. Chem. Phys., Vol. 119, No. 6, 8 August 2003 Mukherjee, Sonwane, and Zachariah
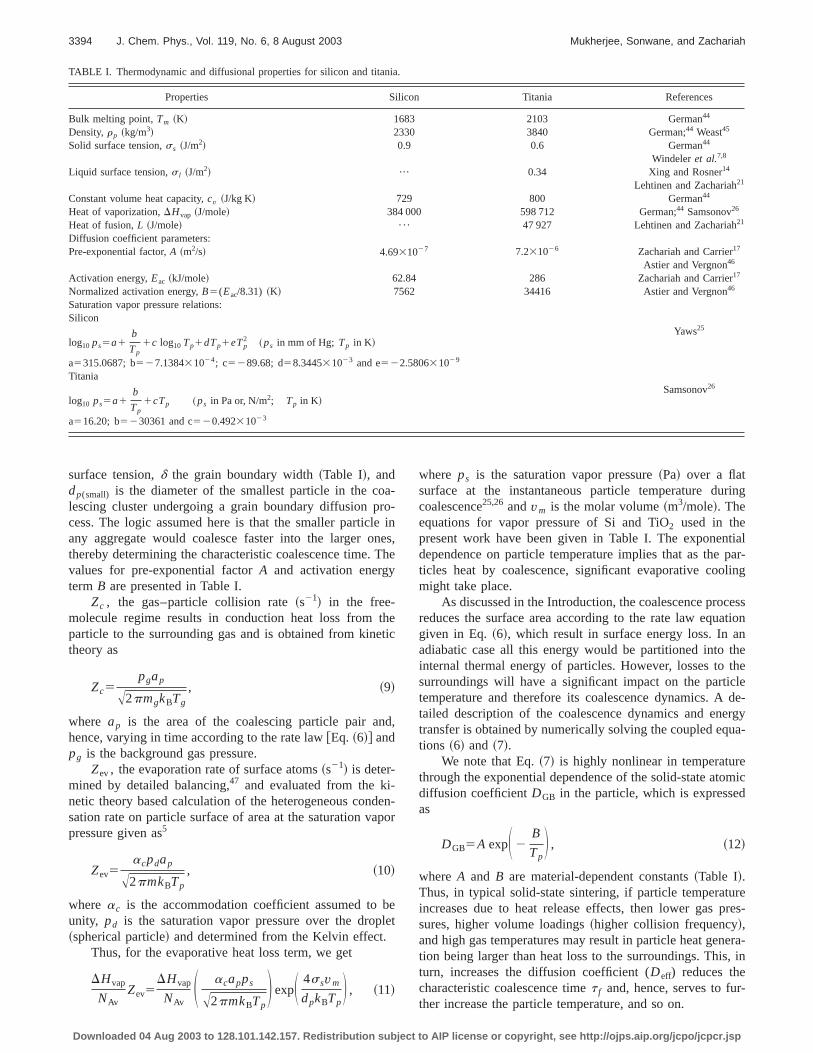
TABLE I. Thermodynamic and diffusional properties for silicon and titania.
Properties Silicon Titania References
Bulk melting point,Tm ~K! 1683 2103 German44
Density,rp ~kg/m3! 2330 3840 German;44 Weast45
Solid surface tension,ss ~J/m2! 0.9 0.6 German44
Windeleret al.7,8
Liquid surface tension,s l ~J/m2! ••• 0.34 Xing and Rosner14
Lehtinen and Zachariah21
Constant volume heat capacity,cv ~J/kg K! 729 800 German44
Heat of vaporization,DHvap ~J/mole! 384 000 598 712 German;44 Samsonov26
Heat of fusion,L ~J/mole! ¯ 47 927 Lehtinen and Zachariah21
Diffusion coefficient parameters:Pre-exponential factor,A ~m2/s! 4.6931027 7.231026 Zachariah and Carrier17
Astier and Vergnon46
Activation energy,Eac ~kJ/mole! 62.84 286 Zachariah and Carrier17
Astier and Vergnon46Normalized activation energy,B5(Eac/8.31) ~K! 7562 34416Saturation vapor pressure relations:Silicon
log10 ps5a1b
Tp1c log10 Tp1dTp1eTp
2 ~ps in mm of Hg; Tp in K!
a5315.0687; b527.138431024; c5289.68; d58.344531023 and e522.580631029
Yaws25
Titania
log10 ps5a1b
Tp1cTp ~ps in Pa or, N/m2; Tp in K!
a516.20; b5230361 and c520.49231023
Samsonov26
aroeneT
thti
d
-deap
ble
ring
tialpar-ling
esstionnthethelede-rgy
ua-
micd
repres-
era-, in
-
surface tension,d the grain boundary width~Table I!, anddp(small) is the diameter of the smallest particle in the colescing cluster undergoing a grain boundary diffusion pcess. The logic assumed here is that the smaller particlany aggregate would coalesce faster into the larger othereby determining the characteristic coalescence time.values for pre-exponential factorA and activation energyterm B are presented in Table I.
Zc , the gas–particle collision rate~s21! in the free-molecule regime results in conduction heat loss fromparticle to the surrounding gas and is obtained from kinetheory as
Zc5pgap
A2pmgkBTg
, ~9!
where ap is the area of the coalescing particle pair anhence, varying in time according to the rate law@Eq. ~6!# andpg is the background gas pressure.
Zev, the evaporation rate of surface atoms~s21! is deter-mined by detailed balancing,47 and evaluated from the kinetic theory based calculation of the heterogeneous consation rate on particle surface of area at the saturation vpressure given as5
Zev5acpdap
A2pmkBTp
, ~10!
where ac is the accommodation coefficient assumed tounity, pd is the saturation vapor pressure over the drop~spherical particle! and determined from the Kelvin effect.
Thus, for the evaporative heat loss term, we get
DHvap
NAvZev5
DHvap
NAvS acapps
A2pmkBTpD expS 4ssvm
dpkBTpD , ~11!
Downloaded 04 Aug 2003 to 128.101.142.157. Redistribution subject to
--ins,
he
ec
,
n-or
et
where ps is the saturation vapor pressure~Pa! over a flatsurface at the instantaneous particle temperature ducoalescence25,26 andvm is the molar volume~m3/mole!. Theequations for vapor pressure of Si and TiO2 used in thepresent work have been given in Table I. The exponendependence on particle temperature implies that as theticles heat by coalescence, significant evaporative coomight take place.
As discussed in the Introduction, the coalescence procreduces the surface area according to the rate law equagiven in Eq.~6!, which result in surface energy loss. In aadiabatic case all this energy would be partitioned intointernal thermal energy of particles. However, losses tosurroundings will have a significant impact on the partictemperature and therefore its coalescence dynamics. Atailed description of the coalescence dynamics and enetransfer is obtained by numerically solving the coupled eqtions ~6! and ~7!.
We note that Eq.~7! is highly nonlinear in temperaturethrough the exponential dependence of the solid-state atodiffusion coefficientDGB in the particle, which is expresseas
DGB5A expS 2B
TpD , ~12!
where A and B are material-dependent constants~Table I!.Thus, in typical solid-state sintering, if particle temperatuincreases due to heat release effects, then lower gassures, higher volume loadings~higher collision frequency!,and high gas temperatures may result in particle heat gention being larger than heat loss to the surroundings. Thisturn, increases the diffusion coefficient (Deff) reduces thecharacteristic coalescence timet f and, hence, serves to further increase the particle temperature, and so on.
AIP license or copyright, see http://ojps.aip.org/jcpo/jcpcr.jsp
slana
imhes-ti
thntlaatic
rmto
hsr
gha
ta
o
esect
caes
tiete
s-asei
KK
mletan
m
or-
ess
s
ter
en
ofssed
ini-
ar-thestic
enngth
lrit
ightiono be
3395J. Chem. Phys., Vol. 119, No. 6, 8 August 2003 Shape evolution of nanoparticles grown as an aerosol
A further complication that may occur during a coalecence event, is that before the resulting particle can reback to the background gas temperature, it may encouyet another collision. This would be the case when the chacteristic coalescence time is larger than the collision t(t f.tcoll), thereby generating aggregates. On the othand, if t f,tcoll , particles have sufficient time to coalecence and no aggregate is formed. Therefore, the formaof the often-observed aggregate structure is determinedthe relative rates of collision and coalescence. However,heat release from coalescence, if not removed efficiefrom the particle, will keep the coalescence time small retive to the collision time and delay the onset of aggregformation. Our goal is to understand the nonlinear dynamleading to the formation of aggregates and its effect in teof growth characteristics of primary particles that go onform these aggregates.
Effect of lowered melting point of nanoparticleson coalescence
The diffusion mechanism in nanosized particles migdiffer from bulk diffusion processes and has been previoustudied.17 Although, the phenomenon is not clearly undestood, for most practical purposes of this work, one miassume that classical concepts of volume, grain boundand surface diffusion are applicable.24 Grain boundary diffu-sion has been pointed out as the most significant solid-sdiffusion process in polycrystalline nanosized particles,17,24
though the exact processes for atomic diffusion dependthe crystalline structures of particles.
The diffusion coefficient being very sensitive to thphase~molten or solid!, care must be taken to track the phachanges during the growth process. Of particular importanin the size range of interest, is the size dependence ofmelting point of ultrafine particles. We use here the empirirelation approximating the melting point of nanoparticlas27
Tmp~dp!5TmF124
LrpdpS ss2s1S rp
r1D 2/3D G . ~13!
Here,Tm is the bulk melting point,L the latent heat of melt-ing ~J/kg!, ss ands1 are the surface tensions~J/m2!, andrp
and r1 are the respective solid and liquid phase densi~kg/m3!. The various material property values are presenin Table I.
This effect of lowered melting point on particle coalecence process will turn out to be of importance for the cof titania growth studies to be investigated in this papsince the growth of these materials is typically conductedthe 1600–2000 K range. The application of Eq.~13! wouldshow that for titania that has a bulk melting point of 2103the melting point drops to about 1913 K at 5 nm and 1100for a 1 nmparticle. In such a scenario, at typical flame teperatures encountered in experiments, particles may coaunder a viscous flow mechanism as opposed to a solid-sdiffusion mechanism. It also implies that particles may ecounter a phase transition during a coalescence event sidue to the energy release process, i.e.,Tp(t).Tmp(dp).
Downloaded 04 Aug 2003 to 128.101.142.157. Redistribution subject to
-x
terr-er
onbye
ly-ess
tly-try,
te
n
e,hel
sd
er,n
,
-scete-ply
To take this into account, the diffusion process and cresponding characteristic coalescence times for the TiO2 casewere computed as follows:~1! when Tp(t),Tmp(dp), wehad assumed a solid-state grain boundary diffusion procto calculate coalescence time, as given by Eqs.~12! and ~2!when Tp(t).Tmp(dp), a viscous flow mechanism waused28 as
t f5mdeff
2s1, ~14a!
wherem is the viscosity at the particle temperature;s1 is theliquid surface tension of the particle, anddeff was taken to beproportional to the instantaneous effective particle diame(Vp /ap), i.e., deff56Vp /ap .
The viscositym is estimated from empirical relations29
as a function of particle temperature,Tp , and melting pointfor the corresponding particle size,Tmp(dp). The empiricalrelation for size-dependent viscosity of nanoparticles is givas
m51.831027
@M•Tmp~dp!#1/2expS L
RTpD
vm expF L
RTmp~dp!G, ~14b!
whereL is the latent heat of fusion/melting~J/mole! ~fromstandard thermodynamic properties!, R is the universal gasconstant~J/mole K!, vm is the molar volume~m3/mole!, andM is the molar weight~kg/mole!.
Radiation heat loss term for nanoparticles:A discussion
Thermal radiation from small particles is a subjectconsiderable interest and complexity and has been discuby a number of earlier works.30–33
Our prime concern is in the emissivity values neededEq. ~7! to determine the effect of radiation heat loss in typcal nanoparticles. However, unlike bulk materials, for pticles smaller than the wavelength of thermal radiation,emissivity becomes a strong function of the characteridimension of the particle.34 It is well known from Rayleighscattering theory that the absorption efficiency:Qabs}X,where,X is the nondimensional particle size parameter givasX5pdp /l, l being the wavelength of emitted radiatioconsidered. For very fine particles and for the wavelenrange of 800 nm or greater~for thermal radiation!, the valuesfor absorption efficiency (Qabs) are extremely small~around1025– 1027).
Now, from Kirchhoff’s law for radiation from sphericaparticles,Qabs5«.48 Hence, we conclude that emissivity fothermal radiations from nanoparticles in the Rayleigh lim(dp!l) are negligible unless we operate at extremely htemperatures. Thus, for all practical purposes, the radiaheat loss term for the present study can be assumed tnegligible and dropped from the energy equation~7! to giveits final form as
Nwcv
dTp
dt5
ss
t f~ap2asph!2Zcmgcg~Tp2Tg!2
DHvap
NAvZev.
~15!
AIP license or copyright, see http://ojps.aip.org/jcpo/jcpcr.jsp

io
-
dn
ive
quene,
id
eOo
ttha
ninr
maleesh
sse
ffi
-t ah
mee
za-ent
riatethe
is-eingof
foris
tionen-iniredhisongournt
tem
tice
ter-sive
nte
r--n
ter-the
u-sin
gu-
3396 J. Chem. Phys., Vol. 119, No. 6, 8 August 2003 Mukherjee, Sonwane, and Zachariah
Nondimensionalization
A convenient nondimensionalization of Eqs.~6! and~15!can be obtained through
t* 5t
t0; T* 5
Tp2Tg
Tg; a* 5
ap2asph
asph, ~16!
resulting in nondimensional form of surface area reduct@Eq. ~6!# and energy equation@Eq. ~15!# as
da*
dt*52
t0
t fa* , ~17!
and
dT*
dt*5S Es
EbD S t0
t fDa* 2S Eg
EbDT* 2S Ev
EbD . ~18!
Here, Es5ssasph; Eb5NwcvTg ; Eg5ZcmgcgTgt0 ,andEv5DHvap/NAvZev, wheret0 is the characteristic coalescence time calculated at gas temperature,Tg . The rest ofthe notations represent the same parameters as describelier in the section. Now, using these terms we could defithe following nondimensional energy terms asBHG
5(Es /Eb)(t0 /t f); Ccond5(Eg /Eb) and Cevap5(Ev /Eb)representing thedimensionless heat generation, conductheat loss, and the evaporative heat loss terms, respectively.
NUMERICAL MODEL: MONTE CARLO METHOD
It has been shown rigorously by Norris35 that the MonteCarlo approach approximates the aerosol coagulation etion for the number concentration of particles of any givsize as a function of time. Our kinetic Monte Carlo modhas been primarily based on the earlier works of Liffman36
Smith and Matsoukas,37 and the recently developed hybrMonte Carlo method of Efendiev and Zachariah.20
A number of Monte Carlo techniques have been devoped for simulating the growth of dispersed systems.these, the two primary techniques fall into the classConstant-Number~Constant-N! and the Constant-Volume~Constant-V! methods. The classicalConstant-V methodsamples a constant volume system of particles, and withadvancement of time reduces the number of particles insample due to coagulation. This is the same approach asother time-driven numerical integration and hence it doesoffer a uniform statistical accuracy in time. This reductionthe sample usually needs simulation for a large numbeinitial particles to ensure an acceptable level of accuracythe results. This might lead to an underutilization of the coputational resources.38 This problem can be overcome byConstant-Nmethod by refilling the empty sites of the particarray in the system, with copies of the surviving particlThis method has been shown to be more efficient, andbeen employed by Kostoglou and Konstandopoulos,38 Smithand Matsoukas,37 and Efendiev and Zachariah20 for simula-tion of particle coagulation.
To overcome this loss of accuracy due to a continuoudecreasing particle number arising from coagulation we ua discrete refilling procedure, as proposed by Liffman,36 inwhich whenever the particle number dropped to a suciently small value~50% of the initial number! the system
Downloaded 04 Aug 2003 to 128.101.142.157. Redistribution subject to
n
ear-e
a-
l
l-ff
heeny
ot
ofin-
.as
lyd
-
was replicated. TheConstant-N approach can be implemented in two general ways. The first approach is to setime intervalDt and then use Monte Carlo to decide whicand how many events will be realized in the specified tiinterval.36,39 This essentially amounts to integrating thpopulation balance forward in time and requires discretition of the time step. In the second approach, a single evis chosen to occur and the time is advanced by an appropamount to simulate the phenomenon associated withevent.40,41 This approach does not require explicit time dcretization, and has the advantage that the time step, bcalculated during the simulation, adjusts itself to the ratesthe various processes.
In the present work we employ the second approachdescribing particle coagulation, while the first approachused for simulating particle coalescence, once a coagulaevent has been identified. Thus, more precisely, we first idtify a single coagulation event to occur for the particlesour system and compute the mean interevent time requDT for the next coagulation event to occur. Then, during ttime interval, we simulate the coalescence process alwith the associated energy release for all the particles insystem. We note for clarity that at any identified interevetime between two successive particle~or, aggregates! colli-sions, there will be coalescence taking place for other sysparticles that had collided earlier in time.
It is important to recognize that the mean characteriscollision time (tcoll'tc) essentially signifies the mean timinterval that any particular particle~or aggregate! has to waitbefore it encounters another collision, while the mean inevent time represents the time between any two succescollision events (DT) among any two particles~or aggre-gates! in the system. The latter also becomes our MoCarlo simulation time step.
Implementation of MC algorithm: Determinationof characteristic time scales for coagulation
Let us consider a simulation system with an initial paticle concentration ofC0 . A choice of the number of particles N0 that can be efficiently handled in the simulatiodefines the effective computational volume,V05N0 /C0 . Toconnect the simulations to real time, we calculate the inevent time between any two successive collisions orMonte Carlo time step,DTk as inversely proportional to sumof the rates of all possible events:
DTk5V0
(1R15
2N0
C0( i 51Nk21( i 51
Nk21Ki jF , ~19!
whereR15Ki j is the rate of event 1, defined as the coaglation of the pair~i, j!, Ki j is the coagulation kernel for sizei and j, andV05N0 /C0 is the actual volume representedthe simulation system for particle concentration,C0 , andnumber of simulation particles,N0 .
For computational time efficiency, we use a mean coalation probability,^Ki j
F &, defined as
^Ki jF &5
( i 51Nk21( j 51
Nk21Ki jF
Nk21~Nk2121!. ~20!
AIP license or copyright, see http://ojps.aip.org/jcpo/jcpcr.jsp
s
ma
nt
nt
lf
re
-
e
ale
-i-
prran
e
emvteitha
all
ti
nlyis
oveponith
hs-
co-li-theustme
theure
e,e,
les
eindi-fultheeris-
dintoh, but
eat
ves
ean
3397J. Chem. Phys., Vol. 119, No. 6, 8 August 2003 Shape evolution of nanoparticles grown as an aerosol
Hence, the final form for the Monte Carlo time step a
DTk52N0
C0^Ki jF &Nk21~Nk2121!
. ~21!
Now, for each collision event, we use the interevent ti(DTk or, simply,DT) determined above, to simulate the colescence process forall particles by integrating the surfacearea reduction and the energy equations. Then based omean values of the area, volume, and temperature ofparticles in the system calculated at the end of each MoCarlo time step, the mean characteristic collision time (tc) inthe free molecular regime is estimated from the sepreserving size distribution theory of Friedlander5 as
tc53/B, where B5~a/2!S 6kBTp
rpD 1/2S 3
4p D 1/6
fVp~25/6! ,
~22!
where Tp and Vp stands for the mean particle temperatuand volume,a, a dimensionless constant equal to 6.55,42 rp
is the density of the particle material~assumed to be temperature independent!, andf is the material volume loadingin the system considered.
Thus, for each of these interevent timesDTk, an integra-tion time stepDt for the coalescence process is determinas
Dt5DTk
nmax, ~23a!
and
nmax5DTk
t f3p, ~23b!
wherenmax is the number of iterative loops for the numericintegration in time;t f is the characteristic coalescence timpreviously defined in Eq.~8! andp is any integer value normally chosen asp510. This method of choosing the numercal time step ensures sufficient discretization of time stepobtain desired resolution for simulating the coalescencecess over the particular interevent collision time and chateristic sintering time, both of which are sensitive to size atemperature.
In order to implement the numerical computation, wdefined the coagulation probability as
pi j 5Ki j
F
KmaxF , ~24!
where,KmaxF is the maximum value of the coagulation kern
among all droplets. At each step two particles are randoselected and a decision is made whether a coagulation eoccurs based onpi j . If the event takes place, we calculathe interevent time,DTk, as shown earlier, and go ahead wthe coalescence process. As indicated earlier by SmithMatsoukas37 as well as Efendiev and Zachariah,20 this prob-ability should, in principle, be normalized by the sum ofKi j but the choice ofKmax
F is commonly employed in order toincrease the acceptance rate while maintaining the relamagnitude of probabilities.
Downloaded 04 Aug 2003 to 128.101.142.157. Redistribution subject to
e-
thehee-
-
d
too-c-d
llyent
nd
ve
In our implementation, a coagulation event occurs oif a random number drawn from a uniform distributionsmaller than the coagulation probability,pi j . If the coagula-tion is rejected, two new particles are picked and the absteps are repeated until a coagulation condition is met. Usuccessful completion of this step the selected particles wvolumesVi andVj are combined to form a new particle witvolumeVi1Vj and the total number of particles in the sytem is decreased by unity.
When the number of particles due to this repeatedagulation process drops to half of the initial value, we repcate the particles in the system. In order to preservephysical connection to time, the topping up process mpreserve the average behavior of the system like the voluloading or the particle number density corresponding totime prior to the topping up. In particular, one has to ensthat the interevent time for particle collisions stays the samand to do this, we increase the effective simulation volumV0 , in proportion to the increase in the number of particin the topped up system.
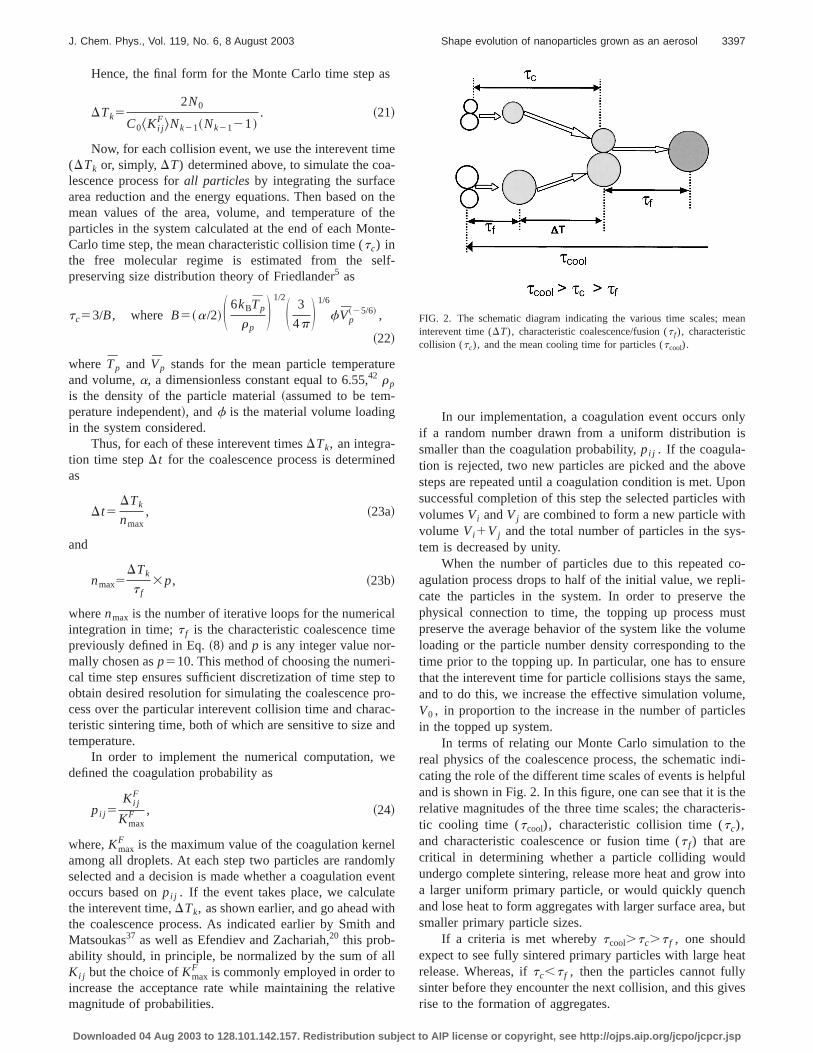
In terms of relating our Monte Carlo simulation to threal physics of the coalescence process, the schematiccating the role of the different time scales of events is helpand is shown in Fig. 2. In this figure, one can see that it isrelative magnitudes of the three time scales; the characttic cooling time (tcool), characteristic collision time (tc),and characteristic coalescence or fusion time (t f) that arecritical in determining whether a particle colliding woulundergo complete sintering, release more heat and growa larger uniform primary particle, or would quickly quencand lose heat to form aggregates with larger surface areasmaller primary particle sizes.
If a criteria is met wherebytcool.tc.t f , one shouldexpect to see fully sintered primary particles with large hrelease. Whereas, iftc,t f , then the particles cannot fullysinter before they encounter the next collision, and this girise to the formation of aggregates.
FIG. 2. The schematic diagram indicating the various time scales; minterevent time (DT), characteristic coalescence/fusion (t f), characteristiccollision (tc), and the mean cooling time for particles (tcool).
AIP license or copyright, see http://ojps.aip.org/jcpo/jcpcr.jsp
forisopa
sigulclee
0yeonu
hm
rns
ut-ing
u-heen-ace,ud-gasnifi-
nstant
cynal
ngurylf-.
ool-icle800l
n oflerandthentro-cen-izesid-es toingfion.
arltio
te
rnel.
3398 J. Chem. Phys., Vol. 119, No. 6, 8 August 2003 Mukherjee, Sonwane, and Zachariah
RESULTS AND DISCUSSION
Validation of the algorithm
In order to estimate the number of particles neededaccurate statistics of the system, we studied the charactecollision and fusion times, temperature rise, and other prerties for two systems consisting of 1000 and 10 000 pticles, respectively. Although computation time increasesnificantly, there is an insignificant change in the mean resfor characteristic collision times, fusion times, and partitemperature of these two systems, indicating the attainmof statistical equilibrium. As the plots ofTp versus time aswell as t f and tc versus time for 1000 particle and 10 00particle systems overlap, results of only a 1000 particle stem has been provided. Also, all the results in the presKMC simulation have been obtained by using simulatisystems of 1000 particles. It may be recalled here that theof a topping up technique proposed by Liffman,36 allows usto reduce the statistical errors in our simulation, even witsmaller number of particles, thereby requiring lesser coputer memory.
The average time for a typical simulation of 1000 paticles with volume loading of 1024 was anywhere betwee15 to 2 hours~depending on the parameters of the ca
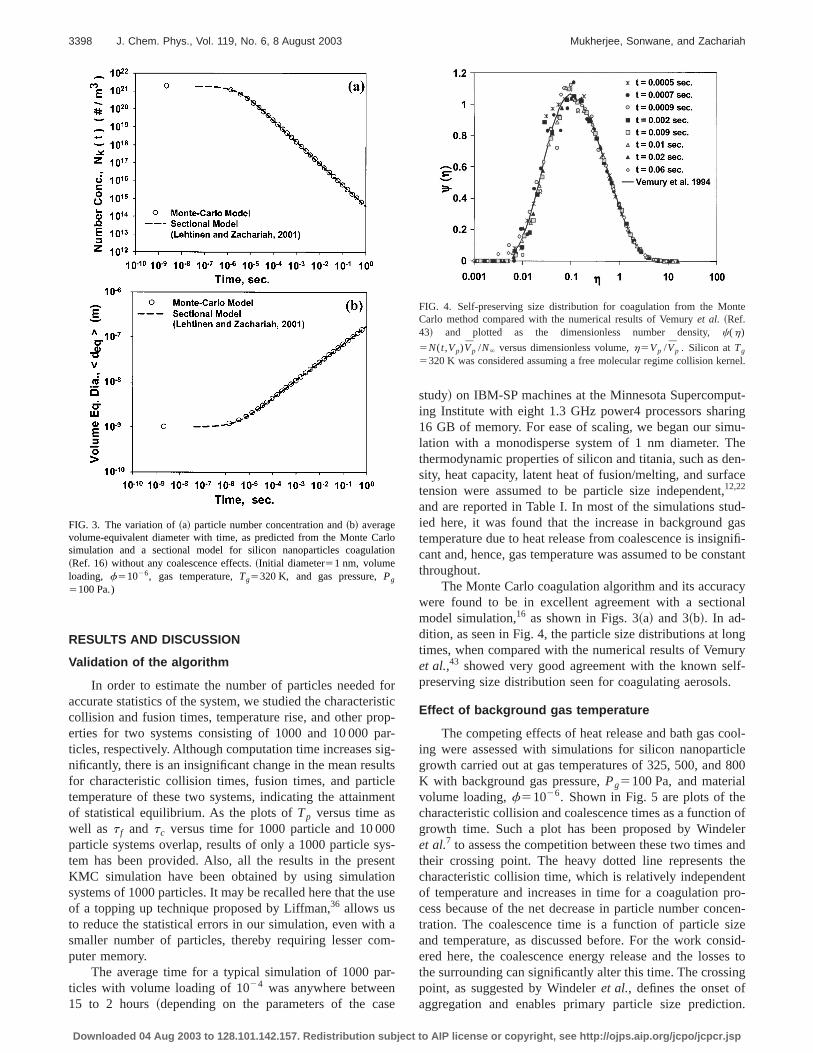
FIG. 3. The variation of~a! particle number concentration and~b! averagevolume-equivalent diameter with time, as predicted from the Monte Csimulation and a sectional model for silicon nanoparticles coagula~Ref. 16! without any coalescence effects.~Initial diameter51 nm, volumeloading, f51026, gas temperature,Tg5320 K, and gas pressure,Pg
5100 Pa.)
Downloaded 04 Aug 2003 to 128.101.142.157. Redistribution subject to
rtic-
r--
ts
nt
s-nt
se
a-
-
e
study! on IBM-SP machines at the Minnesota Supercomping Institute with eight 1.3 GHz power4 processors shar16 GB of memory. For ease of scaling, we began our simlation with a monodisperse system of 1 nm diameter. Tthermodynamic properties of silicon and titania, such as dsity, heat capacity, latent heat of fusion/melting, and surftension were assumed to be particle size independent12,22
and are reported in Table I. In most of the simulations stied here, it was found that the increase in backgroundtemperature due to heat release from coalescence is insigcant and, hence, gas temperature was assumed to be cothroughout.
The Monte Carlo coagulation algorithm and its accurawere found to be in excellent agreement with a sectiomodel simulation,16 as shown in Figs. 3~a! and 3~b!. In ad-dition, as seen in Fig. 4, the particle size distributions at lotimes, when compared with the numerical results of Vemet al.,43 showed very good agreement with the known sepreserving size distribution seen for coagulating aerosols
Effect of background gas temperature
The competing effects of heat release and bath gas cing were assessed with simulations for silicon nanopartgrowth carried out at gas temperatures of 325, 500, andK with background gas pressure,Pg5100 Pa, and materiavolume loading,f51026. Shown in Fig. 5 are plots of thecharacteristic collision and coalescence times as a functiogrowth time. Such a plot has been proposed by Windeet al.7 to assess the competition between these two timestheir crossing point. The heavy dotted line representscharacteristic collision time, which is relatively independeof temperature and increases in time for a coagulation pcess because of the net decrease in particle number contration. The coalescence time is a function of particle sand temperature, as discussed before. For the work conered here, the coalescence energy release and the lossthe surrounding can significantly alter this time. The crosspoint, as suggested by Windeleret al., defines the onset oaggregation and enables primary particle size predict
on
FIG. 4. Self-preserving size distribution for coagulation from the MonCarlo method compared with the numerical results of Vemuryet al. ~Ref.43! and plotted as the dimensionless number density,c(h)
5N(t,Vp)Vp /N` versus dimensionless volume,h5Vp /Vp . Silicon atTg
5320 K was considered assuming a free molecular regime collision ke
AIP license or copyright, see http://ojps.aip.org/jcpo/jcpcr.jsp

intr
mnalsewveans
rpe
segthertuhetic
era-al-nter-ialeate.ate
ionyingr sosig-
d the
there,
sent
-
ver-be-hean
er
canas-em-anyctive,
lent,
3399J. Chem. Phys., Vol. 119, No. 6, 8 August 2003 Shape evolution of nanoparticles grown as an aerosol
However, we show later that the use of the crossing pobetweent f andtc to predict primary particle sizes might nobe universally applicable. For the various gas temperatustudied here, we found that with increasing residence tit f initially decreases, reaches a minimum, and then motonically increases. The decrease in the characteristic cocence~fusion! time t f is actually associated with an increain the particle temperature and is shown in Fig. 6. Heresee that the particle temperature takes an abrupt andrapid rise to a value well in excess of 1200 K. This isindication that the characteristic cooling time under theconditions is slow relative to the fusion time,t f , implyinglarger heat generation. Higher background temperatushow an earlier onset of elevated temperatures and alonged dwell time at higher temperatures due to the lowdriving force for cooling. At the same time, the delayed onof heat release effects generate larger aggregates tryincoalesce fully, which causes a stronger driving force forheat generation arising from the surface area reduction tand, hence, an increase in the net rise in particle temperaReferring back to Fig. 5, we see that the minimum in tcoalescence time roughly corresponds to the peak par
FIG. 5. Variation of characteristic fusion (t f) and collision (tc) times withresidence time for various background gas temperatures for silicon~gaspressure,Pg5100 Pa and volume loading,f51026).
FIG. 6. Variation of mean silicon particle temperature (^Tp&) with residencetime for various background gas temperatures,Tg , at constant gas pressurePg5100 Pa, and particle volume loading,f51026.
Downloaded 04 Aug 2003 to 128.101.142.157. Redistribution subject to
t
ese,o-es-
ery
e
esro-rtto
emre.
le
temperature achieved. Also, with increasing gas temptures, for the same particle size distribution, the relative vues oft f decrease buttc remains relatively unchanged. Ithe context of our discussion of the comparison of characistic times, we see from Figs. 5 and 6 that after the initdrop the coalescence time eventually rises, coupled with hloss from particles, until it crosses the collision time curvAt this point one can reasonably conclude that aggregformation has been triggered. Beyond this, in the regwheret f.tc , the particles do not get sufficient time to fullsinter before the next collision takes place thereby formaggregates. Eventually, the particles get sufficiently largethat their heat capacity is large enough as to negate anynificant temperature rise associated with coalescence angrowing particles return to the background temperature.
The effect on primary particle size, surface area, andonset of aggregation are illustrated in Fig. 7. In this figuwe plot the normalized surface areaA( i ) /Asph(i ) ~or, A/Asph),which is the actual surface area (ap) to that of the volumeequivalent sphere (asph) as a function of time. It is to benoted here that the notationA( i ) /Asph(i ) ~or, A/Asph) for nor-malized area used in all plots and discussions in the prework is equivalent to the notationap /asph, as used earlier inthe theory. Values ofA/Asph larger than unity are a first indication of aggregate formation~i.e., A/Asph51 impliesspheres;A/Asph.1 indicates agglomerate formation!. Alsoplotted is the volume equivalent diameter,deq ~under theassumption of spherical geometry!. Primary particle sizescan be estimated at the onset of aggregation by movingtically from the point where the surface area curve justgins to deviate from unity to the corresponding point on tvolume-equivalent diameter curve. From Fig. 7, one cclearly see that the delayed onset~in time! of aggregate for-mation also implies larger primary particle size and lowsurface area.
The effect of heat release on primary particle sizesbe seen by turning off the energy equations solver andsuming that particles are always at the background gas tperature. This essentially implies coalescence withoutheat release effects, which is also indicated as the respedotted lines fort f in Fig. 5 and forA/Asph in Fig. 7. We see
FIG. 7. Variation of silicon normalized area and mean volume equivadiameter with residence time for various background gas temperaturesTg ,Pg5100 Pa, and particle volume loading,f51026 (A( i ) : particle areaandAsph(i ) : equivalent spherical area of the corresponding particle!.
AIP license or copyright, see http://ojps.aip.org/jcpo/jcpcr.jsp

bcdesthn
,ryr
e, ae
vahor
gaio
xohgaeor-.eAtnssal
e
rlierltstedingsizehis
there-werion.e-res-be
iclethe
es
e r
3400 J. Chem. Phys., Vol. 119, No. 6, 8 August 2003 Mukherjee, Sonwane, and Zachariah
that without heat release, the characteristic fusion timecomes a monotonically increasing function of time assoated with particle growth and does not undergo the suddecrease in fusion time or enhanced coalescence rate asated with heat release. The effect is most important for325 K case, where without heat release no coalescewould take place as seen by the fact thatt f is always greaterthantc andA/Asph deviates from unity almost immediatelyimplying the formation of aggregates with 1 nm primaparticles, while with heat release we predict 9 nm primaparticle sizes~see Figs. 5 and 7!.
It is possible that with higher temperatures asdt f /dtapproachesdtc /dt ~at the crossing point, i.e.,t f'tc), ob-long particles with long necks and strong bonds are formthat would eventually go on to form aggregates. Howeverlower temperature the crossing occurs within the heat geration regime anddt f /dt@dtc /dt ~at t f'tc). Thus, in thiscase, uniform spherical particles held together by weakder Waals’ forces in the agglomerates are formed. Ttheory was also found to be consistent with the earlier wof Windeleret al.7
Effect of background gas pressure
The conventional wisdom has held that backgroundpressure has no role in the heat transfer during the colliscoalescence process. This presumption has held swaycause until very recently prior work had neglected the ethermic nature of coalescence. Lehtinen and Zacharia6,21
were the first to recognize this effect and conclude thatpressurePg should have an impact on primary particle siz
The effect ofPg on t f at a constant gas temperature fsilicon (Tg5500 K,f51026) is shown in Fig. 8. The corresponding mean particle temperatures are shown in Fig. 910 kPa, the effect of heat release is negligible as the hlosses to the surroundings are evidently sufficiently facile.one decreases the pressure, however, the lowered heaterm through conduction enables the particles to experieelevated temperatures. In these cases the lower the prethe higher the particle temperatures. This self-heating is
FIG. 8. Variation of characteristic coalescence/fusion (t f) and characteristiccollision (tc) times with residence time for various background gas prsures,Pg , Tg5500 K and particle volume loading,f51026. A gray pointmarks the gradient change fort f corresponding to the point wherA/Asph>1. Results are for silicon.
Downloaded 04 Aug 2003 to 128.101.142.157. Redistribution subject to
e-i-n
oci-ece
y
dt
n-
nisk
sn/be--
s.
Atatslossceure
so
reflected in the lowering of the characteristic sintering timseen in Fig. 8. We estimate the primary particle size (dprim)from the normalized area term (A/Asph.1) and the corre-sponding volume-equivalent diameter, as discussed ea~not shown here! at the point of agglomeration. These resuare presented in Fig. 10. At the highest pressure simulathe role of heat release is unimportant, while with decreaspressure we see a monotonic increase in primary particlefrom roughly about 3 nm at 101 kPa to 13 nm 100 Pa. Tincrease clearly establishes the effect of gas pressure onprimary particle growth rates and, as seen from Fig. 9,flects the higher particle temperatures experienced at lopressures resulting from a lower heat loss rate by conductIt is clearly noticed that the fusion and collision times prsented in Fig. 8 show a crossing point independent of psure! This result indicates that the crossing point may notthe best criteria for assessing the spherical primary partsize, especially beyond the heat generation regime whererelative gradients of the characteristic times, i.e.,dt f /dt and
-FIG. 9. The variation of mean silicon particle temperature (^Tp&) with resi-dence time for various background gas pressures,Pg , Tg5500 K, and par-ticle volume loading,f51026. A gray point marks the gradient change fot f corresponding to the point whereA( i ) /Asph(i )>1.
FIG. 10. The effect of background gas pressures (Pg) on primary particlesize (dprim) for silicon nanoparticles at constant gas temperature,Tg
5500 K and particle volume loading,f51026. The primary particle sizepredicted without a heat release effect has also been indicated.
AIP license or copyright, see http://ojps.aip.org/jcpo/jcpcr.jsp
ra
rorithn
g
foaraoo
ate
padueo
in
inpp
aid
ntll
aleal-do, ih
di-the
ntialicle
he
-ing1
lyhat
nce
a101-
thee tosin-
etes11
era-rentpide-on-ndiontelethat
fo
en
3401J. Chem. Phys., Vol. 119, No. 6, 8 August 2003 Shape evolution of nanoparticles grown as an aerosol
dtc /dt at the crossing point are close to each. The two gpoints in Fig. 8 mark a noticeable change indt f /dt, indicat-ing the time where the normalized surface area deviates funity (A/Asph.1), and was used for determining the sphecal primary particle sizes. Beyond this point, and beforeparticles are agglomerated~i.e., the crossing point betweet f and tc) the primary particles are nonspherical~possiblyoblong with large necks! mainly due to the slow crossinpoint of t f andtc , as discussed in details earlier.7
We also applied the model to titania nanoparticlesdifferent gas pressures (Pg5100 Pa and 1, 10, and 101 kP!at Tg51600 K. We choose this example because the opeing temperature is one used in industry for the productiontitania. It should noted here that the present simulationparticle growth rates due to coalescence has been initifrom the time precursor reactions leading to 100% convsion of precursors (TiC4 or, TTIP! to titania nanoparticleshave been achieved, so that we have a sufficiently largeticle number concentration and growth rates are purelyto collision/coalescence process without any nucleationfects. The results illustrate the role of phase transitiongrowth along with the effect of the size-dependent meltpoint of nanoparticles. We rely on Eq.~13! to determine, fora given particle, if we are above or below the melting poat any instant in the coalescence process and use the apriate sintering model~solid-state or viscous flow!. This be-comes essential since viscous flow characteristic timestwo to three orders of magnitude lower than that for solstate diffusion.
The plot oft f andtc versus residence time at differepressures for titania is shown in Fig. 11. Initially for smaparticle sizes~1 nm! Tp(t).Tmp(dp) @from Eq. ~13!#, par-ticles are in a molten state and, hence, characteristic cocence time (t f) is very small so that particles coalescemost instantly on contact. But as particle sizes increaseto coagulation/coalescence, the corresponding melting palso increases and rises above the particle temperatureTp(t),Tmp(dp) and the particles shift over to the muc
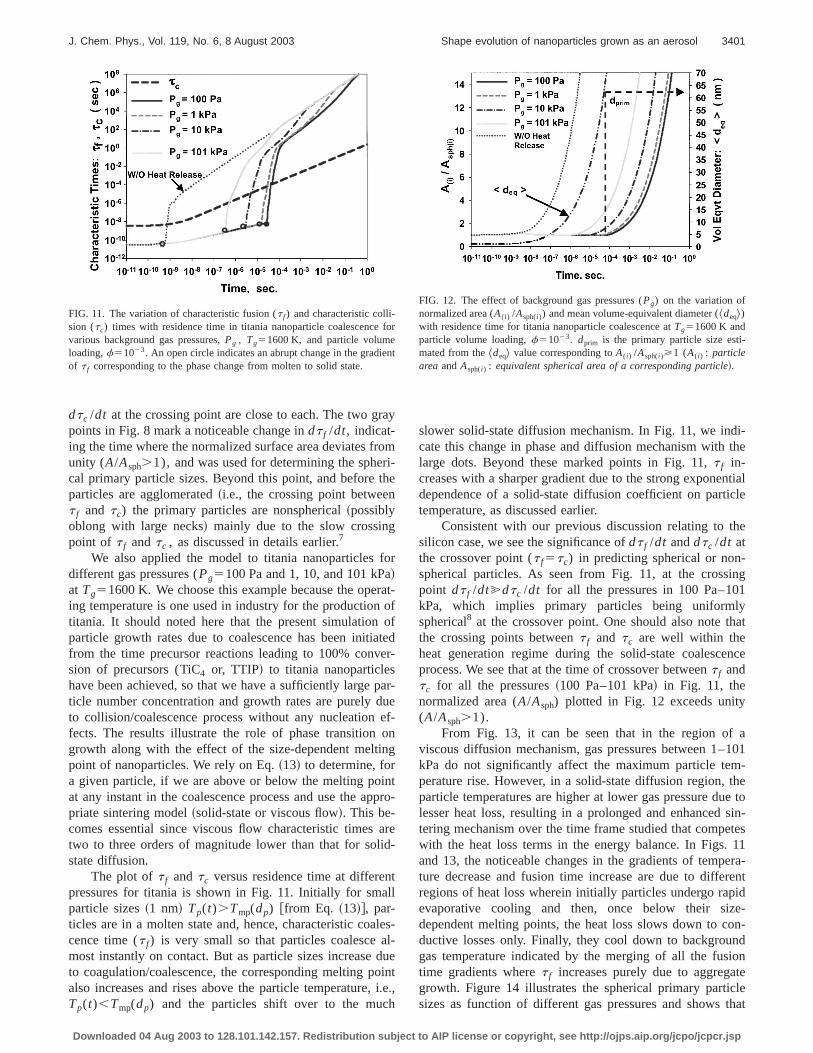
FIG. 11. The variation of characteristic fusion (t f) and characteristic colli-sion (tc) times with residence time in titania nanoparticle coalescencevarious background gas pressures,Pg , Tg51600 K, and particle volumeloading,f51023. An open circle indicates an abrupt change in the gradiof t f corresponding to the phase change from molten to solid state.
Downloaded 04 Aug 2003 to 128.101.142.157. Redistribution subject to
y
m-e
r
t-ff
edr-
r-ef-ng
tro-
re-
s-
ueint.e.,
slower solid-state diffusion mechanism. In Fig. 11, we incate this change in phase and diffusion mechanism withlarge dots. Beyond these marked points in Fig. 11,t f in-creases with a sharper gradient due to the strong exponedependence of a solid-state diffusion coefficient on parttemperature, as discussed earlier.
Consistent with our previous discussion relating to tsilicon case, we see the significance ofdt f /dt anddtc /dt atthe crossover point (t f5tc) in predicting spherical or nonspherical particles. As seen from Fig. 11, at the crosspoint dt f /dt@dtc /dt for all the pressures in 100 Pa–10kPa, which implies primary particles being uniformspherical8 at the crossover point. One should also note tthe crossing points betweent f and tc are well within theheat generation regime during the solid-state coalesceprocess. We see that at the time of crossover betweent f andtc for all the pressures~100 Pa–101 kPa! in Fig. 11, thenormalized area (A/Asph) plotted in Fig. 12 exceeds unity(A/Asph.1).
From Fig. 13, it can be seen that in the region ofviscous diffusion mechanism, gas pressures between 1–kPa do not significantly affect the maximum particle temperature rise. However, in a solid-state diffusion region,particle temperatures are higher at lower gas pressure dulesser heat loss, resulting in a prolonged and enhancedtering mechanism over the time frame studied that compwith the heat loss terms in the energy balance. In Figs.and 13, the noticeable changes in the gradients of tempture decrease and fusion time increase are due to differegions of heat loss wherein initially particles undergo raevaporative cooling and then, once below their sizdependent melting points, the heat loss slows down to cductive losses only. Finally, they cool down to backgrougas temperature indicated by the merging of all the fustime gradients wheret f increases purely due to aggregagrowth. Figure 14 illustrates the spherical primary particsizes as function of different gas pressures and shows
r
t
FIG. 12. The effect of background gas pressures (Pg) on the variation ofnormalized area (A( i ) /Asph(i )) and mean volume-equivalent diameter (^deq&)with residence time for titania nanoparticle coalescence atTg51600 K andparticle volume loading,f51023. dprim is the primary particle size esti-mated from the deq& value corresponding toA( i ) /Asph(i )>1 (A( i ) : particlearea andAsph(i ) : equivalent spherical area of a corresponding particle!.
AIP license or copyright, see http://ojps.aip.org/jcpo/jcpcr.jsp
tic
hadiabc-lyfal
lesonighes,
an
into
f sili-e-sedro-ac-re
reas-ngrten-t aen-up
icleFig.ol-nia
ory
se
ra-
-
3402 J. Chem. Phys., Vol. 119, No. 6, 8 August 2003 Mukherjee, Sonwane, and Zachariah
background pressure can be used to alter the primary parsize.
Effect of volume loading
Volume loading is another important parameter thatbeen neglected in studies of the primary particle size pretion for nanoparticle coalescence processes. Common lratory experiments are usually limited to low volume frations (f51026) for the ease of experimentation, particularfor those who useinsitu optical probes. Industrial practice ocourse seeks to maximize the production rate and typicoperates at much higher volume fractions (f51023). With-out the consideration of the exothermic nature of coacence, it is natural to expect no role for the volume fractiOn the other hand, with heat release considered we mexpect that under rapid coalescence conditions, whererelease is faster than energy loss to the surroundinghigher collision rate might magnify the effect.
The model has been applied to various laboratoryindustrial volume loadings in the range off51026 to 1023
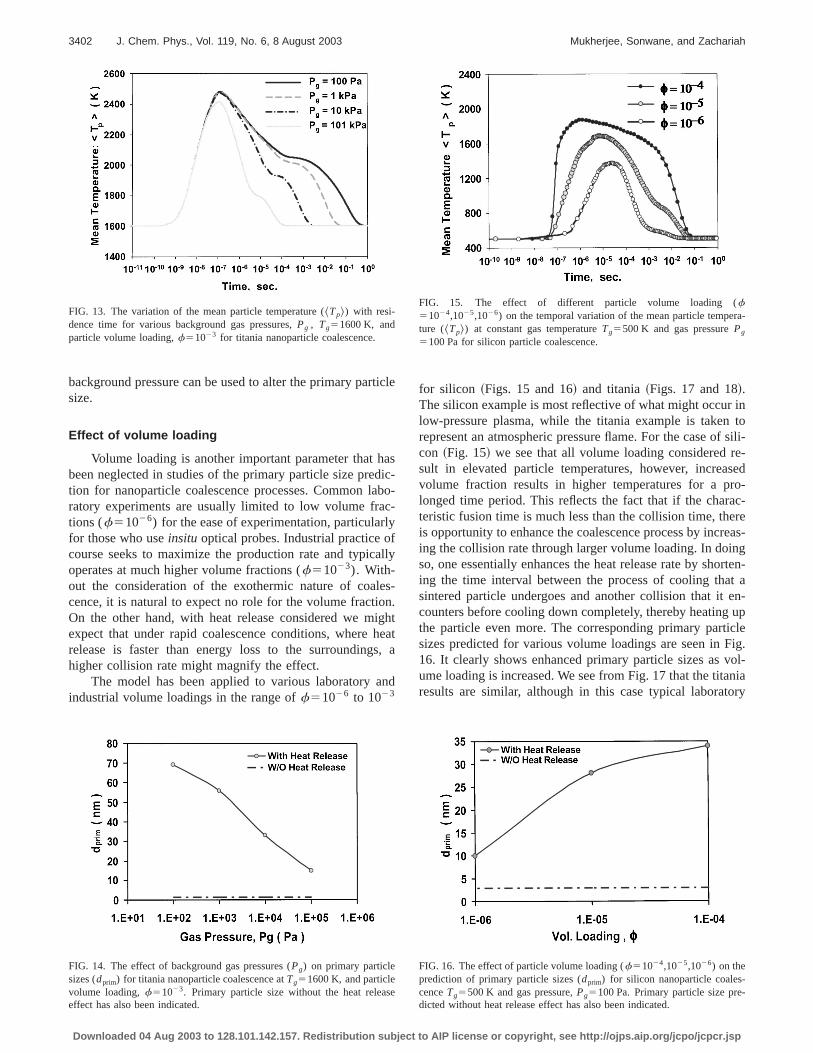
FIG. 13. The variation of the mean particle temperature (^Tp&) with resi-dence time for various background gas pressures,Pg , Tg51600 K, andparticle volume loading,f51023 for titania nanoparticle coalescence.
FIG. 14. The effect of background gas pressures (Pg) on primary particlesizes (dprim) for titania nanoparticle coalescence atTg51600 K, and particlevolume loading,f51023. Primary particle size without the heat releaeffect has also been indicated.
Downloaded 04 Aug 2003 to 128.101.142.157. Redistribution subject to
le
sc-o-
ly
-.htata
d
for silicon ~Figs. 15 and 16! and titania~Figs. 17 and 18!.The silicon example is most reflective of what might occurlow-pressure plasma, while the titania example is takenrepresent an atmospheric pressure flame. For the case ocon ~Fig. 15! we see that all volume loading considered rsult in elevated particle temperatures, however, increavolume fraction results in higher temperatures for a plonged time period. This reflects the fact that if the charteristic fusion time is much less than the collision time, theis opportunity to enhance the coalescence process by incing the collision rate through larger volume loading. In doiso, one essentially enhances the heat release rate by shoing the time interval between the process of cooling thasintered particle undergoes and another collision that itcounters before cooling down completely, thereby heatingthe particle even more. The corresponding primary partsizes predicted for various volume loadings are seen in16. It clearly shows enhanced primary particle sizes as vume loading is increased. We see from Fig. 17 that the titaresults are similar, although in this case typical laborat
FIG. 15. The effect of different particle volume loading (f51024,1025,1026) on the temporal variation of the mean particle tempeture ( Tp&) at constant gas temperatureTg5500 K and gas pressurePg
5100 Pa for silicon particle coalescence.
FIG. 16. The effect of particle volume loading (f51024,1025,1026) on theprediction of primary particle sizes (dprim) for silicon nanoparticle coales-cenceTg5500 K and gas pressure,Pg5100 Pa. Primary particle size predicted without heat release effect has also been indicated.
AIP license or copyright, see http://ojps.aip.org/jcpo/jcpcr.jsp
le(u
ar
ed
thticun
eacsro
inad-ncerac-ar-
m-heaten-
encer-upisthe
erat-oa-
pi-verylesther-
ude, in-pres-wthom
for-14,
l.
ci.
ci.
h,
-
as
3403J. Chem. Phys., Vol. 119, No. 6, 8 August 2003 Shape evolution of nanoparticles grown as an aerosol
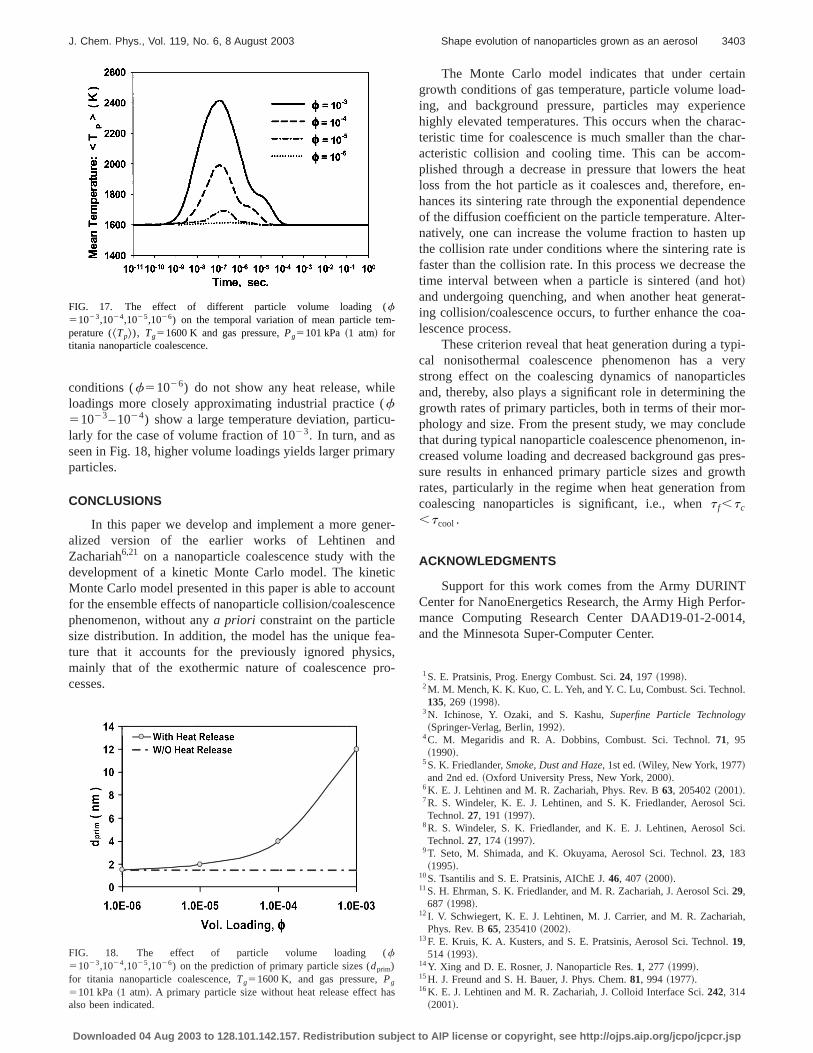
conditions (f51026) do not show any heat release, whiloadings more closely approximating industrial practicef51023– 1024) show a large temperature deviation, particlarly for the case of volume fraction of 1023. In turn, and asseen in Fig. 18, higher volume loadings yields larger primparticles.
CONCLUSIONS
In this paper we develop and implement a more genalized version of the earlier works of Lehtinen anZachariah6,21 on a nanoparticle coalescence study withdevelopment of a kinetic Monte Carlo model. The kineMonte Carlo model presented in this paper is able to accofor the ensemble effects of nanoparticle collision/coalescephenomenon, without anya priori constraint on the particlesize distribution. In addition, the model has the unique fture that it accounts for the previously ignored physimainly that of the exothermic nature of coalescence pcesses.
FIG. 17. The effect of different particle volume loading (f51023,1024,1025,1026) on the temporal variation of mean particle temperature (Tp&), Tg51600 K and gas pressure,Pg5101 kPa~1 atm! fortitania nanoparticle coalescence.
FIG. 18. The effect of particle volume loading (f51023,1024,1025,1026) on the prediction of primary particle sizes (dprim)for titania nanoparticle coalescence,Tg51600 K, and gas pressure,Pg
5101 kPa~1 atm!. A primary particle size without heat release effect halso been indicated.
Downloaded 04 Aug 2003 to 128.101.142.157. Redistribution subject to
-
y
r-
e
ntce
-,-
The Monte Carlo model indicates that under certagrowth conditions of gas temperature, particle volume loing, and background pressure, particles may experiehighly elevated temperatures. This occurs when the chateristic time for coalescence is much smaller than the chacteristic collision and cooling time. This can be accoplished through a decrease in pressure that lowers theloss from the hot particle as it coalesces and, therefore,hances its sintering rate through the exponential dependof the diffusion coefficient on the particle temperature. Altenatively, one can increase the volume fraction to hastenthe collision rate under conditions where the sintering ratefaster than the collision rate. In this process we decreasetime interval between when a particle is sintered~and hot!and undergoing quenching, and when another heat gening collision/coalescence occurs, to further enhance the clescence process.
These criterion reveal that heat generation during a tycal nonisothermal coalescence phenomenon has astrong effect on the coalescing dynamics of nanoparticand, thereby, also plays a significant role in determininggrowth rates of primary particles, both in terms of their mophology and size. From the present study, we may conclthat during typical nanoparticle coalescence phenomenoncreased volume loading and decreased background gassure results in enhanced primary particle sizes and grorates, particularly in the regime when heat generation frcoalescing nanoparticles is significant, i.e., whent f,tc
,tcool.
ACKNOWLEDGMENTS
Support for this work comes from the Army DURINTCenter for NanoEnergetics Research, the Army High Permance Computing Research Center DAAD19-01-2-00and the Minnesota Super-Computer Center.
1S. E. Pratsinis, Prog. Energy Combust. Sci.24, 197 ~1998!.2M. M. Mench, K. K. Kuo, C. L. Yeh, and Y. C. Lu, Combust. Sci. Techno135, 269 ~1998!.
3N. Ichinose, Y. Ozaki, and S. Kashu,Superfine Particle Technology~Springer-Verlag, Berlin, 1992!.
4C. M. Megaridis and R. A. Dobbins, Combust. Sci. Technol.71, 95~1990!.
5S. K. Friedlander,Smoke, Dust and Haze, 1st ed.~Wiley, New York, 1977!and 2nd ed.~Oxford University Press, New York, 2000!.
6K. E. J. Lehtinen and M. R. Zachariah, Phys. Rev. B63, 205402~2001!.7R. S. Windeler, K. E. J. Lehtinen, and S. K. Friedlander, Aerosol STechnol.27, 191 ~1997!.
8R. S. Windeler, S. K. Friedlander, and K. E. J. Lehtinen, Aerosol STechnol.27, 174 ~1997!.
9T. Seto, M. Shimada, and K. Okuyama, Aerosol Sci. Technol.23, 183~1995!.
10S. Tsantilis and S. E. Pratsinis, AIChE J.46, 407 ~2000!.11S. H. Ehrman, S. K. Friedlander, and M. R. Zachariah, J. Aerosol Sci.29,
687 ~1998!.12I. V. Schwiegert, K. E. J. Lehtinen, M. J. Carrier, and M. R. Zacharia
Phys. Rev. B65, 235410~2002!.13F. E. Kruis, K. A. Kusters, and S. E. Pratsinis, Aerosol Sci. Technol.19,
514 ~1993!.14Y. Xing and D. E. Rosner, J. Nanoparticle Res.1, 277 ~1999!.15H. J. Freund and S. H. Bauer, J. Phys. Chem.81, 994 ~1977!.16K. E. J. Lehtinen and M. R. Zachariah, J. Colloid Interface Sci.242, 314
~2001!.
AIP license or copyright, see http://ojps.aip.org/jcpo/jcpcr.jsp
em
er
er.
3404 J. Chem. Phys., Vol. 119, No. 6, 8 August 2003 Mukherjee, Sonwane, and Zachariah
17M. R. Zachariah and M. J. Carrier, J. Aerosol Sci.30, 1139~1999!.18D. E. Rosner and S. Yu, AIChE J.47, 545 ~2001!.19F. E. Kruis, A. Maisels, and H. Fissan, AIChE J.46, 1735~2000!.20Y. Efendiev and M. R. Zachariah, J. Colloid Interface Sci.249, 30 ~2002!.21K. E. J. Lehtinen and M. R. Zachariah, J. Aerosol Sci.33, 357 ~2002!.22M. R. Zachariah, M. J. Carrier, and E. Blasiten-Barojas, J. Phys. Ch
100, 14856~1996!.23W. Koch and S. K. Friedlander, J. Colloid Interface Sci.140, 419 ~1990!.24M. K. Wu, R. S. Windeler, C. K. R. Steiner, T. Bors, and S. K. Friedland
Aerosol Sci. Technol.19, 527 ~1993!.25C. L. Yaws,Handbook of Vapor Pressure~Gulf Publishing Co., Houston,
1994!.26G. V. Samsonov,The Oxide Handbook~IFI/Plenum, New York, 1973!.27P. Buffat and J. P. Borel, Phys. Rev. A13, 2287~1976!.28P. Tandon and D. E. Rosner, J. Colloid Interface Sci.213, 273 ~1999!.29T. Iida, H. Sakai, Y. Kita, and K. Murakami, High Temperature Mat
Process.19, 153 ~2000!.30K. Hansen and E. E. B. Campbell, Phys. Rev. E58, 5477~1998!.31S. Kumar and C. L. Tien, J. Heat Transfer112, 178 ~1990!.32P. M. Tomchuk and B. P. Tomchuk, Zh. Eksp. Teor. Fiz.112, 661 ~1997!.33I. S. Altman, D. Lee, J. Song, and M. Choi, Phys. Rev. E64, 052202
~2001!.
Downloaded 04 Aug 2003 to 128.101.142.157. Redistribution subject to
.
,
34C. G. Bohren and D. R. Huffman,Absorption and Scattering of Light bySmall Particles~Wiley, New York, 1983!.
35J. Norris, Ann. Appl. Prob.9, 78 ~1999!.36K. Liffman, J. Comput. Phys.100, 116 ~1992!.37M. Smith and T. Matsoukas, Chem. Eng. Sci.53, 1777~1998!.38M. Kostoglou and A. G. Konstandopoulos, J. Aerosol Sci.32, 1399
~2001!.39J. T. van Peborgh Gooch and M. Hounslow, AIChE J.42, 1864~1996!.40D. T. Gillespie, J. Atmos. Sci.32, 1977~1975!.41B. H. Shah, D. Ramkrishna, and J. D. Borwanker, AIChE J.23, 897
~1977!.42S. K. Friedlander and M. K. Wu, Phys. Rev. B49, 3622~1994!.43S. Vemury, K. A. Kusters, and S. E. Pratsinis, J. Colloid Interface Sci.165,
53 ~1994!.44R. M. German,Sintering Theory and Practice~Wiley, New York, 1996!.45R. C. Weast,CRC Handbook of Chemistry and Physics~CRC, Boca Ra-
ton, FL, 1989!.46M. Astier and P. Vergnon, J. Solid State Chem.19, 67 ~1976!.47D. L. Martin, L. M. Raff, and D. L. Thompson, J. Chem. Phys.92, 5311
~1990!.48R. Seigel and J. R. Howell,Thermal Radiation Heat Transfer, 3rd ed.
~Hemisphere, Washington, DC, 1992!.
AIP license or copyright, see http://ojps.aip.org/jcpo/jcpcr.jsp