kinepolis group · bond with maturity of 7 years and fixed annual gross rate of 4,75% for ... real...
TRANSCRIPT

Kinepolis Group
Results 2012
February 21, 2013
1

Business Review 2012 CEO, Mr Eddy Duquenne
2

Key Financials €m 2012 2011 Better / (Worse)
Visitors (‘000) 19.799 21.261 (6,9)%
Revenue 254,5 253,7 0,3%
EBITDA 72,3 74,6 (3,1)%
REBITDA 74,0 71,7 3,2%
REBITDA Margin 29,1% 28,3%
EBIT 51,7 53,3 (3,1)%
REBIT 54,0 51,2 5,5%
REBIT Margin 21,2% 20,2%
Net Earnings 35,7 36,5 (2,1)%
Current Net Earnings 37,4 35,2 6,3%
EPS (in €) 6,15 5,53 11,2%
Free Cash Flow 54,1 54,0* 0,1%
€m 31th Dec 2012 31st Dec 2011 Better / (Worse)
Net Financial Debt (NFD) 90,2 76,5 (13,7) €m
€ 3,74/Vis € 3,37/Vis
3
* Excluding sales Property, Plant & Equipment

Highlights Revenue up by 0,3%
Visitors –6,9%, weak summer season due to Olympic Games and Spain visitor numbers
under pressure
In-theatre Sales again to record spend per visitor
Ongoing strong growth in B2B and Events
Strong growth of Screen Advertising revenue
Increase Concessions revenue
Positive impact acquisition Brightfish
Further improved efficiency of operations
REBITDA margin increases to 29,1%
Current Net Earnings up by € 2,2 m or 6,3%
FCF strong at € 54,1 m
NFD at € 90,2 m (€ 13,7 m higher)
4

Major events 2012 results reflect Strategic Pillars set out in 2008
Best Marketeer
Best Cinema Operator
Best Property Manager
Further development and implementation of Strategy in 2012 and 2013
Refinancing
Credit facility ING Belgium, KBC Bank and BNP Paribas Fortis for € 90,0 m
Bond with maturity of 7 years and fixed annual gross rate of 4,75% for € 75,0 m
Share Buy-Back
Acquisition of 713.422 shares for € 47,9 m in 2012
Cancellation of 724.847 shares
Cumulative capital optimization 2011–2012 of € 99,5 m
5

Market Share: Belgium: to be announced**
France: 3,6%
Spain: 4,6%
297 digital screens (100% digitised***)
Of which 93 screens with 3D
Kinepolis complexes today KINEPOLIS GROUP Complexes Screens
Belgium 11 138
France 7 87
Spain 3 64
Poland * 1 20
Switzerland 1 8
Total 23 317 11
* Operated by ITIT
** New data platform expected to be available in H1 2013
*** Excluding ITIT
6

Belgium
56%France
26%
Spain
16%
Switzer-
land, Poland
2%
Belgium59%
France24%
Spain15%
Switzerland Poland
2%
Revenue by country
€ 254,5 m
2012 2011
€ 253,7 m
7

Box Office59%
In-theatre Sales21%
B2B*15%
Concessions3%
Film Distribution
1%
Brightfish1%
Box Office
55%
In-theatre
Sales21%
B2B*
15%
Concessions
4%
Brightfish
4%
Film
Distribution1%
Revenue by activity
€ 254,5 m € 253,7 m
2011 2012
* Including Cinema Screen Advertising
8
9
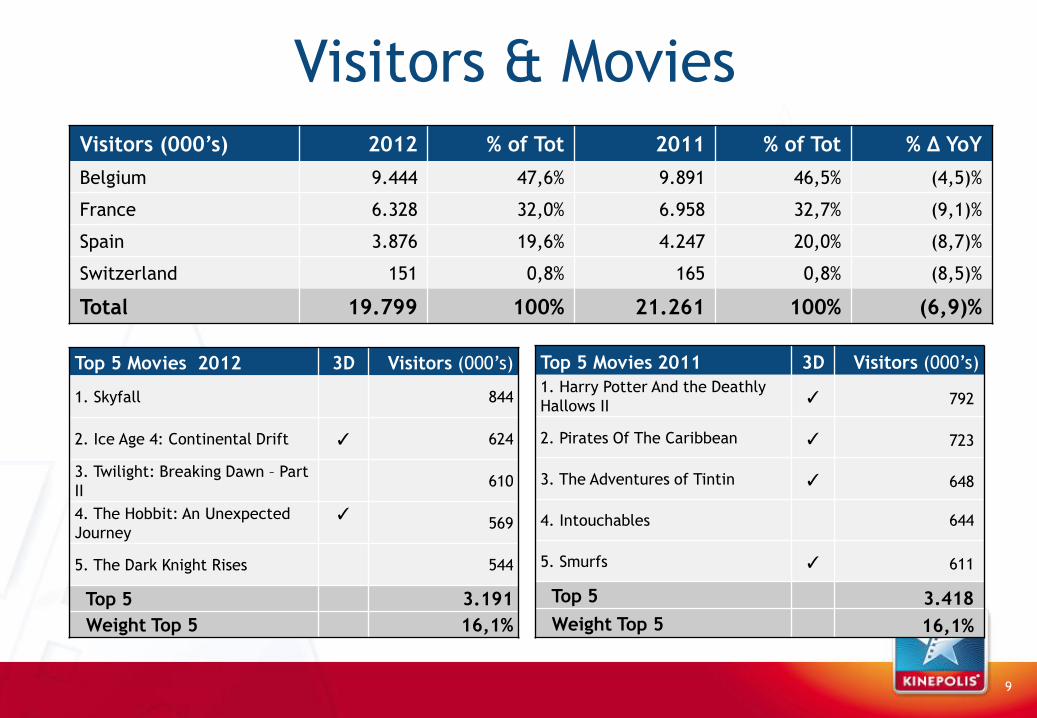
Visitors & Movies
Visitors (000’s) 2012 % of Tot 2011 % of Tot % Δ YoY
Belgium 9.444 47,6% 9.891 46,5% (4,5)%
France 6.328 32,0% 6.958 32,7% (9,1)%
Spain 3.876 19,6% 4.247 20,0% (8,7)%
Switzerland 151 0,8% 165 0,8% (8,5)%
Total 19.799 100% 21.261 100% (6,9)%
Top 5 Movies 2012 3D Visitors (000’s)
1. Skyfall 844
2. Ice Age 4: Continental Drift ✓ 624
3. Twilight: Breaking Dawn – Part
II 610
4. The Hobbit: An Unexpected
Journey
✓
569
5. The Dark Knight Rises 544
Top 5 3.191
Weight Top 5 16,1%
Top 5 Movies 2011 3D Visitors (000’s)
1. Harry Potter And the Deathly
Hallows II ✓ 792
2. Pirates Of The Caribbean ✓ 723
3. The Adventures of Tintin ✓ 648
4. Intouchables 644
5. Smurfs ✓ 611
Top 5 3.418
Weight Top 5 16,1%

10
Real estate
7.000
7.500
8.000
8.500
9.000
2009 2010 2011 2012
Concessions Revenue @ flat FX €m

Ratios
25,1%
27,8% 28,3% 29,1%
15%
20%
25%
30%
35%
2009 2010 2011 2012
REBITDA Margin
12,1%
16,0%
19,8% 21,8%
0%
5%
10%
15%
20%
25%
2009 2010 2011 2012
ROCE
0,67
0,43
0,57
0,83
0%
20%
40%
60%
80%
100%
2009 2010 2011 2012
Gearing
11

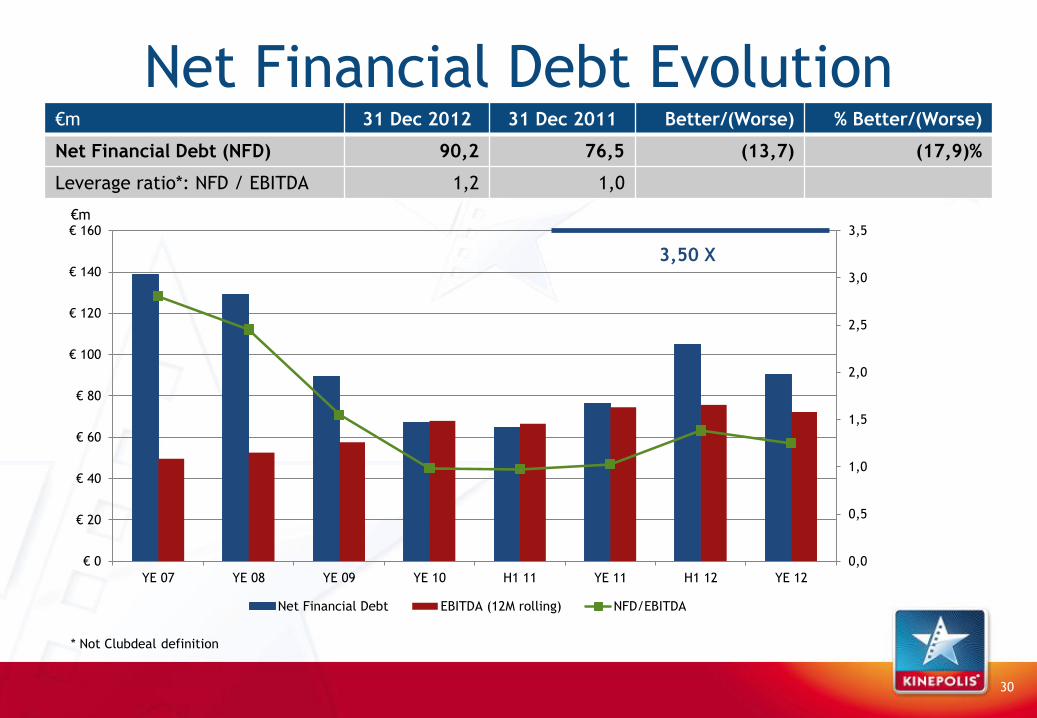
Net Financial Debt Evolution €m 31 Dec 2012 31 Dec 2011 Better/(Worse) % Better/(Worse)
Net Financial Debt (NFD) 90,2 76,5 (13,7) (17,9)%
Leverage ratio*: NFD / EBITDA 1,2 1,0
0,0
0,5
1,0
1,5
2,0
2,5
3,0
3,5
€ 0
€ 20
€ 40
€ 60
€ 80
€ 100
€ 120
€ 140
€ 160
YE 07 YE 08 YE 09 YE 10 H1 11 YE 11 H1 12 YE 12
Net Financial Debt EBITDA (12M rolling) NFD/EBITDA
3,50 X
* Not Clubdeal definition
12
€m

Dividend payment
13
Based on Net Current Income:
€ 37,4 m
Payout ratio: 35 %
# Dividend eligible shares: 5.544.623*
€ 2,36* per share
9th year consecutively increase
0,29 €
0,35 €
0,64 € 0,65 € 0,66 €
0,92 €
1,26 €
1,80 €
2,36 €
0,00 €
0,50 €
1,00 €
1,50 €
2,00 €
2,50 €
2004 2005 2006 2007 2008 2009 2010 2011 2012
Dividend/Share
+31,1%
* Calculation based on number of treasury shares as at 31/12/2012. Number of dividend eligible shares still subject to change in
case new share buyback program is launched before Annual Shareholders’ Meeting of 17/05/2013.

Line-up 2013
14
2D 3D
Major sequels • Hunger Games: Catching Fire (H2) • A Good Day to Die Hard (H1) • Fast and Furious VI (H1) • Hangover III (H1)
• The Hobbit II: The Desolation of Smaug
(H2) • The Smurfs II (H2) • Despicable Me II (H2) • Mad Max IV (H2) • Monster University (H2)
New titles • Django Unchained (H1) • After Earth (H1) • Man Of Steel (H2)
• Magic Kingdom (H2) • Epic (H1) • Frozen (H2) • The Great Gatsby (H1) • The Croods (H1)
Local • Het Vonnis (BE) (H2) • Frits en Franky (BE) (H1) • Eyjafjallajökull (FR) (H2) • Les Profs (FR) (H1) • L’extravagant voyage du jeune et
prodigieux Spivet (FR) (H2) • Los ultimos dias (ES) (H1) • Los amantes pasajeros (ES) (H1)
• Justin y la Espada del Valor (ES) (H2)
Alternative content • Opera, Ballet • Concerts (Shy’m, M Pokora, Andrea
Bocelli…) • Galaxy Park 2

Financial Review 2012 CFO, Mr Nicolas De Clercq
15

16
Revenue by country
€m 2012 % of Tot 2011 % of Tot % Δ YoY
Belgium 149,8 58,9% 142,7 56,2% 5,0%
France 62,3 24,5% 65,7 25,9% (5,1)%
Spain 37,6 14,8% 40,6 16,0% (7,4)%
Switzerland & Poland 4,7 1,9% 4,7 1,9% (0,3)%
Total 254,5 100% 253,7 100% 0,3%

10
15
20
25
30
35
40
2009 2010 2011 2012
Sales & Events €m
Revenue by Business (1)
100
120
140
160
180
200
220
240
2009 2010 2011 2012
Cinema Revenue €m
3,0
3,5
4,0
4,5
5,0
5,5
6,0
6,5
7,0
2009 2010 2011 2012
Screen Advertising €m
+28,1%
+11,3%
17
Visitors 19,8 22,0 21,3 21,3 * Excluding Brightfish
** Minimum guarantee Screenvision * Excluding Brightfish
* * * *
+2,3%
**

Revenue by Business (2)
4
5
6
7
8
9
10
2009 2010 2011 2012
Concessions @ Flat FX €m
0,0
0,8
1,6
2,4
3,2
4,0
2009 2010 2011 2012
Film Distribution €m
+7,1% -11,8%
18
#
releases 34 43 46 31

Revenue by activity waterfall
253,7 (9,2)
(0,1) +1,4 +0,7+0,5
0,2 (0,3) 254,57,6
200
210
220
230
240
250
260
270
280
2011 BoxOffice
In-theatreSales
B2B ScreenAdvertising
FilmDistribution
Brightfish* Real Estate Other & FX 2012
€ m
19
Business line Cinema
-6,2% +4,5% +8,8% -0,2% +32,6%
-0,2% -0,3%
* Consolidated as from Q4 2011
+1,8% +0,3%
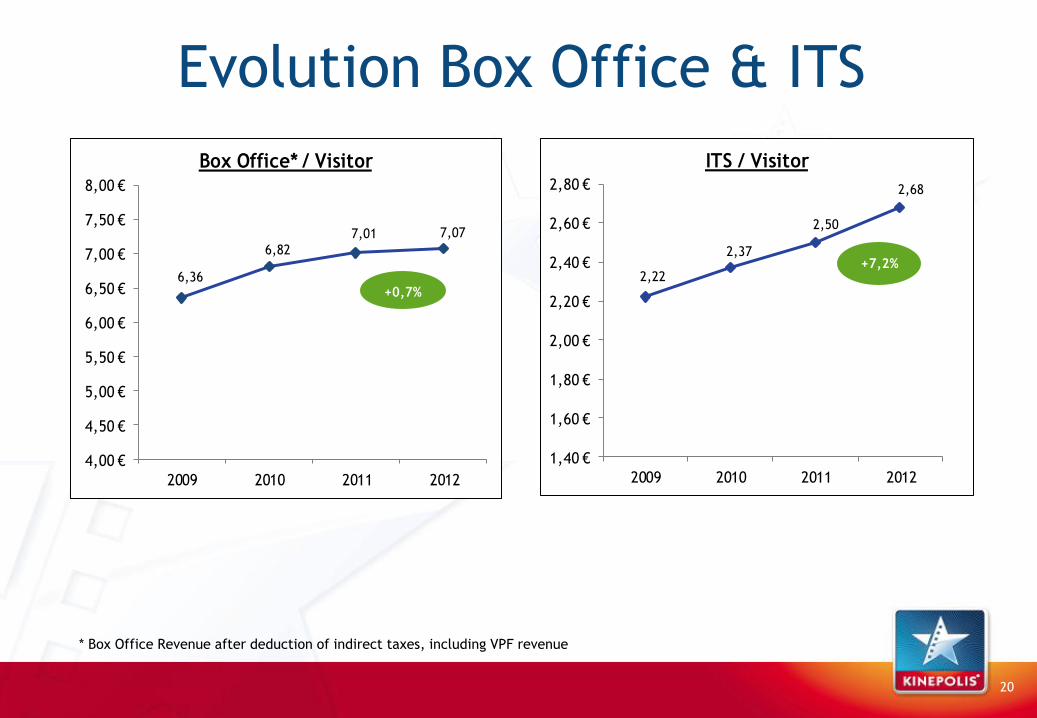
Evolution Box Office & ITS
20
* Box Office Revenue after deduction of direct taxes
6,36
6,82
7,01 7,07
4,00 €
4,50 €
5,00 €
5,50 €
6,00 €
6,50 €
7,00 €
7,50 €
8,00 €
2009 2010 2011 2012
Box Office* / Visitor
+0,7%2,22
2,37
2,50
2,68
1,40 €
1,60 €
1,80 €
2,00 €
2,20 €
2,40 €
2,60 €
2,80 €
2009 2010 2011 2012
ITS / Visitor
+7,2%
* Box Office Revenue after deduction of indirect taxes, including VPF revenue

Operating Costs €m 2012 2011 % Better / (Worse)
Marketing & Selling Expenses (16,2) (14,9) (8,4)%
Administrative Expenses (15,1) (14,9) (1,7)%
Other Operating Income/(Costs) 0,7 3,5 (79,1)%
Total Operating Costs (30,5) (26,3) (16,2)%
Non-Current
(0,9) 2,4
Current Operating Costs (29,6) (28,7) (3,2)%
21
Gain on sale PPE Gent, Badwill Brightfish,
Transformation, Loss on sale Opéra (Liège)
Transformation, Provision
termination leases

Non-Current items €m 2012 2011 Impacts
Sale real estate (Gent) 2,9
EBITDA
Badwill Brightfish 0,3
Sale Opéra (Liège) (0,1)
Dismissal fees (0,5)
Transformation expenses (1,2) (0,2)
EBITDA (1,7) 2,9
Write-down old generation projectors (0,2)
Amortization Write-down inventory 35 mm parts (0,2)
Amortization (0,2) (0,2)
Transformation provisions 0,1 (0,5)
Provisions Provision settlement leases (0,5)
Provisions (0,4) (0,5)
Tax on above items 0,6 (0,9) Taxes
Taxes 0,6 (0,9)
Net impact of non-current items (1,7) 1,3 Net Earnings
22

REBITDA by Country REBITDA €m 2012 % of Total 2011 % of Total % Better/(Worse)
Belgium (incl. HQ) 39,4 53,2% 36,0 50,2% 9,4%
France 22,3 30,1% 23,5 32,8% (5,1)%
Spain 10,6 14,3% 10,6 14,8% 0,0%
Switzerland & Poland 1,7 2,3% 1,6 2,2% 6,2%
TOTAL 74,0 100% 71,7 100% 3,2%
* REBITDAR (i.e. REBITDA excluding rent for Valencia complex) ** Excluding corporate entities
23
28,3%
34,5%
35,4%
34,5%
29,1%
35,3%
35,9%
42,2%
Total
Switz. &Poland
* Spain
France
** Belgium
REBITDA Margin % (on a comparable basis)2012 2011
31,0%
33,7%

REBITDA Margin Trend
24
REBITDA
/Visitor € 3,12
25,1%
27,8%
28,3%
29,1%
22,0%
23,0%
24,0%
25,0%
26,0%
27,0%
28,0%
29,0%
30,0%
0
10.000
20.000
30.000
40.000
50.000
60.000
70.000
80.000
2009 2010 2011 2012
Visitors Rebitda Rebitda Margin
Visitors (‘000) 21.980 21.320 21.261 19,799
REBITDA (€m) 58,1 66,5 71,7 74,0
€ 3,37 € 2,64 € 3,74
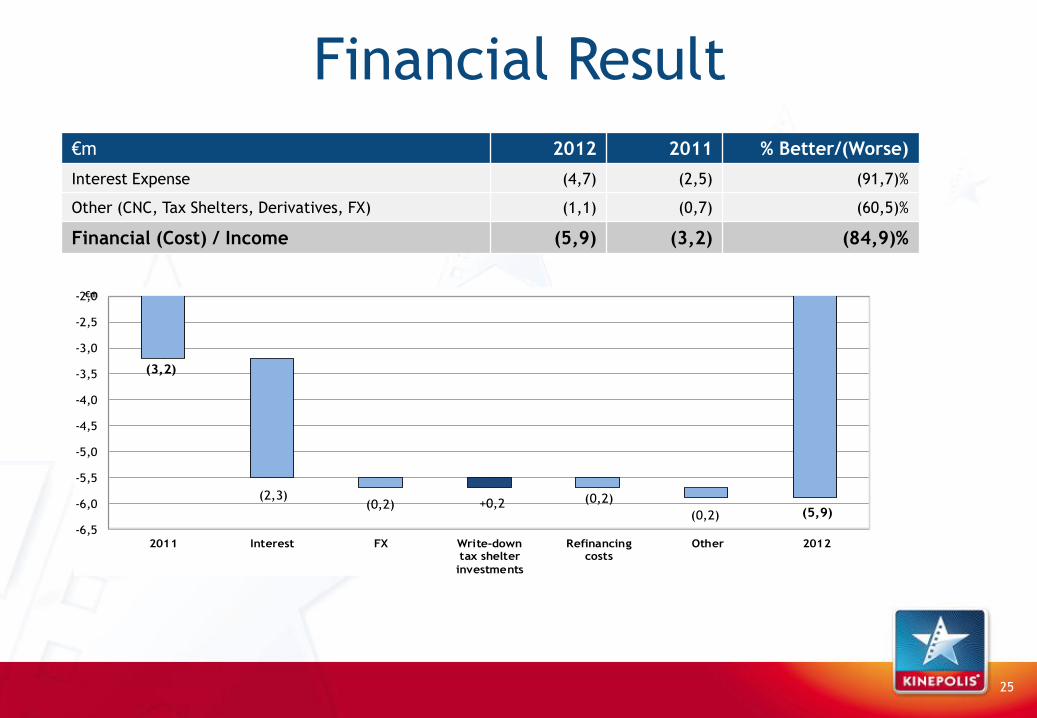
Financial Result
€m 2012 2011 % Better/(Worse)
Interest Expense (4,7) (2,5) (91,7)%
Other (CNC, Tax Shelters, Derivatives, FX) (1,1) (0,7) (60,5)%
Financial (Cost) / Income (5,9) (3,2) (84,9)%
25
(3,2)
(2,3)(0,2) +0,2 (0,2)
(5,9)(0,2)-6,5
-6,0
-5,5
-5,0
-4,5
-4,0
-3,5
-3,0
-2,5
-2,0
2011 Interest FX Write-downtax shelter
investments
Refinancingcosts
Other 2012
€m

(13,7)
(10,1)
+0,9(12,8)
+0,1
+1,2
+0,8
(10,7) +0,6
-15
-13
-11
-9
-7
-5
-3
2011 Non-Current2011
Current2011
Use tax lossescarried forward
& taxes on(future)
dividends
More NID &tax shelter in
2012
Lower pre-taxresult 2012
Current2012
Non-Current2012
2012
€m€m€m€m
Taxes €m 2012 2011 % Better /(Worse)
Profit before Taxes 45,8 50,2 (8,7)%
Taxes (10,1) (13,7) 26,2%
Net Profit 35,7 36,5 (2,1)%
Effective Tax Rate (‘ETR’) 22,1% 27,3%
Recurring ETR 26% to 27%
ETR
27,3%
ETR
26,7%
ETR
22,1%
26
ETR
22,3%
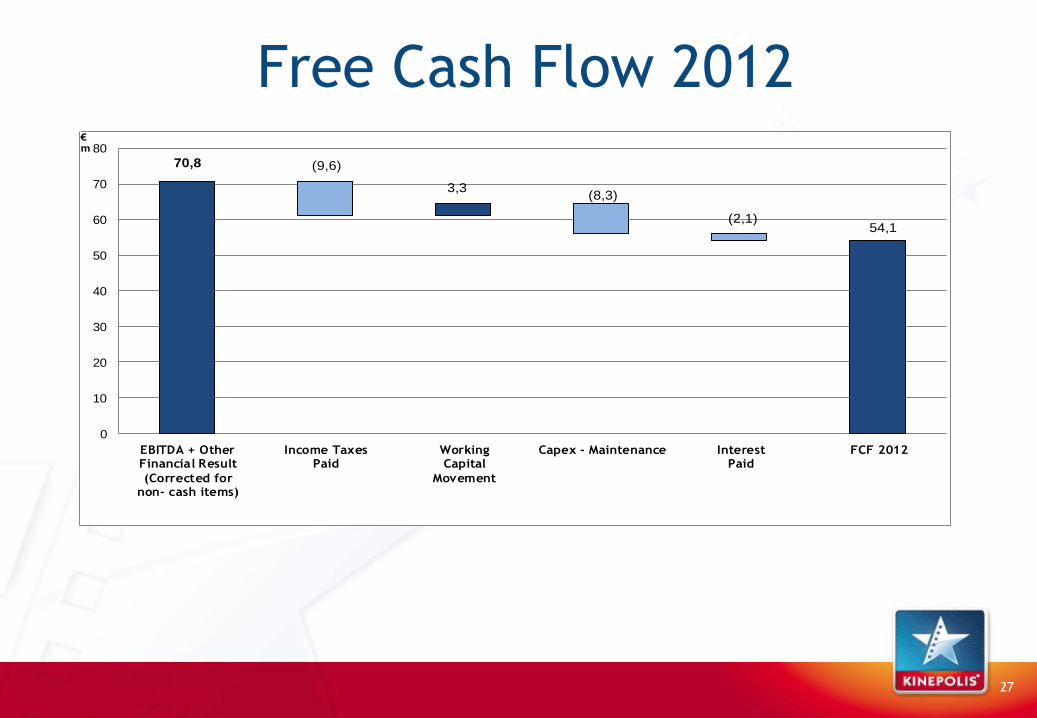
Free Cash Flow 2012
70,8 (9,6)
3,3(8,3)
(2,1)54,1
0
10
20
30
40
50
60
70
80
EBITDA + OtherFinancial Result
(Corrected fornon- cash items)
Income TaxesPaid
WorkingCapital
Movement
Capex - Maintenance InterestPaid
FCF 2012
€m
27

Free Cash Flow 2012 vs 2011
54,0 +0,5+2,8 (0,3)
(3,4)+0,5
54,1
0
10
20
30
40
50
60
70
FCF 2011 Cash EBITDA & OtherFinancial Result
Income TaxPaid
WorkingCapital
Capex - Maintenance InterestPaid
FCF 2012
€m
28

2011: € 13,0 m
Remodeling38%
5,0 €m
Digitization24%
3,1 €m
Maintenance38%
4,9 €m2012:
€ 12,8 mRemodeling
29%3,7 €m
Maintenance65%
8,3 €m
Digitization6%
0,8 €m
(21,2) +0,7 (20,5) +0,5 (20,0) (0,6) (20,6)
-30
-27
-24
-21
-18
-15
-12
-9
-6
-3
0
2011 Non-Current
2011
Current 2011 Normal
Diff's
Current 2012 Non-Current
2012
2012
Depreciation, Amortization & Provisions€m
Capex – Depreciation Capex €m 2012 2011
Belgium 7,8 7,9
France 2,3 2,0
Spain 2,5 3,0
Other 0,2 0,1
TOTAL 12,8 13,0
29
Net Financial Debt Evolution €m 31 Dec 2012 31 Dec 2011 Better/(Worse) % Better/(Worse)
Net Financial Debt (NFD) 90,2 76,5 (13,7) (17,9)%
Leverage ratio*: NFD / EBITDA 1,2 1,0
0,0
0,5
1,0
1,5
2,0
2,5
3,0
3,5
€ 0
€ 20
€ 40
€ 60
€ 80
€ 100
€ 120
€ 140
€ 160
YE 07 YE 08 YE 09 YE 10 H1 11 YE 11 H1 12 YE 12
Net Financial Debt EBITDA (12M rolling) NFD/EBITDA
3,50 X
* Not Clubdeal definition
30
€m

Balance sheet €m 31 Dec
2012
% of
Total
31 Dec
2011
% of
Total
€m 31 Dec
2012
% of
Total
31 Dec
2011
% of
Total
Intangible assets 3,3 1% 3,4 1% Equity 108,7 33% 133,9 41%
Goodwill 18,8 6% 18,8 6% LT financial debt 81,7 25% 38,5 12%
Land & buildings 184,6 56% 192,1 59% Provisions 3,8 1% 3,5 1%
Other fixed assets 41,3 13% 41,9 13% Deferred taxes 17,4 5% 14,3 4%
Deferred taxes 0,7 0% 1,5 1% Other payables 8,6 3% 9,3 3%
Other receivables 13,2 4% 14,4 4% Derivatives 0,1 0% 0,9 0%
Non-current assets 261,9 80% 272,1 83% Non-current liabilities 111,7 34% 66,5 20%
Assets held for sale 8,7 3% 6,7 2% ST financial debt 37,7 12% 56,0 17%
Working capital 26,1 8% 30,0 9% Provisions(1) 0,3 0% 0,3 0%
Current taxes 1,7 1% 0,0 0% Working capital 64,3 20% 63,3 19%
Financial assets 0,4 0% 0,4 0% Current taxes 4,4 1% 6,4 2%
Cash & cash equivalents 28,8 9% 17,7 5% Derivatives 0,5 0% 0,5 1%
Current assets 65,7 20% 54,8 17% Current liabilities 107,2 33% 126,5 39%
Assets 327,6 100% 326,9 100% Equity & Liabilities 327,6 100% 326,9 100%
31
(1): Including employee benefits liabilities
*: Gearing ratio: Net Financial Debt / Equity
**: Current ratio: Current Assets / Current Liabilities
***: Solvency ratio: Total Equity / Total Equity & Liabilities
****: ROCE: Current operating profit / Capital employed
31 Dec
2012
31 Dec
2011
Gearing ratio* 0,83 0,57
Current ratio** 0,61 0,43
Solvency ratio*** 33,2% 41,0%
ROCE***** 21,8% 19,8%

Tax Shelters
Tax Shelters 2012: € 1,1 m Tax Shelters 2011: € 1,4 m
Bingo Hasta La Vista
82 days in April The Loft
Flying Home Broken Circle Breakdown
Het vonnis Allez Eddy
De behandeling K3 en de (B)Engeltjes
Kamer 13
Galaxy Park II
Brasserie Romantiek
32

Shareholders 20/2/2013 21/08/2012
# Shares % # Shares %
Total Shares outstanding 5.856.508 100 % 6.581.355 100 %
* Resulting from transparency notices received
Other* # Shares % # Shares %
Axa SA 278.885 4,76% 505.416 7,68 %
Ameriprise Financial Inc – Threadneedle AMH Ltd 266.256 4,55% 266.256 4,04 %
BNP Paribas Investment Partners SA 194.659 3,32% 203.853 3,10 %
Axa Investment Managers SA < 3,00 % < 3,00 %
Petercam + Petercam Mgt. Services SA < 3,00 % < 3,00 %
Quaeroq CVBA 0,00 % < 3,00 %
Bestinver Gestion 0,00 % < 3,00 %
Refence Shareholders & Free Float # Shares % # Shares %
Kinohold Bis and Mr. Joost Bert 2.581.610 44,08% 2.581.610 39,23 %
Treasury shares (Own Shares) 311.885 5,33% 1.036.732 15,75 %
Free Float 2.963.013 50,59% 2.963.013 45,02 %
33

Share Buyback Program # shares €m
Total shares outstanding as at 31/12/2011 6.581.355
Treasury shares (own shares) as at 31/12/2011 323.310 9,5
Share buyback during 2012 713.422 47,9
Cancellation during 2012 (724.847) (48,5)
Total shares outstanding as at 31/12/2012 5.856.508
Treasury shares (own shares) as at 31/12/2012 311.885 8,9
Dividend eligible shares as at 31/12/2012* 5.544.623
SBB mandate granted by Extraordinary Shareholders’ Meeting of
19/10/2012
1.171.301
34
*: Excluding all treasury shares

Financial Calendar 2013
Thursday 16/05/2013 Business update Q1 2013
Friday 17/05/2013 Annual Shareholders’ Meeting
Monday 27/05/2013 Dividend Payment
Thursday 29/08/2013 Analyst and Press Meeting HY 2013
Thursday 14/11/2013 Business update Q3 2013
35

Q & A
Thank You.
36
Annexes
Financial Statements Results 2012
37

Consolidated Income Statement €m 2012 2011 % Better /
(Worse)
Revenue 254,5 253,7 0,3%
Cost of sales (172,3) (174,1) 1,0%
Gross profit 82,2 79,6 3,2%
Gross profit % 32,3% 31,4%
Marketing & selling expenses (16,2) (14,9) (8,4)%
Administrative expenses (15,1) (14,9) (1,7)%
Other operating income and expenses 0,7 3,5 (79,1)%
EBIT 51,7 53,3 (3,1)%
EBIT % 20,3% 21,0%
Financial result (5,9) (3,1) (84,9)%
Profit before tax 45,8 50,2 (8,7)%
Income tax expense (10,1) (13,7) 26,2%
Profit 35,7 36,5 (2,1)%
Profit % 14,0% 14,4%
EBITDA 72,3 74,6 (3,1)%
EBITDA % 28,4% 29,4%
38

Current Income Statement €m 2012 2011 % Better /
(Worse)
Revenue 254,5 253,7 0,3%
Cost of sales (170,9) (173,8) 1,7%
Gross profit 83,6 79,9 4,7%
Gross profit % 32,8% 31,5%
Marketing & selling expenses (16,0) (14,9) (7,4)%
Administrative expenses (14,3) (14,6) 2,2%
Other operating income & expenses 0,7 0,8 (15,4)%
REBIT 54,0 51,2 5,5%
REBIT % 21,2% 20,2%
Financial result (5,9) (3,2) (84,9)%
Profit before tax 48,1 48,0 0,2%
Income tax expense (10,7) (12,8) 16,3%
Current profit 37,4 35,2 6,3%
Current profit % 14,7% 13,9%
REBITDA 74,0 71,7 3,2%
REBITDA % 29,1% 28,3%
39

Consolidated Balance Sheet (1) €m 31/12/2012 31/12/2011 % Better /
(Worse)
Intangible assets 3,3 3,4 (1,5)%
Goodwill 18,8 18,8 0,0%
Property, plant & equipment 214,4 221,2 (3,1)%
Investment property 11,5 12,8 (10,8)%
Deferred tax assets 0,7 1,5 (51,9)%
Other receivables 13,2 14,4 (8,5)%
Other financial assets 0,0 0,0 0,0%
Total non-current assets 261,9 272,1 (3,8)%
Assets held for sale 8,7 6,7 29,0%
Inventories 3,2 3,0 7,4%
Trade & other receivables 23,3 27,4 (14,9)%
Current income taxes 1,7 0,0 6.800,0%
Cash & cash equivalents 28,8 17,7 63,1%
Total current assets 65,7 54,8 19,9%
TOTAL ASSETS 327,6 326,9 0,2%
40

Consolidated Balance Sheet (2) €m 31/12/2012 31/12/2011 % Better /
(Worse)
Capital & Share premium 20,1 20,1 0,0%
Consolidated reserves 89,8 114,0 (21,3)%
Translation differences (1,2) (2,0) 41,2%
Equity attributable to equity holders of the parents 108,7 132,1 (17,8)%
Non-controlling interests 0,0 1,8 (100,0)%
Total equity 108,7 133,9 (18,9)%
Interest bearing loans & borrowings 81,7 38,5 112,2%
Provisions 3,8 3,5 6,0%
Deferred tax liabilities 17,4 14,3 21,6%
Derivatives 0,1 0,9 (83,2)%
Other payables 8,6 9,3 (7,4)%
Total non-current liabilities 111,7 66,5 67,9%
Interest bearing loans & borrowings & Bank overdrafts 37,7 56,0 (32,6)%
Trade & other payables 64,4 63,3 1,6%
Provisions 0,3 0,3 (1,1)%
Derivatives 0,5 0,5 (4,1)%
Current income tax liabilities 4,4 6,4 (30,6)%
Total current liabilities 107,2 126,5 (15,2)%
TOTAL EQUITY & LIABILITIES 327,6 326,9 0,2%
41
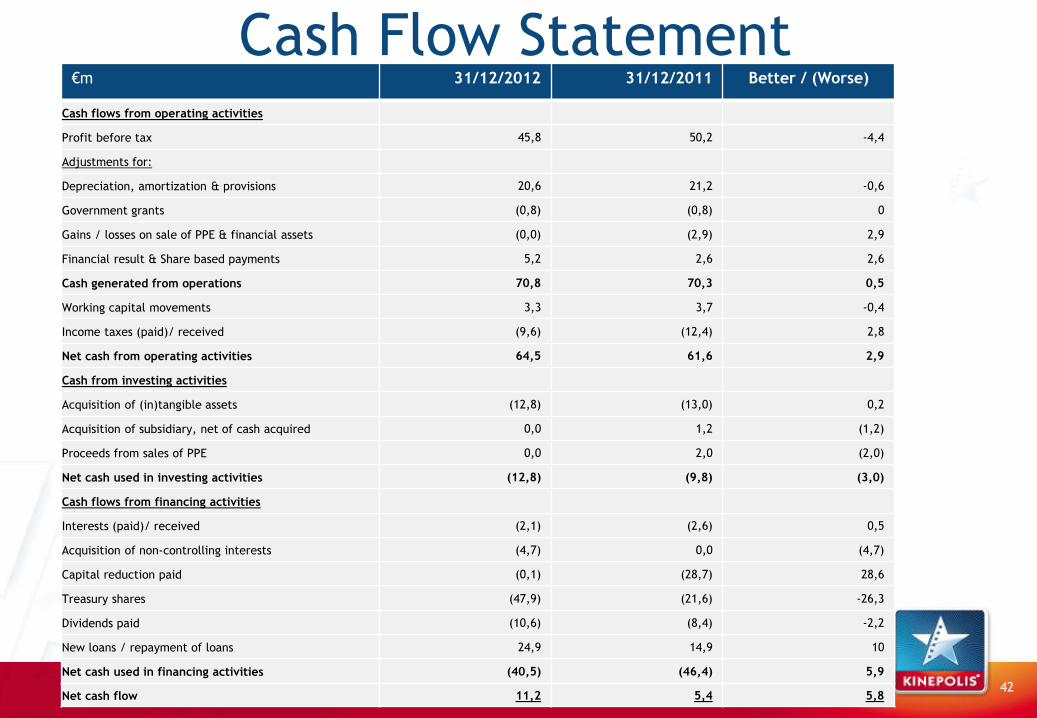
Cash Flow Statement €m 31/12/2012 31/12/2011 Better / (Worse)
Cash flows from operating activities
Profit before tax 45,8 50,2 -4,4
Adjustments for:
Depreciation, amortization & provisions 20,6 21,2 -0,6
Government grants (0,8) (0,8) 0
Gains / losses on sale of PPE & financial assets (0,0) (2,9) 2,9
Financial result & Share based payments 5,2 2,6 2,6
Cash generated from operations 70,8 70,3 0,5
Working capital movements 3,3 3,7 -0,4
Income taxes (paid)/ received (9,6) (12,4) 2,8
Net cash from operating activities 64,5 61,6 2,9
Cash from investing activities
Acquisition of (in)tangible assets (12,8) (13,0) 0,2
Acquisition of subsidiary, net of cash acquired 0,0 1,2 (1,2)
Proceeds from sales of PPE 0,0 2,0 (2,0)
Net cash used in investing activities (12,8) (9,8) (3,0)
Cash flows from financing activities
Interests (paid)/ received (2,1) (2,6) 0,5
Acquisition of non-controlling interests (4,7) 0,0 (4,7)
Capital reduction paid (0,1) (28,7) 28,6
Treasury shares (47,9) (21,6) -26,3
Dividends paid (10,6) (8,4) -2,2
New loans / repayment of loans 24,9 14,9 10
Net cash used in financing activities (40,5) (46,4) 5,9
Net cash flow 11,2 5,4 5,8 42

Free Cash Flow €m 31/12/2012 31/12/2011 Better /
(Worse)
Cash Flow before WC movements & tax paid 70,8 70,3 0,5
Income taxes paid (9,6) (12,4) 2,8
Working capital 3,3 3,6 (0,3)
Capital exp – maintenance (8,3) (4,9) (3,4)
Interest paid (2,1) (2,6) 0,5
Free cash flow 54,1 54,0 0,1
Capital exp - digitalization, expansion, remodeling (4,5) (8,1) 3,6
Sale financial assets & PPE 0,0 2,0 (2,0)
Acquisition of subsidiary, net of cash acquired 0,0 1,2 (1,2)
Acquisition of non-controlling interests (4,7) 0,0 (4,7)
Capital reduction paid (0,1) (28,7) 28,6
Treasury shares (47,9) (21,6) (26,3)
Dividend payments (10,6) (8,4) (2,2)
CF after expansion exp, dividends & treasury shares (13,6) (9,6) (4,1)
43