kinematic analysis of the trot in cci*** 3-day-event horses · 2016-12-20 · kinematic analysis of...
TRANSCRIPT

Copyright is owned by the Author of the thesis. Permission is given for a copy to be downloaded by an individual for the purpose of research and private study only. The thesis may not be reproduced elsewhere without the permission of the Author.
Kinematic analysis of the trot in CCI*** '3-day-event horses.
A thesis presented in partial fulfilment of the requirements for
the Degree of Doctor of Philosophy at Massey University
Christopher William Warnock Rogers
1999
Acknowledgements My sincere thanks go to my supervisors Associate Professor A.S. Davies and
Associate Professor P. S.Davie for their constant support and guidance throughout
this study and for their careful scrutiny during the preparation of this thesis
A special thank you must be extended to Professor Dirk Pfeiffer who has been a
friend, mentor and unofficial supervisor throughout this project
Sincere thanks must also go to Professor Elwyn Firth for his support and
encouragement during the final stages of this project.
A very special thank you must be extended to my wife for her unselfish support and
encouragement.
For funding I would like to thank The New Zealand Equine Research Foundation,
and particularly Professor Des Fielden and Dr Brain Gouldan for there support of
this project. Funding was also provided from the Graham Chalmers Alien Memorial
Scholarship for which I am very grateful .
I would also like to thank The New Zealand Equestrian Federation and the Officials
at the 1 995 Taupo three-day event for providing me with the permission to film the
horse inspections.
And last but not least I would like to extend a very special thanks to my family for
their untiring support and encouragement.
Abstract Three day eventing is an equestrian sport originally designed to test the
capabilities of cavalry horses and riders. An integral component of the sport are
the horse inspections to ensure the horse is fit and sound to continue from one
phase to the next. This study examined the "in-hand" trot of horses presented at
the first and third horses inspections during the eCI·" class at the 1 995 New
Zealand Horse Trials Championships, Taupo, New Zealand. This study involved
five stages.
1 . Quantification of the three day event inspection process by use of time motion
analysis.
2 . Examination of the linear and temporal characteristics of the trot event horses
during the first inspection process.
3. Comparison of the temporal gait characteristics between the first and third
inspections.
4. Examination of the kinematics of a subset of horses during the first horse
inspection and,
5. Comparison of the kinematics of this subset of horses between the first and
third horse inspections.
The optimal strategy for both the inspection panel and competitors is to present a
horse in a relaxed manner. The time motion analysis revealed that two different
approaches to the inspection were used. One third of the class opted to walk
their horses rather than trot their horses past the judge's panel on the final section
of the return run. Two thirds spent a significantly longer time at the initial walk
(4.36±O.94s vs 3.53±O.9 1 s, P<O. OI), but spent less time during the stationary
inspection (S.77±2.2.1 6s vs 1O.43±2.90s, P<O.05) and for the total time
(42.04±2.50s vs 45.34±3.38, P<O.OI). A correlation was found between initial
walk and the time spent at the stationary inspection (r'=O.249, P<O.OI). It is
concluded that the initial impression gained as the horse is walked toward the
inspection panel significantly influences the subsequent inspection.
The trot of 3-day event horses during the preliminary horse inspection of a
CCI··· 3-day event was quantified and temporal characteristics defined. A
cross sectional study was made of the kinematics of 24 three day event horses
during the first horse inspection. The horses were filmed using a panning lateral
S-VHS video camera (50Hz). Video footage was digitised and linear and
temporal measurements were made. The horses trotted for an average of
1 0.44±1 .55 strides. Spatial measurements were made on an average of
5.66±O.92 consecutive strides when the horses were within the calibration zone.
The horses increased and then maintained a constant velocity within the
calibration zone. The relationships between stride length, stride duration and
velocity when compared with previously published values. Horse specific
differences in stance and retraction time as a percentage of stride were identified
that may contribute to each horses unique gait or "kinematic fingerprint". It is
proposed that the initiation of, and completion of, stance by the hind limb first
may represent "engagement of the hind quarters" and be a response to dressage
training.
Temporal stride parameters between of the trot at the first and third horse
inspections were quantified. This provided a repeat sample on 1 6 horses. Spatial
measurements were taken for an average of 5.66±O.92 strides for the first
inspection and 5.05± 1 .27 for the third inspection
The horses trotted with a significantly higher mean velocity during the third
inspection (0.26±O.05ms·1 p<O. OOl). During the third inspection the horses
trotted with a shorter stride length (0.1 93±O.03m p<0.00 1 ) and stride duration
(31 ±42ms p<O.OO 1 ). The third inspection was characterised by a significant
decrease in retraction percentage for both the forelimbs (3.69±2. 39% p<O.OOl)
and the hindlimbs (2.48±2. 16% p<O.OOI). However, no significant difference
was found between the 2 inspections for other temporal parameters when
measured as a percentage of stride. It is proposed that the event horses trot with
a decreased stride length and duration during the third horse inspection but
maintain a consistent temporal relationship.
The kinematics six 3 day event horses presented during the preliminary horse
inspection at a CCI··· 3 day event were examined. The six horses trotted with a
mean velocity of 3.94±O.22ms·1. Displacement, velocity and acceleration data
are presented for X, Y and Z axis. Larger than expected vertical displacement
values for the central body marker and fore and hind limbs are presented as
evidence that during the preliminary horse inspection three day event horses trot
with a more animated action. This more animated gait is believed to be due to a
combination of the atmosphere of the competition environment and the high
level of horse fitness. The significantly greater horizontal ( 1 . 1 29±O.1 03m vs
1 . 108±O.05m) and vertical displacement of the forelimbs (O.22I±O.027m vs
O.lS9±O.OSm) to the hind limbs are interpreted as evidence of dressage training.
Comparison of the kinematics of the trot a group of six horses ( 1 2.3±2.4 years)
during the first and third horse inspections at a CCI"· 3 day event competition
was undertaken. The horses trotted with a mean velocity of 3.94±O.22ms·1
during the first inspection and 4. 14±O.lSms·1 for the third inspection. During the
third inspection a greater range of motion was observed in the hoof trajectories.
The horses carried there heads higher during the third inspection ( 1 . 752±O.090m
vs 1 .796±O.091 m, P<O.OS) in an attempt to reduce the minimum vertical
acceleration on the forelimbs (-9.83±S.28ms·2 vs -9.09±3. 1 7ms·2, P<O.OS).
Significant differences were found between inspections for most variables.
However, the differences were not large, indicating that effect of the exertion of
speed and endurance day on the kinematics of this group of event horses was
subtle.
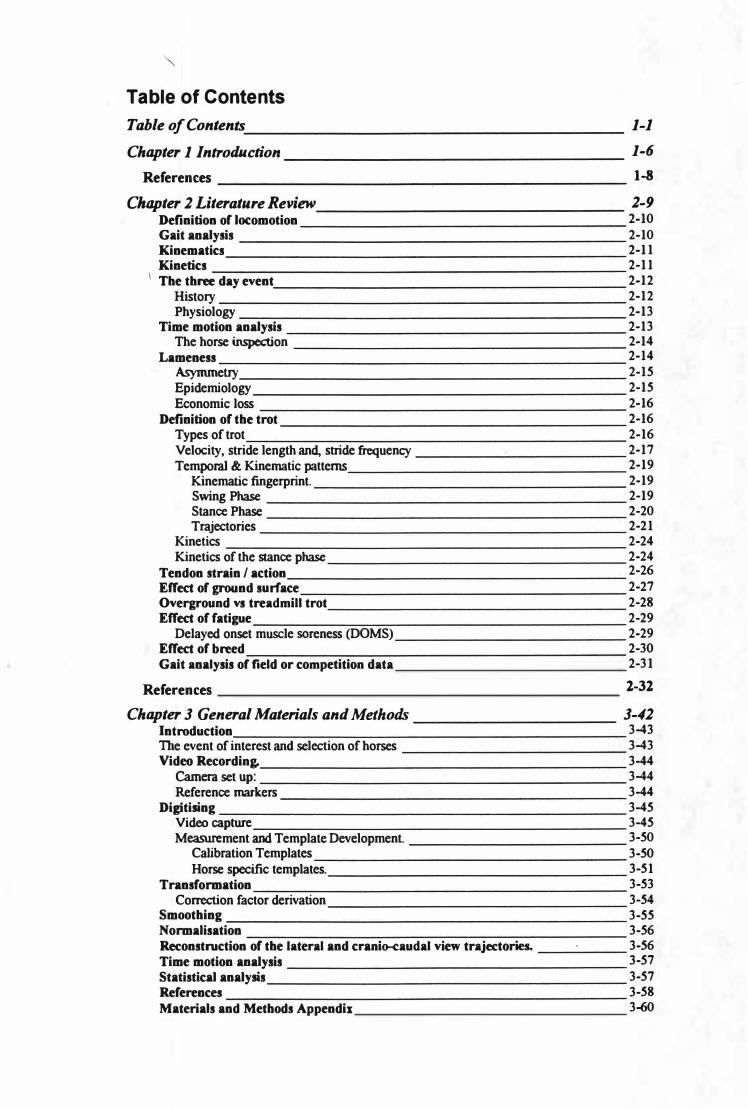
Table of Contents
Table ofContents. ____________________ 1-1 Chapter 1 Introduction 1-6
References 1-8 Chapter 2 Literature Review 2-9
Definition of locomotion 2-10
Gait analysis 2-10 Kinematics 2-11 Kinetics 2-11
\ The three day event 2-12 History 2-12 Physiology 2-13
Time motion analysis 2-13 The horse inspection 2-14
Lameness 2-14
�etry 2-15 Epidemiology 2-15
Economic loss 2-16 Definition of the trot 2-16
Types of trot 2-16 Velocity, stride length and, stride frequency 2-17 Temporal & Kinematic patterns 2-19
Kinematic fingerprint. 2-19 Swing Phase 2-19 Stance Phase 2-20 Trajectories 2-21
Kinetics 2-24 Kinetics of the stance phase 2-24
Tendon strain I action 2-26
Effect of ground surface 2-27
Overground vs treadmill trot 2-28 Effect of fatigue 2-29
Delayed onset muscle soreness (DOMS) 2-29 Effect of breed 2-30 Gait analysis of field or competition data 2-31
References 2-32 Chapter 3 General Materials and Methods __________ 3-42
Introduction 3-43 The event of interest and selection of horses 3-43 Video Recording. 3-44
Camera set up: 3-44 Reference markers 3-44
Digitising 3-45 Video capture 3-45 Measurement and Template Development. 3-50
Calibration Templates 3-50 Horse specific templates. 3-51
Transformation 3-53 Correction factor derivation 3-54
Smoothing 3-55 Normalisation 3-56 Reconstruction of the lateral and cranio-caudal view trajectories. 3-56 Time motion analysis 3-57
Statistical analysis 3-57 References 3-58
Materials and Methods Appendix 3-60

1 -2
Chapter 4 Time Motion Analysis of the preliminary horse inspection at a CCI··· three day horse trials event 4-64
Abstract 4-6S Introduction 4�5
Materials and Methods 4�7 Results 4�8
Discussion 4-71
References 4-73
Chapter 5 Linear and temporal stride characteristics of three day event horses at a CCI··· three day event preliminary horse inspection. 5-74
Abstract 5-75 Introduction 5-75 Materials and Methods 5-76
Results 5-78
Discussion 5-81 Conclusion 5-85
References 5-86
Chapter 6 Temporal changes in the trot between the first and third horse inspections at a CCI··· three day event 6-89
Abstract 6-90
Introduction 6-90 Materials & Methods 6-91
Data Acquisition: 6-92 Statistical Analysis: 6-93
Results 6-93 Forelimbs 6-97 Hindlimbs 6-97
Significance 6-97 Right diagonal 6-97 Left diagonal 6-97
Discussion 6-98 References: 6-102
Chapter 7 Kinematic examination of the trot in three day event horses during the preliminary horse inspection at a CCI··· three day event 7-105
Abstract 7-106
Introduction. 7-106 Materials and Methods 7-107
Results. 7 -111 Hind limbs 7-111
Discussion 7-119
References 7-122
Chapter 8 Comparison of the Kinematics of the trot in three day event horses between the first and third horse inspections at a CCI·" three day event 8-124
Abstract 8-125 Introduction. 8-125 Materials and Methods 8-126
Results. 8-127
Discussion 8-134
References 8-138
Chapter 9 Conclusion _________________ 9-139 Introduction. _....,...-____________________
9-139
ne horse inspection process. 9-139 Temporal characteristics. 9-140 Comparison of temporal stride characteristics between the first and tbird horse inspection. 9-140
1-3
Kinematic examination of tbe trot during tbe preliminary bone inspection. __ 9-140 Comparison o(tbe kinematics between tbe first and tbird bone inspection. __ 9-141 General conclusion. 9-142 References . 9-143
1-4
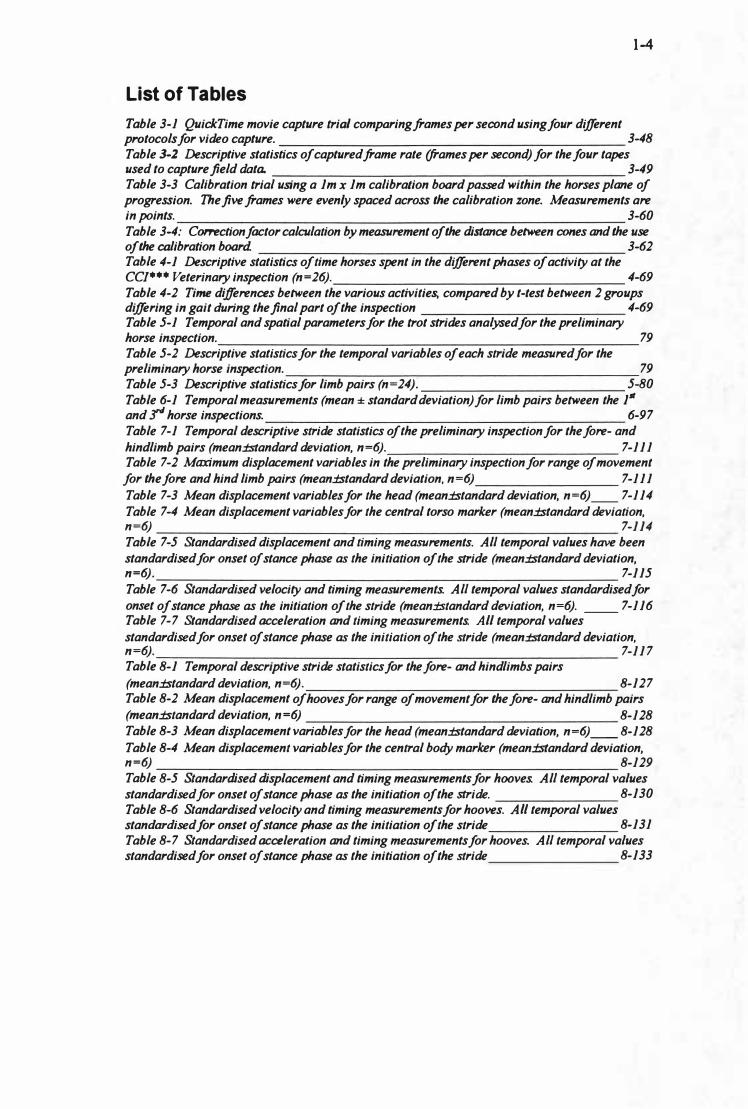
List of Tables
Table 3-1 QuickTime movie capture trial comparingframes per second using four different protocols for video capture. 3-48 Table 3-2 Descriptive statistics of captured frame rate (frames per second) for the four tapes used to capture field data. 3-49 Table 3-3 Calibration trial using a 1m x 1m calibration board passed within the horses plane of progression. The five frames were evenly spaced across the calibration zone. Measurements are in points . 3-60 Table 3-4: Correction factor calculation by measurement of the distance between cones and the use of the calibration board. 3-62 Table 4-1 Descriptive statistics of time horses spent in the different phases of activity at the CCl··· Veterinary inspection (n=26). 4-69 Table 4-2 Time differences between the various activities, compared by t-test between 2 groups differing in gait during the final part of the inspection 4-69 Table 5-1 Temporal and spatial parameters for the trot strides analysed for the preliminary horse inspection. 79 Table 5-2 Descriptive statistics for the temporal variables of each stride measured for the preliminary horse inspection. 79 Table 5-3 Descriptive statistics for limb pairs (n=24). 5-80 Table 6-1 Temporal measurements (mean ± standard deviation) for limb pairs between the 1't and r horse inspections. 6-97 Table 7-1 Temporal descriptive stride statistics of the preliminary inspection for the fore- and hindlimb pairs (mean:i:standard deviation, n=6). 7-111 Table 7-2 Maximum displacement variables in the preliminary inspection for range of movement for the fore and hind limb pairs (mean:t:standard deviation, n=6) 7-111 Table 7-3 Mean displacement variables for the head (mean:t:standard deviation, n=6) __ 7-114 Table 7-4 Mean displacement variables for the central torso marker (mean:t:standard deviation, n=6) 7-114 Table 7-5 Standardised displacement and timing measurements . All temporal values have been standardised for onset of stance phase as the initiation of the stride (mean:t:standard deviation, n=6). 7-115 Table 7-6 Standardised velocity and timing measurements. All temporal values standardised for onset of stance phase as the initiation of the stride (mean:t:standard deviation, n=6). __ 7-116 Table 7-7 Standardised acceleration and timing measurements. All temporal values standardised for onset of stance phase as the initiation of the stride (mean:i:standard deviation, n=6). 7-117 Table 8-1 Temporal descriptive stride statistics for the fore- and hind limbs pairs (mean:t:standard deviation, n=6). 8-127 Table 8-2 Mean displacement of hooves for range of movement for the fore- and hindlimb pairs (mean:t:standard deviation, n =6) 8-128 Table 8-3 Mean displacement variables for the head (mean:t:standard deviation, n=6) __ 8-128 Table 8-4 Mean displacement variables for the central body marker (mean:i:standard deviation, n=6) 8-129 Table 8-5 Standardised displacement and timing measurements for hooves. All temporal values standardised for onset of stance phase as the initiation of the stride. 8-130 Table 8-6 Standardised velocity and timing measurements for hooves. A 11 temporal values standardised for onset of stance phase as the initiation of the stride 8-1 3 1 Table 8-7 Standardised acceleration and timing measurements for hooves. All temporal values standardised for onset of stance phase as the initiation of the stride 8-1 33
1-5
List of Figures
Figure 3-1 Diagram of horse with overlaying of body, head, hoof reference templates __ 3-52 Figure 4-1 Representation of the two procedures used by competitors for the preliminary horse inspection. 4-70 Figure 6-1 Regression lines (including 95% confidence intervals) of the relationships between velocity and stride length for the first and third horse inspection. 6-95 Figure 7-1 Plot of fore- and hindlimb vertical trajectories for the preliminary horse inspection (meanbtandard deviation, n=6) 7-112 Figure 7-2 Plot of fore- and hindlimb transverse trajectories for the preliminary horse inspection (mean:fstandard deviation, n=6). 7-112
Figure 7-3 Plot of head vertical velocity for the preliminary horse inspection (meanbtandard deviation, n=6). 7-113
Figure 7-4 Plot of body vertical velocity for the preliminary horse inspection (meanbtandard deviation, n=6) . 7-113 Figure 7-5 Plot of head vertical acceleration for the preliminary horse inspection (meanbtandard deviation, n=6). _---:-_--:-__ ---:----:,...--_:--__ -:--______
7-118 Figure 7-6 Plot of mean body vertical acceleration for the preliminary horse inspection (meanbtandard deviation, n=6). 7-118 Figure 8-1 Plot of the mean head-:-ve
-r-:tic
-a--: l:-v
-el-:- o-cl
-·ty
-fi-=0-r
-th-:-e�
1,,;ran-d7
3-::-; iiI;;r:- in-spe
-c
-ti:-· o
-n
-.
----8-132
Figure 8-2 Plot of the mean body vertical velocity for the 1" and 3'" inspection. 8-132
1-6
Chapter 1 Introduction
The horse has played an integral role in New Zealand culture since its arrival in
1794. Historically the main focus of equestrian sport in New Zealand has been
hunting and thoroughbred racing. This love of galloping and jumping across
open country meant the New Zealand horse and rider were ideally suited to the
sport of three day eventing.
New Zealand event horses and riders have dominated the Federation Equestre
Intemationale / Best Communications and Management (FEJ/BCM) global
rankings for three day eventing since their inception. In terms of world
championships and Olympic medals won three day eventing is New Zealand's
most successful equestrian sport (Tunnah 1998).
The sport of three day eventing evolved from the riding tests for cavalry officers.
The competition was designed as a test of the cavalry officers all round
horsemanship. The first day's dressage was to test the officer's ability to train
the horse. The second day's speed and endurance was to test the officer's
bravery and ability to ride his charger across country. The third day's show
jumping was to demonstrate the conditioning and obedience of the officer's
charger. Because of the demanding nature of the sport the three horse
inspections are an integral part of the three day event format. These inspections
are performed to ensure that throughout the competition that the horse is fit and
free of lameness.
Concerns with the humidity and associated animal welfare risk of holding an
Olympic three-day event in Atlanta during mid-summer led to a great expansion
of our present knowledge as to the effects of high humidity climate on the
exercise capacity of the event horse (Jeffcott and Clarke 1995; 1996). However,
the kinematics of the event horse has not received much attention (Deuel and
Park 1993; Moore et al. 1995; Clayton 1997). To date no studies have been
performed on the kinematics of the horse inspections. This is surprising since the
horse inspections can prevent a horse from proceeding in the competition, and
1-7
because standardisation of the trot-up surfaces used for horse inspections at the
major three day events is considered necessary (Wilford 1997).
The examination of the changes in the kinematics between the first and third
horse inspections at a three day event not only addresses issues of interest to the
three day eventing fraternity but also examines the way horses respond and
recover from strenuous exercise. Epidemiological studies have identified that
lameness is a major cause of wastage in thoroughbred racehorses, and that this
predominantly occurs during training (Rossdale et al. 1985; Olivier et al. 1997).
A better understanding of the kinematic changes that occur the day after a
strenuous work out may permit greater refinement in racehorse training
programmes and minimise musculoskeletal injury.
The exercise physiology study performed for the 1996 Atlanta Olympics focused
on immediate recovery from strenuous exercise. Only one study examined the
recovery period through to 16 hours after the completion of the cross country
phase (Marlin et al. 1995). Many of the biochemical parameters monitored had
returned to basal level by 16 hours after the cross country phase. However,
creatine phosphokinase was still elevated at around twice basal level. In humans
elevated creatine phosphokinase levels have been associated with delayed onset
muscle soreness (MacIntyre et al. 1995) and McMiken ( 1983) does refer to the
possibility of muscle soreness in horses a day or two after exercise. These
factors raise the question as to what changes would be observed in the gait of
three day event horses during the third horse inspection and what impact these
changes would have on subsequent performance in the show jumping phase?
The purpose of this study was to investigate the horse inspection procedure and
the changes in gait between the first (preliminary) and the third horse inspections
at a CCI··· three day event.

1-8
References
Clayton H.M. (1997) Effect of added weight on landing kinematics in jumping horses. Equine Veterinary Journal Supplement 23, 50-53.
Deuel N.R.and Park, 1. (1993) Gallop kinematics of Olympic three-day event horses. Acta Anatomica 146, 168-174.
Ieffcott L B and Clarke A F (1995) Progress towards Atlanta '96. Thermoregulatory responses dring competitive exercise in the performance horse. Volume 1. Equine Veterinary Journal. Supplement. 20, 164.
Ieffcott L Band Clarke A F (1996) Progress towards Atlanta '96. Thermoregulatory responses during competitive exercise in the performance horse. Volume 2. Equine Veterinary Journal. Supplement 22, 112.
MacIntyre D L, Reid W D and McKenzie D C. (1995) Delayed muscle soreness. The inflammatory response to muscle injury and its clinical implications. Sports Medicine 20, 24-40.
Marlin D I, Harris P A, Schroter RC. et al ... (1995) Physiological, metabolic and biochemical responses of horses competing in the speed and endurance phase of a CCl .... 3-day-event. Equine Veterinary Journal Supplement 20, 37-46.
McMiken D F (1983) An energetic basis of equine performance. Equine Veterinary Journal 15, 123-33.
Moore D P, Deuel N R, Drevemo S and van den Bogert A 1. (1995) Kinematic analysis of world championship three day event horses jumping a crosscountry drop fence. Journal of Equine Veterinary Science 15, 527-31.
Olivier A, Nurton I P and Guthrie A 1. (1997) An epizoological study of wastage in thoroughbred racehorses in Gautang, South Africa. Journal of the South African Veterinary Association 68, 125-129.
Rossdale P D, Hopes R, Digby N J and Offord K. (1985) Epidemiological study of wastage among racehorses 1982 and 1983. Veterinary Record 116, 66-69.
Tunnah H (1998) Kiwis dominate eventing world. Evening Standard, Tuesday, December 29, 18
Wilford I (1997) Making the changes, Keeping things moving. New Zealand Equestrian Federation Bulletin 252, 25-26.

2-9
Chapter 2 Literature Review

2-10
Definition of locomotion
Locomotion can be described as the translation of the centre of gravity through
space along a pathway requiring the least expenditure of energy (Saunders et al.
1953).
The locomotor system consists of muscles, bones, joints, tendons, ligaments -
subjected to an input, the force of gravity, and producing an output, movement (or
the special case of movement: standing still) under the control of a regulating
system: the central and peripheral nervous systems (Rooney 1974).
Locomotion depends on two important interactive components:
1) The central pattern generator within the brain and spinal cord that produces the
neural activity responsible for movement of the limbs and,
2) A peripheral mechanism capable of providing sensory inputs to the central
pattern generator for making necessary adjustments during each cycle of the
limb movement.
The central pattern generator is organised hierarchically with several brainstem
areas being responsible for the actual 'generation' of the neural activity. The spinal
cord centres receive this input from the brain in order to control the patterns of the
muscular contractions between the flexor and extensor groups of each limb, as well
as the co-ordination between the limbs (Loeb 1985� Rossignol and Drew 1985).
Peripheral inputs during cursorial locomotion over uneven ground surfaces are
required if the centrally generated patterns of limb movements are to remain
smooth and co-ordinated. This important input will originate from different
sources, including receptors in muscles, tendons and ligaments, within the distal
limb and the hoof and enables the spinal cord generators to make the appropriate
muscle and limb adjustments (Bowker et al. 1995).
Gait analYSis
The science of motion in animals, including man, is referred to as kinesiology.
The subject may be subdivided into kinematics, the field of kinesiology dealing
2-11
with the temporal and displacement characteristics of motion without regard to
the forces associated with it, and kinetics, which deals with the forces that
produce, arrest, or modify motion (Dalin and leffcott 1985).
Kinematics
The earliest known study of the kinematics of animals, and horses in particular,
was performed by Eadweard Muybridge in 1887 using a series of still cameras
(Muybridge 1957). Currently a number of different techniques exist for
kinematic study. Video based systems are the most common (Clayton et al.
1995; Holmstrom et al. 1994; Drevemo et al. 1993).
The use of alternative systems, such as the opto-electronic CODA-3,(Cartesian
Optoelectronic Dynamic Anthropometer) (Back 1994) and accelerometer (Barrey
et al. 1994) based systems is restricted to specific labs. An opto-electronic
system with horses is currently only used by the team at University of Utrecht,
the Netherlands (Back et al. 1995b) and the accelerometer based system appears
restricted to the French group from the Institut Nationale de la Recherche
Agronomique (INRA) (Barrey et al. 1994). However, accelerometers can be
used in conjunction with opto-electronic and videography methods to quantify
the period of hoof contact (Back et al. 1993; Clayton 1996a).
The analysis of three dimensional (3D) kinematics of the horse has been limited.
The first documented 3D analysis of equine locomotion was performed by
Fredricson et al. (1972) using Swedish standardbred horses. Because of the
greater computational effort required for 3D analysis, most studies examine
equine gait in two dimensions (2D) (Drevemo et al. 1980b; Deuel and Lawrence
1987; Balch et al. 1996). Recent advances in computer processing power and
availability have made 3D analysis a more viable option for equine biomechanic
researchers (peloso et al. 1993; Galloux et al. 1994; Deguerce et al. 1996).
Kinetics
The use of a force plate for the analysis of ground reaction forces in horses was
pioneered by Pratt and O'Connor(1976). The subsequent application of the force

2-12
plate in either clinical or research situations was slow partially due to the large
number of attempts required to obtain suitable data (Seeherman et al. 1987). The
team at University of Utrecht has been responsible for much of the work on
equine kinetics (Schamhardt and Merkens 1987; Merkens et al. 1993) while a
valuable contribution has also been made by the Swedish group at Uppsala
(Hjerten and Drevemo 1994).
The three day event
History
Three-day eventing is a multidiscipline sport that includes dressage, speed and
endurance and show jumping tests. Originally developed as a test for cavalry
horses, three-day eventing has been an Olympic sport since the 1912 Stockholm
Olympics. This sport has experienced phenomenal growth since the 1960s, during
which the cross-country courses have become increasingly demanding both
technically in the demands placed on the horse and rider relationship, and
physiologically (Clayton 1991).
Three-day eventing has four levels of difficulty recognised internationally by the
Federation Equestre lnternationale (FEI). At the top level, only 5 competitions are
recognised as (Concours Complets Intemationaux Four star) CCI····, these are the
Olympics, the World Championships, Badminton, Burghley and Kentucky three
day events. The next levels down are the CCI···, CCI··, and then CCI·. The
CCI·" level is the highest FEI recognised level in which a horse can compete in
unless it is competing in one of the five elite competitions.
Currently the three tests of the three-day event have the following relative influence
on the final result; Dressage 3: Endurance (Road and Tracks (phase A and C),
Steeplechase (Phase B) and Cross country (phase D» 12: Showjumping 1 (Anon
1993). The heavy weighting of the endurance test places a large emphasis on
soundness and athletic ability.

2-13
Physiology
With the announcement that Atlanta had been awarded the 1996 Olympic games,
much attention was focused on the physiological response of event horses to
competition in hot humid environments (Jeffcott and Hodgson 1995� Ieffcott
1995). The bulk of this work was subsequently published as two supplementary
issues of the Equine Veterinary Iournal (Jeffcott and Clarke 1995� Ieffcott and
Clarke 1996). It contributed to our understanding of the physiological stress an
event horse is subjected to during the speed and endurance test. It focused on the
immediate recovery from strenuous exercise, while only Marlin et al. (1995)
continued measurements after cross country through to 16 h after completion of
phase D of speed and endurance day. Under standard format for three-day event
competitions, the third horse inspection is held approximately 16 hours after
completion of phase D. Within this period, the majority of measured parameters
were within the pre-competition reference range. At 16 hours after phase D
levels of both creatine phosphokinase (CK) were approximately twice pre
competition levels, and aspartate aminotransferase (AST) was approximately one
and half times pre-competition-Ievel. Rectal temperature was also slightly
decreased at 16 hours.
Time motion analysis
Time motion analysis can be used for the assessment of the physiological
requirements of different sports and also the different roles and positions within
the same sport. It quantifies the time periods spent on various activities.
Performance is analysed according to the time spent on an activity and the type
or intensity of the activity. From this activity intensity and time budget
information, competition specific conditioning and preparation regimes can be
developed to maximise performance (Clayton 1993a). In equestrian sport, time
motion analysis has been performed on Grand Prix dressage and show jumping
(Clayton 1989b� Clayton 1993a� Clayton 1996b). From the results of time motion
analysis, recommendations have been made to refine the training protocol with
emphasis placed on the aerobic or anaerobic requirements of different sports.
The application of time motion analysis to equestrian sport has been reviewed by
Clayton (1991).
2-14
The horse inspection
An integral part of the three day event competition are the horse inspections.
Three horse inspections are performed. The first inspection is on day one prior to
the dressage. The second inspection takes place at the end of phase C just prior
to the cross country and a third inspection is performed on the morning of the
show jumping (Anon 1997). Both the first and third horse inspections are
performed with the horses trotted up on a hard level surface (Anon 1998) and in
New Zealand on an asphalt surface (Wilford 1997).
Examination of the kinematics of three day event horses has focused on the cross
country test (Deuel and Park 1993� Moore et al. 1995� Clayton 1997), but the
kinematics of the horse inspection has not previously been examined.
Lameness
Lameness examinations are performed at either the walk or trot. Lameness is
suspected if asymmetric motion is observed or asymmetric sounds of the feet
contacting the tread surface are heard (Seeherman 1991). Lameness is an
indication of a structural or functional disorder in one or more limbs that is
manifested during progression or in the standing position.
In a horse lame in a forelimb at the walk or trot, the lowest height of the head
occurs during the stance phase of the sound limb and the maximum height of the
head occurs during the stance phase of the lame limb. In severe lameness only
one sinusoidal curve can be observed for the head trajectory. Lameness is
usually graded using a five point subjective scale according to the guidelines
established by the American Association of Equine Practitioners in 1991 (Peloso
et al. 1993). According to Stashak (1987), lameness can be classified into the
following four categories
1. Supporting limb lameness. This is evident when the horse is supporting
weight on the foot or when the horse lands on it.
2. Swinging limb lameness. This lameness is evident when the limb is in
motion.
3. Mixed lameness. This is evident �hen the limb is moving and when it is
weight bearing.
2-15
4. Complementary lameness. Pain in a limb will cause uneven distribution of
weight on another limb or limbs, which can produce lameness in a previously
sound limb. Muscle and upper limb problems are considered to cause a
swinging limb lameness, while bone and lower limb problems could cause a
supporting limb lameness (Stashak 1987)
Asymmetry
Traditionally, asymmetry has been believed to result in increased biological
strain with ensuing pathological changes in the locomotor system (Rooney 1969),
and asymmetry has also been associated with poor performance in standard bred
trotters (Dalin et al. 1985). However, within certain bounds, gait asymmetry may
be normal and not indicative of some underlying pathological condition.
Contrary to the consistent sinusoidal wave of the head at the trot, Buchner et al.
(1993) found that in sound horses there is a physiological asymmetry in the
course of one hip. Asymmetry of linear and temporal gait patterns has also been
identified in the trot of elite level dressage horses (Deuel and Park 1989� Clayton
1994). In standardbred trotters, asymmetries of the trot have been found in
healthy horses (Drevemo et al. 1980c), and were most pronounced in a group of
intensively trained 18 month old horses (Drevemo et al. 1987), and were believed
to be manifestations of already existing asymmetries or laterality. A number of
theories exist in lay literature as to the reason for asymmetry or "handedness" in
horses. Meij ,and Meij (1980) found functional asymmetry in all 30 horses
examined and proposed that this sidedness was due to asymmetrical neural
control of motor function.
Epidemiology
From a survey of six racehorse stables over a two year period, the greatest loss of
training days was due to lameness (67.6%), well ahead of the next category,
respiratory problems (20.5%) (Rossdale et al. 1985). This value is remarkably
similar to an analysis of wastage of thoroughbred racehorses in Gauteng, South

2-16
Africa, where training days were lost due to lameness (66.9%) and then
respiratory problems (Olivier et al. 1997). Recently the epidemiology of
lameness in performance horses and racehorses in particular has received
increasing attention (peloso et al. 1990; Wilson et al. 1993; Wilson et al. 1996).
Unfortunately many risk factors have been identified including sex, age, age at
first race, horseshoe characteristics, racing frequency, duration of racing career,
number of starts per year, intensity of racing and training schedules, weather,
season and pre-existing osseous lesions. It has been proposed that the conflicting
results from these studies may result from variability of the definition of injury
and the population studied (Cohen et al. 1997).
Economic loss
"Locomotion disorders constitute the major veterinary problem in thoroughbred
racing and result in tremendous losses to horse owners" (Fredricson et al. 1980).
Some researchers have estimated that lameness consumes at least half the
maintenance expense of a racehorse (MacKay-Smith M P 1977). Recently estimates
were made that 1 of 600 to 700 Thoroughbred entrants sustains a catastrophic
racing injury (Estberg et al. 1998). This loss of horses not only has a direct
financial affect on the owners but also provides a negative public perception of the
horse racing industry, the direct costs of which are difficult to calculate (Estberg et
al. 1996).
Definition of the trot The trot is a running gait performed by the majority of quadrupeds and is
characterised by the more or less synchronous movements of the diagonal limb
pairs (Muybridge 1957). The Federation Equestre Internationale (FEI) states that
the trot is a pace of "two time" on alternate diagonal legs (left fore and right hind
leg and vice versa) separated by a moment of suspension (Anon 1991).
Types of trot
According to the FEI rule-book the trot can be divided into four categories, the
collected, working, medium and extended trot (Anon 1991). Clayton ( 1995)

2-17
examined these classifications and showed that there was a steady increase in
velocity and stride length progressing from the collected through to extended
trot. Stride frequency remained relatively constant across categories supporting
the FEI rules that changes between gait type should be characterised by an
increase in stride length and maintenance of a consistent rhythm. Historically the
boundaries between, and within gaits have been often based on factors of breed
or style rather than on general differences in the manner of the movement of the
legs (Hildebrand 1965). At racing speeds the trot is distinctively different from
the observations of the collected through to extended trot. At racing speeds (�12
m.s-1) there is greater disassociation of the limb pairs and negative advanced
placement (Drevemo et al. 1980a; Drevemo et al. 1980b; Drevemo et al. 1980c).
These differences may be an artefact of the velocity ranges observed or may
represent different strategies employed to achieve the different objectives. From
comparison of the observations made by Clayton (1995) for riding or dressage
horses and the observations of Drevemo et al. (1980a; 1980b; 1980c) for racing
standardbreds there is justification for inclusion of a fifth common type of trot;
the racing trot.
Velocity, stride length and, stride frequency
As a general rule, stride length increases linearly with velocity in the normal
horse (Back et al. 1993). Individual horses may have a preferred stride frequency
at a given velocity and gait (Ratzlaff et al. 1995). Most human distance runners
have a preferred stride frequency. Cavanagh and Williams ( 1982) proposed that
this preferred combination of stride frequency and stride length was chosen to
minimise the metabolic cost during level running.
Increases in velocity at moderate speed is achieved by increases in stride
frequency, while at the faster gaits increases in velocity is mostly by an increase
in stride length (Deuel and Lawrence 1986). Clayton ( 1994) found that at the
trot, increases in velocity at the moderate speeds used in equestrian sport were
achieved primarily by increases in stride length. However above this velocity
range at the racing trot (approximately 12m.s-1), increases in velocity are
2-18
achieved by increases in stride frequency (Drevemo et al. 1980a; Drevemo et al.
1980b).
Training can alter the relationship between stride length, frequency and velocity.
The effect of training on this relationship may be influenced by the training
objective and the breed of horse. It has been demonstrated that in racing
standardbreds with a period of training there is an associated decrease in stride
length and an increase in stride frequency (Drevemo et al. 1987). This has been
attributed to an improvement in neuromuscular co-ordination. However, more
recently, conflicting results have been presented. In response to training, a group
of treadmill interval trained standardbred trotters had an increased stride length
and a decrease in stride duration when examined at 8ms·1 (Gottlieb-Vedi et al.
1995). Differences in results may be due to the lower velocity (8ms·1 vs 12m.s·1)
and that they were treadmill trained. Different training objectives may influence
the relationship of velocity with stride length and duration. If comparison is
made between the stride lengths and frequencies of horses not trained for
dressage (Clayton 1989a) and dressage trained horses (Clayton 1994) at the same
velocity, the dressage trained horses had a longer stride and stride duration than
the other horses. This is similar to the response to show jumping training by
Spanish Anglo-Arab horses (Munoz et al. 1998). In contrast to this, with a 70
day training period in young (2.5 year old) Dutch warmblood horses there was no
significant change in the relationship of velocity with either stride duration or
stride length (Back 1994).
Breed may also interact with the training objective to modify the responses
observed. Andulusian horses demonstrated a decrease in stride length in
response to dressage training (Munoz et al. 1997). However, at the extended
canter (6-7ms·1), breed does not appear to contribute significantly in the
relationship between velocity and stride length and duration between
thoroughbred racehorses and warmblood dressage horses (Clayton 1993b).
Caution should be used when comparing studies. The velocity at which the
horses were examined may influence the changes in the inter-relationship
observed between velocity and stride length and duration. The different

2-19
responses to training in the stride length, frequency and velocity relationship
observed between the Standardbred trotters (Drevemo et al. 1987) and the other
studies (Clayton 1994; Gottlieb-Vedi et al. 1995; Munoz et al. 1998) may be an
artefact of the velocity range at which the horses were examined.
Temporal & Kinematic patterns
Kinematic fingerprint.
The consistency of the stride length and frequency relationship with velocity
observed within horses by Ratzlaff et al. (1995) implies that a horse's temporal
pattern may also be consistent. The horse's gait pattern has been shown to be
stable and is regularly repeatable from one stride to the next (Drevemo et al.
1980a). Only a few longitudinal studies comparing horses during periods of
growth have been performed on equine locomotion, possibly due to the expense
of such trials. Back et al. (1994) found strong resemblance both visually and
graphically during a period of growth and development. Even with
experimentally induced low level lameness (lameness score 2/5), horses
maintained their temporal pattern (Buchner et al. 1995). This consistency of the
equine gait pattern has lead to the term "kinematic fingerprint" to describe this
consistency of an individuals gait pattern which is already fully developed at 4
months (Back 1994).
Swing Phase
The swing phase in gait analysis refers to the non weight bearing phase of the
stride. At the trot it comprises about 75% of the stride cycle. Swing phase
duration is believed to be the main contributor to stride time variations in
different horses trotting at the same velocity (Drevemo et al. 1980b). The term
swing phase has been accepted as the preferred term for the non-weight bearing
phase of the stride cycle as it implies both functional and timing elements (Leach
et al. 1984). Subsequently (Holmstrom et al. 1993) has subdivided the swing
phase into protraction and retraction elements.
Protraction

2-20
Protraction is the time from the end of the start of swing phase until the limb is at
maximum extension.
Retraction
Retraction during the swing phase is the time period from the end of protraction
(limb at maximum extension) until the beginning of the stance phase with contact
of the hoof with the ground surface. For Swedish warmblood horses this has
been quantified as being 22% of the stride duration in the forelimbs and 5% in
the hind limbs (Holmstrom et al. 1993).
Stance Phase According to the terminology recommended by (Leach 1993) the stance phase
begins when the hoof contacts the ground. This can be either heel-first, flat
footed or toe first placement. At the end of the stance phase, heel off usually
occurs before the limb is lifted from the ground (Dalin and Jeffcott 1985).
Mid Stance
Mid stance is when the metacarpus is in the vertical position of the forelimb
stance phase and, in the hind limb when the hip joint is vertical to the hoof
(Drevemo et al. 1980b). Because of this description, mid stance is a descriptive
of limb position rather than representing the temporal mid point of the stance
phase (Leach et al. 1984). It has been suggested that mid stance represents the
period of change from deceleration of the limb to a propulsive phase (Drevemo
et al. 1980b).
Advanced Placement and Advanced Completion
At slow speeds, the hooves of the diagonal limb pair tend to contact the ground
together. However, with increasing velocity there is a tendency for dissociation
of the limb pair with the forelimb landing and taking off first (Drevemo et al.
1980c). Impact of the forehoof precedes that of the hindhoof consistently at
racing speed with the magnitude of the disassociation at landing being greater
than that at lift off (Drevemo et al. 1980a). This disassociation has been termed
advanced placement for the period between limb contact time and advanced
completion for the time period between lift-off of the legs of the diagonal (Leach
et al. 1984). Positive advanced placement has been observed in riding horses and

2-21
it has been proposed that this may be an effect of training (Deuel and Park 1989;
Clayton 1994).
Overlap
Overlap is the period when both limbs of the diagonal pair are in stance phase
concurrently (Leach et al. 1984). With the progression from the slower collected
trot through to the faster extended trot in dressage horses there is a decrease in
the period of overlap (346±9 to 253±6ms) (Clayton 1994). Associated with this
decrease in overlap is a decrease in stance time and an increase in diagonal
advanced placement and completion.
Trajectories
Head trajectory
Anecdotal evidence for a role of head and neck position on stride length can be
found in the FEI rules for dressage. (Clayton 1994) identified that one of the
primary demarcations between the FEI classifications for the trot was the
difference in velocity with the horses maintaining their stride frequency. The
FEI rules describing the differences between the types of trot refer to the elevated
head and neck position found in the slower shorter striding collected trot and the
lengthening on the "frame" or lowering of the head and neck position with the
faster longer striding extended trot (Anon 1991).
According to Girtler (1988), at the normal trot the head stays in almost the same
position. In contrast, Peloso et al. ( 1993) found that during the trot the head
moved in a sinusoidal pattern. The head was lowered and raised during the
support phase of each forelimb, producing a down and up head movement for the
support phase of each forelimb. The symmetry of this pattern was only altered
when the subjective lameness grade reached 3/5.
Hoo/Trajectory
Before the advent of kinematic studies, the flight of the hoof was often described
as being a unimodal parabolic curve with the shape and often the length of the
curve determined by hoof angle (Stashak 1987). Subsequently, hoof angle has
been demonstrated to influence break-over time and not hoof trajectory.
2-22
However it is the weight of the shoe that appears to be the predominant cause for
alterations in the hoof trajectory in trotting horses (Balch et al. 1996).
Kinematic analysis has identified that hoof trajectory in both the fore- and
hindlimbs has a characteristic bimodal pattern (Balch et al. 1996). The first peak
t�at occurs soon after lift-off is always greater than the second peak. Different
hoof trajectories are observed between the fore- and the hindlimbs. Overall there
is a greater range of movement in the forelimb than the hind limb (Back 1994;
Holmstrom 1994). Not only are there differences between the fore- and hindlimb
for range of motion but there are also differences in the temporal pattern of the
trajectories. In the forelimb of the Swedish warmblood the first peak of hoof
flight occurs at approximately 50% of the stride cycle (with stride cycle
beginning from initial ground contact of the hoof). The second peak occurs at
approximately 80% of the stride cycle when the forelimb is at maximum
extension (Holmstrom et al. 1993). In the hindlimb the first peak occurs earlier
at approximately 40% of the stride cycle. The second peak is not as pronounced
and occurs at approximately 80-90% of the stride.
Hoo/Velocity and Acceleration
Differences in the trajectories between fore- and hindlimbs are also reflected as
differences in the pattern of the velocities and accelerations. The kinematics of
the distal forelimb during the stance phase and at loading have been examined by
Johnston et al. ( 1995) and lohnston et al. ( 1996). Back et al. ( 1995b) compared
the kinematics of the forelimb with the hind limb. In the forelimb of
standardbred trotters, vertical and horizontal velocity did not reach zero until
19"10 and 25% of stance time (Johnston et al. 1995). In 26 month old Dutch
warmblood horses, a significantly larger negative peak for vertical velocity at
impact is observed in the forelimb than in the hindlimb. Horizontal velocity also
has a different pattern between the fore- and hindlimbs. The forelimbs had a
slightly larger peak horizontal velocity that occurred later in the swing phase
(Back et al. 1995b). Differences in the acceleration plots were also observed
between the fore- and hindlimbs. Peak horizontal and vertical acceleration was
larger in the forelimbs at the completion of the stance phase. The differences in
the velocity and acceleration data between the fore- and hindlimbs have been

2-23
used as an argument for the greater observation of lameness in the fore- rather
than hindlimbs of horses (Back et al. 1995a). This argument is based on the
assumption that the higher level of loading and oscillations in the forelimb will
predispose the forelimb to an increased the chance of trauma and injury.
Limb trajectories
When analysing equine gait, one of the difficulties is the volume of information
and the best method to present the data. Joint angle-time diagrams and stick
diagrams have previously been used (Fredricson and Drevemo 1972� Marteniz
del Campo et al. 199 1 � Back et al. 1995c� Back et al. 1995d). The more distal the
position measured on the limb the greater the trajectory or displacement (Back et
al. 1995c� Back et al. 1995d). Within each limb there is a tight relationship
between the trajectories of the different segments.
Similar to the temporal patterns, the joint angle curves have a high degree of
individual horse specificity and repeatability across strides (Back et al. 1995c)
and even across gaits, between the walk and the trot (Back et al. 1996). The
inter-relationship between segments for both the forelimb and hindlimb have
been documented by Back et al. ( 1 995c) and Back et al. ( l 995d).
To understand the pattern of the equine limb it can be considered to be analogous
to a pendulum (Back et al. 1995c). In human gait analysis a modified pendulum
model (compass gait) has been proposed as an aid in the understanding of the
walk (Saunders et al. 1953). This theorem attributes 6 primary methods to
minimise the displacement of the centre of mass. These 6 determinants being�
The first determinant: Pelvic rotation,
The second determinant: Pelvic tilt,
The third determinant : Knee flexion in the stance phase,
The fourth and fifth determinants: Foot and knee mechanisms and,
The sixth determinant: Lateral displacement of the pelvis.
One of the six determinants of gait proposed involves the placement of the foot
under the median plane by alteration of tibiofemoral angle and by adduction of
the hip joint. At the racing trot, horses have been observed to place their hooves

2-24
under the centre line (Dalin et al. 1973). Further similarity between the six
determinants of human gait proposed by Saunders et al. ( 1953) and equine
locomotion can be found in the observation of Back (1994) that the body height
at the trot is always lower than that when standing still. This implies that the
conservation of energy by minimising the displacement of the centre of mass is
also a fundamental concept in equine gait.
At the trot, the movements of the legs are too fast to be explained solely by a
pendulum theory but rather that the trot frequency is best explained by the elastic
resonance of the diagonal pair of limbs (Witte et al. 1995). This theory is similar
to the damped spring mass system (Rooney 1969). From observations of the trot
of Dutch Warmbloods, a combination of the resonance and pendulum theories
has been proposed (Back 1994). During the stance phase, fore and hind limbs act
as passive struts, whereas during the swing phase they move like a pendulum
with pivots in the scapula and hip joint, respectively.
Kinetics
Obtaining data from a force plate can be a frustrating exercise. Quddus et al.
( 1978) mentioned that only 1 run in 20 was successful in obtaining ground
reaction force (GRF) data. However, by standardised and carefully controlled
measurement conditions Seeherman et al. ( 1987) were able to demonstrate that
the force plate was a feasible tool for equine gait analysis. In order to compare
ground reaction forces between horses it is necessary to standardise the values.
Standardisation is normally done with respect to the body mass of the animal and
the stance phase duration (Merkens et al. 1993).
Kinetics of the stance phase
Mid stance is commonly used as a descriptive term for the division of the stance
phase. As previously discussed, mid stance does not necessarily represent the
equal division of the stance phase into temporal halves but rather provides a
point for the transition of the limb during stance from deceleration to propulsion
(pratt and O'Connor 1976). Peak loading of the forelimb occurs close to this mid
point at 45-50% of the stance phase (Quddus et al. 1978) but is slightly earlier in
the hindlimb 40-45%.
2-25
Ground Reaction Forces - GRF
Ground reaction forces measure the forces exerted in 3 dimensions: Fx is the
transverse (Iatero-medial) force, Fy is the longitudinal (forward-backward) force
and, Fz being the vertical force (Mer�ens and Schamhardt 1988). Similar to
kinematic results, kinetic data as measured by GRFs are highly repeatable. The
differences between individuals are greater than between recordings of the same
animal, even after a three year interval (Merkens et al. 1985) . By
standardisation of GRFs to body mass and stance phase time it is possible to
compare GRFs between horses. Merkens et al. (1993) produced representative
GRF patterns for the Dutch warmblood. Peak vertical forces increase as the
progression is made from walk to trot to the canter. At the walk peak forces are
approximately equivalent to 0.5 to 0.7 times body weight, at the trot these forces
are 0.9 to 1.3 times body weight and are up to 1.75 times body weight at 14m.s·1
(Dalin and Ieffcott 1985). The load on the forelimbs is higher than that on the
hindlimbs because the centre of gravity is situated closer to the forelimbs
(Merkens et al. 1993).
At the walk, two small peaks can be observed in the vertical GRF (Fz) curve but
at the trot only one peak is observed (Merkens et al. 1993). Between the walk
and trot differences exist between the retarding (FY) and propulsive forces (Py).
At the trot, the retarding forces have a longer and larger peak in the forelimbs
than the hind limbs. The opposite is true for the propulsive forces implying that
the forelimbs act as passive struts with the hindlimbs providing the propulsive
force (Merkens et al. 1993). In contrast, at the walk the propulsive force of the
forelimbs is larger than that of the hindlimbs (Merkens et al. 1985).
Inverse Dynamics
Inverse dynamics calculates the time histories of joint torques (or moments) by
combining kinematic and kinetic data. Joint torques are calculated by
considering the limb to be a series of linked segments (van den Bogert 1998).
Inverse dynamics provides a solution to the problem of not being able to identify
the forces in kinematic analysis and the difficulty of not being able to identify the
source of the change in forces measured using kinetic (force plate) analysis.
Ioint torques are related directly to the combination of forces generating
2-26
antagonistic muscle activity across a joint. Even more so than man, the horse
with its 4 multijointed limbs, frequently acting as closed-chain mechanisms, may
redistribute its joint torques without visual change in the gait. Evidence for this
can be observed from the stability of the temporal pattern under induced
lameness (Buchner et al. 1995). Inverse dynamic analysis permits us to ' see'
these differences in muscle co-ordination.
In the human studies, inverse dynamics has been applied to 2 and 3 dimensions
(Winter 1990�van den Bogert 1994). Recently, inverse dynamics has been
successfully applied to the horse using a 2 dimensional linked segment model of
the forelimb for the stance and swing phase of the trot (Clayton et al. 1998�
Lanovaz et al. 1998).
Tendon strain I action Because of the difficulties inherent with in vivo work on tendon strain, much
attention has been focused on work in vitro. However differences in results
between in vitro and in vivo work has been demonstrated (Riemersma and
Lammertink 1988� Riemersma et al. 1996b).
As expected, the loading on the tendon structures and the pattern of deformation
is dependent on the gait and the velocity within the gait (Riemersma et al. 1988�
Riemersma and Lammertink 1988). Ground surface has also been shown to
change the pattern of loading (Riemersma et al. 1996b) with the maximal strain
on the inferior check ligament and suspensory ligament significantly higher on
pavement than on sand.
At the walk, the loading of the inferior check ligament is similar to that at the trot
(5.36% to 4.88%) and so may not play as significant a role in the retention of
elastic strain energy as the superficial digital flexor tendon, deep digital flexor
tendon and suspensory ligament which all increased in loading significantly from
the walk to the trot (Riemersma and Lammertink 1988). At the trot, �he strain
patterns for the superficial digital flexor tendon, deep digital flexor tendon and
suspensory ligament showed a rapid increase at the beginning of stance phase,

2-27
followed by a plateau with a small incline or decline and then a rapid decrease at
the end of stance phase indicating some storage of elastic strain energy
(Riemersma et al. 1996a).
Effect of ground surface
The importance of a "good" ground surface on which to train horses on has long
been recognised (Drevemo et al. 1994). However, it is only recently that we have
been able to quantify the effects that different ground surfaces have on the
kinematics and kinetics of the equine gait. With a hard resistant surface there is a
decrease in the stride length and duration (Riemersma et al. 1996b) and a reduced
vertical displacement of the withers (Buchner et al. 1994).
When the hoof contacts the ground at the beginning of the stance phase, there are
high frequency components of the horizontal and vertical force traces or impact
oscillations (pratt and O'Connor 1976; Hjerten and Drevemo 1987). The frequency
components of the impact accelerations differ according to the ground surface and
the horse shoe construction (Barrey et al. 199 1; Benoit et al. 1993). On more
compliant surfaces the frequency of these impacts are as low as 41Hz and increase
to 592 Hz on stiff surfaces (Barrey et al. 1 991). Force plate studies have indicated
that impact frequencies above 70Hz reflect the properties of the limb during loading
at the initiation of the stance phase (Merkens and Schamhardt 1994). It may be that
these high frequency impact oscillations are the signals for the horse to alter its gait
pattern to minimise concussion and yet have sufficient elastic energy recovery to
maintain an efficient gait.
The pliability of the surface appears to affect the angle of the hoof sole and the
ground. With a more compliant surface, like sand, a small positive caudal angle has
been observed in association with the hoof sole angle (Riemersma et al. 1996b).
This forward rotation of the hoof is so that the sole is perpendicular to the vector of
the GRF, which may prevent the hoof slipping.

2-28
Overground VS treadmill trot The high speed treadmill is commonly used in equine research (Sloet van
Oldruitenborgh-Oosterbaan and Bameveld 1995). Current opinion is that noIinal
overground exercise is more demanding than treadmill exercise (Persson 1983;
Barrey et al. 1993a). Daniels et al ( 1953 cited by Sloet van Oldruitenborgh
Oosterbaan and Bameveld 1995) reported that energy expenditures of young adult
men were consistently about 1 ()o1o lower on a treadmill than on an asphalt road or
cinder path.
The reasons proposed in the literature to explain the difference between the
workload of a mounted horse on a normal track and that of an un-mounted horse on
a treadmill are the riders action, a lower air resistance on the treadmill, the changes
in kinematic variables and a psychological adaptation (Barrey et al. 1993b).
It has been shown that when they are walking on a treadmill, people tend to use a
faster and shorter stride than when they are walking normally (Murray et al. 1985).
However, at a walk, horses had slower, longer strides on a treadmill than on a track,
even when the treadmill was inclined (Barrey et al. 1993 a). In un-mounted horses,
the relative stance duration at the trot increased significantly on a treadmill
compared with trotting on a track (Buchner et al. 1994). It has been suggested that
the moving treadmill belt brings the supporting limb back under the body during the
support phase of running and thus reduces the energy requirements of a runner
(Frishberg 1983).
Exercise on a horizontal treadmill proved to be significantly less demanding than
exercise on a firm shell track (Barrey et al. 1993b). The difference in workload
between the exercise on the track and the treadmill appeared to be better balanced
by a 10 per cent increase in speed than by a 1 to 2 per cent inclination in the
treadmill, particularly if the higher lactate concentrations were related to the use of
different muscles. Because of the physiological and kinematic differences observed
between over ground and treadmill exercise, caution should be used when
extrapolating results from the treadmill studies to the overground / field
environment.

2-29
Effect of fatigue It has been proposed that "the proper functioning of the locomotor system depends
on precise synchronisation of the movement of each part on every other part and in
relation to the body as a whole. Pathological changes may occur when improper
synchronisation occurs" (Rooney 1969). This indicates the danger to the body
when fatigued.
A characteristic of fatigue in human middle-distance runners is the use of a
shorter and higher frequency stride to achieve the same relative velocity.
Associated with the change in the relationship of stride length and frequency
with velocity, there is an associated increase in stance as a relative percentage of
stride time (Elliott and Roberts 1980). It is likely that the kinematic responses to
fatigue in bipeds (humans) and quadrupeds (horses) will be similar. The trot is
analogous to running in humans (Alexander et al. 1977). The role fatigue plays
with respect to changes in kinematic parameters in the horse is not well
understood. Wilson et al. ( 1993) found a decrease in velocity and an increase in
the stance component of the stride in endurance horses near the completion of a
120km endurance race. Leach and Sprigings ( 1979) found that stride duration
increased with an associated increase in stance as a percentage of stride at the end
of a flat race, and was considered to be due to fatigue. Pratt and O'Connor (1978)
proposed that fatigue caused a reduction in the swing phase of the stride and that
this provided a reduced opportunity for retraction of the limb. This reduction in
time available for retraction was believed to lead to poor placement of the hoof and
subsequent breakdown.
Fatigue has also been implemented as a contributing factor to tendon damage when
associated with muddy or slippery track conditions (MacIlwraith 1987).
Delayed onset muscle soreness (DOMS)
Muscle soreness usually develops within the first 24 hours following exercise
(Ebbeling and Clarkson 1989). This phenomenon has been referred to as delayed
onset muscle soreness (DOMS). In humans the soreness is a dull aching pain
combined with tenderness and stiffness (MacIntyre et al. 1995). DOMS does not
2-30
appear to have been described in horses but McMiken (1983) does refer to the
possibility that there may be sub-clinical structural damage in muscle which is
reflected in the "soreness" a day or two after exercise. This may be the cause of
the stiffuess on the morning following speed and endurance day reported in 3-
day event handbooks (Leng and Murphy 1990; Holderness-Roddam 1 991).
Elevated creatine phosphokinase levels have been associated with DOMS and
Marlin et al. (1995) have found elevated creatine phosphokinase at twice basal
level 16 hours post completion of phase D of speed and endurance day.
With DOMS, a decreased range of motion could be expected (MacIntyre et al.
1995). Therefore horses may find it more efficient or comfortable to use a lower
stride length and duration to achieve the same velocity. From studies in human
running it has been proposed that long strides require considerable power during
propulsion and result in excessive vertical oscillation of the centre of mass,
produce a foot-strike position which creates large braking forces, and require
joint ranges of motion which invoke increased internal friction and stiffness
(Anderson 1996). After strenuous exercise, the expectation would be that the
horse would attempt to minimise the effect of these factors. Because of this there
should be measurable changes in the temporal and kinematic pattern of three day
event horses between the first and third horse inspections.
Effect of breed
It has been proposed that each horse has a distinctive gait pattern (Ratzlaff et al.
1995; Drevemo et al. 1980a; Back et al. 1994). If so, it is expected that
distinctive patterns will be clustered within breed. Schamhardt et al. (1991)
found that the stance phase of the forelimbs in Dutch warmblood horses was
longer than the stance phase of the hindHmbs. This was in contrast to the
observations of Drevemo et al. ( 1980b) who found trotting standardbreds had a
slightly longer stance phase for the hindlimbs. Differences in gait pattern have
been measured between such diverse breeds as the Shetland pony and the Dutch
warmblood (Back et al. 1998).
2-31
A breed effect on ground reaction forces (GRF) has been proposed from
comparison of standardised GRFs between studies using different breeds
(Merkens et al. 1993). Because of the differences in GRF pattern, Merkens et al.
(1988) proposed that the H(orse) index developed to evaluate gait symmetry
based on force plate data could only be used for the Dutch warmblood and could
not be applied across other breeds.
Even the predominance of certain tendon injuries within a breed implies that
there may exist a breed difference in gait pattern (Fackelman 1973). However it
is possible that the differences in tendon injury and types of lameness observed
between breeds may be predominantly a reflection of the specific tasks asked of
each breed or type.
Gait analysis of field or competition data The choice of gait analysis procedure becomes very restrictive when the horse is
to be examined in the field or competition environment. The protocol has to be
non-invasive. It is the need for flexibility and a non-invasive protocol that may
explain why many field studies have been kinematic,using cinematographic or
videographic based systems (Fredricson et al. 1980; Deuel and Park 1990;
Wilson et al. 1993; Drevemo and Johnston 1995; Clayton et al. 1996). A number
of different types of competition have been subjected to kinematic analysis
including endurance competitions (Wilson et al. 1993), showjumping (Clayton et
al. 1995), and three-day eventing (Moore et al. 1995; Clayton 1997). However to
date there has been no kinematic analysis of the horse inspections at three-day
events.
2-32
References
Alexander R M, Langman V A and Iayes A S ( 1977) Fast locomotion of some African ungulates. Journal o/Zoology. London 183, 291-300.
Anderson T (1996) Biomechanics and running economy. Sports Medicine 2, 76-89.
Anon. Rules for dressage events, 18th edn. Federation Equestre Int,ernationale, Switzerland. pp22-24. 1991.
Anon, N.Z.E.F. Rules and regulations constitutional rules by-laws. Based on the rules of the Federation Equestre Internationale. 1993.
Anon. Memorandum. For ground juries, Technical delegates, Course designers, organisers and competitiors of international three day events and guidelines to the rules for three day events. 5th edn. Switzerland. 1997.
Anon. Veterinary Regulations. 8th Edition. Federation Equestre Internationale Switzerland pp156. 1998.
Back W 1994 Development of equine locomotion from foal to adult. PhD Thesis Utrecht University.
Back W, Barneveld A, Schamhardt H C, Bruin G and Hartman W (1994) Longitudinal development of the kinematics of 4-, 10-, 18- and 26-month old Dutch warmblood horses. Equine Veterinary Journal Supplement. 17, 3-6.
Back, W., Barneveld, A, van Weeren, P.R.and van den Bogert, AI. (1993) Kinematic gait analysis in equine carpal lameness. Acta Anatomica 146, 86-89.
Back W, Schamhardt H CandBarneveld A (1996) Are kinematics of the walk related to the locomotion of a warmblood horse at the trot? Veterinary Quarterly. 18, s79-84.
Back W, Schamhardt H C, Hartman W and Barneveld A (1995a) Kinematic differences between the distal portions of the forelimbs and hindlimbs of horses at the trot. American Journal of Veterinary Research 56, 1522-8.
Back W, Schamhardt H C, Hartman W and Barneveld A (1995b) Kinematic differences between the distal portions of the forelimbs and hind limbs of horses at the trot. American Journal of Veterinary Research 56, 1522-8.
Back W, Schamhardt H C, Savelberg H H et al . . (1995c) How the horse moves: 1 Significance of graphical representations of equine fore limb kinematics. Equine Veterinary Journal 27, 3 1-8.
Back W, Schamhardt H C, Savelberg H H et al . . (1995d) How the horse moves: 2. Significance of graphical representations of equine hind limb kinematics.
2-33
Equine Veterinary Journal 27, 39-45.
Back W, Schamhardt H C, van Weeren P R, Barneveld A. (1998) Is the locomotion of the Shetland pony and warmblood foals similar? Abstract booklet 5th International Conference on Equine Exercise Physiology. Japan:
Balch 0, Clayton H M and Lanovaz J (1996) Weight- and length- induced changes in limb kinematics in trotting horses. Proceedings American Association of Equine Practitioners 42, 2 18-2 19.
Barrey E, Galloux P, Valette J P, Auvinet B and Wo Iter R (1993a) Determination of the optimal treadmill slope for reproducing the same cardiac response in saddle horses as overground exercise conditions. Veterinary Record 133, 183-5.
Barrey E, Galloux P, Valette J P, Auvinet B and Wolter R (1993b) Stride characteristics of overground versus treadmill locomotion in the saddle horse. Acta Anatomica 146, 90-94.
Barrey E, Hermelin M, Vaudelin lL, Poirel D and Vallete J P (1994) Utilisation of an accelerometirc device in equine gait analysis. Equine Veterinary Journal Supplement 17, 7- 12.
Barrey E, Landjerit B, Wo Iter R (199 1) Shock and vibrations during impact of the hoof on different track surfaces. S G B Persson, A Lindholm, L B Jeffcott. Equine Exercise Physiology 3. ICEEP Publications, 97-106.
Benoit P, Barrey E, Regnault J C and Brochet J L ( 1993) Comparison of the damping effect of different shoeing by the measurement of hoof acceleration. Acta Anatomica 146 , 109.
Bowker R M, Linder K, Sonea I. M and Guida L A (1995) Sensory nerve fibres and receptors in equine distal forelimbs and their potential roles in locomotion. Equine Veterinary Journal Supplement. 18, 141-146.
Buchner F, Kastner J, Girtler D and Knezevic P. F (1993) Quantification of hindlimb lameness in the horse. Acta Anatomica 146, 196-199.
Buchner H H F, Savelberg H H, Schamhardt H C, Merkens H W and Barneveld A ( 1994) Kinematics of treadmill versus overground locomotion in horses. The Veterinary Quarterly 1 6, 87-90.
Buchner H H F, Savelbreg H H C M, Schamhardt H C and Barneveld A (1995) Temporal stride patterns in horses with experimentally induced fore- or hindlimb lameness. Equine Veterinary Journal Supplement 18, 161-165.
Cavanagh P R and Williams K R (1982) The effect of stride length variation on oxygen uptake during distance running. Medicine and Science in Sport and Exercise 14, 41-49.
Clayton H M ( l 989a) The effect of acute hoof wall angulation on the stride kinematics of the trotting horse. Equine Veterinary Journal Supplement 9,

2-34
86-90.
Clayton H M (1989b) Time-motion analysis in equestrian sports: The grand prix dressage test. Proceedings of the 35th American Association of Equine Practitioners. 367-73.
Clayton H M 1991 Conditioning Sport Horses. Sport horse publications, Saskatoon,
Clayton H M (1993a) Development of conditioning programs for dressage horses based on time-motion analysis of competitions. Journal of Applied Physiology. 74, 2325-2329.
Clayton H M (1993b) The extended canter: a comparison of some kinematic variables in horses trained for dressage and for racing. Acta Anatomica. 146, 183-187.
Clayton H M (1994) Comparison of the stride kinematics of the collected, working, medium and extended trot in horses. Equine Veterinary Journal 26, 230-4.
Clayton H M (1995) Comparison of the stride kinematics of the collected, medium, and extended walks in horses. American Journal of Veterinary Research 56, 849-52.
Clayton H M (1996a) Instrumentation and techniques in locomotion and lameness. Veterinary Clinics of North America: Equine Practise. New Surgical Techniques and Instrumentation. 12, 337-50.
Clayton H M (1996b) Time-motion analysis of showjumping competitions. Journal of Equine Veterinary Science 16, 262-6.
Clayton H M (1997) Effect of added weight on landing kinematics in jumping horses. Equine Veterinary Journal Supplement 23, 50-53.
Clayton H M, Colbome G E and Bums T E (1995) Kinematic analysis of successful and unsuccessful attempts to clear a water jump. Equine Veterinary Journal Supplement. 18, 166-169.
Clayton H M, Colbome G R, Lanovaz J and Burns T E (1996) Linear kinematics of water jumping in Olympic showjumping horses. Pferdeheilkunde. 12, 657-60.
Clayton H M, Lanovaz J L, Schamhardt H C, Willemen M A and Colbome G.R (1998) Net joint moments and powers in the equine forelimb during the stance phase of the trot. Equine Veterinary Journal 30, 384-389.
Cohen N D, Peloso J G, Mundy G D et al . . (1997) Racing -related factors and results of prerace physical inspection and their association with musculoskeletal injuries incurred in Thoroughbreds during races. Journal of the American Veterinary Medical Association 2 1 1 , 454-463.

2-35
Dalin G, Drevemo S, Fredricson I, Jonsson K and Nilsson G ( 1 973) Ergonomic aspects of locomotor asymmetry in standardbred horses trotting through turns. An investigation with special reference to the fetlock joint, using highspeed cinematography and thermography. Acta Veterinaria Scandinavica -Supplement. 44, 1 1 1 - 1 39.
Dalin G and Ieffcott L B ( 1 985) Locomotion and gait analysis. Veterinary Clinics 0/ North America - Equine Practice. I, 549-572.
Dalin G, Magnusson L E and Thafvelin B C ( 1 985) Retrospective study of hindquarter asymmetry in Standardbred Trotters and its correlation with performance. Equine Veterinary Journal 17, 292-296.
Deguerce C, Dietrich G, Pourcelot P, Denoix J M and Geiger D ( 1996) Threedimensional kinematic technique for evaluation of horse locomotion in outdoor conditions. Medical & Biological Engineering & Computing 34, 249-52.
Deuel N R and Lawerence L ( 1 986) Gallop velocities and limb contact variables in quarter horses. Journal o/Equine Veterinary Science 6, 1 43- 1 50.
Deuel N R and Lawrence L M ( 1987) Kinematics of the equine transverse gallop. Journal o/Equine Veterinary Science 7, 375-382.
Deuel N R and Park J ( 1 989) Temporal characteristics of the extended trot of superior Olympic dressage horses. Eleventh Equine Nutrition and Physiology Symposium 1 1, 1 7- 1 9.
Deuel N R and Park J ( 1 990) Canter lead change kinematics of superior Olympic dressage horses. Equine Veterinary Science 10, 287-98.
Deuel N R and Park J ( 1 993) Gallop kinematics of Olympic three-day event horses. Acta Anatomica 146, 1 68- 1 74.
Drevemo S, Dalin G, Fredricson I and Bjorne K ( 1 980a) Equine Locomotion: 3 . The reproducibility of gait i n standardbred trotters. Equine Veterinary Journal 12, 7 1 -3 .
Drevemo S, Dalin G and Hjerten G ( 1 980b) Equine locomotion: 1 . The analysis of linear and temporal stride characteristics of trotting standardbreds. Equine Veterinary Journal 12, 60-95.
Drevemo S, Fredricson I, Dalin G and Bjorne K ( l 980c) Equine Locomotion: 2. The analysis of coordination between limbs of trotting standardbreds. Equine Veterinary Journal 12, 66-70.
Drevemo S, Fredricson I and Hjerten G ( 1 987) Early development of gait asymmetries in trotting standardbred colts. Equine Veterinary Journal 19, 1 8 1 -9 1 .
Drevemo S, Hjerten G and Johnston C ( 1 994) Drop hammer tests of Scandinavian harness racetracks. Equine Veterinary Journal. Supplement 17,
2-36
35-38 .
Drevemo S and lohnston C ( 1 995) The use of a panning camera technique in equine kinematic analysis. Equine Veterinary Journal. Supplement 1 7, 39-43.
Drevemo S, RoepstorffL, Kallings P and lohnston C ( 1 993) Application of TrackEye in equine locomotion research. Acta Anatomica. 146, 1 3 7- 1 40 .
Ebbeling C B and Clarkson P M ( 1989) Exercise induced muscle damage and adaptions. Sports Medicine 7, 207-234.
Elliott B C and Roberts A D ( 1980) A biomechanical evaluation of the role of fatigue in middle-distance running. Canadan Journal of Applied Sport Science 5, 203-207.
Estberg L, Stover S M, Gardner I A et al . . ( 1 996) Fatal musculoskeletal injuries incurred during racing and training in Thoroughbreds. Journal of the American Veterinary Medical Association 208, 92-96.
Estberg L, Stover S M, Gardner I A et al. . ( 1 998) Relationship between race start characteristics and risk of catastrophic injury in Thoroughbreds: 78 cases ( 1 992). Journal of the American Veterinary Medical Association 212 , 544-549.
Fackelman G E ( 1 973) The nature of tendon damage and its repair. Equine Veterinary Journal 5, 1 4 1 - 149.
Fredricson I and Drevemo S (1 972) Methodological aspects of kinematics of the joints in the forelimbs of fast moving horses. In: A photogrammetic study applying high speed cinematography. Acta Veterinaria Scandinavica 37, 95-1 3 3 .
Fredricson I, Drevemo S , Dalin G, Hjerten G and Bjome K ( 1 980) The application of high-speed cinematography for the quantitative analysis of equine locomotion. Equine Veterinary Journal. 12, 54-59.
Fredricson I, Drevemo S, Moen K, Dandanel l R and Andersson B ( 1 972) A method of three-dimensional analysis of kinematics and co-ordination of equine extremity joints. A photogrammetric approach applying high-speed cinematography. Acta Veterinaria Scandinavica - Supplement. 37, 1 - 1 33 .
Frishberg B A ( 1 983) An analysis of overground and treadmill sprinting. Medicine & Science in Sports & Exercise 15, 478-85 .
Galloux P, Richard N, Dronka T et al. . ( 1 994) Analysis of equine gait using three-dimensional acclerometers fixed to the saddle. Equine Veterinary Journal Supplement 1 7, 44-7.
Girtler D (1 988) Untersuchungen uber die Dauer des Bewegungszyklus bei lahmen und gungsgestorten Pferden in Schritt und Trab. Weiner Tieraerztliche Monatsschrift 7, 1 85- 1 96, 2 1 7-23 1 , 255-270, 3 10-324.

2-37
Gottlieb-Vedi M, Persson S, Erickson H and Korbutiake E ( 1995) Cardiovascular, respiratory and metabolic effects of interval training at VLA4. Journal o/ Veterinary Medicine, Series A 42, 1 65- 1 75.
Hildebrand M ( 1 965) Symmetrical gaits of horses. Science 150, 701 -708.
Hjerten G and Drevemo S ( 1 987) A method to analyse forces and moments in the extremities of the horse during stance phase at the trot. I R Gillespie and N E Robinson. Equine Exercise Physiology 2. Davis, California: ICEEP Publications,
Hjerten G and Drevemo S ( 1 994) Semi-quantitative analysis of hoof-strike in the horse. Journal o/Biomechanics 27, 997- 1 004.
Holderness-Roddam I, 1 991 Practical Eventing. David & Charles Publishers plc, London.
Holmstrom M. 1 994 Quantitative studies on conformation and trotting gaits in the Swedish warmblood riding horse. Swedish University of Agricultural Sciences, Uppsala.
Holmstrom M, Fredricson I and Drevemo S ( 1 993) Biokinematic analysis of the Swedish warmblood riding horse at trot. Equine Veterinary Journal 26, 235-40.
Holmstrom M, Fredricson I and Drevemo S ( 1 994) Biokinematic differences between riding horses judged as good and poor at the trot. Equine Veterinary Journal Supplement 17, 5 1 -6.
leffcott L B ( 1 995) On Course to the Olympics 96- a veterinary view of the Atlanta cup CCI". Journal o/Equine Veterinary Science 15, 497-9.
leffcott L B and Clarke A F ( 1 995) Progress towards Atlanta '96. Thermoregulatory responses during competitive exercise in the performance horse. Volume l . Equine Veterinary Journal. Supplement. 20, 1 64 .
leffcott L B and Clarke A F ( 1 996) Progress towards Atlanta '96. Thermoregulatory responses during competitive exercise in the performance horse. Volume 2. Equine Veterinary Journal. Supplement 22, 1 1 2.
leffcott L B and Hodgson D R ( 1 995) Heat humidity and horses health. Equine Veterinary Journal. Supplement 20, 5-6.
lohnston C, RoepstorffL, Drevemo S and Kallings P ( 1 996) Kinematics of the distal hindlimb during stance phase in the fast trotting standardbred . Equine Veterinary Journal. 28, 263-268.
Iohnston C, RoepstorffL, Drevemo S and Roneus N ( 1 995) Kinematics of the distal forelimb during the stance phase in the fast trotting standardbred. Equine Veterinary Journal Supplement 18, 1 70- 1 74.
Lanovaz I L, Clayton H M, Col borne G R, Schamhardt H C ( 1998) Forelimb
2-38
kinematics and net joint moments during the swing phase of the trot. 5th International Conference on Equine Exercise Physiology. Abstract Booklet. 70.
Leach D ( 1 993) Recommended terminology for researchers in locomotion and biomechanics of quadrupedal animals. Acta Anatomica. 146, 1 30- 1 36.
Leach D H, Ormrod K and Clayton H M ( 1984) Standardised terminology for the description and analysis of equine locomotion. Equine Veterinary Journal. 16, 522-528.
Leach D H and Sprigings E ( 1 979) Gait fatigue in the racing Thoroughbred. Journal of Equine Medicine and Surgery 3, 436-443.
Leng V and Murphy G ( 1 990) Training the event horse. Stanley Pual & Co. Ltd, London.
Loeb, G.E. What the eat's hindl imb tells the eat' s spinal cord. In Bames W, Gladden M, Feedback and motor control in invertebrates and vertebrates. Croom Helm, London, 1 985 : 1 73-86.
MacIlwraith C W Diseases of joints, tendons, ligaments and related structures. In Stashak TS, Adams Lameness in horses. Lea & Febiger, Philadelphia, 1 987:465.
MacIntyre D L, Reid W D and McKenzie D C ( 1 995) Delayed muscle soreness. The inflammatory response to muscle injury and its clinical implications. Sports Medicine 20, 24-40.
MacKay-Smith M P ( 1 977) The burden of the lame horse. Proceedings of the 23rd American Association of Equine Practitioners , 425-427.
Marlin D J, Harris P A, Schroter R C et al . . ( 1 995) Physiological, metabolic and biochemical responses of horses competing in the speed and endurance phase of a CCI*"* 3-day-event . Equine Veterinary Journal Supplement 20, 37-46.
Marteniz-del Campo L J, Kobluk C N, Greer N et al . . ( 1 99 1 ) The use of highspeed videography to generate angle-time and angle-angle diagrams for the study of equine locomotion. Veterinary & Comparative Orthopaedics & Traumatology 4, 1 20- 1 3 1 .
McMiken D F ( 1 983) An energetic basis of equine performance. Equine Veterinary Journal 15, 1 23-33 .
Meij H S and Meij J C P ( 1 980) Functional asymmetry in the motor system of the horse. South African Journal of Science 76, 552-556.
Merkens H W and Schamhardt H C ( 1 988) Distribution of ground reaction forces of the concurrently loaded limbs of the Dutch Warmblood horse at the normal walk. Equine Veterinary Journal 20, 209-2 1 3 .
Merkens H W and Schamhardt H C ( 1 994) Relationships between ground

reaction force patterns and kinematics in the walking and trotting horse. Equine Veterinary Journal. Supplement 17, 67-70.
2-39
Merkens H W, Schamhardt H C, Hartman W and Kersjes A W ( 1 985) Ground reaction force patterns of Dutch warmblood horses at normal walk. Equine Veterinary Journal 18, 207- 14.
Merkens H W, Schamhardt H C, Hartman W and Kersjes A W ( 1 988) The use ofH(orse) INDEX: a method of analysing the ground reaction force patterns of lame and normal-gaited horses at the walk. Equine Veterinary Journal 20, 29-36.
Merkens H.W, Schamhardt H C, Van Osch G .J V M and van den Bogert A I ( 1 993) Ground reaction force patterns of Dutch Warmblood horses at normal trot. Equine Veterinary Journal 25, 1 34-7.
Moore D P, Deuel N R, Drevemo S and van den Bogert A J ( 1995) Kinematic analysis of world championship three day event horses jumping a crosscountry drop fence. Journal of Equine Veterinary Science 15, 527-3 1 .
Munoz A, Santisteban R, Rubio M D, Aguera E I, Escribano B M and Castejon F M ( 1998) Locomotor, cardiocirculatory and metabolic adaptions to training in Andulusian and Anglo-arab horses. Research in Veterinary Science 66, 25-3 1 .
Munoz A, Santisteban R, Rubio M D et al. . ( 1 997) Training as an influential factor on the locomotor pattern in Andulusian horses. Journal of Veterinary Medicine, Series A 44, 473-480.
Murray M P, Spurr G B, Sepic S.B and Gardner G M L A ( 1 985) Treadmill vs. floor walking: kinematics, electromyogram, and heart rate. Journal of Applied Physiology 59, 87-9 1 .
Muybridge E, ( 1 957) Animals in motion. Dover Publications, New York.
Olivier A, Nurton J P and Guthrie A J ( 1 997) An epizoological study of wastage in thoroughbred racehorses in Gautang, South Africa. Journal of the South African Veterinary Association 68, 125- 129.
Peloso J G, Mundy G D and Cohen N D ( 1 990) Prevalence of, and factors associated with musculoskeletal racing injuries of Thoroughbreds. Journal of the American Veterinary Medical Association. 204, 620-626.
Peloso I G, Stick I A, Soutas-Little R W, Caron J C, DeCamp C E and Leach D H ( 1 993) Computer-assisted three-dimensional gait analysis of amphotericin-induced carpal lameness in horses. American Journal of Veterinary Research. 54, 1 535-1 543 .
Persson S G B Evaluation of exercise tolerance and fitness in the performance horse. In Snow D H, Persson S G B, Rose R I, Equine Exercise Physiology. Granta Editions, Cambridge, 1983 :441 -57.
2-40
Pratt G W and O'Connor J T ( 1 976) Force plate studies of equine biomechanics. American Journal of Veterinary Research 37, 1 25 1 - 1 255.
Pratt G W and O'Connor J T ( 1 978) A relationship between gait and breakdown in the horse. American Journal of Veterinary Research 39, 249-253 .
Quddus M A, Kingsbury H B and Rooney J R ( 1 978) A force and motion study of the foreleg of a standard bred trotter. Journal of Equine Medicine and Surgery 2, 233-242.
RatzlaffM H, Grant B D, Rathgeber-Lawerence R and Kunka K L ( 1 995) Stride rates of horses trotting and cantering on a treadmill . Journal of Equine Veterinary Science 15, 279-83 .
Riemersma D J and Lammertink J L M A ( 1 988) Calibration of the mercury-insilastic strain gauge in tendon load experiments. Journal of Biomechanics 21 , 469-476.
Riemersma D J, Schamhardt H C, Hartman W and Lammertink J L M A ( 1988) Kinetics and kinematics of the equine hind limb : in vivo tendon loads and force plate measurements in ponies. American Journal of Veterinary Research 49, 1 344- 13 52.
Riemersma D J, van den Bogert A J, Jansen M 0 and Schamhardt H C ( 1996a) Influence of shoeing on ground reaction forces and tendon strains in the forel imbs of ponies. Equine Veterinary Journal 28, 1 26- 1 32.
Riemersma D J, van den Bogert A J, Jansen M 0 and Schamhardt H C ( 1996b) Tendon strain in the forelimbs as a function of gait and ground charateristics and in vitro loading in ponies. Equine Veterinary Joumal 28, 1 33 - 1 38 .
Rooney JR, 1 969 Biomechanics of lameness in horses. Will iams and Wilkins, Baltimore.
Rooney JR, 1 974 The lame horse: cause, symptoms and treatment. A.S.Barnes, South Brunswick.
Rossdale P D, Hopes R, Digby N J and Offord K ( 1985) Epidemiological study of wastage among racehorses 1982 and 1983 . Veterinary Record 1 16, 66-69.
Rossignol S and Drew. T L Ineractions of segmental and suprasegmental inputs with the spinal pattern generator of locomotion. In Feedback and Motor control in Invertebrates and vertebrates. Croom Helm, London, 1 985 :3 55-77.
Saunders J B D, Inman V T and Eberhart H D ( 1953) The major determinants in normal and pathological gait. The Journal of Bone and Joint Surgery 35-A, 543-558 .
.
Schamhardt H C, Merken H W, Van Osch G J V M ( 199 1 ) Ground reaction force analysis of horses ridden at the walk and trot. S G B Persson, A
Lindholm, L B Jeffcott. Equine Exercise Physiology 3. Uppsala, Sweden: ICEEP Publications, 537-52.
Schamhardt H C and Merkens H W ( 1 987) Quantification of equine ground reaction force patterns. Journal of Biomechanics 20, 443-446.
2-4 1
Seeherman H J ( 199 1 ) The use of high-speed treadmills for lameness and hoof balance evaluations in the horse. Veterinary Clinics of North America -Equine Practice. 7, 27 1 -309.
Seeherman H J, Morris E A, Fackelman G E ( 1987) Computerised force plate determination of equine weightbearing profiles. Gil lespie J R, Robinson N E. Equine exercise physiology 2. Davis: ICEEP publications,
Sloet van Oldruitenborgh-Oosterbaan M M and Barneveld A ( 1 995) Comparison of the workload of Dutch warmblood horses ridden normally and on a treadmill . Veterinary Record 137, 136-9.
Stashak T S, Adam 's Lameness in Horses. Lea & Febiger, Philadelphia, 1 987.
van den Bogert A J ( 1 994) Analysis and simulation of mechanical loads on the human musculoskeletal system, a methodological overview. Exercise and Sport Science Reviews 22, 23-5 1 .
van den Bogert A J ( 1 998) Computer-assisted gait analysis in equine orthopaedic practice: the case for inverse dynamic analysis. Equine Veterinary Journal 30, 362-363.
Wilford J ( 1 997) Making the changes, Keeping things moving. New Zealand Equestrian Federation Bulletin 252, 25-26.
Wilson J H, Howe S B, Jensen R C, Robinson R A ( 1993) Injuries sustained during racing at racetracks in the US . , in 1992. Proceedings of the American Association of Equine Practitioners. 267-8.
Wilson J H, Robinson R A, Jensen R e, McArdle e 1. ( 1996) Equine soft tissue injuries associated with racing descriptive statistics from American racetracks. Rantanen N W, Hauser M L. Dubai international equine symposium. The equine athlete: Tendon, ligament and soft tissue injuries. Dubai : Mathew R Rantanen Design,
Wilson M, Deuel N R, HufTstutler K, Drevemo S and van den Bogert A J ( 1 993) Effects of fatigue on limb contacts of world class endurance horses. 13th EqUine Nutrition & Physiology Sympossium Proceedings , 2 1 1 -2 12.
Winter D A, Biomechanics and motor control of human movement. 2nd edn. Wiley, New York 1990.
Witte H, Lesch C, Presuschoft H and Loitsch e (1 995) Die Gangarten der pferde: Sind schwingungsmechanismen entscheidend? Teil 1 1 : Federschwingungen bestimmen den trab und den gallop. Pferdeheilkunde 1 1, 265-272.

3-42
Chapter 3 General Materials and Methods

3-43
Introduction
Videography is currently the most common method of kinematic analysis in the
horse (Clayton 1 996). For this form of analysis the sequence of events usually
Video recording,
The obtaining of the video footage of the event of interest.
Digitisation,
The process of obtaining the raw co ordinate points from the video
Images.
Transformation,
The process of converting the raw coordinate points into measurements of
known dimension (i .e metres or angles)
Smoothing,
The process of removing measurement noise from the trajectory data.
This is usually performed with a low pass digital filter or with the use of splines.
Normalisation,
The conversion of the trajectory data to a standard scale (usually 1 00
points) so that comparisons can be made between trajectories of different time
scales. And,
Statistical analysis.
The statistical testing of the differences or similarities between the
different measurements.
The event of interest and selection of horses The horses were fi lmed when they were presented for the first and the third
veterinary inspections at the 1 995 New Zealand three Day Horse Trials
Championship, Taupo, New Zealand. At the first or preliminary horse inspection
twenty four horses were presented (23 geldings and 1 mare 1 O.7±2.2 years old).
This data set was used in chapter five to examine the linear and temporal
characteristics of the horse inspection. At the third horse inspection four horses
were not presented, providing a sample of 20 horses presented at both
3-44
inspections. From the third inspection 4 horses were excluded from analysis due
to incomplete footage or poor resolution. This provided a data set of 1 6 horses
with repeat measurements between the first and third inspections. The changes
in gait between inspections were examined in chapter six. For the kinematic
analysis in chapters seven and eight a sample of six horses ( 1 2 .3±2.4 years) with
consistent velocities across inspections (3 .94±O.22m.s·1 and 4. 14±O. 1 5 m.s·1)
were chosen.
Video Recording .
Camera set up:
A minimum of two cameras must be used to capture data simultaneously for three
dimensional analysis. For a converging set-up with two cameras, the optimal angle
of intersection is theoretically 90 degrees (Gosh 1979 cited by Wood and Marshall
1986). The two cameras were a Panasonic MS-4 S-VHS and a Panasonic NVMSIEA1 at 25 frames per second with a 11 1000 second exposure rate. The cameras
were loaded with Panasonic XD S-VHS 180 videotape1 . The cameras were
positioned to provide a simultaneous lateral and anterior view of the horse. The
panning lateral camera was set 1 7.5m perpendicular to the path of the horses. The
anterior camera was positioned to record the trot at a focal distance of 30m.
Camera lens height was set at 1 .2m, approximately at the height of the laveragel
horse's elbow in accordance to the recommendations of Clayton ( 1990).
This experimental set-up was designed to fulfil the following criteria proposed by
Drevemo and 10bnston ( 1995)
1 . The horse fills approximately 75% of the image,
2. Strides recorded simultaneously from a lateral and anterior view,
3 . At least two reference markers appear in each film frame and,
4. Later calculations and compensations for camera angle and perspective errors.
Reference markers
The reference markers were 1 5 fluorescent yellow sports cones ( 142 mm x 230
mm). The cones were placed at l m intervals on the edge of the trot up track closest
1 Panasonic, Matsushita Electrical Industrial Company Ltd, Osaka, Japan

3-45
to the lateral camera. A black line (4mm diameter) was marked to bisect the cone
and to improve the accuracy of cone placement and subsequent calibration. For the
lateral video footage a calibration template was developed from the cone video
footage. This was subsequently overlaid over the horse footage to provide spatial
reference markers from which displacement measurements could be made.
Correction factors were derived to solve the problem of the calibration template not
representing the same sagittal plane as the horse's path of progression. The horses
trotted within a sagittal plane 1 . 1 O±O . 17 m from the edge of the asphalt track closest
to the camera. Therefore the lateral camera had an effective focal distance of
17 . I O±O. I7m (n=25). From the anterior camera only medio-Iateral or transverse
angle measurements were made from the central body reference point to the hoof
and head reference points. The consistency of this technique was verified by a trial
obtaining angle measurements made on a calibration board of known dimensions at
7 sequential sites within the calibration zone. The measurements were made every
2m as identified by the calibration cones in a view progressing from left to right.
The mean error was 0.36±O.29 degrees (0.0 1 to 1 .08 degrees) and indicated that a
parallax effect would not provide a significant source of error in the angle
measurements.
Digitising
Video capture
Analogue video footage was converted to digital images (pICT files) using a IIvx Apple MacIntosh TM2 computer with a RasterOps MediagrabberTMo3 digitising card.
For the pilot study, a complete stride was downloaded as a QuickTimel movie and
from these movies individual frames were obtained. Subsequently, individual
fields were grabbed one at a time as PICT files because of the opportunity for
greater control in image quality.
The faster the video board the faster the video frames can be drawn on the screen.
To capture full frame video at 30 FPS most boards capture only one of two fields
1 Panasonic, Matsushita Electrical Industrial Company Ltd, Osaka, Japan 2 Apple Computers, Inc. I Infinite Loop, Cupertino, California 3 RasterOps Corporation. 890 west 4 1 0 North Lindon Utah. USA
3-46
(odd or even screen lines) in each frame and replicate the data to complete the
frame. This compromises image quality. However, for capturing images at less
than full screen size this compromise is not always necessary. In genera� hardware
compression on the capture board greatly increases movie capture performance.
Video boards that have JPEG compression can usually capture full screen motion
video very effectively.
The faster the hard drive access the faster the computer can read and write to the
hard disk. It is generally recommended that the hard disk has an access time of
lOms or less and a data transfer rate of 3MB per second or more (this data transfer
rate is currently available with 5400rpm drives).
The faster the CPU the faster the computer will be able to process the data
necessary to capture and play back digital video. The ITvx Macintosh computer
used was bel ieved to provide an acceptable level of CPU speed for video capture at
25 fps. To maximise the CPU devoted to the video capture all unnecessary
extensions and control panels should be turned off.
On many computers, the best method is to capture the video directly to RAM.
Capturing to RAM is faster than capturing to a hard disk drive. However, the
movie's size is limited to the amount offree memory. Because only one stride of
interest was captured for analysis, capturing to RAM (30MB of available RAM) did
not impose a direct limitation on the movie size captured. The digitising software
can provide a bottle-neck and therefore a limitation on the captured video image
frames per second. Each second of analogue video contains a large volume of
information. Therefore, in order to record video, some compromise must be made
to bring data volume within range. There are three methods of compromise:
reducing the video speed (frame rate),
reducing the image size (resolution), and
reducing data volume through compression.
Reduction in video speed was not a viable option, as it would cause a limitation to
the variables able to be analysed. The reduction in film speed or the frames per
1 Apple Computers, Inc. 1 Infinite Loop, Cupertino, California
3-47
second digitised would eliminate the possibility of calculating any temporal
measurements and greatly limit the already small number of data points available
for analysis within the strides of interest.
Decreasing the image size greatly reduces the analogue data to be processed. There
exists an inverse relationship between film speed and image size. The reduction in
data to be processed is proportional to the squared sum of the reduction in image
size, i .e 1/4 reduction in image size results in only 1/1 6 of the normal data needing
to be processed.
Compression reduces the amount of data with little compromise to quality and none
to size. But the process of compressing each video frame takes time, and this can
contribute to frame dropping. The RasterOps MoviePak2Tt.4 compression
accelerator can alleviate this problem. The compression accelerator enables full
size video capture at up to 30 fps.
Testing the sampling rate.
For kinematic analysis using cine film it is important to know the actual sampling
rate. Actual sampling rate or film speed can vary depending on a number of
variables from tape tension to individual variation in camera mechanisms. With the
protocol used for the pilot study, actual frame rate of the QuickTime movie could
be influenced by individual computer variables ranging from the processor speed
and hard drive access rate to the available RAM on the digitising card. To test the
actual frame rate captured, a calibration trial was performed. The video was
believed to be captured at the PAL industry standard rate of 25 frames per second.
Ten random sample clips of3 second duration were captured from throughout the
field data video using the software provided with the video digitising card
(RasterOps MediaGrabber™). This was performed on one tape initially to examine
the limitations, if any, imposed on the film capture rate using different frame sizes
and picture quality (Table 3- 1 ). A second trial was performed on each of the four
field data video tapes (Table 3-2). The number of frames per second was calculated
for each clip using the software's inbuilt calibration system. The frames per second
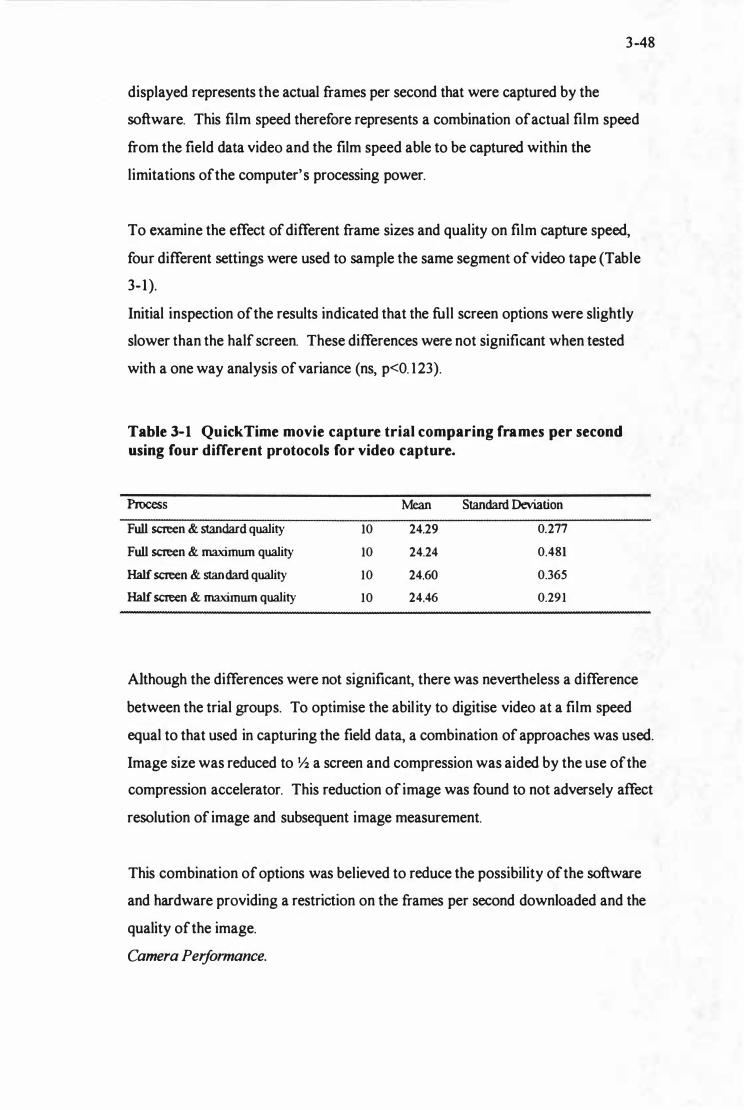
3-48
displayed represents the actual frames per second that were captured by the
software. This film speed therefore represents a combination of actual film speed
from the field data video and the film speed able to be captured within the
limitations of the computer' s processing power.
To examine the effect of different frame sizes and quality on film capture speed,
four different settings were used to sample the same segment of video tape (Table
3- 1 ).
Initial inspection of the results indicated that the full screen options were slightly
slower than the half screen. These differences were not significant when tested
with a one way analysis of variance (ns, p<O. 1 23).
Table 3-1 QuickTime movie capture trial comparing frames per second using four different protocols for video capture.
Process Mean Standard Deviation
Full screen & standard quality 10 24.29 0.277
Full screen & maximwn quality 10 24.24 0.481
Half screen & standard quality 10 24.60 0.365
Half screen & maximwn quality 10 24.46 0.29 1
Although the differences were not significant, there was nevertheless a difference
between the trial groups. To optimise the abil ity to digitise video at a film speed
equal to that used in capturing the field data, a combination of approaches was used.
Image size was reduced to Y2 a screen and compression was aided by the use of the
compression accelerator. This reduction of image was found to not adversely affect
resolution of image and subsequent image measurement.
This combination of options was believed to reduce the possibility of the software
and hardware providing a restriction on the frames per second downloaded and the
quality of the image.
Camera Performance.

3-49
Using this protocol of a Y2 screen image size and use of the onboard video
compression card a comparison was made between the four tapes used to capture
the field data. This trial was performed to quantify any difference in the observed
frame rate between tapes due to differences in tape tension and video camera
mechanisms. However, the greatest contribution to variation in frame rate was
likely to be due to the capacity of the frame grabber.
Table 3-2 Descriptive statistics of captured frame rate (frames per second)
for the four tapes used to capture field data.
Tape Number 1 2 3 4
Camera Type MS-4 MS-l MS-4 MS-l
Mean ± 24.29± 0.28 24.75±<>.24 24.38±<>.34 24.62±<>.26
Standard
deviation (n=10)
Median 24.40 24.75 24.45 24.6
Minimum 23.500 24.400 23. 900 24.200
Maximum 25.500 25.000 25.000 25.000
Start of tape 24. ()()±{). 44 24.86±<>.23 24.50±<>.20 24.4±<>.20
(n=3)
End of tape 24.40±<>.00 24.77±<>.2 1 24.30±<>.26 24.77±<>.25
(n=3)
Across all four tapes the difference in frames per second observed between the start
and finish offilming of the field data did not change significantly (paired t-test
p<0.27). There was also no significant difference between film speed between the
two cameras used in capturing the field data using a Students t-test (24.45±O.3 1 7
fps vs 24.56±O.347 fps, n=20, p<0.30).
The specified and actual film speed are rarely identical in film. The average
captured video speed was 24.5 1±O.33 frames per second representing a 1 .95%
difference between the captured and the original video speed. This level of
variation in video frames speed would be due to variation in the efficiency of the
framegraber digitising card, but did not provide a variation in frame rate dissimilar
to that found by Clayton (1 990), however it was a higher level of variation than that

3-S0
found by Fredricson et al. ( 1972) using cine film [ 1%] and Fredricson et al. ( 1 980)
[0.2%] also using cine film.
Camera and intra tape variation was not a significant source of experimental error
in this study and offered a acceptable level of error within the bounds reported by
other authors examining equine locomotion.
Division of frames into fields
Each video frame is consists of odd and even fields. If the odd and even fields
can be separated it is possible to increase the sampling rate from 25 frames per
second (25hz) to 50 fields per second (50hz). Each video frame was split into its
two composite (odd and even) fields using the single frame advance feature on
the video cassette recorder.
Measurement and Template Development.
The digitising process was performed using Claris DrawT", l . This software
permitted the development of image templates for calibration and the marking of
anatomical reference points. For each field three separate measurements were
made of the co-ordinates, which provided the best trade otT between improved
opportunity of measuring the correct variable and the time required to achieve
this. A worst case test of a poor quality image with pixelation validated this
choice. There were no significant ditTerences of the co-ordinate standard
deviations between 3 , 4 or 5 repeat measurements (ns, p<O.972). Reliability of
template placement was tested by comparison of 3 repeat measurements for each
template. The average variation in marker placement as measured by standard
deviation was 1 . 1±0.8cm. Measurements were made of points and absolute
angles between markers were recorded and subsequently entered in to a
Microsoft Access database2 .
Calibration Templates
From the video of the calibration markers (sport cones), templates were
developed to overlay on to the individual horse images. Fifteen ditTerent
calibration templates were developed to cover the I Sm field of interest when the
1 ClarisDraw, Claris Corporation, 520 1 Patrick Henry Drive, Santa Clara California 2 Microsoft Access 97, Microsoft Corporation, Chicago,USA
3-5 1
horses were within the calibration zone approximately perpendicular to the
panning lateral camera. Thirteen templates were developed to satisfy the criteria
of having one background reference point visible and contain at least two cones.
Two calibration templates were developed for either end of the reference zone
which only contained one calibration marker. Background reference points were
used to cross-reference the calibration templates with the horse field of interest.
The background reference points provided a method of validation for the overlay
process.
Horse specific templates.
The placement of markers on anatomical reference points of the actual horse was
not possible due to filming in a competition environment. The use of templates
to locate reference points for the head, body and each hoof enabled identification
of a feature of interest for digitising without using markers on each horse.
Lateral view templates
For the lateral view, templates were made to define a central head reference
point, a body marker representative of the stationary centre of mass of the torso
and a marker defining the centre of each hoof All of the reference points
identified by the lateral template also had to satisfy the criteria of being a point
that could be referenced from the anterior view. All lateral templates were
created from the field when the horse was at mid stance of the stride, when the
left forelimb was perpendicular to the ground reference plane. Figure 3 . 1 shows
the application of the lateral body markers.
Lateral head marker template: To measure the excursions of the head, l imbs and
trunk, reference points were defined. The head marker template was designed to
identify a site representative of the mid point of a straight line drawn from the
poll (summit of nuchal or occipital crest) to the tip of the upper lip along the
check strap of the bridle. The check strap was used as a reference point because
it was a consistent line irrespective of head orientation. An outline of the head
was combined with the reference marker to improve the repeatability of template
placement.

3 -52
Lateral body template : The lateral body template was developed to be
representative of the site of the stationary centre of mass of the horse torso
(Sprigings and Leach 1 986; van den Bogert 1 989). In this study, the point used
was a location that bisected a line drawn from the point of the withers to the base
of the sternum. The X axis location was the point 1 /3 the distance from the point
of shoulder (cranial part of greater tuberosity of humerus) to the point of buttock
(tuber ischi i) . An outline of the torso was combined with the reference grid to
enable consistent placement. The outline was aligned with the withers (spinous
processes of 3rd to 8th thoracic vertebrae) as this rigid structure consistently
maintained its shape throughout the stride cycle.
Hcrse A . 1 6HH Breoo. 1b Age. 8 yrs
Figure 3-1 Diagram of horse with overlaying of body, head, hoof reference
templates
Lateral hoof template: An outline was drawn of the perimeter of each hoof. The
purpose of the outline was to improve the accuracy of the template placement
and define the sites to be used in locating the hoof. The lateral hoof template
defined the node as the mid point of a proximal to distal l ine from the top of the
coronet band to the ground surface of the hoof, at a site that bisected a line from
the point of toe to the bulb of the heel.
Anterior templates.
3-53
The anterior view templates were developed to provide reference points for the
measurement of the angles from the central body reference point to the head and
hoof reference points. The subsequently derived angle measurements provided
information of the transverse displacement during a stride cycle.
Anterior view head template : The head reference point for the anterior view was
obtained by equal bisection of a proximal-distal line running through a plane
equidistant between the horse ' s eyes. An outline of the head was combined with
the reference grid to improve placement in a similar manner as was used with the
l ateral templates.
Anterior view body template : The anterior view body template was obtained by
first defining the width of the horse at the level of the sternum. The most dorsal
part of the withers were then identified and a transverse line equal in length to
the width of the horse as defined earl ier was drawn. The mid point of the trunk
was then identified by drawing two lines that joined the opposite ends of each
line to form a cross identifying the mid point between the withers and the
sternum.
Anterior view hoof template: This was constructed in a method similar to the lateral
template. Initial ly an outline was drawn of the hoof and then the hoofwas
bisected vertical ly from the highest point of the coronary band to the ground
surface of the hoof at a point defined as the bisection of the width of the ground
surface.
Transformation
The use of cinematographic or videographic data for analysis and interpretation of
equine locomotion suffers from a number of l imitations. The inability for the
ground reference markers to be within the same sagittal plane as the horse reference
plane requires the use of a calibration factor to correct for the associated error.
Typically, calculation of spatial measurements have been derived from the l imb
movement and the ground reference markers. This result is then corrected for
perspective error utilising a previously calculated calibration factor (Fredricson et al 1 972, Drevemo and Johnston 1 995).
The data points and angles obtained by digitising within ClarisDraw™ were
entered into a MS Access™ database. Queries were then run to extract the data
into MS Excel™ for transformation. Transformation of the data as defined
below was performed using a customised macro within Excel . Data integrity
was checked by plotting the raw digitising co-ordinates within Excel. Data
points on the plot that appeared unusual in comparison to their neighbours were
then checked against the original input values.
Correction factor derivation
Perspective errors were estimated by the use of a specially prepared 1 m x 1 m free
standing square of plywood. The outer 1 5cm of the perimeter was painted black to
provide a sharp contrast. The calibration board was passed through the field of
view mimicking the previous path of the horses. This was performed for the lateral
and anterior view cameras.
The horses and the calibration board passed through a medial plane 1 . 1 0±0. 1 7m
from the ground reference marker medial plane. This variability in the distance
between the horse reference plane from the ground reference plane was similar to
that of other field trials (Moore et al. 1 995).
The effect of parallax error on measurements was quantified by a test using five
images containing a view of three sport cones and the 1 m x 1 m calibration board.
The calibration board was positioned 1 . 1 Om behind the cones to mimic the plane of
progression of the horses. The use offive images ensured the trial examined the
effect of parallax error across the full calibration zone. Measurements were taken
on the height of the sports cones and the width of the calibration board.
Transformation was only performed using correction factors calculated from the
known height of the sport cones. The results of this trial can be seen in Table 3 . 3
(refer appendix).
The effect of perspective error can be observed from the results in Table 3 .3 . In
both the X and Y axes the calibration factor calculated from the height of the
ground reference markers (yellow sport cones) were underestimating values for the
calibration board dimensions with an error of 1 1 .D4±2.2001o in the X axis and
- -- -- - --------
3-55
1 O. 99± 1 . 87% in the Y axis. These large error values were obtained even though
there was only a small coefficient of variation associated with the measurement of
the height of the sport cones. The large percentage error observed was believed to
be due to the cones and the calibration board being in different medial planes and
the extrapolating from a small measurement on which the correction factor was
based. The trial also identified that the effect of the parallax error increased with
the increasing focal distance between the camera and the calibration board when the
board was at either end of the calibration zone. Because of these sources of error,
correction factors were subsequently derived by calibrating the 1 m distance
between the sport cones and the calibration board. For each l m distance between
cones three measurements were taken. These measurements were then averaged
and the mean measurement was used for the calculation of the correction factors for
both the X and Y axis. A low pass Butterworth digital filter ( 1 5Hz) (Winter 1 990)
in the numerical differentiation software QuickSAND ver006 (Walker 1 997) was
used to smooth the correction factors. Smoothing was performed to reduce the
random error bias in the correction factors. Smoothing was not performed on the
raw measurements because of the low variance observed in the measurements
between cones (Table 3 .4).
The inability to accurately determine the focal distance for the anterior camera
l imited the spatial information that this view could provide. Length measurements
could not be made from this view. However an acceptable level of precision was
possibly with the angle measurements. Parallax error was not found to contribute to
distortion of the angle measurements in the anterior view
Smoothing
As part of the digitising process, small errors have the effect o f creating "noise"
in the signal. Noise has little effect on trajectory data but becomes increasingly
important with time derivatives such as velocity and acceleration. An example
from (Bartlett 1 997) demonstrated that a 1% level of noise as measured as an
amplitude of the signal in the raw data (r=2sin2t + 0.02sin20t) became a noise
amplitude of 1 0% in the velocity (v = 4 cos2t + 0.4cos2Ot).

3 -56
For equine kinematic data a low pass digital filter is generally recommended with
a cut-off frequency of 1 0 to 1 5Hz (Clayton 1 996). In this study, raw data was
initially subjected to a Fourier series analysis. This was performed to provide an
understanding of the underlying frequency spectrum of the raw data. As with
human kinematic data, the signal of interest was low frequency with the noise
being found at the higher frequencies. A generalised cross-validated quintic
spline (Woltring 1 986) was used to smooth the raw trajectory data. This was
performed within the QuickSAND numerical differentiation software (Walker
1 997). A quintic rather than cubic spline was used because of the ability to
achieve better endpoint with first and second derivatives (Wood and Jennings
1 979).
Normalisation
Normalisation enables comparison between strides of different durations and
permits the construction of mean curves for a number of strides. Normalisation
was achieved by the use of interpolation routine within QuickSAND after
smoothing the data using the generalised cross-validation quintic spl ine routine.
All trajectory data were normalised to 1 00 data points from the initiation of
stance phase. After normalisation, average trajectory curves were produced for
the three separate measurements on the segment trajectories. From this
normalised data, velocity and acceleration were derived using QuickSAND.
Reconstruction of the lateral and cranio-caud al v iew
trajectories.
Trajectories from the two views were combined to provide multiplanar
displacement, velocity and acceleration data in the x, y and z axis after
normalisation. Because of the nature of the filming set up, the two cameras were
not synchronised. This may provide a potential source of temporal error in
combining trajectories from the two cameras. This absolute difference in timing
could be as large as 6 .8%. It is believed that this potential error is primarily a
product of the low sampling rate (50Hz) and that a camera synchronising
mechanism would not contribute significantly to any reduction in the maximum
3 -57
potential temporal error associated with combining trajectory data from the two
camera sources.
Time motion analysis Time motion analysis examines the time spent on an activity and the type or
intensity of the activity. The panning lateral camera recorded the complete
preliminary horse inspection procedure. This provided the opportunity to
perform a time motion analysis by quantifying the time spent on each of the
activities that are components of the horse inspection. Temporal data was
obtained by recording the time spent on each activity from the timing display on
the video cassette recorder.
Statistical a nalysis
Statistical analysis was performed using the statistical software SPSSTM 1 . For
comparisons of paired data a paired t-test was performed. For multiple
comparison of related data, a repeated measures general l inear model was used
with a post hoc comparison.
To compare the regression equations between inspection days for the relationship
between stride length and velocity, a mixed model regression procedure was
used. This model used the SPS S based macro ofHedeker et al. ( 1994).
With any kinematic study caution should be used when interpreting the statistical
significance of differences in temporal measurements. In this study the sampling
rate was 50Hz. This provided an effective window for sampling of 0 .02 second.
Differences between categories that are less than this value should then be treated
with caution as this involves interpreting differences in measurements that occur
at a higher resolution than achieved with direct measurement.
1 SPSS Inc., Chicago, Illinois
References
Bartlett R, Introduction to sports biomechanics. E & F N Spon, London, 1 997:
Clayton.H.M. ( 1 990) Gait evaluation: Making the most of your home video
system. Proceedings of the 3(/h American Association of Equine
Practitioners. 447-55 .
Clayton H M ( 1996) Instrumentation and techniques i n locomotion and
lameness. Veterinary Clinics of North America: Equine Practise. New
Surgical Techniques and Instrumentation. 12, 337-50.
Drevemo S and Johnston C ( 1 995) The use ofa panning camera technique in
equine kinematic analysis. Equine Veterinary Journal. Supplement 17, 39-
43 .
Fredricson I, Drevemo S, Dalin G, Hjerten G and Bjorne K. ( 1 980) The
application of high-speed cinematography for the quantitative analysis of
equine locomotion. Equine Veterinary Journal. 12, 54-59.
Fredricson I, Drevemo S, Moen K, Dandanell R and Andersson B ( 1972) A
method of three-dimensional analysis of kinematics and co-ordination of
equine extremity joints. A photogrammetric approach applying high-speed
cinematography. Acta Veterinaria Scandinavica Supplement. 37, 1 - 1 3 3 .
Hedeker D , Gibbons R D and Flay B R ( 1 994) Random effects regression models
for clustered data with an example from smoking prevention research.
Journal of Consulting and Clinical Psychology 62, 757-765.
Moore D. P. , Deuel N. R, Drevemo S .and van den Bogert A. J ( 1 995) Kinematic
analysis of world championship three day event horses jumping a cross
country drop fence. Journal of Equine Veterinary Science 15, 527-3 l .
Sprigings E J and Leach D H ( 1986) Standardised technique for determining the
centre of gravity of body and limb segments of horses. Equine Veterinary
3-59
Journal 18, 43-49.
van den Bogert A 1. Computer simulation of locomotion in the horse. PhD.
Thesis . University of Utrecht, 1 989.
Walker J A. QuickSAND. Quick smoothing and numerical differentiation for the
Power Macintosh. version 006. 1 997.
Winter D A. Biomechanics and motor control of human movement. 2nd edn.
Wiley, New York, 1 990:
Woltring H J ( 1 986) A fortran package for generalized, cross-validatory spline
smoothing and differentiation. Advances in Engineering Software 8, 1 04- 1 07.
Wood G A and Jennings L ( 1 979) On the use of spline functions for data
smoothing. Journal of Biomechanics 12, 477-9.
Wood G A and Marshall R N ( 1 986) The accuracy ofDLT extrapolation in
three-dimensional fi lm analysis. Journal of Biomechanics 19, 78 1 -785.

3-60
Materials and Methods Appendix
Table 3-3 Calibration trial using a Im x I m calibration board passed within the horses plane of progression. The five frames were evenly spaced across the calibration zone. Measurements are in points.
Frame 1
Cone height Board width Board height Calibration Error (%) of actual board
Left cone
Middle
cone
Right cone
Mean
(pt) (pt) (x axis) (pt) (y Axis) factor measurement
width
23.1
23. 1
22.9
23.03±<.l.l 1
Frame 2
87.4
87.4
87.4
87±O.OO
88.44
88.44
88.44
88.44±O.OO
9.95
9.95
10.04
9. 98±O.05
Board width
12.97
12.97
12.21
12 .72±O.43
board height
1 1.94
1 1.94
1 1. 17
1 1.68±O.44
Cone height Board width Board height Calibration Error (1'10) of actual board (Pt) (pt) (x axis) (Pt) (y Axis) factor measurement
Left cone 23.9
Middle 23.9
cone
Right cone 22.9
Mean 23.56±O.57
Frame3
92.42
92.46
92.46
92.44±O.02
92.46
92.46
92.46
92.46±O.OO
width
9.62
9.62
10.04
9.76±O.24
Board width
1 1 .06
1 1 .06
7. 13
9.74±2.25
Board height
1 1.06
1 1.06
7. 1 3
9.73±2.24
Cone height Board width Board height Calibration Error (%) of actual board
Left cone
Middle
cone
Right cone
Mean
(pt) (pt) (x axis) (Pt) (y Axis) factor measurement
width
Board width
24.9 93.37 93.39 9.23 1 3.75
23 . 1 93.39 93.34 9.95 7.01
23.9 93.39 93.39 9.62 1 1.08
23.96±O.90 93.38±O.01 93.37±O.02 9.60±0.36 1O.62±3.39
Frame 4
Board height
1 3.73
7.01
10. 12
10.29±3.36
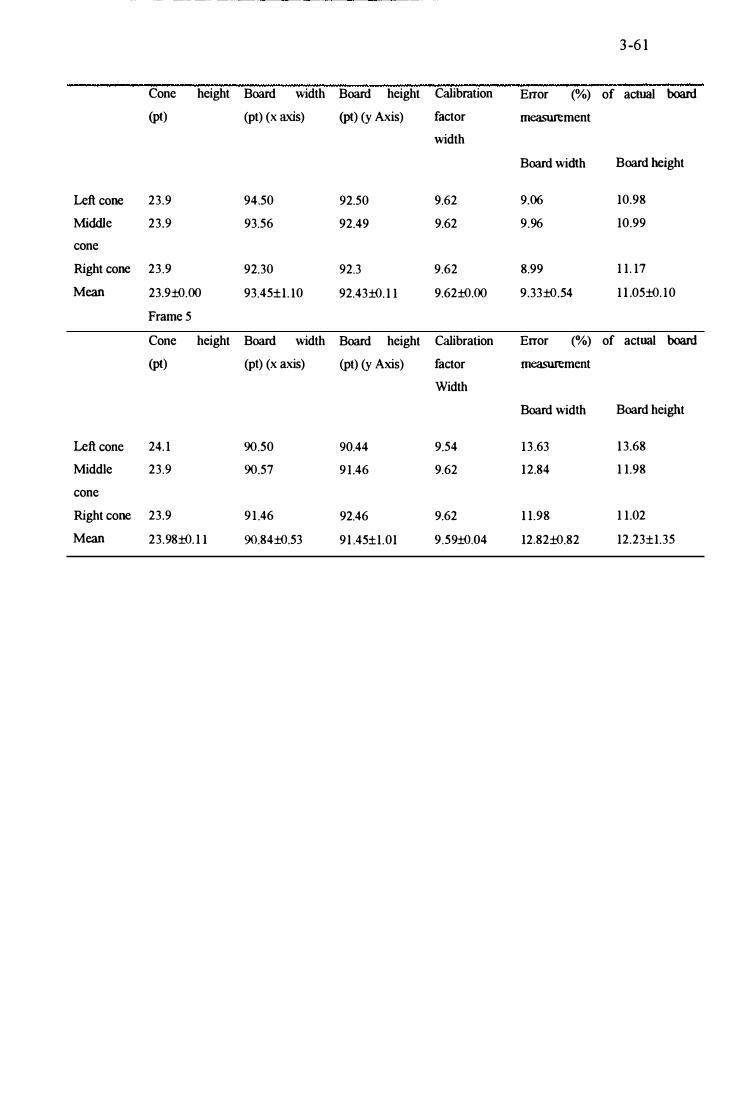
- � -
3 -6 1
Cone height Board width Board height Calibration Error (%) of actual board (pt) (pt) (x axis) (pt) (y Axis) factor measurement
width
Board width Board height
Left cone 23.9 94.50 92.50 9.62 9.06 10.98
Middle 23.9 93.56 92.49 9.62 9.96 10.99
cone
Right cone 23.9 92.30 92.3 9.62 8.99 1 1. 17
Mean 23.9±O.OO 93.45±1. l0 92.43±O. 1 l 9.62±O.OO 9.33±O.54 1 l .O5±O. 10
Frame 5
Cone height Board width Board height Calibration Error (%) of actual board (pt) (pt) (x axis) (Pt) (y Axis) factor measurement
Width
Board width Board height
Left cone 24. 1 90.50 90.44 9.54 13 .63 1 3.68
Middle 23.9 90.57 9 1.46 9.62 12.84 1 1.98
cone
Right cone 23.9 9 1 .46 92.46 9.62 1 1.98 1 1.02
Mean 23.98±O. 1 l 9O.84±O.53 91 .45±1.01 9.59±O.O4 12.82±O.82 12.23±1.35
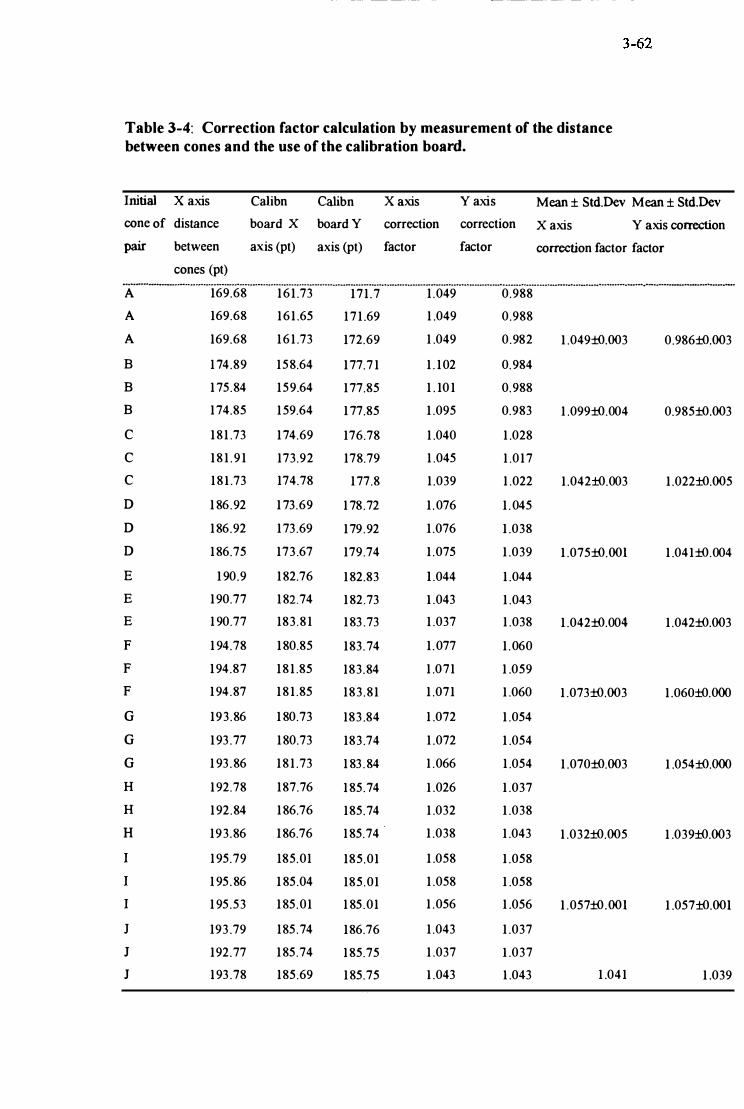
------ - - - - -� - -
Table 3-4: Correction factor calculation by measurement of the distance between cones and the use of the calibration board.
Initial X axis Calibn Calibn X axis Y axis Mean ± Std.Dev Mean ± Std.Dev
cone of distance board X board Y correction correction X axis Y axis correction
pair between axis (pt) axis (Pt) factor factor correction factor factor
cones (pt) ._ ...... __ ............. _ ..... _,. .. .,., .......................................................................................................................... ., .................... "' ........ " .............. ., .... -.................................................................................................. ., ............................................ _ .. --.. -.... -...... __ .............................. _.
A 169.68 161 .73 171 .7 1 .049 0.988
A 169.68 161 .65 17 1 .69 1 .049 0.988
A 169.68 16 1 .73 172.69 1 .049 0.982 1 .049±O.OO3 0.986±O.OO3
B 1 74.89 158.64 177.7 1 1 . 102 0.984
B 1 75.84 159.64 177.85 1 . 10 1 0.988
B 174.85 1 59.64 1 77.85 1 .095 0.983 1 .099±O.004 0.985±O.OO3
C 181 .73 174.69 176.78 1 .040 1 .028
C 18 1 . 9 1 173.92 178.79 1 .045 1 .017
C 18 l .73 174.78 177.8 1 .039 1 .022 1 .042±O.003 1 .022±O.OO5
D 1 86.92 1 73.69 1 78.72 1 .076 1 . 045
D 1 86.92 173.69 179.92 1 .076 1 .038
D 1 86.75 173 .67 179.74 1 .075 1 .039 1 .075±O.OOI 1 .041±O.004
E 1 90.9 1 82.76 182.83 l .044 1 .044
E 190.77 182.74 182.73 l .043 1 .043
E 1 90.77 183.8 1 1 83 .73 1 .037 1 .038 1 .042±O.004 1 .042±O.OO3
F 1 94.78 180.85 183.74 1 .077 1 .060
F 194.87 18 1 .85 183.84 1 .071 1 .059
F 194.87 18 1 .85 183 .81 1 .071 1 .060 1 .073±O.OO3 1 .060±O.OOO
G 193 .86 1 80.73 183 .84 1 .072 1 .054
G 1 93 .77 180.73 183 .74 1 .072 1 .054
G 1 93 .86 18 1 . 73 1 83 .84 1 .066 1 .054 1 .070±O.OO3 1 .054±O.OOO
H 192.78 187.76 185.74 l .026 1 .037
H 192.84 186.76 185.74 1 .032 1 .038
H 193 .86 186.76 185.74 1 .038 1 .043 1 .032±O.OO5 1 .039±O.OO3
I 1 95.79 185.01 185.01 1 .058 1 .058
I 1 95 .86 1 85.04 185.01 1 .058 1 .058
I 1 95 .53 1 85.01 1 85 .01 1 .056 1 .056 1 .057±O.OOI 1 .057±O.OOl
J 193 .79 185 .74 186.76 1 .043 1 .037
J 192.77 185.74 185.75 1 .037 l .037
J 1 93 .78 185.69 185.75 l .043 l .043 1 .041 1 .039
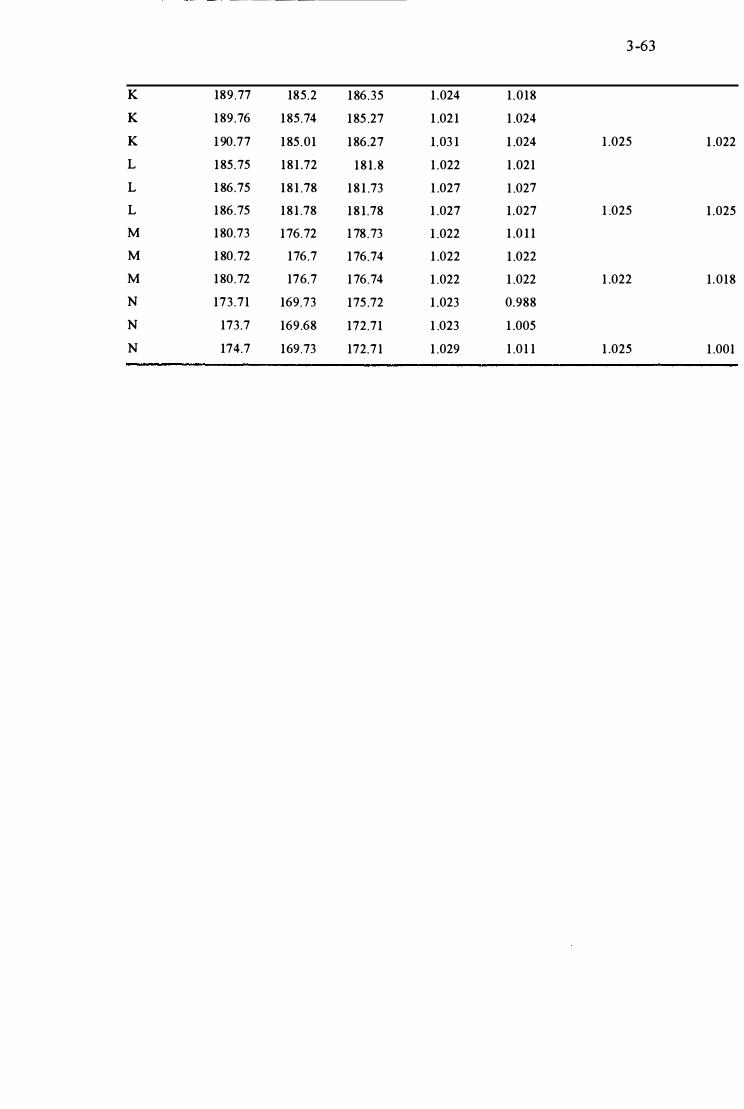
-
K
K
K
L
L
L
M
M
M
N
N
N
---- - -�� -
189.77 185.2
1 89.76 185.74
1 90.77 185 .01
1 85.75 18 1 .72
1 86.75 18 1 .78
186.75 18 1 .78
180.73 176.72
1 80.72 176.7
1 80.72 176.7
173 .71 169.73
173.7 169.68
174.7 169.73
3 -63
1 86.35 1 .024 1 .018
1 85 .27 1 .02 1 1 .024
186.27 1 .03 1 1 .024 1 .025 1 .022
18 1 .8 1 .022 1 .021
1 8 1 .73 1 .027 1 .027
1 8 1 .78 1 .027 1 .027 1 .025 1 .025
1 78.73 1 .022 1 .0 1 1
176.74 1 .022 1 .022
176.74 1 .022 1 .022 1 .022 1 .018
175 .72 1 .023 0.988
172.71 1 .023 1 .005
172.7 1 1 .029 1 .0 1 1 1 .025 1 .001

4-64
Chapter 4 Time Motion Analysis of the prel imina ry h orse i nspection at a CCI··· three day horse trials event
---- �-���������- - - -- -
4-65
Abstract The aim was to identify factors that influence the examination procedure of the
preliminary horse inspection at a CCI** * three-day event Time motion analysis
was performed on the preliminary horse inspection of the 26 horses entered in
the CCI* * * class at the 1 995 National Three Day Horse Trials Championships,
Taupo, New Zealand. Performance was analysed according to the time spent on
an activity and the type or intensity of the activity. Two distinct approaches were
used for the inspection. One third of the class (group B) opted to walk rather
than trot their horses past the judge' s panel on the final section of the return run.
Group A spent a longer time at the initial walk (4.36±O. 94s vs.3 . 53±O.9 1 s,
p<O .Ol), but spent less time during the stationary inspection (8.77±2. 1 6s vs.
1O .43±2.90s, p<O.05) and, for the total time (42.04±2.50s vs. 45 .34±3 .38s,
p<O.O l ). For group B a relationship was found between initial walk and the time
spent at the stationary inspection (r2::::;O.249, p<O.O l ). The results demonstrate
that the initial impression gained as the horse is walked toward the veterinary
panel significantly influences the subsequent inspection. The optimal strategy
for both the inspection panel and competitors is to present the horse in a relaxed
manner.
Introduction
Three-day eventing is a multidiscipline sport that includes dressage, speed and
endurance, and show jumping tests. Integral parts of the competition are the
horse inspections. Three horse inspections are performed. The first inspection is
on day one prior to the dressage. The second inspection takes place on day two
4-66
at the end of phase C just prior to the cross country and a third inspection is
performed on the morning of the show jumping. Both the first and third horse
inspections are performed with the horses trotted up on an asphalt surface.
Equine exercise physiologists have studied on the event horse's ability to
perform in a high humidity climate (Jones and Carlson 1 995 ; Jeffcott 1 995;
White 1 996), but little has been documented about the horse inspection procedure
(Wilford 1 997). This is surprising, as the result of the horse inspection
determines whether the horse may proceed in the competition.
Time-motion analysis is used to analyse the integral activity components and
energetic requirements of an activity. It has been successfuJly applied to a
variety of sports, including more recently to equestrian sport (Clayton 1 989;
Clayton 1 993 ; Clayton 1 996). Performance is analyzed according to the time
spent on an activity and the type or intensity of the activity. From this activity
intensity and time budget information, competition specific conditioning and
preparation regimes can be developed to maximize performance. Time motion
analysis of the horse inspection has the potential to provide improved
understanding of the inspection procedure in three day eventing. It may help
riders better present their horses and improve the public's understanding of this
integral component of the three day event.
This chapter performs a time motion analysis of the preliminary (first) horse
inspection at a national level (CCI* **) three day event.
4-67
Materials and Methods All 26 horses entered in the CCI* ** class of the 1 995 National Three Day Horse
Trials Championships, Taupo, New Zealand were filmed at the initial horse
i nspection. The horses were led ' in-hand' at the trot by their regular riders on a
specially prepared asphalt surface.
The horses were Thoroughbreds or Thoroughbred somatotype (Thoroughbred
cross) with a mean age of 1O.7±2.2 years of Advanced grade having previously
gained the qualification as defined by the Federation Equestre Intemationale (FEI)
for CCI** * level competitions (Anon 1 993). A panning video camera (50 Hz)1 was
used to film the horses from a lateral view (Drevemo and Johnston 1 995). The
camera was placed 1 7.5m perpendicular to the horse' s line of progression with a
lens height of 1 .2 m, in accordance with previous recommendations (Clayton 1 990).
Each video frame was split into its 2 composite (odd and even) fields. This
increased the sampling rate from 25 frames per second to 50 fields per second.
Time measurements were made by counting the fields from the video footage with
the aid of a video cassette recorder2 and a Macintosh TM computer3 equipped with a
video digitizing card 4 . . Stride lengths were calculated by copying across selected
images for each horse in to Claris Draw TM 1 and measuring the distance between
successive footfalls using the previously derived calibration templates. Velocity
was calculated from known stride length measurements. Reference markers
consisted of 1 5 fluorescent yellow sports cones ( l42mm x 230mm), placed I m
equidistant within the previous path of the horses. From this footage ground
1 Panasonic MS-4, Matsushita Electrical Industrial Company Itd, Osaka, Japan 2 Panasonic NV -FS88 HQ, Matsushita Electrical Industrial Company ltd, Osak� Japan 3 Apple Computer, Inc. 1 Infinite Loop, Cupertino, California 4 RasterOps Corporation. 890 west 410 North Lindon Utah. USA
4-68
reference templates were developed which were overlaid on the horse footage to
provide reference points for length measurements. A l m x I m calibration board
was used to derive equations to correct for differences in focal distance. Data were
analysed using student' s t-test and least squares regression analysis with the
statistical software SPSSTM 7.52 .
Results The inspection consisted of 6 or 7 separate stages depending on the strategy
taken. These stages consisted of 3 separate activities, halt; walking and trotting.
The horses walked to a stationary halt where the veterinary panel inspected the
horse. The horse was then lead first at the walk and then at the trot, away from
the panel. The horses were brought back to a walk and turned around in a
clockwise direction to walk and then trot back towards the panel . Two strategies
were used by the riders for presentation of their horses. Once parallel to the
judges, some of the horses (Group A, Figure 1 ) continued trotting to the end of
the track and were led away, while others were brought back to a walk to the end
of the inspection track (Group B, Figure 4- 1) .
High coefficients of variation were found for all individual activities during the
horse inspection. Coefficients of variation averaged across activities around
20%, the exception being the final walk with a coefficient of 1 93%. However, in
spite of the high variation for individual phases of the presentation, the
coefficient of variation for the total duration taken for presentation was only
7 .6%.
I Claris Corporation, 5201 Patrick Henry Drive, Santa Clara, California 2 SPSS Inc., Chicago, Illinois

-- -- ------------- - --
Table 4-1 Descriptive statistics of time horses spent in the different phases of activity at the CCI*** Veterinary inspection (n=26).
Activity Mean Time (s) Standard deviation Coefficient of variation
Walk 4. 1 1 0 .99 24. 1 8 Halt 9.26 2 .47 26.69 Walk 5.45 1 .3 1 24.04 Trot 7.31 1 . 1 2 1 5. 39 Walk & turn 6.44 1 .31 20.36 around Trot 9.40 1 . 39 1 4.79 Walk (Group 1 . 1 4 2 .21 1 93 .55 B,n=8) Total Time 43 1 4 3 .30 7.65
S ignificant differences were found between the two groups. Group A took
longer for the initial walk segment but took less total time for the inspection
(p<O.O l) . Group B took longer for the stationary inspection (p<0.05). No
significant difference was found between groups for the other activities. Least
squares regression analysis revealed a significant but weak relationship between
time taken for the initial walk and the time for the stationary halt (R2=0.249,
p<O.O l ).
Table 4-2 Time differences between the various activities, compared by t-test between 2 groups differing in gait during the final part of the inspection
Activity Group A (s) Group B (s) significance
n=(18) n=(8) level
pre walk 4 .36 ±O.94 3 . 53± 0 .91 p<O.OI
halt 8 .77 ± 2. 1 6 10.43 ± 2.90 p<O.05
walk 5 . 1 7 ± 1 .4 1 5 .39 ± 1 .22 n.s
trot 7 . 1 6 ± 1 . 1 1 7 .66 ± 1 .23 n.s
turn around 6.6 1 ± 1 .29 6 .03 ± 1 . 34 n.s
trot 9.64 ± 1 . 26 8 . 8 1 ± 1 . 59 n.s
Total 42.04 ± 2.50 45.34 ± 3 . 38 p<O.OI
Values are mean and standard deviation
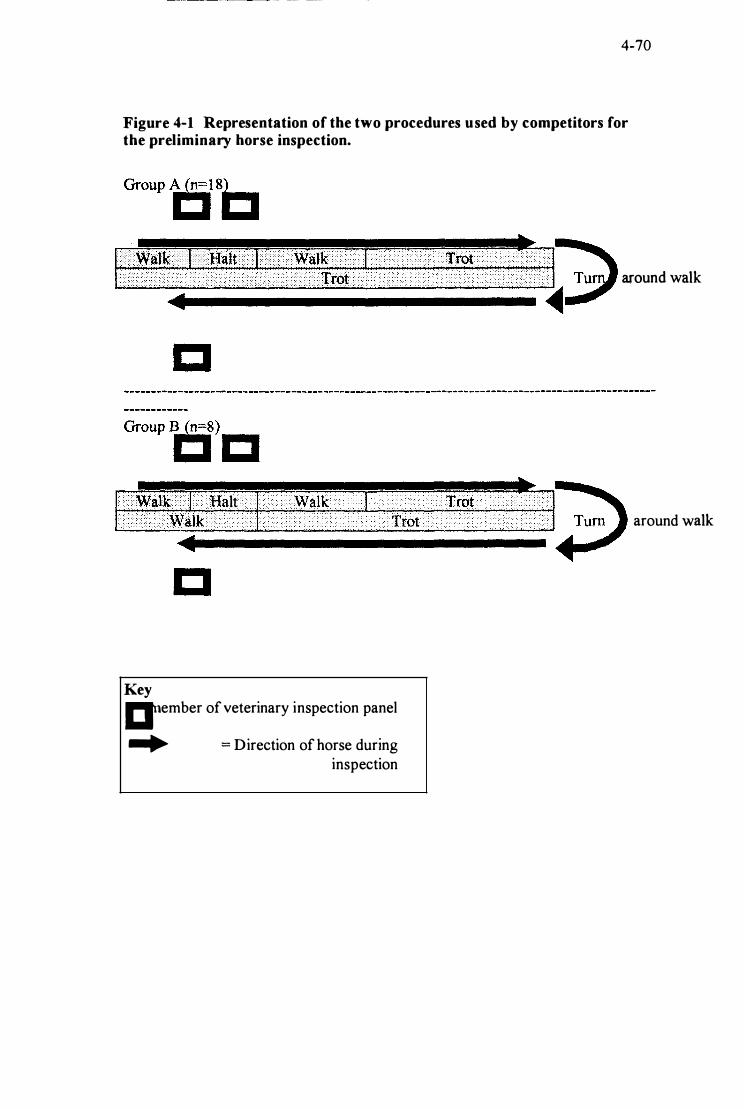
4-70
Figure 4-1 Representation of the two procedures used by competitors for the preliminary horse inspection .
• • • • • Walk • • • • • • I • • • • ·• �att ••• • ·.I�.... . HHWalk · •••• I>: •.. : .: .: .•.. .. i n / lrot + �.. ,!I� n y n n n )Y c H H Trot . . ·· : : : · : . >0 � Tu around walk . �
"""I ..... . _� .... a_lk .... w .... a;.:.;;;llk.;;;;· ....... H .... a .... lt .... ·: ..;;Ji ............ ·• . ..... .... w
�
al .... k�..;;,. . .;;;;1 �.;;:;.T.;;,;:;ro.;;;;t� .... T .... ro .... t��..;;,. •• �..;;,.T ;;.w.;.;.;J1� around walk . �
Key �ember of veterinary inspection panel
.... = Direction of horse during inspection
Discussion
The New Zealand Equestrian Federation rule book states that "The horse must be
inspected in hand, at rest and in movement on a firm level and clean surface
(Anon 1 993). This definition of the horse inspection at the three-day event is
open to different interpretations. The lack of constraints provided in the
requirement was reflected in the highly variable times seen for all activities.
The two distinct strategies used did not differ in format until the return trot
period when some competitors brought their horses to a walk when parallel to the
panel (Group B) rather than continue trotting to the end of the inspection track
(Group A). The lowest coefficient of variation (7 .65%) was for the total time
taken for the inspection (43 . 14±3 . 30s). That this variation was lower than
variation in any of the internal components implies that irrespective of the
strategy, total time appeared to converge towards a constant.
S ignificant differences (p<O.05) were found in the time taken for the activities of
pre-walk, halt and total time between the groups. Horses that walked at the end
of the horse inspection (Group B) took less time to arrive at the halt but were
stationary at the halt for a longer period of time than horses that continued
trotting at the end of the inspection. The longer time period at the halt
contributed to the horses in Group B taking a longer time overall for the horse
inspection. During the halt, it is the horse inspection panel that dictates the
length of time a horse is stationary. That the panel inspected these horses for a
longer period when stationary may have created doubt in a handler's mind as to
the horse's ability to pass the inspection. This may have lead to handlers
walking their horses past the panel in case a second trot-up was requested.
During the preliminary inspection this only occurred with one horse. Regression
analysis identified a weak but significant relationship (R2:::-0 .25, p<O.O I )
between the time for the initial walk and the time at the stationary inspection.
Horses that were hurried forward to the judge' s panel had an increased chance of
a longer stationary inspection. Such horses perhaps appear rushed and not
4-72
relaxed. A tense and uneven horse may require the judge' s panel to spend more
time at the stationary inspection to thoroughly assess the horse.
The activities during the horse inspection are low intensity (maximum velocity
4 .9m.s·1 ; 3 . 8 1±O.40m.s·l) and as such they would not require a specific focus in
the conditioning program of a three day event horses. From within the eCI*"'*
class examined i t appeared that the more experienced horses trotted up in a more
relaxed fashion. Tension in the horse can make the gait appear uneven. It is
therefore concluded that consistent dressage training to improve the suppleness
of a horse should be combined with specific training to have a horse trot freely
in-hand.

4-73
References
Anon, ( 1 993) N.Z.E.F. Rules and regulations constitutional rules by-laws. Based on the rules of the Federation Equestre Internationale .
Clayton H M. ( 1 989) Time-motion analysis in equestrian sports: The grand prix dressage test. Proceedings of the 35th American Association of Equine Practitioners. 367-73 .
Clayton H M. ( 1990) Gait evaluation: Making the most of your home video system. Proceedings of the 3(/h American Association of Equine Practitioners. 447-55.
Clayton H.M. ( 1 993) Development of conditioning programs for dressage horses based on time-motion analysis of competitions. Journal of Applied Physiology. 74, 2325-2329.
Clayton, H.M. ( 1 996) Time-motion analysis of showjumping competitions. Journal of Equine Veterinary Science 16, 262-6.
Drevemo S and Johnston, C. ( 1 995) The use of a panning camera technique in equine kinematic analysis. Equine Veterinary Journal. Supplement 1 7, 39-43 .
Jeffcott L.B. ( 1995) On Course to the Olympics 96- a veterinary view of the Atlanta cup CCI* * . Journal of Equine Veterinary Science 1 5, 497-9.
Jones J .H and Carlson G.P. ( 1 995) Estimation of metabolic energy cost and heat production during a 3-day-event. Equine Veterinary Journal Supplement 20, 23-30.
White S L . ( 1 996) The three-day combined training event at the summer Olympic games. The Compendium April, 430-3 .
Wilford J. ( 1 997) Making the changes, Keeping things moving. New Zealand Equestrian Federation Bulletin 252, 25-26.

5-74
Chapter 5 Linear and tem poral stride characteri s t ics of three day event horses at a CCI*** three day event
preliminary horse inspection.
- - - ----------------
Abstract
The aim was to quantify the linear and temporal characteristics of the trot of
5-75
three day event horses during the preliminary horse inspection of a CCI** * three
day event. A cross sectional study was made of the kinematics of 24 three day
event horses during the first horse inspection at a CCI** * three day event. Video
footage was digitised and linear and temporal measurements were made. The
horses trotted for an average of I O.44± 1 . 55 strides. Spatial measurements were
made on an average of 5 .66±O.92 consecutive strides when the horses were
within the calibration zone. The horses increased and then maintained a constant
velocity within the calibration zone. Trotting on the asphalt track did not alter
the relationships between stride length, stride duration and velocity when
compared with previously published values. Horse specific differences in stance
and retraction percentages were identified. Horse specific differences were
identified that may contribute to each horses unique gait or "kinematic
fingerprint". It is proposed that the initiation of, and completion of, stance by the
hind l imb first may represent "engagement of the hind quarters" and be a
response to dressage training.
Introduction Three day eventing is a multidiscipl ine sport that includes dressage, speed and
endurance and show jumping tests. Of the three main equestrian sports, the three
day event is the most physically demanding. A three day event horse must have
stamina, speed and soundness to cope with the rigours of speed and endurance
day but also the tractability to perform in the dressage and show jumping phases.
The horse inspection is an integral part of the competition. Three horse
inspections are performed, the first is prior to the first day 's dressage, the second
prior to the steeplechase phase on speed and endurance day, and the third on the
morning of day three before the show jumping phase. A number of studies have
focused on the three day event horses abil ity to perform in a high humidity
climate (Jones and Carlson 1 995; Jeffcott 1 995; White 1 996). Less has been
documented about the kinematic characteristics of three day event horses (Deuel
and Park 1 993) (Schroter et al. 1 996), and nothing about the horse inspection.
5-76
This paper examines the l inear and temporal characteristics of the trot of a group
of national level (CCI* **) three day event horses during a preliminary horse
inspection.
Materials and Methods Twenty-four horses (23 geldings, 1 mare) were filmed during the initial horse
inspection at the 1 995 National Three Day Horse Trials Championships, Taupo,
New Zealand. The horses were led ' in-hand' at the trot by their regular riders on a
specially prepared asphalt surface. The horses were Thoroughbred or
Thoroughbred somatotype (Thoroughbred cross) with a mean age of 1 0.7±2.2years,
having previously qualified to a standard set by the international equestrian
governing body the Federation Equestre Internationale (FEI) for CCI** * level
competitions (Anon 1 993).
The filming technique was based on that ofDrevemo and Iohnston ( 1 995). A
panning lateral cameral at 50hz (50 fields per second) with a 1/1000 second
exposure rate was used to first film the horses and then the ground reference
markers. The camera was positioned 1 7.5m from the ground reference plane with
the horses passing in a medial plane 1 . 1 0±0. 1 7m from the ground reference plane.
Camera lens height was set at 1 .2m, as recommended by Clayton ( 1990). The
calibration zone consisted of 1 5 sports cones ( 14 2mm x 23 Omm) placed at 1 m
intervals at the edge of the trot-up track after the horse inspection. A vertical black
l ine (4mm thick) was marked on the cone to bisect it, to improve the accuracy of
cone placement and subsequent calibration. A 1 m x 1 m calibration board was used
to derive equations to correct for systematic differences in focal distance.
Calibration templates were developed from the ground reference marker footage.
The calibration templates were then over-laid on to the frames of horses containing
the strides of interest.
Analysis
Analogue video footage was converted to digital images using video digitising
software2. Graphics softwarel was used for the superimposition of the reference
I Panasonic MS-4, Matsushita Electrical Industrial Company Ltd, Osaka, Japan 2 RasterOps Corporation. 890 west 410 North Lindon Utah. USA
- -- - --- -- ------------
marker derived calibration template on to the horse trajectory frames. This
software was used to define points on the horse by superimposition of marker
templates and permitted the calculation of spatial measurements.
The temporal parameters of the trot that were measured are similar to those
previously described (Clayton 1 994), and are defined as follows.
5-77
Initial ground contact ofa limb was the frame in which loading of the limb first
took place. This was when a change in fetlock angle was observed. Stance was the
time from initial contact of the hoof with the asphalt surface until contact was lost.
The swing phase began when the limb was no longer seen to be in contact with the
asphalt surface and ended at ground contact. Retraction was the time from
maximum protraction of the limb until ground contact. Advanced placement was
deemed to be the time interval between ground contacts of the two limbs of the
diagonal pair. Advanced completion was the time between lift-off of the two limbs
of the diagonal limb pair. Positive values represent the hindlimb first and negative
values the forelimb first for both the advanced placement and completion
measurements. Overlap was the period when both limbs of the diagonal limb pair
were in stance phase, that is in contact with the asphalt surface.
Because data was collected in a competition environment, no control could be
placed on the specific location at which the handlers initiated the trot. This meant
that horses were at differing stages of the trot before they entered the calibration
zone. To account for this, stride number in this study refers to the sequence of trot
strides from the initiation of the trot by the horse.
Statistical Analysis.
Statistical analysis of the relationship between velocity, stride length and, stride
duration was performed using least squares regression. Polynomial regression
models were used to identify non-linear relationships. A repeated measures general
l inear model with the horse as a co-variant was used to identify differences between
strides. To identify individual differences Tamhane's post-hoc test was used. This
1 CJarisDraw, Claris Corporation, 5201 Patrick Henry Drive, Santa Clara, California
test was used as it could be applied to data sets with unequal variances. All
statistical analysis was performed using the statistical software SPSS TM7. 5 1 .
Results
5-78
The horses trotted for 1 0 .44±1 .56 strides. Spatial measurements were taken for
an average of 5 . 66±O. 92 strides when the horses were within the calibration zone.
Velocity was correlated with stride length (� =O.87 1 , p<O.OO l ) and negatively
correlated to stride duration was (r2=-0.655, p<O .OO l). A negative relationship
between stride length and stride duration was identified (r2=-0.204,p<0.05).
In this analysis, stride number is the number of the stride from the initiation of
the trot and not from when the horse first entered the calibration zone (Table
5 . 1 ). Regression analysis of the relationship of velocity and stride number
indicated that the horses increased and obtained a constant velocity (3rd order
polynomial, r2=0.243 , p<O.OO I) . A cubic regression model was found to best
describe the relationship between stride duration (r2=O. 1 80,p<O.OO l ), and stride
length (r2::::O. 1 64,p<0.OOl ) and stride number. Significant differences were found
for velocity and stride duration relative to stride number (p<O.05) . Differences in
stride length were not as significant (p<O. l O) . Post-hoc tests (Tamhane) revealed
in both the velocity and stride duration data that the initial two strides differed
significantly from the later strides when the horse had reached a constant
velocity.
1 SPSS Inc., Chicago, Illinois

Table 5-1 Temporal and spatial parameters for the trot strides analysed for the preliminary horse inspection.
Stride 1 2 3
Sample size (n) 1 2 1 7 2 1
Stride Duration (ms) 738±5 1 '" 709±33<. 693±35
Stride length (m) 2.40± 0. 1 5 2.48 ±O.22 2.S7 ±O.23
Velocity �m.s-l) 3.27±O.34" 3 . S I ±O.5 1 < 3.72 ±OAl
Values are means ± standard deviations
Different superscripts indicate values that are significantly different (p<O.05)
Post-Hoc Tambane p<O.05
4 5 6 7 8 25 25 24 1 5 8
676±3 1b< 677±2r 67S±23' 680±55 667±26b<
2.64 ±O.2 1 2.67 ±O.21 2.65 ±O . 1 8 2.65 ±O.l S 2.66 ±O.24
3.91 ±O.3 1 b 3.95 ±O.34b 3.94 ±O.28" 3.92 ±O.34b< 4.00 ±O. 1 sb<
Table 5-2 Descriptive statistics for the temporal variables of each stride measured for the preliminary horse inspection.
Stride 1 2 3 4 5 6 7 8 .................. h ................................ ...................... ... n .................................................. u ......... u •.•• U •••• d ......................................... u ...... u ........................................................... � •••• u ................ u ............ .
Sample size (n) 12 17 2 1 25 25 24 IS 8
Stance % 34.74±4.26' 33.30±3.34 33A1±3.23 32.58±3.04b 32.22±2.8Sb 32.3 I±2.72b 32. I S±3.32b 33.24±3.67
Retraction % 8.3 1±1.6 1 "" 9.21±1 .67" 9.3 1±1 .73< 9.61±1 .79' 9.76±U4' 1O.23±1 .76'" 1 O.21±1.71"" 1 0.66±l.66""
Advanced placement (ms) Advanced completion (ms) �iagon�I overIae { m.s} Values are means ± standard deviations
16±12.2
3 L3±1O.0",d
238±37'
17.1±12J
29.5±1 6.0cd
2 1 6±27
12.8±13.8
28.8±14.0d
2 1 1 ±24b
Different superscripts indicate values that are significantly different (p<O.05).
Post-hoc (Tambane) p<O.OS.
1 5±1 2.7
24. l±1 3.0
202±22b
1 2.4±13.3
16.8±16.3b<
203±2 1 b
1 3 .6±1O.2
24.0±10.6
201±2 1b
1 0 .4±13.l
23.0±1 UN 203±24b
7.5±14J
20.6±12.9
2 1 2±25b

-- -- -- ----------------�- - - -- -
Table 5-3 Descriptive statistics for limb pairs (n=24).
Variable Forelimb pair Hindlimb pair
Stance duration (ms) 236±30 2 1 8± 30.4
Retraction % 1 O.48± 1 .85 8 . 97± 1 . 50
Suspension Duration (ms) 454±56 472±55
Left-fore Right-fore
diagonal pair diagonal pair
Retraction % 9.66±1 . 86 9.79± 1 . 82
Diagonal advance 14 .3±10 .8 1 1 .4±14 .6
placement (ms)
Diagonal advanced 22.8±12 .2 26.3±1 5 .2
completion (ms)
Diagonal overlap (ms) 2 1 3 ±26.6 206±28.7
Values are means ± standard deviations
5-80
Significance
p<O .OO l
P<O.OO l
p<O .OO l
nls
p<0.05
p<0.05
p<0.05
Stride number had a significant effect on a number of temporal variables. Stance
percentage, retraction percentage, advanced completion, diagonal overlap
(p<O.O l ), and advanced placement (p<0.05) all differed significantly with stride
number. Post-hoc tests revealed significant differences between the prel iminary
strides and the middle or constant velocity strides for all variables, except for the
variable advanced placement. This was similar to the velocity and stride length
data with differences between the preliminary strides and the middle or constant
velocity strides. A weak 3rd order polynomial relationship was found between
overlap and velocity (r2 =0. 3 56 p<O.OOl ) and overlap and stride number (r2
=0. 1 37,p<0.00 1) .
Differences in temporal parameters were observed between the fore and
hindlimbs and the diagonal l imb pairs. Stance duration, suspension and
retraction as a percentage of stride differed significantly. Stance duration and
retraction was longer in the forelimb (p<O .OO l) . When comparing diagonal l imb
pairs, advanced placement was significantly greater in the right diagonal l imb
- -- �-- - ----- - -- - - - - -
pair (p<O.05). In the diagonal l imb pairs the hindlimb was the first to start and
complete stance phase (p<O.05).
Discussion
Stride frequency and ground surface.
According to the FEI, the trot can be classified into 4 groups. From the slowest
trot to the fastest trot the categories are collected, working, medium and, the
extended trot (Clayton 1 994). The velocity of the horses presented at the horse
inspection in this study became constant at a velocity range equivalent to the
boundary between the working and medium trot (Clayton 1 994) . At this constant
velocity the stride length was best described by the working trot. However, the
stride frequency started at the upper limit for the extended trot and continued to
increase. This high stride frequency could be due to the horses trotting on an
asphalt surface. Horses trotting on a hard non-yielding surface maintain the
same velocity by increasing stride frequency and decreasing stride length (Barrey
al. 1 993 ; Buchner et al. 1 994). This mechanism makes it difficult to compare
parameters measured from horses presented on different ground surfaces.
Recently the FEI veterinary committee has focused attention on standardi sation
of trot-up surfaces. At the major competitions the trotting surfaces are usually
level firm surfaces and in New Zealand are specially prepared asphalt surfaces
(Wilford 1 997). As the horse inspection provides a potential limitation to a
horse's abil ity to proceed in the three day event competition, it is surprising that
there are no reports on the kinematics of this pivotal activity.
From the data in Table 5-1 the horses accelerated to and obtained a constant
velocity within the measurement field. This provides an opportunity to examine
the interaction of changes in velocity on kinematic parameters within the trot. In
the measured strides the horses increased velocity initially by decreasing stride
duration and increasing stride length. Within the first two strides a constant stride
duration was attained and subsequently further increases in velocity were
primarily due to increased stride length. This agrees with the results from
dressage horses that increased velocity between the different trot types is
achieved by increasing stride length (Clayton 1 994). Trotting on the asphalt

-- --- --- � � �
5-82
surface, the event horses in this study had shorter stride durations at a given
velocity than the horses examined by Clayton ( 1 994). However the relationship
between velocity, stride length and stride duration was constant.
The rules of the FEI emphasise that increases in velocity from the collected
through to extended trot should be obtained with the horse maintaining the same
rhythm (Anon 1 993) . At moderate trot velocities it has been proposed that
increases in velocity are primarily due to increases in stride length, while at
racing trot speeds ( 12 m.s·l) increases in velocity are due to decreases in stride
duration (Leach 1 987). For the event horses, stride duration was constant as
velocity increased in agreement with the FEI rules and previous
observations(Clayton 1 994; Leach 1 987).
Horse Specific Characteristics.
Neither stance or retraction percentage had a significant relationship with
velocity or stride number. The general linear model demonstrated a significant
horse and horse by stride effect (p<O .OI) for both stance and retraction
percentage. Thus each horse may have a distinctive or pre-programmed
preferred stance and retraction percentage within the velocity range examined.
Horse specific differences were also identified for advanced completion,
advanced placement and, diagonal overlap (p<O.OO l ). Horse specific
characteristic patterns for the fetlock and tarsal joints have been observed (Sloet
van Oldruitenborgh-Oosterbaan et al. 1996), and in pro/retraction angles in
Dutch warmblood horses (Back et al. 1 994). It appears that within this velocity
range for the trot, the variables in Table 5-2 may be horse specific, contributing
to a unique kinematic fingerprint. This parameter specificity may be a reflection
of a horse's specific gait modifications to the asphalt surface, each horse
adopting a slightly different strategy. However as only minor kinematic
differences have been found between Dutch warmblood horses trotted on asphalt
and a rubber surfaces (Buchner et al. 1 994), consistent individuality should also
be apparent on more compliant surfaces.
Training.
- -� -----------�- -- - -- -
5-83
The trot is described as a two beat gait consisting of two alternate diagonal l imb
pairs separated by a moment of suspension (Anon 1 993). Motion analysis has
identified that there is a slight disassociation of the diagonal l imb pairs and that
the characteristics of the disassociation may be velocity dependent. At the racing
trot ( 1 2m.s·1) the forelimb lands first (Clayton 1 989), while at the moderate trot
velocities observed in equestrian sport, the hindlimb precedes the forelimb of the
diagonal pair (Clayton 1 994; Deuel and Park 1 990; Drevemo et al. 1 980a). The
magnitude of advanced placement is greater than that of advanced completion
(Drevemo et al. 1 980a).
In the present study, stance duration as a percentage of stride was greater in
forelimbs than the hindlimbs. No velocity dependent relationship could be
identified. This is similar to parameters reported for the collected and working
trot (Clayton 1 994) . The hindlimb consistently preceded the forelimb of the
diagonal limb pair at both the initiation and completion of stance phase. The
hind l imb appears to precede the forelimb of the contra-lateral l imb pair at lower
trot velocities (Clayton 1 994; Drevemo et al. 1 980b) and the forelimb precedes at
racing trot velocities (Drevemo et al. 1 980a). In the present study the forelimb
was observed to proceed the hindlimb only when a horse was rapidly
decelerating.
One of the primary goals of training the young horse is "engagement of the hind
quarters" (Crossley. 1 993). It is conceivable that the hind l imb proceeding the
forelimb of its l imb pair at both the initiation and completion of stance phase
may be a reflection of the training goal for these horses. By the time a horse
reaches advanced grade (CCI***) it has a high level of dressage training. With
advanced national representative level dressage horses, the hind l imb initiated
stance before the forelimb and consistently completed the stance phase before the
forel imb, irrespective of the speed or type of trot (Clayton 1 994). Earlier
maximal protraction of the hind l imb with respect to the retracting ipsilateral
forelimb was observed for Dutch warmblood horses after 70 days intensive
training (Back et al. 1 994). This supports the theory that dressage training
encourages the hind l imbs to "engage" (Crossley1 993), as observed by the hind
l imb initiating stance phase before the forelimb of the limb pair.

- - ----------------------------------
Track surface and breed effect on gait
5-84
In Swedish Warmblood stall ions the forelimb retraction (22%) was found to be
greater than hind l imb retraction (5%) (Holmstrom et al. 1 993). In the present
study retraction percentage was significantly greater in the forelimbs but the
difference was not as large as that observed by Holmstrom et al. ( 1 993) . The
difference may be due to the horses being presented on asphalt rather than a sand
arena. Horses trotting on asphalt had reduced vertical displacement of the
withers compared to horses trotting on rubber (Buchner et al. 1 994). Therefore
retraction time may have been reduced as a consequence of horses attempting to
minimise the concussion forces. It is also possible that breed differences,
predominantly thoroughbreds in this study and the training objective three day
event versus dressage in the elite Swedish stall ions, may also be contributing
factors to these differences. Thoroughbreds are recognised as having a long low
gait pattern as opposed to the rounder knee action of the warmblood. Differences
in gait parameters have been found between thoroughbred racehorses and
warmblood dressage horses (Clayton 1 993). While the breed and training effect
in that study provided confounding variables the indication was that there could
be breed associated differences in gait parameters. This breed and asphalt
surface effect may explain some of the disparity with the retraction percentages
between this study and that ofHolmstrom et al. ( 1 993) .
Asymmetry.
Laterality or "leggedness" in horses has been previously described (Clayton
1 994; Deuel and Park 1 990) . Significant differences between diagonal l imb pairs
were found for diagonal advanced placement and completion. A number of
theories have been advanced as to the reason for observed laterality in horses
(Meij and Meij 1 980). For the three day event horses the level of dressage
training required should minimise any laterality, as one of the goals of dressage
i s to "make the horse straight" to correct any natural laterality (Crossley. 1 993).
However; motion analysis tends not to support this, at least within the context of
the variables examined. Previous studies have found evidence of laterality in
elite and national level dressage horses (Clayton 1 994; Deuel and Park 1 990). In
the present study the horses were led in-hand from the near side and this may
have contributed the appearance of laterality. It is possible that increased

5-85
dressage training may not remove laterality but super-impose the rider or trainers
laterality on to the horse. This may manifest itself either as a minimisation of
laterality or superimposition of the existing bias.
Conclusion
In conclusion this study indicates that the asphalt track used for horse inspections
at major three day event competitions decreases the stride duration of the trot at
this velocity range when compared to other studies. However the relationship
between stride duration, stride length and velocity appeared constant. Velocity
dependent changes in a number of temporal variables could not be identified or
had weak relationships. Horse specific differences were identified. It was
proposed that these differences could contribute to the horses unique gait or
"kinematic fingerprint" . It is proposed that initiation of and completion of stance
by the hind limb first may be a response to dressage training.
5-86
References
Anon ( 1 993) New Zealand Equestrian Federation Rules and regulations
constitutional rules by-laws. Based on the rules of the Federation Equestre
Intemationale.
Back W, Barneveld A, Schamhardt H C, Bruin G and Hartman W ( 1994)
Longitudinal development of the kinematics of 4-, 1 0-, 1 8- and 26-month old
Dutch warmblood horses. Equine Veterinary Journal Supplement. 17, 3-6.
Barrey E, Galloux P, Valette J P. , Auvinet B. and Wo Iter R. ( 1 993) Stride
characteristics of overground versus treadmill locomotion in the saddle horse.
Acta Anatomica. 146, 90-94.
Buchner H.H.F, Savelberg H.H, Schamhardt H C, Merkens H W.and Bameveld
A. ( 1994) Kinematics of treadmill versus overground locomotion in horses.
The Veterinary Quarterly 16, 87-90.
Clayton H M. ( 1989) The effect of acute hoofwall angulation on the stride
kinematics of the trotting horse. Equine Veterinary Journal Supplement. 9,
86-90.
Clayton H M. ( 1990) Gait evaluation: Making the most of your home video
system. Proceedings 3dh American Association of Equine Practitioners.
447-55 .
Clayton H M. ( 1 993) The extended canter: a comparison of some kinematic
variables in horses trained for dressage and for racing. Acta Anatomica. 1 46,
1 83- 1 87.
Clayton H M. ( 1994) Comparison of the stride kinematics of the collected,
working, medium and extended trot in horses. Equine Veterinary Journal 26,
230-4.
Crossley A, 1 993 Training the young horse: the first two years, 10th edition.
5-87
Stanley Paul & Co. Ltd, London,
Deuel N R and Park J. ( 1 993) Gallop kinematics of Olympic three-day event
horses. Acta Anatomica 146, 1 68- 1 74.
Deuel N R and Park J J. ( 1990) The gait pattern of Olympic dressage horses.
International Journal of Sport Biomechanics 6, 1 98-226.
Drevemo, S . , Dalin, G., Fredricson, land Bjorne, K. ( 1980a) Equine
Locomotion: 3 . The reproducibility of gait in standardbred trotters. Equine
Veterinary Journal 12, 7 1 -3 .
Drevemo S , Fredricson I , Dalin G.and Bjorne K . ( 1980b) Equine Locomotion: 2 .
The analysis of coordination between l imbs of trotting standardbreds. Equine
Veterinary Journal 12, 66-70.
Drevemo S and Johnston C ( 1 995) The use of a panning camera technique in
equine kinematic analysis. EqUine Veterinary Journal. Supplement 1 7, 3 9-
43 .
Holmstrom M, Fredricson 1 . and Drevemo S . ( 1 993) Biokinematic analysis of the
Swedish warmblood riding horse at trot. Equine Veterinary Journal 26, 235-
40.
Ieffcott L B ( 1 995) On Course to the Olympics 96- a veterinary view of the
Atlanta cup CCI** . Journal of Equine Veterinary Science 15, 497-9.
Jones I H and Carlson G P ( 1 995) Estimation of metabolic energy cost and heat
production during a 3-day-event. Equine Veterinary Journal Supplement 20,
23-30.
Leach D. 1 987 Locomtion of the athletic horse. Equine Exercise Physiology 2:
Proceedings of the second International Conference on Equine Exercise
Physiology. ICEEP Publications, 5 1 6-3 5 .
Meij H S and Meij J C P ( 1 980) Functional asymmetry in the motor system of
the horse. South African Journal of Science 76, 552-556.

5-88
Schroter R C, Baylis E and Marlin D J ( 1 996) Gait, estimated net cost of
transport and heat production at different speeds in Three-day-event horses.
Equine Veterinary Journal Supplement 22, 1 6-23 .
Sloet van Oldruitenborgh-Oosterbaan M M, Barneveld A and Schamhardt H C
( 1996) Kinematics of unmounted and mounted horses at walk before and
after treadmil l exercise. Pferdeheilkunde 12, 65 1 -5 .
White S L ( 1 996) The three-day combined training event at the summer
Olympic games. The Compendium April, 430-3 .
Wilford J ( 1 997) Making the changes, Keeping things moving. New Zealand
Equestrian Federation Bulletin 252, 25-26.

6-89
Chapter 6 Temporal changes in the trot between the first and thi rd horse inspections at a CCI*** three day event.

6-90
Abstract Kinematic parameters were measured from horses competing in a CCI*"" three
day event. The horses were filmed during the first and third horse inspection.
This provided a repeat sample on 1 6 horses. The horses were filmed using a
panning lateral S-VHS video camera (50Hz). Spatial measurements were taken
for an average of 5 .66±O.92 strides for the first inspection and 5 .05±1 .27 for the
third inspection
Within the calibration zone, data of the horses accelerating and obtaining a
constant velocity were collected. The horses trotted with a higher mean velocity
during the third inspection (O.26±O .OSms·1 p<O.OO l ). During the third inspection
the horses trotted with a shorter stride length (O. 193±O.03m p<O .OO I ) and stride
duration (3 1 ±42ms p<O.OO 1 ). The third inspection was characterised by a
decrease in retraction percentage for both the forelimbs (3 .69±2.39% p<O .OO I )
and the hindIimbs (2.48±2. 1 6% p<O.OO I) . However, no significant difference
was found between the 2 inspections for other temporal parameters when
measured as a percentage of stride. It is proposed that the event horses trot with
a decreased stride length and duration during the third horse inspection but
maintain a consistent temporal relationship.
Introduction The three day event competition places a high physiological demand on the
equine participants (Jones et al . . 1 995, Schroter et al . . 1 996) . The horse
inspections are an integral part of the three day event. The first inspection is on
day one prior to the dressage. The second inspection takes place on day 2 (speed
and endurance day) at the end of phase C. A third inspection is performed on the
morning of day 3 prior to the show jumping. Both the first and third veterinary
inspections are performed using a standardised format with the horses trotted up
on a firm, level surface (Anon 1 998).
Previously the examination of the kinematics of three day event horses has
focused on the cross country test (Deuel and Park 1 993 , Moore et al . . 1 995,
Clayton 1 997). But to date the kinematics of the horse inspection does not
appear to have been examined. This is surprising considering that the
inspections can prevent a horse from continuing in the competition, and the
debate that is often created as a result of the decision by the judge's panel,
particularly with the third inspection.
6-91
A characteristic of fatigue in human middle distance runners is the use of a
shorter and higher frequency stride to achieve the same relative velocity.
Associated with the change in the relationship of stride length and frequency
with velocity there is an associated increase in stance as a relative percentage of
stride time (EHiot and Roberts 1 980). It is likely that the kinematic responses to
fatigue in bipeds (humans) and quadrupeds (horses) will be similar. In
examining fatigue in horses Leach and Sprigings ( 1 979) and Wilson et al . .
( 1 993) found an increase in stance time as a result of fatigue. The horse
inspection provides a model of the effects of high physiological loading and
subsequent partial recovery on gait. Since there does not appear to have been
such a study previously, this chapter examines changes in temporal parameters in
a sample ofCCI*** event horses between the first and third horse inspections.
Materials & Methods
Twenty-four horses were filmed at the initial veterinary inspection at the 1 995
National Three Day Horse Trials Championships, Taupo, New Zealand. At the
third horse inspection 4 horses were not presented, providing a sample of20 horses
presented at both inspections. From the third inspection 4 horses were excluded
from analysis due to incomplete footage or poor resolution. The remaining sample
of 16 horses with repeat measurements from both inspections provided the data set
for this study. For the horse inspections the horses were led ' in-hand' at the trot by
their regular riders on a specially prepared asphalt surface.
The horses were Thoroughbreds or Thoroughbred cross of advanced grade, having
previously qualified to a standard set by the international equestrian governing body
the Federation Equestrian Internationale (FEI) for CCI*** level competitions
(Anon 1 995).
The filming technique was based on that ofDrevemo and Iohnston ( 1994). A
panning lateral camera1,2 at 50hz (50 fields per second) with a 1/1000 second
exposure time was used to film first the horses and then the ground reference
markers. The calibration zone consisted of 1 5 prefabricated sports cones placed at
I m intervals. A I m x l m calibration board was used to derive equations to correct
for differences in focal distance. The camera was positioned 1 7. 5m from the
ground reference plane with the horses passing 1 . 1 O±O . 17 m from the ground
reference plane. Calibration templates were developed from the ground reference
marker footage. The calibration templates were then over�laid on to the frames
containing the strides of interest.
Data Acquisition: Analogue video footage was converted to digital images using video digitising
software3 . This provided individual images representing the odd and even fields of
the video footage. Graphics softwarel was used for the development, and
overlaying of, the reference marker calibration template on to the horse trajectory
frames. This software also permitted the calculation of spatial and temporal
measurements.
The temporal parameters measured are similar to those previously described by
Clayton ( 1994). Initial ground contact was the frame when loading of the limb first
took place. This was when a change in fetlock angle was observed. The swing
phase began when the limb was observed to be no longer in contact with the asphalt
surface. Retraction was the period from maximal protraction until initial ground
contact. Advanced placement was deemed to be the time between ground contacts
) Panasonic MS-4, Matsushita Electrical Industrial Company Ltd, Osaka, Japan 2 Panasonic XD S-VHS 1 80 video tape, Matsushita Electrical Industrial Company Ltd, Osaka, Japan 3 MediaGrabber RasterOps Corporation. 890 west 4 10 North Lindon Utah. USA.
6-93
of the two limbs of the diagonal pair. Advanced completion was the time between
l ift-off of the two limbs of the diagonal limb pair. Positive values represent the
initiation of the movement by the hind limb first, and negative values the forelimb
first, for both the advanced placement and completion measurements. Overlap was
the period when both limbs of the diagonal limb pair were in contact with the
asphalt surface.
Statistical Analysis: A mixed effects regression model for clustered data was used to provide a
maximum marginal likelihood solution for the relationship of velocity with stride
length and stride duration. Horses were treated as random effects to reflect the
dependence of successive measurements of individual horses. Inspection days
were treated as nominal variables in the regression equation permitting the
comparison ofinter-relationships across inspection days. This technique was
performed using the mixreg macro developed for SPSSTM by Hedeker et al . .
( 1994). A repeated measures general linear model was used to identifY differences
in temporal patterns between the two inspections. These statistical techniques were
performed using the statistical software package SPSS TM7.5 1 .
Results
Spatial measurements were taken for an average of 5 .66±O.92 strides for the first
inspection and 5 .05±1 .27 for the third inspection (Group B) when the horses
were within the calibration zone. Within the calibration zone, data of the horses
accelerating to and maintaining a constant velocity were collected. The horses
trotted at a higher average velocity during the third inspection (paired t-test
O.26±O.05m.s'\ p<O.OOl ) maintaining a similar standard deviation. Stride length
had a l inear relationship with velocity (first inspection r2=O. 86, third i nspection
�=o.73). Regression analysis revealed different strategies between the first and
third inspections to obtain the same velocity (Fig 6- 1) . The regression lines were
not parallel, because there was a significant interaction between inspection and
1 ClarisDraw, Claris Corporation, 5201 Patrick Henry Drive, Santa Clara, California

6-94
stride length (6 coefficient 0.293±0. I S4, p<0.OS7). A paired t-test indicated that
at the same velocity, the third inspection had shorter strides (0. 1 93±0.03 m,
p<O.OO I ). A low correlation was found for the stride duration between
inspections (r2=0.247, p<O.OO I) . This low correlation between days possibly
contributed to the non-significant difference in stride duration identified by
analysis of the regression slopes. However, a paired students t-test did identify a
significant difference between inspection for stride duration (0.03 1±O.042s,
p<O.OO I) . Both stride length and stride duration had a similar reduction in the
deviation about the mean from the first to third inspections with the range
reduced by 1 8 .9% and 20% respectively.
The results of the paired t-tests are presented in Table 6- 1 . Retraction as a
percentage of stride was significantly greater during the first horse inspection for
all l imb pairs (Table 6- 1) . Retraction was greater in the forelimbs when
compared to the hindl imbs. No laterality effect was observed in retraction
between diagonal limb pairs.
Diagonal advanced placement (ms) was significantly greater in the left diagonal
for the first horse inspection. However, when measured as a percentage, of stride
time no significant differences were found between inspections. Laterality was
observed in differences between the left and right diagonals. For both
inspections the diagonal advanced placement for the right diagonal pair was
nearly twice that of the left diagonal pair.
1 Spss Inc., Chicago, Illinois

.... I VI E � .g Qj >
5.0 �----------------------------------����-.
4.5
4.0
3.5
3.0
2.5 2.0 2.2 2.4 2.6 2.8 3.0 3.2 3.4
Stride Length (m)
6-95
DAY
• Third Inspection Rsq = 0.73
• First Inspection Rsq = 0.86
Figure 6- 1 Regression lines (including 95% confidence intervals) of the relationsh ips between velocity and stride length for the first and third horse inspection .
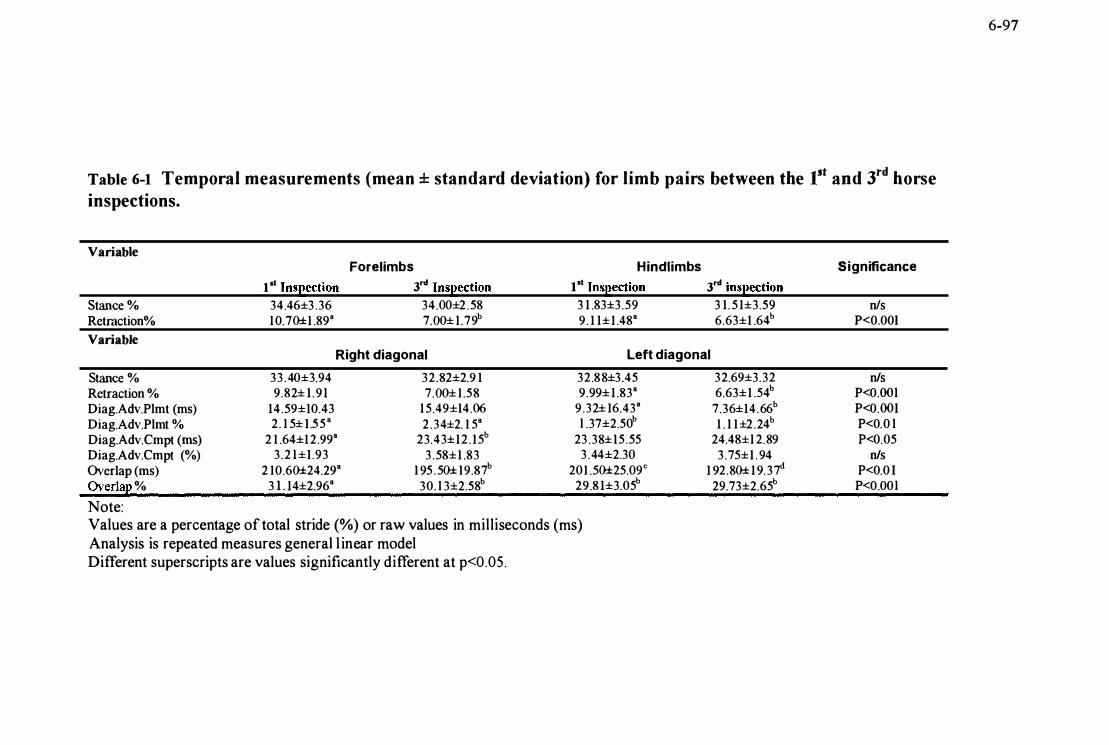
Table 6-1 Temporal measurements (mean ± standard deviation) for limb pairs between the 1,t and 3rd horse inspections.
Variable
Stance % Retraction%
Variable
Stance % Retraction % Diag.Adv.Plmt (ms) Diag.Adv.Plmt % Diag.Adv.Cmpt (ms) Diag.Adv.Cmpt (%) Overlap (ms) Overlap %
Note:
1 at Inspection 34.46±3 .36 1O.70±1 .898
Forelimbs 3rt! Inspection
34.00±2 .58 7.00± 1 .79b
Right diagonal 33 .40±3.94 32.82±2.9 1 9.82± 1 .9 1 7.00± 1 .58
14.59±1O.43 1 5.49±14.06 2. 1 5± L55" 2 .34±2. 1 5"
2 1 .64±12.99" 23.43±12 . 15b
3 .2 1±L93 3 .58±1 .83 2 1O.60±24.29" 1 95 .50± 19.87b
3 LJ4±2.96" 30. l 3±2.58b
Hindlimbs 1 at Inspection 3 1 .83±3 .59 9. 1 1± 1 .48"
3rt! inspection 3 1 . 5 1±3.59 6.63±1 .64b
Left diagonal 32 .88±3 .45 32.69±3.32 9.99± 1 .83" 6.63±1 .54b
9.32± 16.438 7.36±14.66b
l .37±2.50b 1 . 1 1±2.24b
23 .38±15.55 24.48±1 2.89 3 .44±2.30 3 .75±1 . 94
201 .50±25.09c 1 92.80± 1 9.37d
29.8 1±3.05b 29.73±2.65b
Values are a percentage of total stride (%) or raw values in milliseconds (ms) Analysis is repeated measures general l inear model Different superscripts are values significantly different at p<O.OS.
Significance
nfs P<O.OOI
n/s P<O.OOl P<O.OOI P<O.O l P<O.05
n/s P<O.O I P<O.OOl
6-97
6-98
Stance as a percentage of stride did not differ significantly between inspections
for any of the limb pairs. At both inspections, stance percentage was greater in
the forelimbs than the hindIimbs. No significant difference could be found
between diagonal limb pairs. As with advanced placement, laterality was also
observed with stance time. When diagonal limb pairs were combined across
days the right diagonal had a longer stance time.
Overlap measured as time and as a percentage of stride was greatest during the
first inspection, but only overlap time was significantly different between days.
Differences in overlap between diagonals may indicate some underlying
laterality in these horses.
The only significant difference found in advanced completion was between
diagonal pairs. Advanced completion was significantly different between the
first and third inspections for the right diagonal only. In the left diagonal pair
advanced completion always occurred at an earlier stage than the right diagonal .
This pattern was consistent across days.
Discussion Leach and Crawford ( 1 983) proposed that one of the first steps to understanding
equine locomotion should be a descriptive or qualitative phase. To understand
the changes in gait pattern due to strenuous exertion it is preferable to initially
examine changes in the relationship of stride length and duration with velocity.
It was observed that after the high physical demands of speed and endurance day,
event horses trotted with a lower stride length and duration to achieve the same
velocity. Leach and Sprigings ( 1979) proposed that with the onset of fatigue
stride duration increased significantly. Differences between this study and the
one reported by Leach and Sprigings could be expected as a result of the
different models used. In the present study comparisons were based on a re
sampling 1 6- 1 8hrs after strenuous exercise with trotting event horses, whereas
Leach and Sprigings ( 1 979) compared galloping Thoroughbred racehorses at
6-99
different stages of a race. Through the use of different time periods in the two
studies it is possible that the horses could have had different physiological and
biomechanical needs at the time of sampling and therefore required differing
strategies to address the relevant priorities. As a consequence of the shorter time
period between repeated samples it is possible that Leach and Sprigings ( 1979)
measured the changes in gait pattern caused by fatigue. In our study changes in
gait pattern would be due to muscle soreness rather than fatigue. Muscle
soreness usually develops within the first 24 hours following exercise (Ebbeling
and Clarkson 1 989). This phenomenon has been referred to as delayed onset
muscle soreness (DOMS). In humans the soreness is described as a dull aching
pain combined with tenderness and stiffness (MacIntyre et al. 1 995). DOMS
does not appear to have been described in horses but McMiken ( 1 983) does refer
to the possibility that there may be sub-clinical structural damage in muscle
which is reflected in the "soreness" a day or two after exercise. This may be the
cause of the stiffness on the morning following speed and endurance day
reported in three day event handbooks (Leng 1 990, Holderness-Roddam 1 99 1 ).
Elevated creatine phosphokinase levels have been associated with DOMS and
Marlin et al. ( 1995) have found elevated creatine phosphokinase at twice basal
level 1 6 h post-completion of phase D of speed and endurance day.
The DOMS model fits the observed changes in gait pattern. With DOMS, a
decreased range of motion could be expected (MacIntyre et al. 1 995). Therefore
the horses may have found it more efficient or comfortable to use a lower stride
length and duration to achieve the same velocity on the third inspection. From
studies in human running it has been proposed that long strides require
considerable power during propulsion, result in excessive vertical oscillation of
the centre of mass, produce a foot-strike position which creates large braking
forces, and require joint ranges of motion which invoke increased internal
friction and stiffness (Anderson 1 996). After strenuous exercise the expectation
would be that the horse would attempt to minimise the effect of these factors.
The relatively long time period for recovery in this study ( 1 6- 1 8h post-exercise)
may explain the limited changes in the temporal patterns observed between the
inspections. The temporal patterns for individual horses were consistent between

6-1 00
inspections even to the level of maintaining a similar degree of measured
l aterality between diagonal l imb pairs. This consistency tends to add weight to
the observation of previous authors that temporal patterns appear to be resistant
to change.
At both examinations the horses demonstrated a lower than expected retraction
percentage. Overall values were less than the parameters previously published
for warmblood horses on a sand surface (Holmstrom et al . . 1 994). Retraction
time as a percentage of stride may have been altered due to the asphalt surface.
However, the findings of Buchner et al.. ( 1 994) tends to discount this theory. A
more likely possibility may be related to a breed effect. The horses in this study
were predominantly Thoroughbreds or of Thoroughbred type whereas
Holmstrom et al .. ( 1 993) was using Swedish Warmblood horses. Thoroughbreds
have been described as having a long low gait, this type of gait pattern could
account for the decreased retraction time. A long low gait may have a reduced
retraction component when compared to the rounder and higher knee action of
the warmblood.
A reduction in retraction time was observed between the first and the third
inspection. Pratt and O'Connor ( 1 978) proposed that with fatigue in racing
thoroughbreds there is a reduced amount of time available for retraction. In our
study there was a reduction in both retraction time and as a percentage of stride.
The reduction in time would be a direct effect of the reduced stride duration
observed during the third inspection. However, the reduction in retraction
percentage may be related to the shorter stride length due to DOMS. With a
decreased range of motion the limb would not be protracted to the same extent
and so retraction as a percentage of the stride duration would be reduced due to
the shorter distance to cover.
The third veterinary inspection was characterised by lower stride length and
duration to obtain the same velocity. Temporal patterns of most variables
measured remained consistent between inspections. Only retraction and overlap
percentage decreased between the first and third inspection. The consistency of

6-1 0 1
most temporal variables implies that these variables are resistant to the effect of
external influences even after strenuous exercise.
6-1 02
References: Anderson T ( 1996) Biomechanics and running economy. Sports Medicine.
2,76-89.
Anon. New Zealand Equestrian Federation (inc.). (1 995) Rules and regulations
constitutional rules by-laws. Based on the rules of the Federation Equestre
Nationale.
Anon ( 1 998) Veterinary Regulations. 8th Edition. Federation Equestre
Intemationale Switzerland pp 1 56.
Buchner H H F, Savelberg H H, Schamhardt H C, Merkens H W and Bameveld
A ( 1 994) Kinematics oft read mill versus overground locomotion in
horses. Veterinary. Quartarly. 16, 87-90.
Clayton H M ( 1994) Comparison of the stride kinematics of the collected,
working, medium and extended trot in horses. Equine Veterinary. Journal.
26, 230-234.
Clayton H M ( 1997) Effect of added weight on landing kinematics in jumping
horses. Equine Veterinary. Journal. Supplement. 23, 50-53 .
Deuel N R and Park J J ( 1993) Gallop kinematics of Olympic three-day event
horses. Acta Anatomica. 146, 168- 1 74.
Drevemo S and Johnston C ( 1 994) The use of a panning camera technique in
equine kinematic analysis. Equine Veterinary Journal. Supplement. 1 7, 39-
43 .
Ebbeling C B and Clarkson P M ( 1989) Exercise induced muscle damage and
adaptations. Sports Medicine. 7, 207-234.

6-1 03
Elliott B C and Roberts A D ( 1980) A biomechanical evaluation of the role of
fatigue in middle-distance running. Canadian Journal of Applied Sport
Science. 5, 203-207.
Hedeker D, Gibbons R D, Flay B R ( 1 994) Random-effects regression models
for clustered data with an example from smoking prevention research.
Journal of Consulting and Clinical Psychology. 62, 757-765
Holderness-Roddam J ( 1 99 1 ) Practical eventing. David & Charles, Newton
Abbot, London. pp1 99.
Holmstrom M, Fredricson I and Drevemo S ( 1 993) Biokinematic analysis of the
Swedish Warmblood riding horse at trot. Equine Veterinary Journal. 26,
235-240.
Jones J H, and Carlson G P (1 995) Estimation of metabolic energy cost and heat
production during a 3-day-event. Equine Veterinary Journal Supplement.
20, 23-30.
Leach D H and Sprigings E ( 1979) Gait fatigue in the racing thoroughbred.
Journal of Equine Medicine and Surgery 3, 436-443.
Leach D H and Crawford W H ( 1 983) Guidel ines for the future of equine
locomotion research. Equine Veterinary Journal 15, 1 03- 1 1 O .
Leng V ( 1990) Training the event horse. Stanley Paul. pp 1 9 1 .
Marlin D J, Harris P A, Schroter R C, Harris R C, Roberts C A, Soott C M, Orme
C E, Dunnett M, Dyson S J, Barrelet F, Williams B, Marr C M and Casa I
( 1 995) Physiological, metabolic and biochemical responses of horses
competing in the speed and endurance phase of a CCI**** 3-day-event
Equine Veterinary Journal Supplement. 20, 37-46 .
6- 1 04
Maclntyre D L, Reid W D McKenzie D C ( 1 995) Delayed muscle soreness.
The inflammatory response to muscle injury and its clinical implications.
Sports Medicine 20, 24-40 .
McMiken D F ( 1 983) An energetic basis of equine performance. Equine
Veterinary Journal 15, 1 23 - 1 33 .
Moore D P, Deuel N R, Drevemo S and van den Bogert A J ( 1 995) Kinematic
analysis of world championship three-day event horses jumping a cross
country drop fence. J. Equine Veterinary Science 15, 527-53 L
Pratt G and O'Connor J T ( 1978) A relationship between gait and breakdown in
the horse. American. Journal of Veterinary Research. 39, 249-253
Schroter R C, Baylis E and Marlin D J ( 1 996) Gait, estimated net cost of
transport and heat production at different speeds in Three-day-event horses.
Equine Veterinary Journal. Supplement. 22, 1 6-23 .
Wilson M, Deuel N R, Huffstutler K, Drevemo S and van den Bogart A J ( 1 993)
Effects of fatigue on limb contacts of world-class endurance horses. 1 fh
Equine Nutrition & Physiological Science Proceedings. Gainsville, Florida
2 1 1 -2 1 2 .

7- 1 05
Chapter 7 Kinematic examination of the trot i n t h ree d ay event horses d uring the prel iminary horse i nspection at a
CCI*** three day event.
7-1 06
Abstract
The kinematics of six horses presented during the preliminary horse inspection at
a CCl** * three day event are examined. The six horses trotted with a mean
velocity of3 . 94±O.22m.s·1 . Displacement, velocity and acceleration data are
presented for the X, Y and Z axes. Larger than expected vertical d isplacement
values for the central body marker and fore and hindlimbs are presented as
evidence that during the preliminary horse inspection, three day event horses trot
with a more animated action. This finding could be due to a combination of the
atmosphere of the competition environment and the high level of fitness. The
greater horizontal ( I . 1 29±O. I 03m vs I . I08±O.OSm) and vertical displacement of
the forelimbs (O.22I ±O.027m vs 0 . 1 59±O.05m) to the hind l imbs are presented as
evidence of dressage training.
I ntroduction.
The in-hand trot is commonly used for lameness inspections and is used for the
first and third horse inspections at three day event competitions. The objective of
the horse inspections at a three day event is to ensure that the horse is fit and
sound, and therefore able to progress on to the next stage of the competition. To
date the 3 dimensional kinematics of the trot of event horses during the horse
inspection has not been examined.
In Dutch warmblood horses, the differences between the kinematics of the
forelimbs and hindlimbs have been proposed as a contributing factor for the
greater incidence of lameness seen in the forelimbs rather than the hindJimbs
(Back et al. 1 995).
Previous studies of three day event horses during the horse inspection had
identified horse specific temporal patterns (Chapter five) and have shown that
these temporal patterns were consistent between the first and third horse
inspections after the horses had completed the speed and endurance day (chapter
six). Between the first and third inspection the horses had a decrease in stride
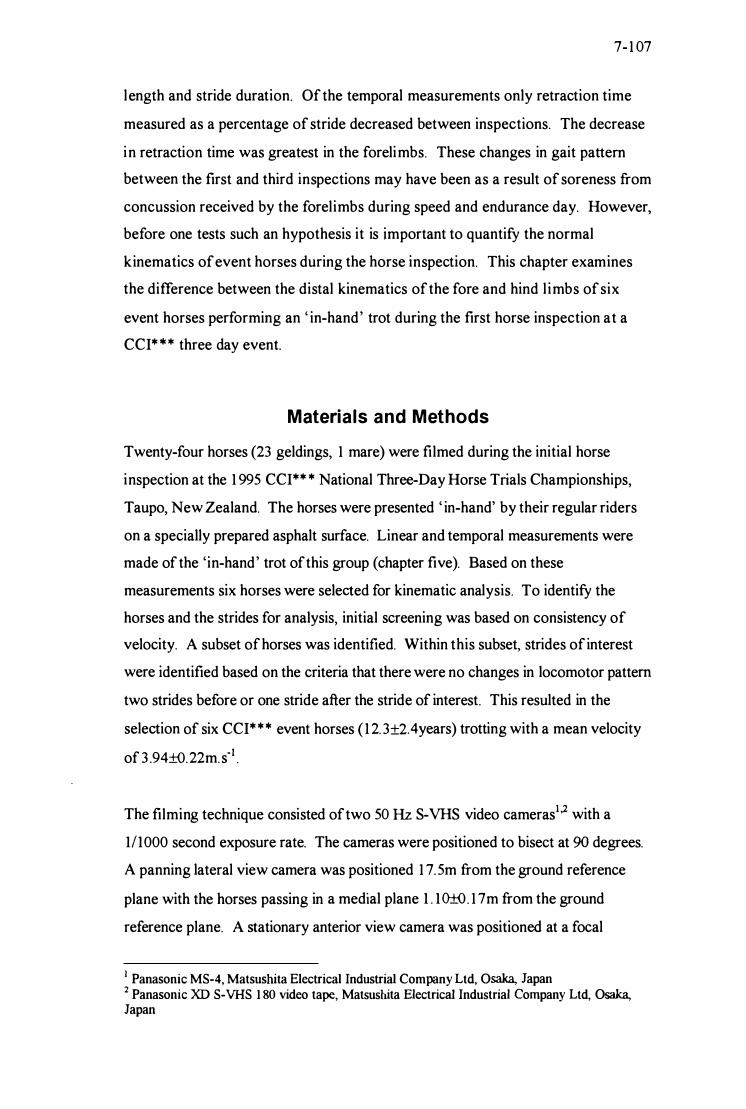
7-1 07
length and stride duration. Of the temporal measurements only retraction time
measured as a percentage of stride decreased between inspections. The decrease
in retraction time was greatest in the forelimbs. These changes in gait pattern
between the first and third inspections may have been as a result of soreness from
concussion received by the forelimbs during speed and endurance day. However,
before one tests such an hypothesis it is important to quantify the normal
kinematics of event horses during the horse inspection. This chapter examines
the difference between the distal kinematics of the fore and hind l imbs of six
event horses performing an ' in-hand' trot during the first horse inspection at a
CCI*"'* three day event.
Materials and Methods
Twenty-four horses (23 geldings, 1 mare) were filmed during the initial horse
inspection at the 1 995 CCI** * National Three-Day Horse Trials Championships,
Taupo, New Zealand. The horses were presented ' in-hand' by their regular riders
on a specially prepared asphalt surface. Linear and temporal measurements were
made of the 'in-hand' trot of this group (chapter five). Based on these
measurements six horses were selected for kinematic analysis. To identify the
horses and the strides for analysis, initial screening was based on consistency of
velocity. A subset of horses was identified. Within this subset, strides of interest
were identified based on the criteria that there were no changes in locomotor pattern
two strides before or one stride after the stride of interest. This resulted in the
selection of six CCI*** event horses (1 2. 3 ±2.4years) trotting with a mean velocity
of3 .94±O.22m.s·l .
The filming technique consisted of two 50 Hz S-VHS video cameras1,2 with a
111000 second exposure rate. The cameras were positioned to bisect at 90 degrees.
A panning lateral view camera was positioned 1 7. 5m from the ground reference
plane with the horses passing in a medial plane 1 . 1 O±O . 1 7 m from the ground
reference plane. A stationary anterior view camera was positioned at a focal
I Panasonic MS-4, Matsushita Electrical Industrial Company Ltd, Osaka, Japan 2 Panasonic XD S-VHS 1 80 video tape, Matsushita Electrical Industrial Company Ltd, Osaka, Japan
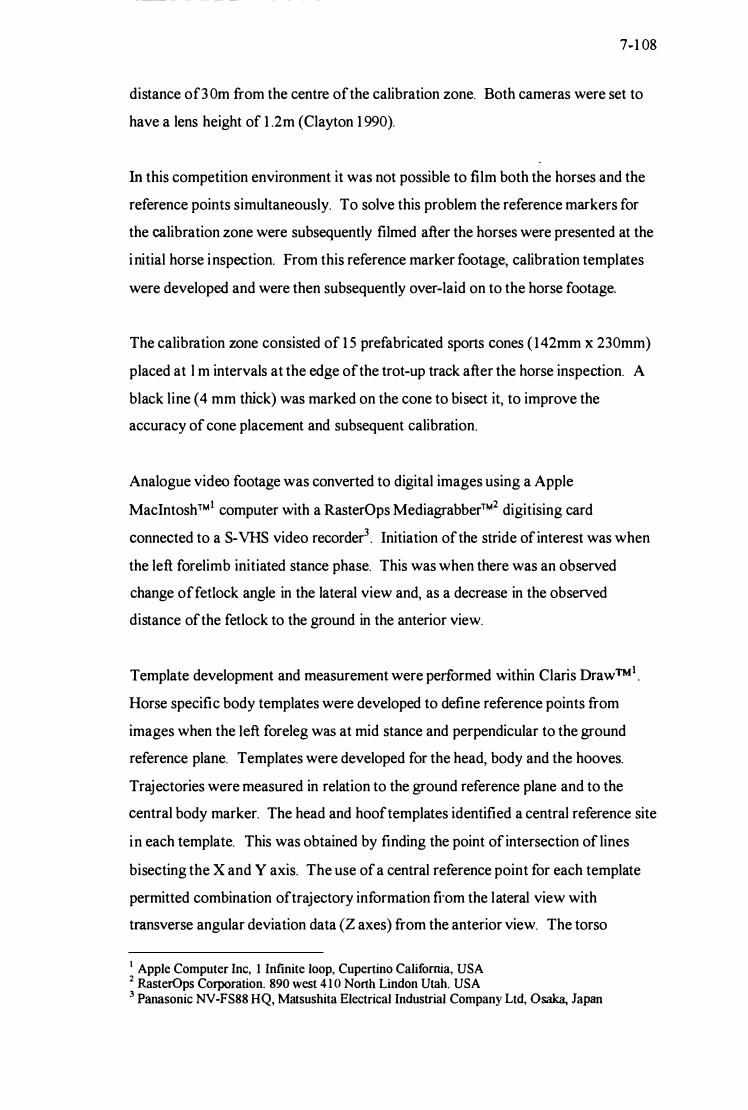
7-1 08
distance of3 0m from the centre of the calibration zone. Both cameras were set to
have a lens height of 1 .2m (Clayton 1 990).
In this competition environment it was not possible to film both the horses and the
reference points simultaneously. To solve this problem the reference markers for
the calibration zone were subsequently filmed after the horses were presented at the
i nitial horse inspection. From this reference marker footage, calibration templates
were developed and were then subsequently over-laid on to the horse footage.
The calibration zone consisted of 1 5 prefabricated sports cones ( I 42mm x 230mm)
placed at l m intervals at the edge of the trot-up track after the horse inspection. A
black line (4 mm thick) was marked on the cone to bisect it, to improve the
accuracy of cone placement and subsequent calibration.
Analogue video footage was converted to digital images using a Apple
MacIntosh™1 computer with a RasterOps Mediagrabber™2 digitising card
connected to a S-VHS video recorder3 . Initiation of the stride of interest was when
the left forelimb initiated stance phase. This was when there was an observed
change offetIock angle in the lateral view and, as a decrease in the observed
distance of the fetlock to the ground in the anterior view.
Template development and measurement were performed within Claris DrawN1 .
Horse specific body templates were developed to define reference points from
images when the left foreleg was at mid stance and perpendicular to the ground
reference plane. Templates were developed for the head, body and the hooves.
Trajectories were measured in relation to the ground reference plane and to the
central body marker. The head and hoof templates identified a central reference site
in each template. This was obtained by finding the point of intersection of lines
bisecting the X and Y axis. The use of a central reference point for each template
permitted combination oftrajectory information from the lateral view with
transverse angular deviation data (2 axes) from the anterior view. The torso
I Apple Computer Inc, 1 Infinite loop, Cupertino California, USA 2 RasterOps Corporation. 890 west 4 10 North Undon Utah. USA 3 Panasonic NV-FS88 HQ, Matsushita Electrical Industrial Company Ltd, Osaka, Japan

7-1 09
template reference point was designed to represent the stationary horses centre of
mass (Sprigings and Leach 1986; van den Bogert A J 1 989). The torso Y co
ordinate was a location that bisected a line drawn from the point of the withers to
the sternum. The X axis location was the point 1/3 the distance from the point of
shoulder (cranial part of greater tuberosity of humerus) to the point of buttock
(tuber ischii). An outline of the torso was combined with the reference grid to
provide a mechanism for consistent placement.
A 1 m x 1 m calibration board was used to derive equations to correct for differences
in focal distance. For the lateral view, calibration templates were developed from
the ground reference marker footage. The calibration templates were then over-laid
on to the frames containing the strides of interest.
To minimise the possibility of measurement bias for each field three separate
measurements were made of the co-ordinates in both the fields of view.
The absolute difference in timing between the lateral and anterior cameras could
be as large as 6 .8%. It is believed that this potential error is primarily a product
of the low sampling rate (50Hz) a camera synchronising mechanism may have
contributed in reducing the maximum potential temporal error associated with
combining trajectory data from the two camera sources.
The inability to accurately determine the focal distance for the anterior camera
l imited the spatial information that this view could provide. Length measurements
could not be made from this view. However an acceptable level of precision was
possibly with the angle measurements. Parallax error was not found to contribute to
distortion of the angle measurements in the anterior view. Maximum error in angle
measurement was estimated to be 1 .07 degrees. Perspective errors were estimated
by use of a 1 m x 1 m calibration board. Correction factors were derived to solve for
differences in focal distance between the horse's path of progression and the sagittal
plane of the reference markers.
I ClarisDmw, Claris Corpomtion, 520 1 Patrick Henry Drive, Santa Clara, Claifomia, USA
7-1 1 0
Raw data points were transformed using a customised macro within MS Excel.
These data points were then smoothed with a generalised cross-validated quintic
spline (Woltring H J 1 986) and normalised using the numerical differentiation
software QuickSAND (Walker J A 1 997).
Statistical analysis
A general factorial 1inear model was used to test for differences between variables.
In the models, leg pair code (forelimb or hind limb ) was included as a fixed effect
and horse identification was included as a random effect. Statistical tests were
performed using SPSSTM version 8 .01 1 .
1 SPSS Inc, Chicago, Illinois, USA

7-1 1 1
Results .
Table 7-1 Temporal descriptive stride statistics of the preliminary inspection for the fore- and hindlimb pairs (mean±standard deviation, n=6).
Forelimbs Hind limbs SignifICance
Stride duration (ms) 646±26 666±23 nls
Stance duration (ms) 2 1 5±19 205±1 9 nls
Stance duration (010)·
3 3.24±2.58 30.97±2.93 nls
Swing duration (ms) 43 1±23 461±18 P<O.OI
Swing duration (%) 67.02±2.35 69.28±2.34 nls
Retraction (ms) 70±1O 58±5 P<O.OOl
Retraction (%)*
lO.50±1 .48 8 .74±1 .63 P<O.OOI
Note these variables are measured as a percentage of total stride duration.
Differences were observed between the temporal values of the fore- and hindlimb
pairs (Table 7- 1 ). Significant differences were only found for the swing phase
measurements. These included swing duration (ms) and for retraction when
measured as either mil l iseconds or as a percentage of total stride duration.
Table 7-2 Maximum displacement variables in the preliminary inspection for range of movement for the fore and hind limb pairs (mean±standard deviation, n=6)
X: Horizontal (m)
Y: Vertical(m)
Z: Angle (degrees)
Forelimbs
1 . 129±O. 1 03
O .2 1 7±O.027
7.4±2.4
Hind limbs Significance level
1 . 1 08±O.05 P<O.09 1
O. 1 56±.0 1 8 P<O.OO I
8 . 1 ±3 . 5 nls
Significant differences were found between the fore-and the hindlimb pairs for
the range of movement in the horizontal and vertical axis . The forelimbs had a
larger range of movement in the vertical and horizontal plane but it was the hind
l imbs that had the greatest degree of medial to lateral movement in the anterior
view.
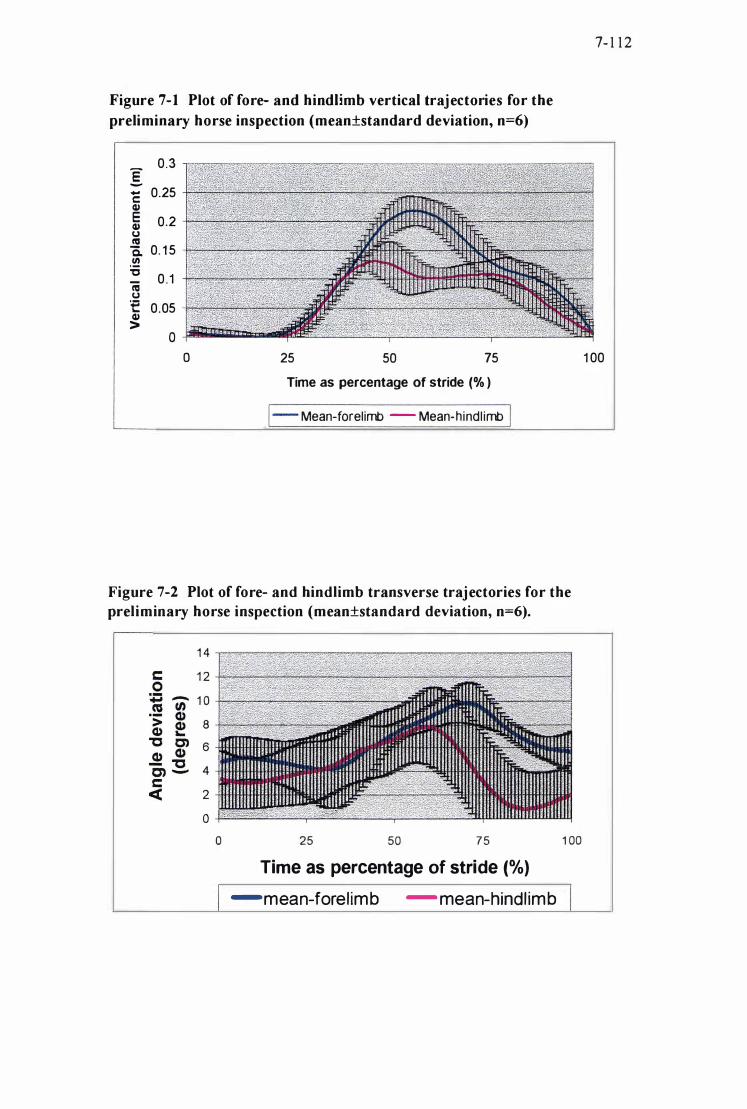
Figure 7- 1 Plot of fore- and hind limb vertical trajectories for the
preliminary horse inspection (mean±standard deviation, n=6)
_ 0.3 .s c 0.25 QI � 0.2 u ca Q. 0. 1 5 .� � 0 . 1 u t 0.05 QI >
o 25 50 75
Time as percentage of stride (% )
1- Mean-forelimb - Mean-hindl imb 1
Figure 7-2 Plot of fore- and hindlimb transverse trajectories for the
preliminary horse inspection (mean±standard deviation, n=6).
o 25 50 75 1 00
Time as percentage of stride (%)
-mean-forelim b - mean-hindl im b
7- 1 1 2
1 00
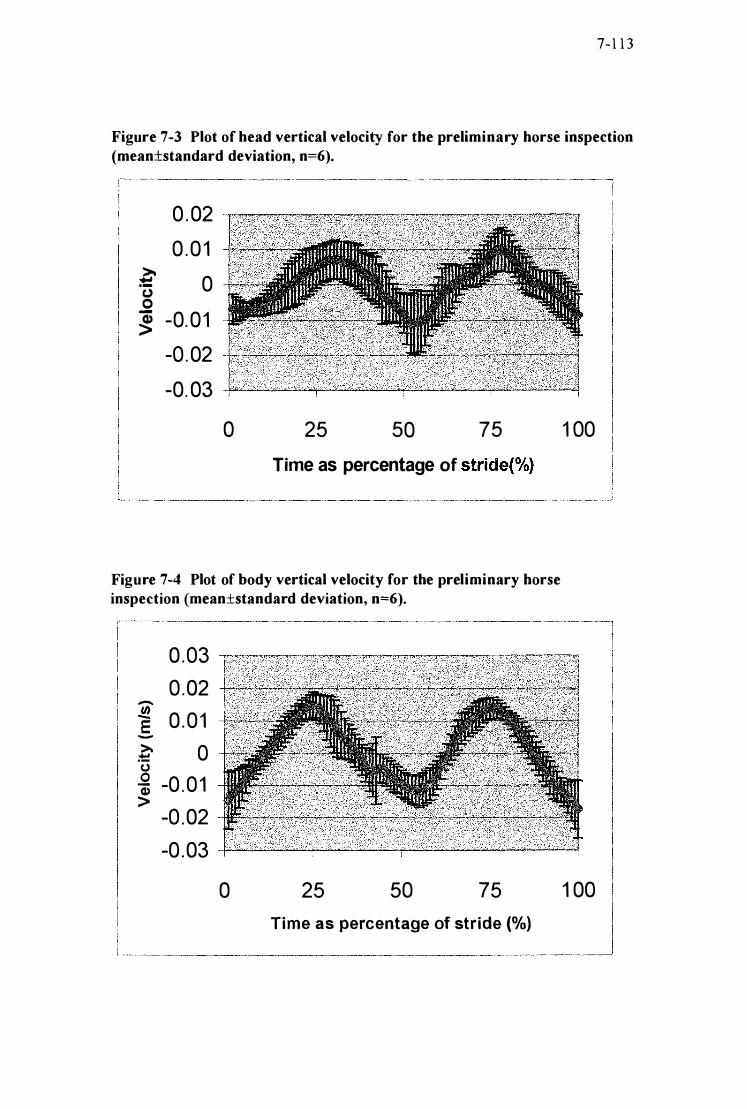
7- 1 1 3
Figure 7-3 Plot of head vertical velocity for the preliminary horse inspection (mean±standard deviation, n=6).
0 . 02
0 . 0 1
� 0 to) .2
-0. 0 1 � -0 . 02
-0. 03 I
0 25 50 75 1 00
Time as percentage of stride{%)�
Figure 7-4 Plot of body vertical velocity for the preliminary horse inspection (mean±standard deviation, n==6).
0.03
0 .02 -th
0 . 0 1 -E ->. 0 ;t:! (.) 0 -0 . 0 1 Q; >
-0 .02
-0 .03
0 25 50 75
Time as percentage of stride (%)
1 00

Table 7-3 Mean displacement variables for the head (mean±standard deviation, n=6)
7- 1 14
Length- (m) Vertical (m) Transverse Angle
(degrees)b
..................................................................... .., ..... _ ...................................................................................................................................................... ., ........ " ...................... _ .. _ .................... _ ................. u .. _ ...... _ ............................... _ ... _ ........................... _ .. __ .... ..
Maximwn 1 .23 l±O.0604 1 . 752iO.090 96.97±l9.33
Minimwn Range of motion
1 . 177iO.076
O.053iO.018
1 .670iO.087
O.082iO.013
85.365±l7.5806
1 1 .606±3.47
Note ". This measurement is the distance from torso body marker to the head body marker.
b This measurement is the anterior view angle from the torso marker to the head marker. 90
degrees represents the head held directly in the same plane as the centre of the torso.
Head position was relatively constant throughout the stride for the length and
vertical measurements (Table 7-3). However, there was greater than expected
transverse movement of the head throughout the stride cycle.
Table 7-4 Mean displacement variables for the central torso marker (mean±standard deviation, n=6)
Maximum vertical displacement
Minimwn vertical displacement
Vertical range of movement
Vertical (m)
l .339iO.039
1 .243iO.037
O.096iO.OI8
Vertical deviation of the central torso marker (Table 7 .4) was similar to the
vertical deviation of the head (Table 7-3) as anticipated. The velocity curves of
the body and head were also similar (Figure 7-3 , 7-4).
The forelimbs exhibited a greater vertical displacement than the hindlimbs
(O.06 1 ±O .004, p<O.OOI ) and achieved their peak vertical displacement later than
the hindl imbs (7±O .69 1%) (Figure 7-2, Table 7-2). In contrast to the timing of
the vertical maximum, there is large variation in the timing of the maximum
deviation from the median line (Figure 7-2). There was no significant difference
between forelimbs and hindlimbs for maximum deviation from the median l ine
or time of maximum deviation from the median line.
Differences in the timing of the hoof maximum values for the Y (vertical) and Z
(transverse) axes was examined with a paired students t�test. Significant

differences were found between the time of the two maxima (-5 .3472± l O. l 58 1 ,
p<O.OO l ) .
Table 7-5 Standardised displacement and timing measurements. All temporal values have been standardised for onset of stance phase as the
initiation of the stride (mean±standard deviation, n=6).
Limb Variable Vertical displacement Z max (degrees from
(m) median line) Left Maximum value O.2 1 9±<>.O25 9. 1 2±1.62
forelimb % of stride time at maximum 55.38±2.72 62.22±8.43
Right Maximum value O.223±<>.O29 5.763±2.048
forelimb % of stride time at maximum 52.88±5.46 54.83±1 5 . 30
Left Maximum value O . 1 69±<>. O lO 7.89±3.67
hindlimb % of stride time at maximum 49. 3 8± 1 . 88 55.33±5.83
Right Maximum value O. 1 54±<>.O24 8.40±3 . 1 1
hindlimb % of stride time at maximum 44.88± 1 . 99 53.27±9.20
Minimum horizontal velocity occurred during the stance phase and was not
significantly different between the fore- and hindlimbs but did differ in the time
of minimum velocity occurrence (p<O.05). This could be a real difference but
also may be a reflection of the system's background measurement error.
Maximum longitudinal velocity was also similar between fore -and hindlimbs but
did differ in the timing of the maximum. Maximum longitudinal velocity
occurred earlier in the hindlimbs but again then� was variation in the timing.
Vertical velocity differed between the fore- and hindlimbs for all variables
measured. Forelimbs reached both the minimum and maximum values earlier in
the stride than the hind limbs. For both the fore- and hindlimbs maximum
vertical velocity occurred prior to maximum longitudinal velocity.
Relatively large standard deviations were again observed for the transverse axis.
Minimum velocity (maximun adduction) was observed in the later stages of the
stride. This minimum occurred later in the stride for the forelimb than the
hindlimb. In the forelimbs maximum transverse velocity was observed as the
l imb was being abducted prior to the maximum vertical velocity.

7- 1 1 6
Table 7-6 Standardised velocity and timing measurements. All temporal values standardised for onset of stance phase as the initiation of the stride (mean±standard deviation, n=6).
Horizontal velocity Forelimbs Hindlirnbs Significance --_· __ ·····_·······················T·················· .. __ ....... _ ......... _ .. _ .......... _ .. _ ...• _ ............... _ ..... _ ... __ .. _ .. _ .. _-_._-_.-_ .. __ .. _._._._--
Minimum Value (m.s· ) -O.42±O.67 -O.40±O.37 nls
MiD value timing 16.72±lO.90 7.77±12.49 P<O.05
Maximum Value (m.s·l )
Max Value timing·
Vertical velocity
Minimum Value (m.s·l)
MiD value timing·
Maximum Value (m.s·l )
Max Value timing·
Transverse velocity
Minimum Value (o.S·I)
MiD value timing·
Maximum Value (o.S·l )
Max Value timing·
6.55±O.66
63 . 50±l 1 . 5 1
- l .O6±O.34
93 .05±l 1 . 20
1 . 14±O. 1 9
40. 1 9±2.68
-2 1 .46± 1 3 .22
86. 16±12.38
24.0H12.88
4 1 .55±1O.78
6.58±O.96 nls
56.61±7.8 1 P<O.05
-O.85±O.26 P<O.OOl
92 . 94±5 .49 nls
1 . 20±O. 1 8 P<O.05
36.44±3 . 87 P<O.OOl
-45.93±l 7.3 1 P<O.OOl
77.63±1O.63 P<O.OOl
27.5H8.20 nls
38. 1 3±12.93 nls
Note. ·Tirning values are measured as a percentage of standardised stride time with stride starting
at onset of stance phase.
Minimum and maximum acceleration for both the fore and hindlimbs occurred at
similar times during the stride. Minimum horizontal acceleration was in the last
quarter of the stride whereas maximum acceleration occurred at approximately
40% of stride time before the maximum for horizontal velocity.
Maximum vertical acceleration occurred before the horizontal maximum but
timing between fore- and hindlimbs was not significantly different. Vertical
acceleration was significantly larger in the hindlimbs in contrast to acceleration
in the other two axis were there was not a significant difference in maximum
acceleration.
S imilar to the velocity measurements the acceleration for the medial lateral
deviation had the minimum value in the later part of the stride during abduction
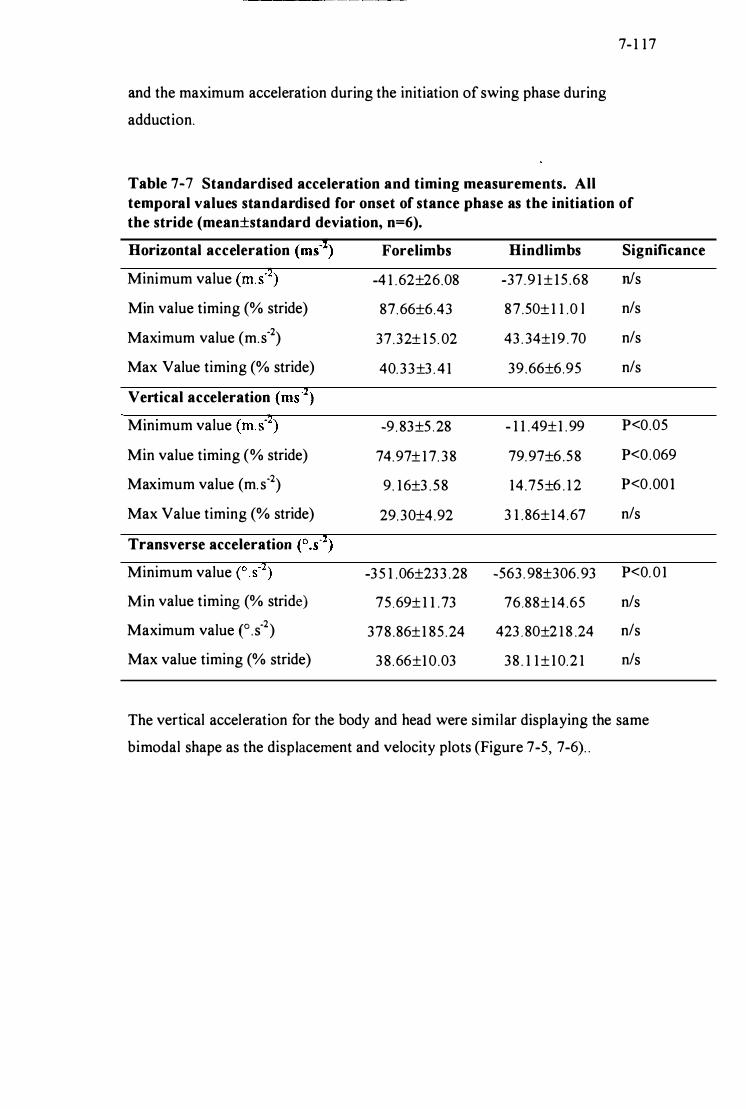
----------- �- - -
and the maximum acceleration during the initiation of swing phase during
adduction.
Table 7-7 Standardised acceleration and timing measurements. All
7- 1 1 7
temporal values standardised for onset of stance phase as the initiation of the stride (mean±standard deviation, n=6).
Horizontal acceleration (ms'!) Forelimbs Hindlimbs Significance
Minimum value (m.s·2) -4 1 .62±26.08 -37.9 1 ± 1 5 .68 n/s
Min value timing (% stride) 87.66±6.43 87 .50± 1 1 .O l n/s
Maximum value (m.s'2) 37 .32± 1 5 . 02 43 . 34±19 .70 n/s
Max Value timing (% stride) 40.33±3 .4 1 39 .66±6.95 n/s
Vertical acceleration (ms·2)
Minimum value (m.s':!) -9 . 83±5 .28 - 1 1 .49± 1 . 99 P<O.05
Min value timing (% stride) 74.97± 1 7. 38 79.97±6 .58 P<O.069
Maximum value (m. s 02) 9. 16±3 . 58 14 .75±6 . 1 2 P<O.OO I
Max Value timing (% stride) 29.30±4.92 3 1 . 86±1 4.67 n/s
Transverse acceleration (o.s·l) Minimum value e.s·2) -3 5 1 .06±233 .28 -563 . 98±306. 93 P<O. O l
Min value timing (% stride) 75 .69± 1 1 .73 76.88±14.65 n/s
Maximum value e.s·2) 378 .86±1 85 .24 423 . 80±2 1 8 .24 n/s
Max value timing (% stride) 3 8 .66±1 O.03 38 . 1 1± 1O.2 1 nJs
The vertical acceleration for the body and head were similar displaying the same
bimodal shape as the displacement and velocity plots (Figure 7-5, 7-6) . .
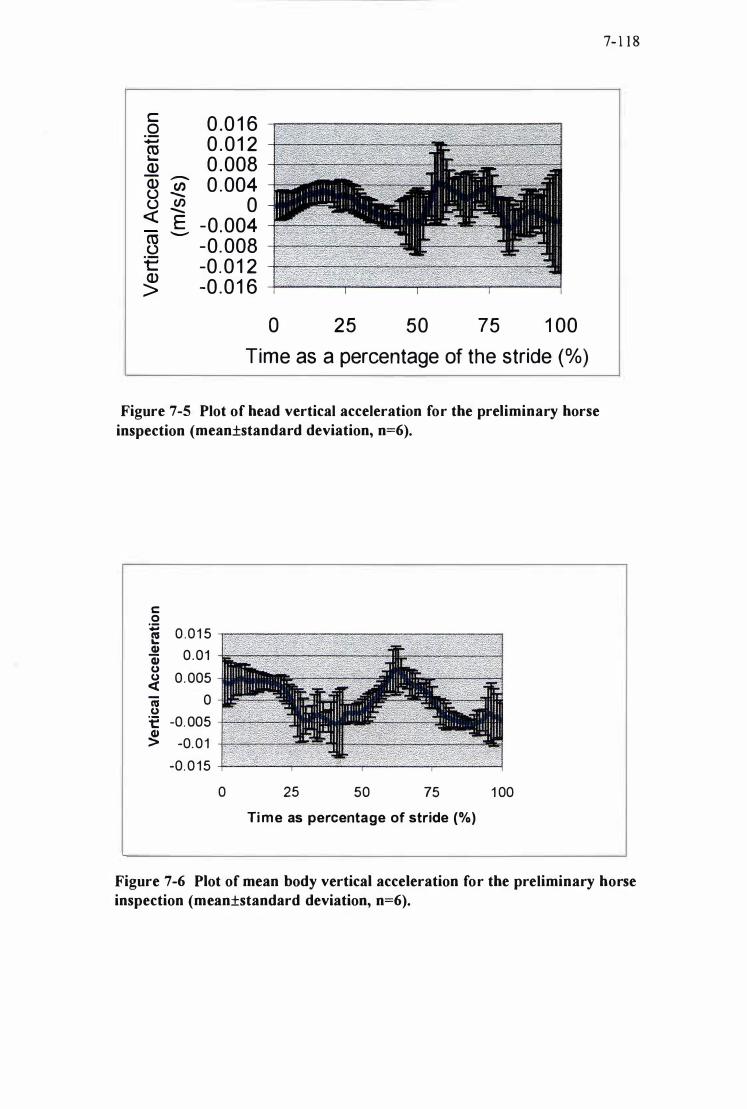
§ 0 .0 1 6 � 0 . 0 1 2 Q) 0 .008 Q) en 0 .004 t) -t) .!!!. 0 <t: S -0 .004 � -0 .008 t -0 . 0 1 2 � -0 .0 1 6
o 25 50 75 1 00
Time as a percentage of the stride (%» Figure 7-5 Plot of head vertical acceleration for the preliminary horse
inspection (mean±standard deviation, n=6).
c 0 .. 0 . 0 1 5 I.! Cl) 0.01 a; (J 0. 005 (J � ca 0 (J :e -0. 005 Cl) > -0. 0 1
-0. 0 1 5 0 25 50 75 1 00
Ti me as percentage of stride (%)
7- 1 1 8
Figure 7-6 Plot of mean body vertical acceleration for the preliminary horse inspection (mean±standard deviation, n=6).
7-1 19
Discussion
The vertical and horizontal range of motion in this study were consistent with
previous findings in warmblood horses (Back 1 994; Holmstrom et al. 1 994). The
horizontal and vertical displacements were greater than those found for Dutch
warmblood horses on a treadmil l and were in close agreement with the
trajectories reported for Swedish warmbloods. This result was unexpected. The
expectation was that the horses would have had a longer lower trajectory as the
thoroughbred has often being described as has a long low gait or "daisy cutter
style" and that the event horses in this study were presented on an asphalt
surface. Temporal analysis of the preliminary inspection had identified the event
horses were taking longer than expected stride lengths considering presentation
was on an asphalt surface (Chapter Five). A breed effect was proposed as a
contributing factor to this as the event horses tend to be thoroughbred or of
thoroughbred somatotype, However, as previously mentioned if it were solely
due to a breed effect then the vertical displacement value would be expected to
be less than that observed for the warmblood type horse which is bel ieved to
have a rounder and higher knee action.
A possible explanation for the greater displacement may be found in the
presentation of the horses for the horse inspection. Many riders make a
conscious effort to present the horses at the inspection trotting "freely" in-hand.
Before the inspection many riders work-in their horses to ensure they are
thoroughly warmed up. At the preliminary inspection the horses are also very fit
and fresh in preparation for the demands of speed and endurance day and this
may be translated into a trot that is more exuberant than normal . Evidence for
this can be found by comparison of the vertical displacement of the body marker
and the vertical displacement of the withers measured in Dutch warmblood
horses on a treadmill, rubber surface and asphalt (Buchner et al. 1 994). The
event horses had a vertical displacement ofO.096±O .OI 8m, whereas in the Dutch
study the vertical displacement ranged from O .06 1±O .O I 7 to O.079±O .008m. In a
less tense environment and when not at the peak of fitness these horses would
probably display a trot with reduced displacement.

7- 1 20
One of the objectives of training the horse for dressage is to teach the horse to
work in a balanced fashion with engagement of the hind l imbs (Crossley, A.
1 993). Previous temporal analysis of the preliminary horse inspection had
identified that the hindlimb initiated stance first of the diagonal l imb pairs. This
was believed to represent the engagement of the hind legs (Chapter Five).
Another pattern used to recognise this is that the forelegs should describe a larger
trajectory than the hind legs (Paalman 1 988) and has been observed in elite
Swedish warmblood stallions (Holmstrom et al. 1 993). This was observed in this
sample of three day event horses and may represent the level of dressage training
attained by these horses. The larger displacements of the forelimbs may also
indicate that the horse used for CCI*'" '" eventing do not have the long low gait so
often used to describe the thoroughbred action. It is often said that when
selecting a jumping horse it is preferable to have a horse that has Ha bit of knee
action" (Steinkraus 1 987). Because of this riders may have selected for horses
that had a larger forelimb hoof trajectory.
In contrast to the larger displacement of the forelimbs in the horizontal and
vertical axes there was larger displacement in the transverse plane of the
hindlimbs which may have been a necessity to avoid brushing of the hind l imbs.
Trotting wide behind (excessive lateral movement of the distal hind l imb during
progression) is commonly thought of as a fault of movement and / or training
(Klimke 1 985) . Horses that normally move well will trot "wide behind" when in
an excited state. Similar to the larger than expected vertical displacement the
larger than expected transverse displacement may also be due to the horses
becoming tense with the competition environment and exuberance from being
very fit.
The issue of how much transverse swing is normal and what constitutes poor
movement has not been defined with gait analysis. Certainly sport horses and
dressage horses in particular are generally selected to have "straight movement" .
In this study during protraction of the limb, adduction and then abduction of the
l imb were observed. Perspective error while small may have contributed to this
observation due to the protracting l imb having a reduced distance between the
central body marker and hoof marker. The reduced distance can have a
7- 1 2 1
distorting effect on the true angular displacement and provide a positive bias in
the abduction measurements. In human gait abduction and adduction of the l imb
are one of the mechanisms used to minimi se the amount of displacement of the
centre of mass (Saunders et al. 1953). In horses it has been observed that the
height of the withers during the trot is lower than the height of the withers when
the horse is stationary (Back 1 994). The use of adduction and abduction during
protraction and placement of the limb under the median line of the horse is one
of the mechanisms to achieve this . While tension of the horses in this study and
measurement technique may account for some of the observed adduction and
abduction, a limited amount of transverse movement during l imb progression
may be required. Limited transverse deviation in equine gait must be an
inevitability of the initial forces that act on the distal limb during progression.
Conclusion:
The larger than expected trajectories for the fore and hindl imbs in this sample of
event horses may have been due to tension due to the fitness level of the horses
and the competition atmosphere. It is also possible that the horses used for
eventing in New Zealand even though are thoroughbred or of thoroughbred
somatotype doe not display the long low gait often used to describe the
thoroughbred action. These factors must be taken into consideration by the
inspection panel when assessing the horses.

References
Back W. 1 994 Development of equine locomotion from foal to adult. PhD Thesis . Utrecht University.
7- 1 22
Back W, Schamhardt H C, Hartman W and Barneveld A ( 1 995) Kinematic differences between the distal portions of the forelimbs and hind l imbs of horses at the trot. American Journal of Veterinary Research 56, 1 522-8.
Buchner H H F, Savelberg H H, Schamhardt H C, Merkens H W and Barneveld A ( 1994) Kinematics of treadmill versus overground locomotion in horses. The Veterinary Quarterly 16, 87-90.
Clayton H M ( 1 990) Gait evaluation: Making the most of your home video system. Proceedings of the 36th American Association of Equine Practitioners. 447-55 .
Crossley A, 1 993 Training the young horse: the first two years, 10th edition. Stanley Paul & Co. Ltd, London.
Holmstrom M, Fredricson I and Drevemo S ( 1 993) Biokinematic analysis of the Swedish warmblood riding horse at trot. Equine Veterinary Journal 26, 235-40.
Holmstrom M, Fredricson I and Drevemo S ( 1 994) Biokinematic differences between riding horses judged as good and poor at the trot. Equine Veterinary Journal Supplement 17, 5 1 -6.
Klimke R, 1 985 Basic training of the young horse. J A Allen, London.
Paalman A, 1 988 Training Show jumpers. J A Alien, London.
Saunders J B D, Inman V T and Eberhart H D ( 1953) The major determinants in normal and pathological gait. The Journal of Bone and Joint Surgery 35-A, 543-558 .
Sprigings E J and Leach D H ( 1 986) Standardised technique for determining the centre of gravity of body and limb segments of horses. Equine Veterinary Journal 18, 43-49.
Steinkraus W. Evaluating the jumper. L ' Annee Hippique 1986 / 1987. Nederlands drukkerij BedrijfB .V, Zoeterwoude, The Netherlands, 1987:429-3 1 .
van den Bogert A J. 1 989 Computer simulation of locomotion in the horse. PhD Thesis. University of Utrecht.
Walker J A. QuickSAND. Quick smoothing and numerical differentiation for the Power Macintosh. version 006. 1 997.

7- 1 23
Woltring H J ( 1986) A fortran package for generalized, cross-validatory spl ine smoothing and differentiation. Advances in Engineering Software 8, 1 04-1 07 .
8- 1 24
Chapter 8 Comparison of the Kinematics of the t rot i n three d ay event horses between the first and third horse
i nspections at a CCI*** three day event.

8- 125
Abstract
The kinematics of the trot of a group of six event horses ( l2 .3±2.4 years) during
the first and third horse inspections at a CCI*"'* three day event competition
were compared. The horses trotted with a mean velocity of 3 . 94±O.22m.s·1
during the first inspection and 4. 1 4±O. 1 5m.s'1 during the third inspection. During
the third inspection a greater range of motion was observed in the hoof
trajectories. The horses carried their heads higher during the third inspection
( 1 .752±O.090m vs 1 .796±O.09 1 m, P<O.05) possibly to reduce the minimum
vertical acceleration on the forelimbs (-9. 83±5 .28m.s·2 vs -9.09±3 . 1 7m.s·2,
P<O.05).
S ignificant differences were found for most variables between inspections.
However, the differences were not large, indicating that the effect of the exertion
of speed and endurance day on the kinematics of this group of horses was subtle.
I ntrod uction.
Horse inspections are an integral part of any three-day event competition. Three
inspections are performed during the competition. The first inspection is on day
one prior to the dressage. The second inspection takes place on day 2 (speed and
endurance day) at the end of phase C. A third inspection is performed on the
morning of day 3 prior to the show jumping. Both the first and third veterinary
inspections are performed using a standardised format with the horses trotted up
on a firm, level surface (Anon 1 998). Examination of the linear and temporal
patterns of three day event horses during the first (Chapter Five) and first and
third horse inspections (Chapter Six) has been performed. However, to date
examination of the changes in the kinematics of the trot of event horses between
the first and third horse inspections has not been performed.
In Dutch warmblood horses the differences between the kinematics of the
forelimbs and hindlimbs have been proposed as a contributing factor for the
8- 1 26
greater incidence of lameness seen in the forelimbs rather than the hindlimbs
(Back et al. 1 995).
In previous studies of three day event horses at the horse inspection, horse
specific temporal patterns were identified (Chapter Five). These temporal
patterns were consistent between the first and third horse inspections after the
horses had completed speed and endurance day (Chapter Six). Between the first
and third inspection the horses had a decrease in stride length and stride duration.
Of the temporal measurements only retraction time measured as a percentage of
stride decreased between inspections. The decrease in retraction time was
greatest in the forelimbs. This may have been as a result of the increased
concussion received by the forelimbs during speed and endurance day. This
paper examines the changes in the kinematics of the fore- and hind limbs of six
event horses performing an ' in-hand ' trot during the first and third horse
inspections at a CCI** * three day event.
Materials and Methods
Twenty-four horses (23 geldings, 1 mare) were filmed during the initial horse
inspection at the 1 995 CCI** * National Three Day Horse Trials Championships,
Taupo, New Zealand. The horses were presented ' in-hand' by their regular riders
on a specially prepared asphalt surface. Linear and temporal measurements were
made of the ' in-hand' trot of this group (Chapter six). Based on these
measurements, 6 horses were selected for kinematic analysis. To identity the
horses and the strides for analysis, initial screening was based on the consistency of
velocity during each inspection and between the inspections. A subset of horses
was identified. Within this subset, strides of interest were identified based on the
criteria of that were no changes in locomotor pattern two strides before or one stride
after the stride of interest. This resulted in the selection of six CCI*** event horses
( 12.3±2.4years) trotting with a mean velocity of3 .94±O.22m.s-1 for the first
inspection and 4. 14±O. 1 5m.s-1 for the third inspection.
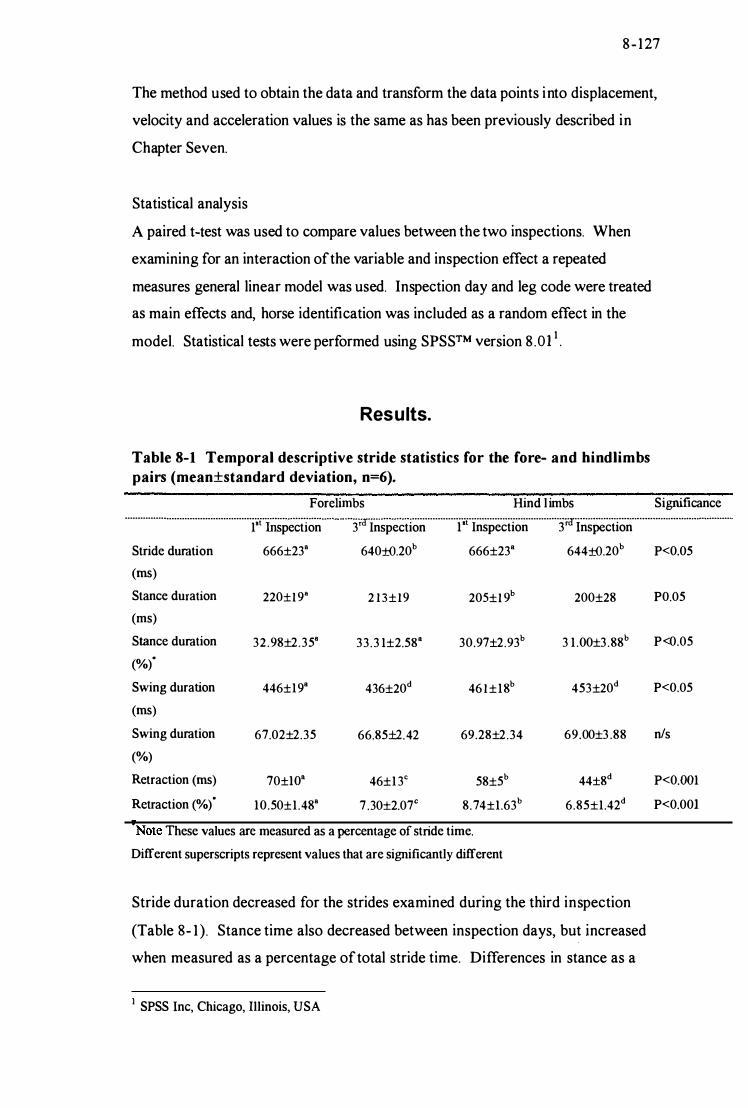
8-127
The method used to obtain the data and transform the data points into displacement,
velocity and acceleration values is the same as has been previously described in
Chapter Seven.
Statistical analysis
A paired Hest was used to compare values between the two inspections. When
examining for an interaction of the variable and inspection effect a repeated
measures general linear model was used. Inspection day and leg code were treated
as main effects and, horse identification was included as a random effect in the
model. Statistical tests were performed using SPSSTM version 8 .0 } 1 .
Results.
Table 8-1 Temporal descriptive stride statistics for the fore- and hindlimbs pairs (mean±standard deviation, n=6).
Forelimbs Hind l imbs Significance ...................................................... ····································nr················· ...................................................... ·····nr················································ •............
1st Inspection 3 Inspection l"t Inspection 3 Inspection
Stride duration 666±238 640±O.20b 666±238 644±O.20b P<O.OS
(ms) Stance duration 220±1 9" 2 1 3±19 205±1 9b
(ms)
Stance duration 32. 98±2.3S8 33 .3 1±2.588 30.97±2.93b
(0/0)"
Swing duration 446±1 98 436±20d 46 1±18b
(ms) Swing duration 67.02±2.35 66.85±2. 42 69.28±2.34
(0/0)
Retraction (ms) 70±lO· 46±1 3c 58±5b
Retraction (0/0)'
lO.50±1.48" 7 .30±2.07c 8.74±1.63b 'Note These values are measured as a percentage of stride time.
Different superscripts represent values that are significantly different
200±28
3 1 . OO±3 . 88b
453±20d
69.00±3 .88
44±8d
6.85±1.42d
Stride duration decreased for the strides examined during the third inspection
(Table 8- 1 ). Stance time also decreased between inspection days, but increased
when measured as a percentage of total stride time. Differences in stance as a
1 SPSS Inc, Chicago, Illinois, USA
PO.05
P<O.05
P<O.05
nls
P<O.OOl
P<O.OOI

8- 1 28
percentage of stride were only found between the fore and hindl imb pairs.
Retraction when measured as time and as a percentage of stride duration
decreased on the third inspection. Consistently across inspections, retraction
time and its percentage of stride was greater in the forelimbs than the hindlimbs.
Table 8-2 Mean displacement of hooves for range of movement for the foreand hindlimb pairs (mean±standard deviation, n=6)
Longitudinal
(m)
Vertical(m)
Transverse
Angle
(degrees)
Forelimbs
1st Inspection
1 . 1 29±O. 1038
O.2 1 7±O.O27·
7. 4±2.4"
3rd Inspection
1 . 1 90±O. 104c
O.235±O.023c
5.6± 1 . 4b
Hind limbs
l,t Inspection 3id Inspection
1 . l0S±O.OSb 1 . 1 3 0±O.OSd
O. 1 56±.OOlSb O . l S7±O.03Sd
S. l±3 S 8.0±2.3c
Different superscripts represent values that are significantly different.
Significance
level
P<O.OS
P<O.OOl
P<O.OS
In the longitudinal and vertical axes, a greater range of motion was observed
during the third inspection than during the first inspection. In contrast, the
transverse range of motion decreased from the first to the third inspection.
Range of motion was consistently greater across days in the forelimbs than the
hindl imbs for the longitudinal and vertical measurements. In contrast, the
transverse deviation of the range of motion was greater in the hindlimbs.
Table 8-3 Mean displacement variables for the head (mean±standard deviation, n=6)
Length" (m) Vertical (m) Transverse Angle (degrees) ···············································1.(""························j·r(!····························j"sr··························ji'd········ .. ·········· .. ······l"ii·············· .. ·· .. ·······3r;r····· .. ·····
Inspection Inspection Inspection Inspection Inspection Inspection
Maximum L23 1 ±O.060 1 .250±O.O9 l .752±O.090a 1 .796±O.091 b 96.97±19.338 84.00±12.32b
Minimum 1 . 1 77±O.076 1 .209±O.O825 1 .670±O.08r 1 .6965±O.09b 85.36±17.S8a 76.59±1O. 12b
Range of O.OS3±O.O I 8 O.05±O.O I S O.082±O.013a O.099±O.0 1 3b 1 1 .60±3.47 9.44±4.21
motion
a Note. This measurement is the distance from torso body marker to the head body marker.
Different superscripts represent values that are significantly different (p<O.05).
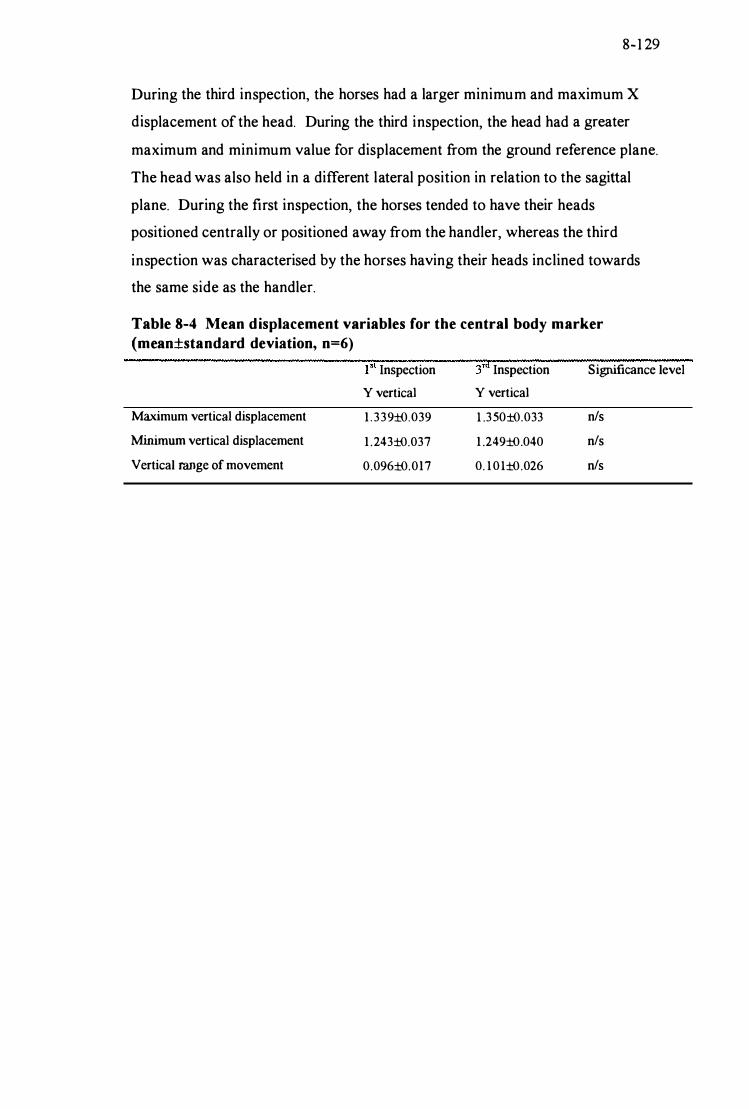
8-1 29
During the third inspection, the horses had a larger minimum and maximum X displacement of the head. During the third inspection, the head had a greater
maximum and minimum value for displacement from the ground reference plane.
The head was also held in a different lateral position in relation to the sagittal
plane. During the first inspection, the horses tended to have their heads
positioned centrally or positioned away from the handler, whereas the third
inspection was characterised by the horses having their heads inclined towards
the same side as the handler.
Table 8-4 Mean displacement variables for the central body marker (mean±standard deviation, n=6)
11'"
1st Inspection 3rd Inspection Significance level
Y verticaJ Y verticaJ
Maximum vertical displacement 1 . 3 3 9±<.l.O39 l .3 50±<.l.O33 nls
Minimum vertical displacement 1 . 243±<.l.O37 1 . 249±<.l.040 nls
Vertical range of movement O.O96±<.l.O17 O. l O l±<.l.O26 nls

8-130
Table 8-5 Standardised displacement and timing measurements for hooves. All temporal values standardised for onset of stance phase as the initiation of the stride.
Leg Variable Vertical displacement Z max (degree from
(m) median line ..... _ .•.. __ .. -...... -................................ ···T·················-·······ro···················-······_······················-···· .. ········-·_···_-_·ilI-··-.. ----.. -.. --..
1 s 3 Significance 1 s 3 Significance Inspection Inspection level Inspection Inspection level
Left Maximum O.2 1 9±{).O25 O.238±{).O29 P<O.OO2 9. 1 2± 1 .62 5 .76±1 .24 P<O.OO4
Fore value (m)
% of stride 55.38±2.72 55.00±4.45 nls 62.22±8.43 6 1 .38±7.35 nls
time at
maximum
Right Maximum O.223±{).O29 O.23 1 ±{).O23 P<O . 1 92 5.76±2.048 5.56± 1.50 P<O.03
Fore value (m)
% of stride 52.88±5.46 56.22±3.02 P<O.042 54.38±l6.26 7 1 .72±14.95 P<O.023
time at
maximum
Left Maximum O. 1 69±{).OlO O . 1 7 1 ±{).O 1 3 nls 7.89±3.67 8.67± 1 .96 nls Hind value (m)
% of stride 49.38± 1 .88 5 1 .77±8.50 nls 55. 33±5.83 5850±14.82 nls time at
maximum
Right Maximum 0 . 1 54±{).02 O. 1 56±{).O l nls 8.40±3. 1 1 7 .35±2.53 nls Hind value (m)
% of stride 44.88± 1 . 99 48.33±8.66 nls 53.27±9.20 5 3 . 88±5.87 P<O.07
time at
maximum
Consistent with observations from the first inspection, the forelimbs exhibited
greater vertical displacement than the hindlimbs (Table 8-5). Vertical
displacement was greater during the third inspection and there was a trend for the
maximum vertical displacement to occur later in the stride cycle than during the
1 st inspection.

8- 13 1
Table 8-6 Standardised velocity and timing measurements for hooves. All temporal values standard ised for onset of stance phase as the initiation of the stride
Forelegs Hind legs Significance
_._ •...••.•.•. "\" •..•........••...• _ .•..........•.•..••.•...•.....•...•...•.• r;r ..•.•.••.•.•.••.••.•..•...•................ _ •...••.•...•....... _ ..... f(I •••••••• -._ ••••• -_ •••••••• _ ••• __ •••••••• _ •••• _ •••• X m.s· l't Inspection 3 Inspection I't Inspection 3 Inspection
Minimum -O.42:t().67 -O.40:t().67 "'(}. 40:t(). 3 7 -O. 3S:t().S4 nls
Value
Min value 16.72±10.908 1 3 . 44±8.37" 7.77±12.49b 1 1 .80±8.70b P<O.OS
timing
Maximum 6.5S:t().668 6.23:t(). nb 6.58:t().96" S.95±1 .63b P<O.OS
Value
Max Value 63 .50±1 1 . 5 1" 55.88±10.36b 56.6 1±7.8 1" S8.88±1 1 .23b P<O.O l
timing*
Minimum - 1 .066:t().342" -O.032:t().047b -O.859:t().26 1 c -O.022:t().055d P<O.O l
Value
Min value 93 .05±1 1 .20· 77.08±l 1 .46b 92. 94±5.49a 84. 1 3 ±7.64b P<O.05
timing*
Maximum 1 . 1 46:t(). 1 948 1 .64 1 :t().23 1 b 1 . 2048:t(). 1 887 l .373:t(). 144d P<O.O l
Value
Max Value 40. 1 9±2.68" 40.05±3 . 7 1 " 36.44±3 .87b 34.6 1±5 .29b P<O.OOI
timing*
Minimum -2 1 .4±l 3 . 2a - 1 9.8±6.9" -45.9±17.36 -28.4±14. Sc P<O.OI
Value
Min value 86. 16±l2.38" 64.05±20.6 1 be 77.63±1O.63b 67.0±21 . 0c P<O.05
timing"
Maximum 24.03±1 2.88" 26.77±8.23b 27 .53±8.20· 32.867±9 . 3 1 b P<O.OI
Value
Max Value 4 1 . 55±1O.78 44. 97±8.85 38. 1 3±12.93 42.44±l 5 . 96 nls
timing*
Note. *Timing values are measured as a percentage of standardised stride time with stride starting
at onset of stance phase.
Different superscripts represent values that are significantly different.
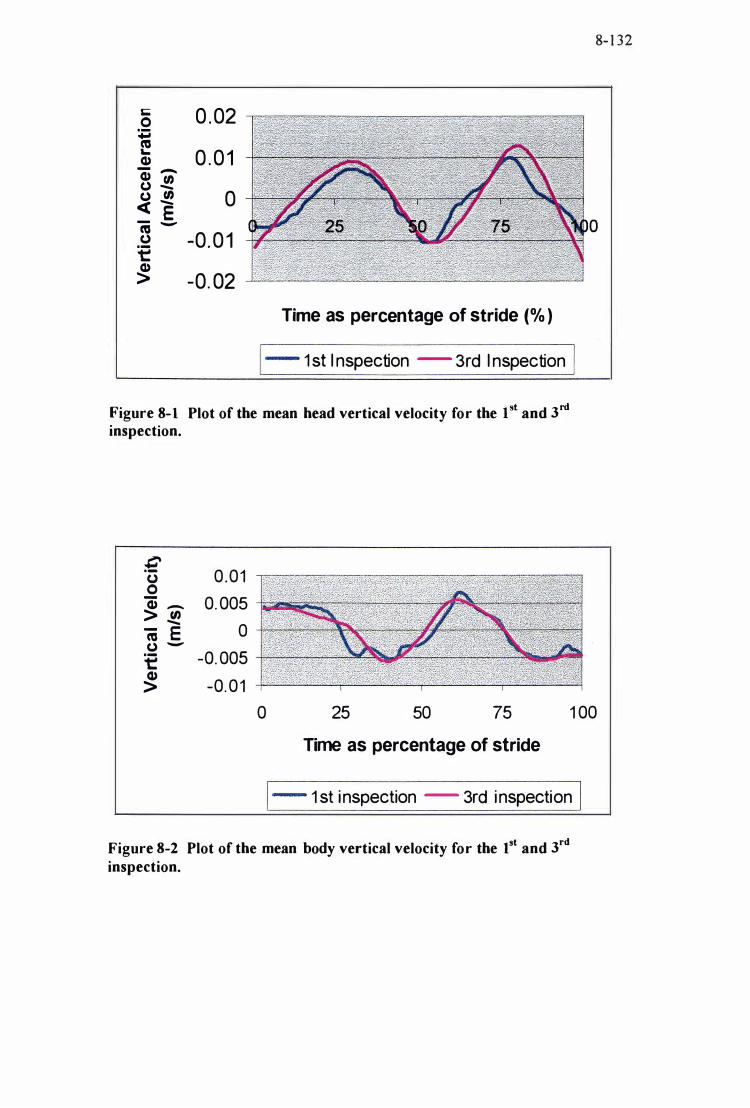
I;;; 0 . 02 0 +i ca � 0 . 0 1 Q) - -Q) In (,) -(,) In 0 « e Cij -
-0. 0 1 (,) :e � -0. 02
Time as percentage of stride (% )
1- 1 st I nspection - 3rd I nspection 1
Figure 8-1 Plot of the mean head vertical velocity for the et and 3rd
inspection.
� 0 . 0 1 (,) 0 - 0. 005 Q) -> In - 0 - E ca (,) - -0. 005 :e Q) -0. 0 1 >
8- 1 32
0 25 50 75 1 00
Time as percentage of stride
1- 1 st i nspection - 3rd i nspection 1
Figure 8-2 Plot of the mean body vertical velocity for the 1st and 3rd
inspection.

- - - � - - - -
8- 1 3 3
Table 8-7 Standardised acceleration and timing measurements for hooves. All temporal values standardised for onset of stance phase as the initiation of the stride
Forelimbs Hind limbs
Horizontal 1,1 Inspection 3i'd Inspection 1st Inspection 3i'd Inspection Significance
acceleration
(m.s'z)
Minimum -4 1 .628±26.085 -39.786±20.881 -37 . 9 1 3± 1 5.687 -40.632±1O.946 nls
Value (m.s·2)
Min value 87.66±6.43" 83.38±1O.36b 87.50± 1 1 .0l 89.02±I I .OO P<O.OI
timing (%
stride)
Maximum 37.326±1 5 .024 36. 1 94±6.639" 43.348±l 9.703 42.494±1 2.959b P<O.O I
Value (m.s·2)
Max Value 40.333±3.414 39.722±5.300 39.666±6.957 39.305±6.497 nls
timing (%
stride)
Vertical acceleration (ms·2) Minimum -9.83±5 .28" -9.09±3 .d - 1 1 .49±6.52a -7.64±1 . 99b P<O.05
Value (m.s'2)
Min value 74.97±17. 38a 70.30±1 1 . 30b 79.97±6.58a 73 .44±5.58b P<O.069
timing (%
stride)
Maximum 9. 1 68±3.59a 12 .58±3. 1 5b 14 .76±6. 1 2" 1 1 . 69±2.48d P<O.05
Value (m.s·2)
Max Value 29.30±4.93 3 I .42±4.62 3 I .86±I4.68 28.75±9. l 5 nls
timing (%
stride)
Transverse acceleration es·2) Minimum -35 1 .06±233 .28" -386 .2 1 ±170.61 -563.98±306.93b -427.2 l ± 1 9 1 .65 P<O.Ol
Value (OS'2)
Min value 75.69±1 1 .73 72.52±1 1 . 30· 76.88±14.65 80. 75± 1 3.42b P<0.05
timing (%
stride)
Maximum 37S.S6±l S5.24 400.56±1 36.39· 423.S0±2 1 S.24 3 1S.3 1 ±l S3 . 1 3b P<O.05
Value es·2)
Max Value 38.66±1O.O3 4 5.08± 1 1 .6 I a 3 8. l l ±1O.21 36.77±1O.52b P<O.Ol
timing (%
stride)

8-134
Maximum horizontal velocity was lower in both the fore and hindlimbs during
the third inspection. In contrast, differences between the fore and hindlimb pairs
was consistent across inspections with the hindlimbs during the third inspection
showing a reduction in velocity. For transverse velocity the minimum values
were lowest for the 1 st inspection and also occurred later during the stride.
Whereas the maximum values for transverse velocity were greater for the third
inspection but this was not significantly different across inspections.
Consistently across inspections, transverse velocity was greater in the hindlimbs.
Minimum horizontal acceleration occurred in the later part of the stride cycle and
was greater in the forelimb pair during the first inspection. Both the timing and
the minimum acceleration values were significantly different between the fore
and hindlimb pairs for both inspections, but were not significantly different
across days. Maximum acceleration was also significantly different between the
fore and hindlimbs pairs for both value and timing of the maximum but were
only significantly different across days for the maximum value and not the
timing of the maximum vertical acceleration. Minimum transverse acceleration
(adduction) and the timing of minimum acceleration was significantly different
between the fore- and hindlimb pairs only for the 1st inspection and was not
significantly different across days. However the trend was for lower minimum
acceleration values in the hindlimbs for both inspections. In contrast to the
minimum values for acceleration the maximum values for transverse acceleration
were significantly different between the fore- and hind l imbs only for the third
inspection and there was a day effect. There was no day effect for the timing of
the maximum acceleration.
Discussion
Between the first and third inspections, horse specific differences in the change
of gait pattern were found for a number of the variables. Horse specific
differences have been identified with the temporal patterns during the
preliminary horse inspection (Chapter Five) and these horse specific temporal
patterns were also found to be consistent across inspections (Chapter Six).
Therefore it was not unexpected that horse specific differences would be found in

8- 1 3 5
the kinematic analysis and that these horses would respond differently to the
exertion of the speed and endurance day. The horse specific components of the
gait or kinematic fingerprint may only be a partial explanation of the differences
in response, which could also be due to each horse having different experiences
during the speed and endurance day, including such factors as the number of time
faults, and the level of fitness. The pre-selection of the horses should have
minimised this possibility, but nethertheless it may be a contributing factor.
Even though subtle horse specific differences in the kinematics between the first
and third horse inspection were found there was a consistent pattern of change
observed.
A hypothesis was proposed in the previous chapter that the gait exhibited during
the first inspection was influenced by tension due to the atmosphere of the
inspection process and the fitness level of the horses. It was predicted from this
hypothesis and results from the linear and temporal analysis (Chapter Six) that
there would be an observed decrease in the range of motion of both the fore- and
the hindlimbs at the third inspection. It was also predicted that there would be a
greater reduction in the range of motion in the forelimbs than the hindlimbs.
However, the results from this analysis demonstrated a small but significant
increase in the range of motion in the limbs in the horizontal and vertical axis
and a decrease in the angular deviation measured in the anterior view.
Certainly the greater vertical and horizontal range of motion implies that tension
i s not providing a limitation to the movement of the distal l imb during the third
inspection. Decreased tension should also provide a reduction in the abduction
level and this was observed during the third inspection. With a decrease in
tension the distal l imb may not be as tightly controlled during the third inspection
and this less constrained regulation of the distal limb may be a reason for the
greater longitudinal and vertical displacement seen.
Because of the structure of the horse's leg the action of the limb can be
considered analogous to the action of a pendulum (Back 1 994). The proximal
muscle mass (extrinsic shoulder and elbow muscles) generates the movement
with the distal l imb largely acting passively. Net joint moment studies on the

8- 1 36
swing at the trot in the Dutch warmblood has identified that the elbow initially
generates acceleration and then at 50% of the swing works to decelerate the l imb
(Lanovaz et al. 1 998). In a tense horse (first inspection) the muscle action may
not be as smooth or fluid. This lack of fluidity may be translated into the distal
l imb displaying greater abduction than expected. Certainly in dressage horses
tension is often manifested in this way. If the horses were not as tense at the
third inspection then the distal l imb would display reduced transverse deviation
as was observed in this study.
The increases in the vertical and longitudinal hoof trajectories during the third
inspection could also be due to the horses not being as tense. Head position may
also contribute to the greater longitudinal and vertical ranges of motion seen
during the third inspection. During the first inspection the horse' s head tended to
be positioned towards the handler, but, during the third inspection the head was
orientated away from the handler and towards the crowd. The neck also
appeared to be held higher and in a more extended position during the third
inspection. The head and neck represent a significant portion of the horse' s
mass. By raising the head during the third inspection a horse may be attempting
to shift the load off the forel imbs. As the forelimb's are closest to the horses
centre of mass and have been shown to have higher vertical velocity and
accelerations at impact (Back et al. 1 995) it would be in the forelimbs than any
concussion would be first felt. Therefore after the rigours of speed endurance
day there would be the expectation of an attempt to minimise forelimb
concussion. Decreased minimum vertical acceleration at the third inspection and
its occurrence earlier in the stride supports this proposal .
While significant differences were found in the kinematics between the first and
third veterinary inspection biologically these differences were not large, and
certainly would be hard to identify with the naked eye. To the most observers
these horses would appear to trot with a consistent gait. Previous studies have
identified that horses do have a consistent gait pattern (Drevemo et al. 1 980) and
this pattern does appear to be resistant to change even with low grade lameness
(Buchner et al. 1 995). The small magnitude of the differences identified implies
there is no drastic change in the horses underlying physiological status. The pre-

8- 1 3 7
selection of this group for study based on the consistency of the trot velocity may
have meant that indirectly, selection had been on horses that were the least
affected by the rigours of speed and endurance day. Certainly the group of
horses selected were all experienced event horses, ridden by experienced riders
and would have been well prepared from their conditioning programme cope
with the physiological demands of speed and endurance day. Elite event horses
appear to cope very well with the demand of speed and endurance day. Support
for this view can be found in the consistency of physiological parameters
between basal (pre-competition) and 1 6 hours after speed and endurance day in
elite level event horses (CCI** * *) ridden by experienced riders (Marlin et al.
1 995). It i s possible that the magnitude of the kinematic differences may be
greater in the horses that did not cope as well to the challenges of speed and
endurance day. Therefore the differences found in this sample should be
regarded as indicators for study as to the kinematic variables that are the most
l ikely candidates to change in response to the physiological demands of speed
and endurance day.
It could be concluded from this study that this group of CCI*** event horses did
not demonstrate changes to the kinematics of the in hand trot that would indicate
that they were unduly fatigued by the exertion of speed and endurance day. It i s
possible that the atmosphere of the inspection process and then the horses not
being as fresh or tense during the third inspection may have been the reason for
the observed differences between inspection days. If tension is the cause then it
i s important for the inspection panel to consider these variables when inspecting
the horses at either the first or third inspection.
8-1 3 8
References
Anon. Veterinary Regulations. 8th Edition. Federation Equestre Internationale Switzerland pp 1 56. 1 998.
Back W. 1 994 Development of equine locomotion from foal to adult. PhD Thesis. Utrecht University, .
Back W, Schamhardt H C, Hartman W and Barneveld A ( 1 995) Kinematic differences between the distal portions of the forelimbs and hind l imbs of horses at the trot. American Journal of Veterinary Research 56, 1 522-8.
Buchner H H F, Savelberg H H C M, Schamhardt H C and Barneveld A ( 1 995) Temporal stride patterns in horses with experimentally induced fore- and hindlimb lameness. Equine Veterinary Journal Supplement 18 1 6 1 - 165
Drevemo S, Dalin G, Fredrickson I and Bjorne K ( 1980) Equine locomotion 3 . The reproducibility of gait i n Standardbred trotters. Equine Veterinary Journal 12 7 1 -73
Lanovaz J L, Clayton H M, Colborne G R, Schamhardt H C ( 1 998) Forelimb kinematics and net joint moments during the swing phase of the trot. 5th International Conference on Equine Exercise Physiology. Abstract Booklet. 70.
Marlin D J, Harris P A, Schroter R C et al. . ( 1 995) Physiological, metabolic and biochemical responses of horses competing in the speed and endurance phase of a CCI**** 3 -day-event. Equine v'eterinary Journal Supplement 20, 3 7-46.
Chapter 9 Concl usion
Introduction.
9- 1 3 9
Limited information is available about the kinematics o f the event horses, and no
studies have previously been undertaken examining the kinematics of horses
performing the horse inspection. The FEI is currently attempting to promote the
standardisation of the surfaces on which the horse inspections are performed at
major three day event competitions (Wilford 1 997). Often at three day events the
horse inspection process and the results arising from it can be the topic of much
discussion. In recent years this has resulted in modification of the process to
permit a holding pen for horses that on initial inspection did not appear even so
that they could be represented for a second inspection (Anon 1 998). However,
the fundamental question as to what are the kinematics of the event horse during
the inspection process and how do they change between the first and third
inspection remained unanswered. This thesis has attempted to address this point.
The horse i nspection process.
Even though guidelines are provided by the FEI for the horse inspection process
they are worded imprecisely. Two different approaches to the inspection process
were observed. The approaches taken appeared to be influenced by the initial
impression the judge's panel received when the horses were walked toward the
panel . If rushed, horses appear tense and uneven and therefore would be placed
under greater scrutiny than horses that walked in a relaxed manner toward the
panel. Based on this observation it is recommended that the competitors make
every effort to present the horse in a relaxed manner. It would be interesting to
perform a follow study to this to examine if there have been any changes in the
process as the FEI continues to standardise procedures at the CCI level three day
event competitions.
9-1 40
Temporal characteristics .
In agreement with studies on different populations of horses, temporal stride
characteristics were found to be repeatable across a number of sequential strides.
The study concludes that the asphalt surface used for the horse inspections at
major three day event competitions alters the trot stride frequency when
compared to studies on different surfaces. However the relationship between
stride frequency, stride length and velocity appear constant. Stance and
retraction times, when measured as a percentage of stride time were identified as
being horse specific. The consistent advanced placement observed of the
hindlimb of the diagonal l imb pair is interpreted as a result of dressage training.
Comparison of temporal stride characteristics between the
first and third horse inspection.
The relatively long time period between the first and third horse inspection ( 1 6-
1 8 hours) may explain why many of the variables examined were remarkably
consistent across inspections. The temporal patterns for individual horses were
consistent between inspections even to the level of maintaining a similar degree
of measured lateral ity between diagonal l imb pairs.
Changes in gait pattern were however observed for the velocity, stride length and
stride duration relationship. During the third inspections at the same velocity the
horses took shorter quicker strides. It was proposed that this change could be
due to delayed onset of muscle soreness (DOMS).
Kinematic examination of the trot d uring the prel iminary
horse i nspection.
The vertical and longitudinal ranges of motion in this study were consistent with
observations in warmblood horses by other authors (Back 1 994; Holmstrom
1 994). It was proposed that the tension of the inspection process, the horses
being very fit and a thorough working in by the riders, contributed to the horses
displaying a gait with a range of motion larger than that expected from a

9-1 4 1
thoroughbred or thoroughbred type horse trotting on an asphalt surface at the first
inspection. The larger longitudinal and vertical displacement of the forelimbs
than the hindlimbs could be an effect of dressage training.
Larger than expected transverse swing was observed. It was proposed that this
may have been due to tension as excessive abduction and adduction of the l imb
as it progresses is generally considered to be a fault in movement and also a fault
in training methods (Klimke 1 985). However the question was raised as to what
is the normal level of transverse deviation and, in a manner similar to human gait
adduction and abduction ofthe limb could be a mechanisms employed to help
minimi se the amount of displacement of the centre of mass during locomotion.
Comparison of the kinematics between the first and third
horse inspection.
In a manner similar to the temporal measurements there was remarkable
similarity between the measurements of the first and third horse inspection even
though significant differences were found between most measurements between
the two inspections. However, biologically these may not constitute a change in
gait pattern that would be easily distinguishable to the naked human eye. To the
observer the gait would have appeared repeatable between inspections.
Contrary to expectation, the hoof had a greater horizontal and vertical but a
reduced transverse range of motion during the third inspection. Reduction in the
transverse deviation may be an indicator that there was less tension in the horses
during the third inspection. The larger longitudinal and vertical ranges of motion
supports this concept that the horses analysed were more relaxed during the third
inspection and not fatigued.
Examination of a larger data set including horses that incurred a large number of
time and jumping penalties on speed and endurance day may demonstrate a
different result.

9-1 42
General conclusion.
The results of this study support the work of other authors that the horse has a
highly repeatable gait that contains elements that are unique to each horse. This
gait pattern appears to be resistant to perturbation caused by external stimulus
including the exertion of speed and endurance day.
This study does however suffer from the limitation of only examining the
kinematics of six horses in detail and only one stride from each inspection.
Horses also are able to redistribute joint torques without any visual change in gait
and this can limit the quantity of information available to the researcher when
only examining the kinematics of the distal limb. Caution should therefore be
used in interpreting these results.
It is important that this work be followed up with a study examining another data
set of CCI'" '" '" event horses and examining in detail a larger group of animals.
This is particularly important with the increasing pressure that the animal welfare
lobby is placing on horse sports and eventing in particular. The results from this
study have demonstrated that the kinematics reflect that speed and endurance day
does not unduly fatigue event horses.

9- 143
References
Anon. Veterinary Regulations. 8th Edition. Federation Equestre Intemationale Switzerland pp1 56 . 1 998.
Back W. 1 994 Development of equine locomotion from foal to adult. PhD Thesis. Utrecht University, .
Holmstrom M. 1 994 Quantitative studies on conformation and trotting gaits in the Swedish warmblood riding horse. [Swedish University of Agricultural Sciences, Uppsala, .
Klimke R, 1 985 Basic training oj the young horse. J A AlIen, London
Wilford, J. ( 1997) Making the changes, Keeping things moving. New Zealand Equestrian Federation Bulletin 252, 25-26.