killed bacillus subtilis spores expressing streptavidin: a novel carrier...
TRANSCRIPT
2013
http://informahealthcare.com/drtISSN: 1061-186X (print), 1029-2330 (electronic)
J Drug Target, Early Online: 1–14! 2013 Informa UK Ltd. DOI: 10.3109/1061186X.2013.778262
RESEARCH ARTICLE
Killed Bacillus subtilis spores expressing streptavidin: a novel carrierof drugs to target cancer cells
Van Anh Thi Nguyen1, Hong Anh Huynh2, Tong Van Hoang3, Ngoc Thi Ninh1, An Thi Hong Pham1, Hoa AnhNguyen1,4, Tuan-Nghia Phan1, and Simon M. Cutting2
1Key laboratory of Enzyme and Protein Technology, VNU University of Science, Hanoi, Vietnam, 2School of Biological Sciences, Royal Holloway,
University of London, Egham, UK, 3Department of Microbiology, Vietnam Military Medical University, Hadong, Hanoi, Vietnam, and 4ANABIO
Research & Development JSC, Van Khe, Hadong, Hanoi, Vietnam
Abstract
Carriers of drugs in cancer therapy are required to reduce side-effects of the drugs to normalcells. Here we constructed killed recombinant Bacillus subtilis spores (SA1) that expressedstreptavidin as a chimeric fusion to the spore coat protein CotB and used the spores asbioparticle carrier. When bound with biotinylated cetuximab these spores could specificallytarget to the epidermal growth factor receptor on HT 29 colon cancer cells, thereby deliveredpaclitaxel to the cells with 4-fold higher efficiency, as indicated by fluorescent intensity ofpaclitaxel Oregon Green 488 bound to HT29 cells. Based on real-time monitoring of cell index,the IC50 of growth of HT29 cells by paclitaxel-SA1-cetuximab was estimated to be 2.9 nMapproximately 5-fold lower than water-soluble paclitaxel (14.5 nM). Instability of DNA contentwas observed when cells were treated with 16 nM paclitaxel-SA1-cetuximab, resulting in a2-fold enhancement in polyploidy cells. Thus, by targeting the release of paclitaxel to HT29cells, spore-associated cetuximab augmented the inhibitory effect of paclitaxel on cell divisionand proliferation. The SA1 could be used as a ‘‘universal’’ drug carrier to target specificbiomarkers on cancer cells by conjugating with suitable biotinylated antibodies.
Keywords
Bacillus subtilis spores, biotinylatedcetuximab, colon cancer cells, drugdelivery, SA1-cetuximab, streptavidin
History
Received 2 November 2012Revised 1 February 2013Accepted 18 February 2013Published online 12 March 2013
Introduction
The side-effects of the chemicals used in the treatment of
cancer are potentially serious to cancer patients undergoing
high-dose transfusions during long-term chemotherapy,
mostly because of diffusion into whole body fluids, targeting
and killing normal cells and damaging vital organs. To avoid
this, chemotherapy should deliver and ensure localization
of drugs to the immediate vicinity of the cancerous cells or
tumors. Research on metallic and polymeric nanoparticles as
drug carriers in medicine has grown rapidly due to the unique
surface properties of nanoparticles that can be functionalized
both for loading chemicals and conjugating biomolecules that
can specifically target cancer cells. Most studies to date have
been made with nanogolds and magnetic nanoparticles for
specific delivery of chemicals to target cancer cells or tumors
[1–3]. However, a number of limitations exist including the
stability and uniformity of the functionalized particles as well
as the potential health issues arising from the use of metallic
or polymer nanoparticles [4]. Therefore, natural organic
bioparticles would be an ideal alternative carrier system with
potential advantages in stability, uniformity and patient-
friendly attributes. In recent years, Melezki and his colleagues
have performed injecting spores of Clostridium novyi-NT,
a genetic engineered clone of C. novyi in which a toxic
virulent gene has been knocked out, into mice having cancer
tumor, and they have found high binding ability of spores on
cancer tumors. Therefore, population of spores surrounding
the tumor can inhibit the growth of the tumor [5]. Other
groups have developed recombinant C. sporogenes that highly
express nitroreductase (NTR). The anerobic spores will
specifically accumulate at the tumors, thereby germinating
and secreting NTR to convert prodrugs, namely CB1954 or
5-FC, to active drugs to kill the tumors. The trials in animal
have shown that the growth of HTC116 tumors in mice has
been substantially suppressed [6,7].
Bacillus subtilis is a Gram-positive bacterium that is able
to produce heat-stable spores of about 1 mm diameter. This
organism is genetically well studied and, in the spore form, is
used worldwide as a probiotic supplement in humans [8].
The B. subtilis spore surface has a negative surface charge and
is hydrophobic [9] with surface layers composed mostly of
about 30 different protein species [10]. Based on their charge
and hydrophobic properties B. subtilis has been shown to
efficiently adsorb and bind protein antigens, for example,
alpha toxin of Clostridium perfringens and tetanus toxin of
C. tetani [9]. Virus particles have also been shown to adsorb
Address for correspondence: Van Anh Thi Nguyen, Key laboratory ofEnzyme and Protein Technology, VNU University of Science, 334Nguyen Trai, Hanoi, Vietnam, Tel: 84-(0)4-35579354. Fax: 84-(0)4-35575498. E-mail: [email protected] M. Cutting, School of Biological Sciences, Royal Holloway,University of London, Egham, Surrey TW20 0EX, UK. Tel: 44-(0)1784-443760. Fax: +44-(0)1784-414224. E-mail: [email protected]
Jour
nal o
f D
rug
Tar
getin
g D
ownl
oade
d fr
om in
form
ahea
lthca
re.c
om b
y U
nive
rsity
Lib
rary
Utr
echt
on
03/1
8/13
For
pers
onal
use
onl
y.
to spores, for example, intact H5N1 virions adsorbed to
killed B. subtilis spores which were used to nasally vaccinate
mice and confer full protection to challenge with an H5N1
virus [11].
Extensive studies have been made describing genetic
engineering to create heat-stable vaccine spores [12]. To date,
antigens are most commonly expressed as fusion proteins
with two spore-coat proteins, CotB and CotC [6,13–16].
Streptavidin (SA) has been successfully expressed as a fusion
protein with the outer coat protein CotG on the outer
surface of B. subtilis DB104 spores, as indicated by FACS
and immunological methods. These streptavidin spores were
shown to bind specifically to biotin-labeled fluorescent FITC,
and have been expected to be a live diagnostic tool in
biotechnology [17]. Since SA is a molecule of interest in
molecular biology due to its extremely high affinity to biotin
and biotinylated molecules [18–20], we engineered B. subtilis
to express SA as a fusion to the outer spore coat protein CotB.
These spores were bound specifically with biotinylated
cetuximab, a chimeric IgG1 monoclonal antibody that targets
the extracellular domain of epidermal growth factor receptor
(EGFR) over-expressed on the surface of 30–85% colon
cancer cell types, including cetuximab-sensitive HT29 cell
lines [19–25]. The created biocomplexes ‘‘spores-cetuximab’’
through SA–biotin interaction demonstrated as efficient
carriers for paclitaxel, a common chemical used in cancer
therapy [26], and we examined their ability to target the colon
cancer cells in vitro.
Materials and methods
Bacterial strains
Bacillus subtilis wild-type strain PY79 (spoþ) was used. All
recombinant strains described here are isogenic derivatives
of PY79. Plasmid amplification for nucleotide sequencing,
sub-cloning experiments and CaCl2-mediated transformation
of E. coli competent cells were performed in the E. coli strain
DH5a, as described in Sambrook et al. [27]. Methods for
Bacillus including the two-step transformation of B. subtilis
were those outlined in Cutting et al. [28].
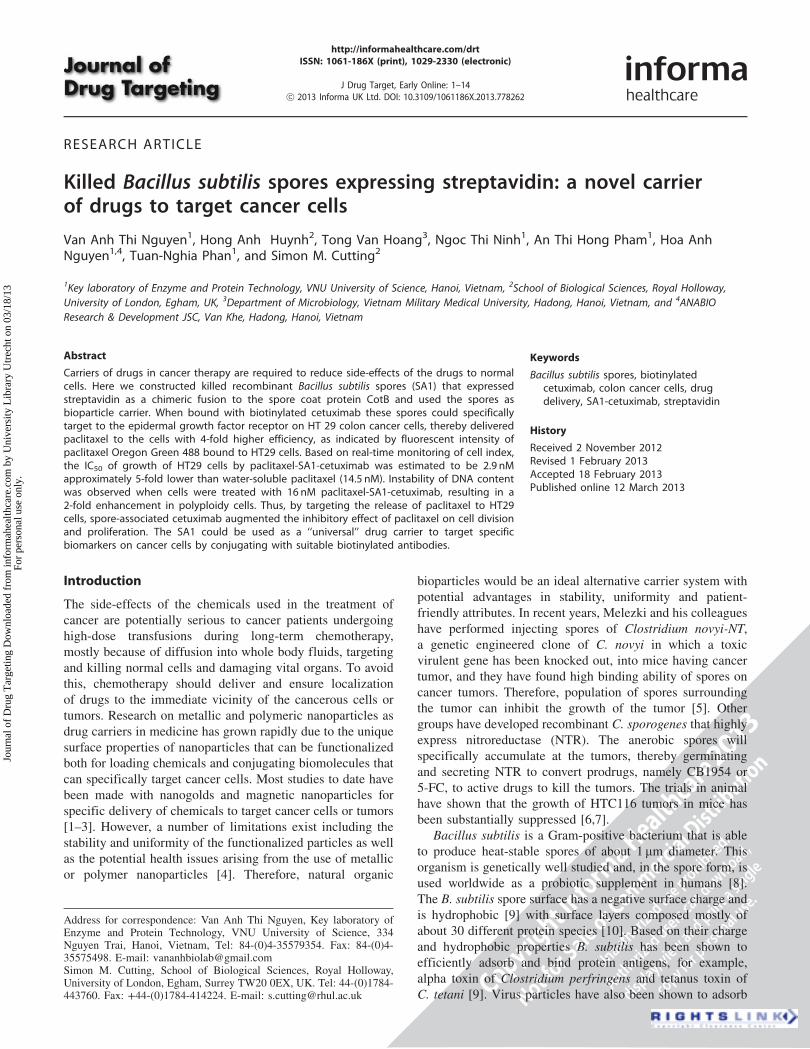
Construction of gene fusions
A segment of CotB carrying the complete promoter sequence
and 825 50-codons of its open reading frames (ORFs) were
cloned in pDG364. pDG364 is a plasmid that enables ectopic
insertion of heterologous DNA into the B. subtilis genome
[28] and the procedures were similar to the use of CotB
for expression of antigens on the spore surface described
previously [29]. The CotB promoter was polymerase
chain reaction (PCR) amplified from the B. subtilis strain
PY79 chromosome using oligonucleotide primers (forward,
50-cgcggatccACGGATTAGGCCGTTTGTCCT-3 having a
restriction site for BamHI and reverse 50-cccaagcttGGATGA
TTGATCATCT-30 having a restriction site for HindIII). The
purified PCR product was cloned into pDG364 that had been
digested with BamHI and HindIII to generate pDG364-CotB.
Using Streptomyces avidinii strain 11996 (NCIMB Ltd.,
Aberdeen, UK) as a chromosomal template, the complete
SA ORF was amplified using two primers (forward,
50-aaaaagcttGACCCCTCCAAGGACTCGAAG-30 having a
restriction site for HindIII and reverse 50-aaagaattcCTACTG
CTGAACGGCGTCGAG-30 having a restriction site EcoRI).
Purified PCR-amplified SA DNA having the expected size of
500 bp was cleaved with HindIII and EcoRI and cloned into
pDG364-CotB cleaved with HindIII and EcoRI. This created
an in-frame fusion of CotB with SA at the HindIII site. The
clone was verified using DNA sequencing across the fusion
site and the plasmid linearized by digestion with PstI.
Linearized DNA was then used to transform competent
cells of B. subtilis strain PY79 with selection of chloram-
phenicol-resistant colonies. Transformants carried a stable,
double crossover, insertion of the CotB-SA chimera at the
amylase gene (amyE) and the resulting clone is named SA1
(Figure 1).
Preparation of spores and extraction of sporecoat proteins
Sporulation of B. subtilis PY79 (spoþ) and the B. subtilis
strain (SA1) expressing CotB-SA was made in Difco sporu-
lation media at 37 �C using the exhaustion method.
Sporulating cultures were harvested 60 h after the initiation
of sporulation and suspensions of spores purified using
lysozyme treatment to break any residual sporangial cells
followed by washing in 1 M NaCl, 1 M KCl and water [30].
The number of spores was calculated by serial dilution and
plate counting. Spores were killed by autoclaving (120 �C,
15 p.s.i, 20 min). Water lost by evaporation was calculated and
sterile water was added to restore to the original volume
before autoclaving using microscopic counting of spore
particles using a hemocytometer to determine spore counts.
Hundred percent spore killing was validated by serial dilution
and plate counting.
Figure 1. Strategy for the chromosomal integration of the CotB-SA gene. Arrows indicate direction of transcription.
2 V. A. T. Nguyen et al. J Drug Target, Early Online: 1–14
Jour
nal o
f D
rug
Tar
getin
g D
ownl
oade
d fr
om in
form
ahea
lthca
re.c
om b
y U
nive
rsity
Lib
rary
Utr
echt
on
03/1
8/13
For
pers
onal
use
onl
y.
Western analysis
Spore coat proteins were extracted from suspensions (1� 109)
of pelleted spores of PY79 and SA1 using 40 ml of an SDS-DTT
extraction buffer [30]. Protein concentration was determined
using the Bradford assay and approximately 20 mg was
fractionated on 12% SDS-PAGE gels. Western blotting was
used to detect the 50 kDa CotB-SA chimera (35 kDa of
truncated CotB fused to 15 kDa of SA) using a polyclonal
streptavidin-specific rabbit antibody (Sigma-Aldrich, St Louis,
MO) and anti-rabbit IgG conjugated with horseradish perox-
idase (Promega, Fitchburg, WI). Western blot membranes were
visualized using the ECL (GE Healthcare Life Science,
Sweden) method using ECL Plus� Western Blotting
Detection Reagents, following the manufacturer’s instruction.
Biotinylation and fluorescent labeling of cetuximab
Cetuximab was labeled with biotin and fluorescent Alexa 546
using methods described previously [11,31,32]. Cetuximab
(Erbitux�, MerkSorono, Switzerland) at a concentration of
5 mg/ml was dialyzed overnight in phosphate saline buffer
(PBS; 145 mM, pH 7.4) with two changes of buffer. The
dialyzed cetuximab was centrifuged to remove precipitates and
the concentration was adjusted to 2.4 mg/ml, equivalent to
20 mM. Next, it was used either for labeling with 40 mM
succinimidyl biotin (Sigma-Aldrich, MO) or for dual labeling
with a mixture of 40 mM succinimidyl biotin and 40 mM
succinimidyl Alexa 546 (Life Technologies, NY, excitation/
emission: 546 nm/580 nm) at room temperature (RT) for 1 h in
PBS (pH 7.4; NaCl 137 mM). Reactions were stopped by
adding 1 mM Tris-HCl, and the unreacted succinimidyl biotin
and Alexa 546 dyes were carefully removed by sequential
dialysis (three times) using a mini-dialysis kit with a 8 kDa cut-
off (GE Healthcare Life Science, Sweden) in PBS. Biotinylated
cetuximab and dual-labeled biotinylated-Alexa546 cetuximab
were then centrifuged (100 000 rpm; 5 min) to remove precipi-
tation that may have occurred during labeling and dialysis. The
concentration of protein in the labeled sample was determined
(using a NanoDrop� spectrophotometer ND-1000) to be
1 mg ml�1, equivalent to 8.3 mM of protein and 8.5 mM of
Alexa-546, indicating a protein to dye ratio of about 1:1.
Cetuximab binding
To measure binding constants, different amounts of biotiny-
lated cetuximab ranging from 0.25 mg, 1 mg, 4 mg to 8 mg were
bound on 1� 109 SA1 spores in PBS (pH 7.4; NaCl, 137 mM).
In another experiment for pH-dependent binding determin-
ation, binding of 1 mg biotinylated cetuximab to 1� 109 SA1
spores was performed at different pH’s ranging from 2 to 10
which was created by using suitable buffers containing 137 mM
NaCl. Incubations were made in 300 ml buffers for less than 1 h
and the unbound biotinylated cetuximab was removed using
three washes with PBS (0.01 M, pH 7.4) before SDS-PAGE
analysis. Biotinylated cetuximab bound with 2� 108 spores
(one-fifth of the initial amount of spores incubated) was
checked for the presence of a 60 kDa species indicating that
DTT-reduced IgG by Western blotting using anti-human IgG-
conjugated alkaline phosphatase (Promega, WI), and the
purple color reaction determined using the NBT/BCIP
substrate (BioBasic, Canada). About 100 ng of biotinylated
cetuximab was used as a positive control. The intensity of
60 kDa bands was analyzed using Scion Image� software.
Binding constant and number of SA moleculesexpressed on SA1 spores
The binding constant Kb(C-S) of biotinylated cetuximab to
CotB-SA on the spore surface and the number of binding sites
SA (RS) per mm2 of a spore for interaction with biotinylated
cetuximab was determined as follows. The initial biotinylated
cetuximab concentration was assigned as [Co] in nM unit and
the concentration of 1� 109 spores/300 ml was calculated as
�5.3� 10�3 nM and assigned as [So], considering a single
spore as one molecule. The concentration of biotinylated
cetuximab bound to the membranes, [Cb], was estimated by
determining the intensity of the band in comparison to the
intensity of the control using the Scion Image� software (NIH,
NY). The data of [Cb] and [Co] were included in the following
equation for calculation of constant Kb(C-S) and Rs [31].
C þ S$ C � S
Kb C�Sð Þ ¼½C � S�½C�½S� ¼
Cb½ �Co � Cb½ � Rs � S� Cb½ �
Immunofluorescence and direct fluorescence imaging
About 1� 109 and 1� 109 PY79 spores were fixed with ice-
cold paraformaldehyde 1% for 15 min, then washed three
times with PBS (145 mM, pH 7.4). Next, the spores were
incubated with polyclonal SA-specific antibody at 10 mM for
45 min at RT, followed by anti-rabbit IgG-conjugated Alexa
546 at 10 mM for 45 min at RT. Incubations with antibodies
were performed in the presence of 2% BSA and three washes
with PBS (pH 7.4; NaCl 137 mM) plus 0.5% BSA after the
first antibody. The spores were imaged under an excitation
of 525 nm (green laser) using a confocal fluorescence
microscope Carl Zeiss LSM510 (Carl Zeiss, Germany).
About 1� 109 SA1 spores and 1� 109 PY79 spores were
treated in acetate buffer 30 mM pH 4.0 for 30 min, washed
and suspended in PBS (145 mM pH 7.4). Next, 1 ml
containing 1� 108 spores was incubated with both 200 nM
paclitaxel Oregon Green 488 and 20 nM dual-labeled
biotinylated-Alexa 546 cetuximab for 30 min. Spores were
washed three times with PBS (145 mM, pH 7.4) to remove
unbound chemicals and proteins and then observed under an
excitation of 488 nm (blue laser) and 525 nm (green laser)
for Oregon Green 488 and Alexa 546, respectively, using
confocal fluorescence microscopy.
A colon cancer cell line HT29 (American Type Culture
Collection, ATCC, NY) that over-expresses EGFR and that is
cetuximab-sensitive [25,33] was cultured in cell culture flasks
containing Roswell Park Memorial Institute-1640 medium
(RPMI, Life Technologies, NY) supplemented with 10%
heated fetal bovine serum (FBS, Sigma-Aldrich, MO). A
human breast cancer cell line KPL-4 expressing high level of
Her2/neub, but not EGFR which is sensitive to trastuzumab
and resistant to cetuximab [34–36] (kindly provided by Prof.
H. Higuchi, Biomedical Engineering Research Organization,
Tohoku University, Japan) was cultured in cell culture flasks
DOI: 10.3109/1061186X.2013.778262 Killed Bacillus subtilis spores expressing streptavidin 3
Jour
nal o
f D
rug
Tar
getin
g D
ownl
oade
d fr
om in
form
ahea
lthca
re.c
om b
y U
nive
rsity
Lib
rary
Utr
echt
on
03/1
8/13
For
pers
onal
use
onl
y.
containing Dulbecco’s Modified Eagle Medium (DMEM, Life
Technologies, NY) low glucose supplemented with 5% FBS.
HT 29 that had been checked to be much more sensitive to
cetuximab was compared to KPL4 by the immunofluorescent
method using cetuximab labeled with Alexa 546. HT29 or
KPL4 cells were further cultured individually in 24-well
ELISA plates containing coverslips at the bottom of each
well, either in RPMI-1640 or DMEM, respectively. The two
cell lines were then used as targets to test the delivery of
paclitaxel Orgegon Green 488 (Life Technologies, NY;
excitation/emission: 488 nm/525 nm) at a concentration of
1 mM by cetuximab bound to SA1 spores. Negative controls
(absence of paclitaxel) and other positive controls of water-
soluble paclitaxel Oregon Green 488 and paclitaxel Oregon
Green 488 adsorbed on the wild-type PY79 (paclitaxel-PY79)
at the same 1 mM concentration were performed in parallel.
Incubation of cells and paclitaxel in different formulations
was conducted within 6 h and the cells were washed (PBS, pH
7.4) three times to remove unbound paclitaxel and spores. The
HT29 and KPL4 cells were then fixed using ice-cold
paraformaldehyde (3.7% v/v) and triton X-100 (1% v/v) for
15 min at RT, followed by three times washing with PBS (pH
7.4; 137 mM NaCl) and DNA-staining using the diamidino-2-
phenylindole (DAPI) fluorescent dye (Life Technologies, NY;
excitation/emission: 358 nm/461 nm) at 0.1 mg/ml for 20 min.
After this, coverslips containing either HT29 or KPL4 cells
were washed to remove remaining DAPI and finally sealed
using the aqueous mounting medium Permaflour� (Beckman
Coulter, Germany) for observation. The cells were observed
under an excitation of 320 nm (using UV light of mercury
lamp and of 480 nm (blue laser) using a confocal fluorescence
microscope. The off-set was made in the case of KPL4 cells
to remove the background of the green signal due to
autofluorescence. The intensity of paclitaxel bound in the
cells was analyzed using Scion Image� software (NIH, NY).
Fluorospectrometer analysis of binding of paclitaxeland its dissociation rate
PY79 spores and biotinylated cetuximab bound SA1 spores
were treated in acetate buffer 30 mM pH 4.0 for 30 min,
washed (in PBS) and suspended in PBS buffer (145 mM pH
7.4). Next, 1 ml of PY79 or SA1 spores (1� 108) were
incubated with paclitaxel Oregon Green 488 at concentrations
ranging from 200 nM to 1 mM at 25 �C for 1 h. Unbound
paclitaxel Oregon Green 488 (Ps) was obtained by centrifu-
ging the spores at 12 000 rpm for 3 min, and measured using a
fluorospectrometer under an excitation of 480 nm. The initial
concentrations of paclitaxel (Po) applied to spores were
determined by performing parallel incubations in the absence
of the spores. Experiments were performed in triplicate and
the detectable resolution was 100 pM fluorophores.
Dissociation rates of biotinylated cetuximab andpaclitaxel from spores
Dissociation rate constants of biotinylated cetuximab from
SA1 spores koff(C-S) were determined by incubating 1� 109
saturated cetuximab-bound SA1 spores in 1 ml PBS at
different time points (0 h, 1 h, 2 h, 4 h, 8 h, 24 h, 48 h, 72 h,
7 d, 14 d). Dissociation rate constants of paclitaxel Oregon
Green 488 from SA1-cetuximab koff(P-SA1-cetuximab) were
determined by incubating 1� 108 paclitaxel-Oregon bound
SA1-cetuximab spores either in 1 ml PBS in different pH
buffers ranging from 2 to 8 at different time points (0 h, 1 h,
2 h, 4 h, 8 h, 24 h, 48 h, 72 h, 7 d, 14 d), or in 1 ml of human
serum (donated by a healthy volunteer) at different time
points (0 h, 2 h, 4 h, 8 h, 24 h, 48 h). In the case of paclitaxel
Oregon Green 488 (10X greater than non-labeled paclitaxel)
was added to either PBS buffer or the human serum at a final
concentration of 10 mM. Next, the amount of cetuximab
bound on SA1-spores and paclitaxel bound on SA1-cetuximab
spores were measured again using Western blotting and
fluorospectrometry, respectively. The dissociation rate con-
stants koff(C-S) and koff(P-SA1-cetuximab) were calculated based
on the following equations: koff¼ 0.693/t1/2 min�1 while t1/2
is the half-life when binding falls below 50%.
Real-time electrical recording of cell proliferation
Cells were cultured in an E-plate96 and placed on an RTCA
SP station connected to an RTCA analyzer (Roche Applied
Science, Switzerland) for real-time electrical recording of cell
proliferation. In detail, HT29 was cultured in 200 ml of RPMI
and 200 ml KPL4 was cultured in DMEM at an initial
concentration of 10 000 cells/well and 2000 cells/well,
respectively. For preparation of PY79-cetuximab and SA1-
cetuximab, 1 mg cetuximab biotinyl was adsorbed with either
109 PY79 or 109 SA1, and the unbound cetuximab was
washed off from the spores. In an experiment to test toxicity
of SA1-cetuximab, 1� 108 SA1, 1� 108 SA1-cetuximab
spores and 20 ng cetuximab were added into each well
containing 200ml medium at the beginning of cell incubation
and observation. In later experiments to test activity of
paclitaxel bound SA1-cetuximab, cells were grown and
attached to the sensors for 24 h before adding paclitaxel
either in water-soluble form, paclitaxel-PY79 or paclitaxel-
SA1-cetuximab. The concentration of PY79 and SA1-
cetuximab was 1� 106 cfu/200 ml medium and the concen-
tration of paclitaxel ranged from 1 nM to 1 mM. As controls, a
negative control was 200 ml of DMEM and RPMI only and
negative controls in each well for substrates included 1� 106
PY79, cetuximab (20 ng), 1� 106 PY79-cetuximab, and
1� 106 SA1-cetuximab in RPMI medium. Wells of each
sample were repeated three times. Further incubation after
addition of paclitaxel was conducted for an additional two
days for KPL4 and three days for HT29. The process of cell
growth was recorded in real-time using RTCA Control Unit
(Roche Applied Science, Switzerland) and analyzed by RTCA
software based on the average results of recorded data.
Flow cytometry
About 1� 106 cells of HT29 were cultured in 2 ml of RPMI
medium and grown 24 h before addition of paclitaxel, either
as a water-soluble form or as paclitaxel-SA1-cetuximab. The
concentration of both PY79 and SA1-cetuximab was 1� 107
spores/2 ml medium and the concentration of paclitaxel was
64 nM and paclitaxel-SA1-cetuximab was 16 nM. The nega-
tive controls were the cells without paclitaxel. The cells after
18 h incubation with paclitaxel and paclitaxel-SA1-cetuximab
were collected and fixed by ethanol formaldehyde before
4 V. A. T. Nguyen et al. J Drug Target, Early Online: 1–14
Jour
nal o
f D
rug
Tar
getin
g D
ownl
oade
d fr
om in
form
ahea
lthca
re.c
om b
y U
nive
rsity
Lib
rary
Utr
echt
on
03/1
8/13
For
pers
onal
use
onl
y.
staining with PI (Propidium iodide) fluorescent dye 1 mg/ml
in PBS containing 10 mg/ml RNAse A at 37 �C, 30 min.
The DNA content of stained cells was analyzed using an
FACS Canto (Becton Dickinson, Germany). The analysis was
repeated three times.
Results
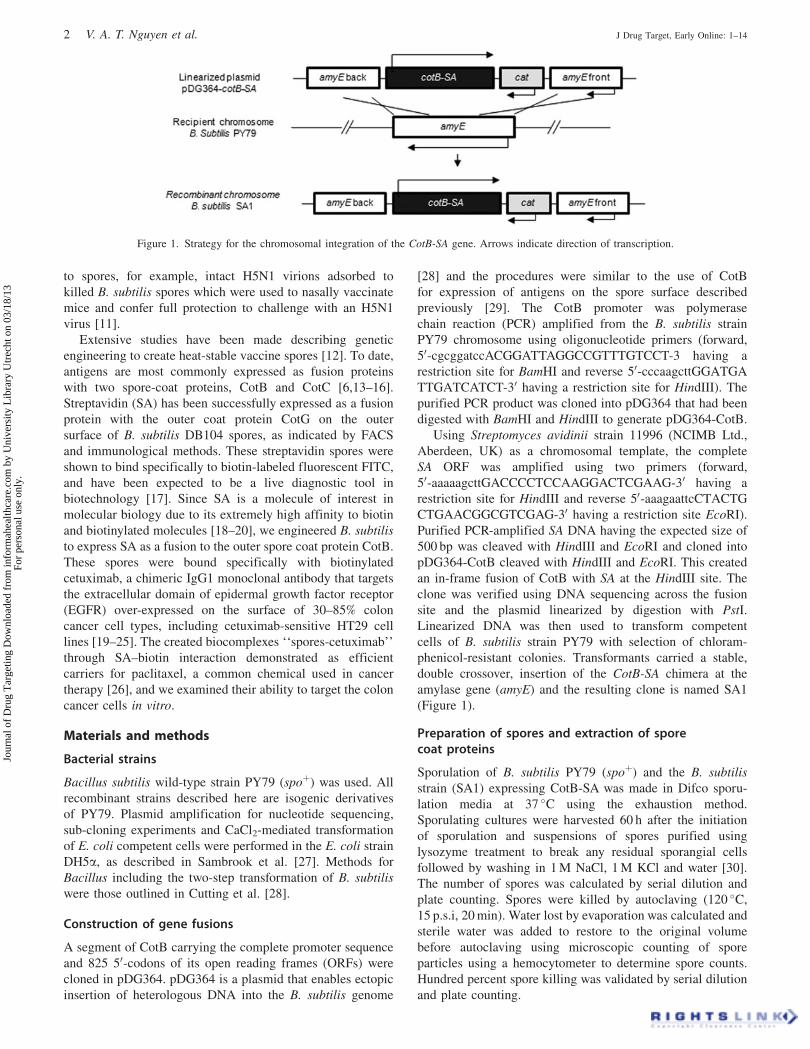
Expression of CotB-SA on the surface of B. subtilisspores
A recombinant strain of B. subtilis named SA1 was
constructed that carried a chimeric CotB-SA gene, CotB-
SA, where CotB spore coat protein gene had been fused to the
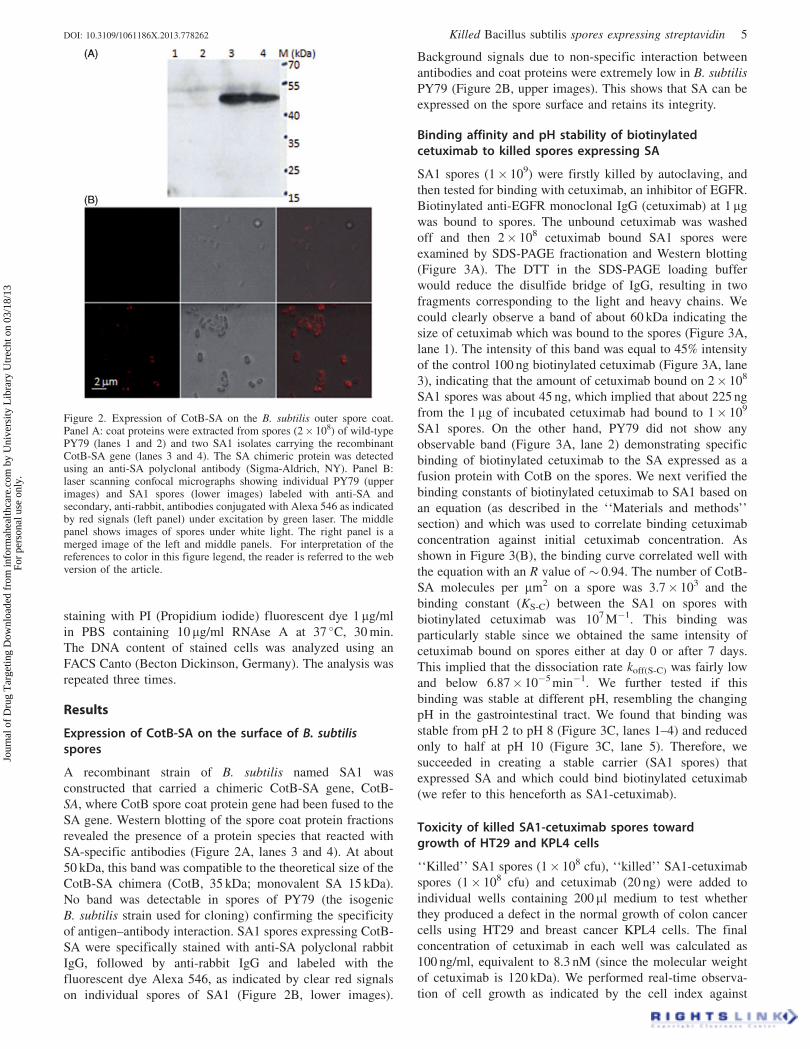
SA gene. Western blotting of the spore coat protein fractions
revealed the presence of a protein species that reacted with
SA-specific antibodies (Figure 2A, lanes 3 and 4). At about
50 kDa, this band was compatible to the theoretical size of the
CotB-SA chimera (CotB, 35 kDa; monovalent SA 15 kDa).
No band was detectable in spores of PY79 (the isogenic
B. subtilis strain used for cloning) confirming the specificity
of antigen–antibody interaction. SA1 spores expressing CotB-
SA were specifically stained with anti-SA polyclonal rabbit
IgG, followed by anti-rabbit IgG and labeled with the
fluorescent dye Alexa 546, as indicated by clear red signals
on individual spores of SA1 (Figure 2B, lower images).
Background signals due to non-specific interaction between
antibodies and coat proteins were extremely low in B. subtilis
PY79 (Figure 2B, upper images). This shows that SA can be
expressed on the spore surface and retains its integrity.
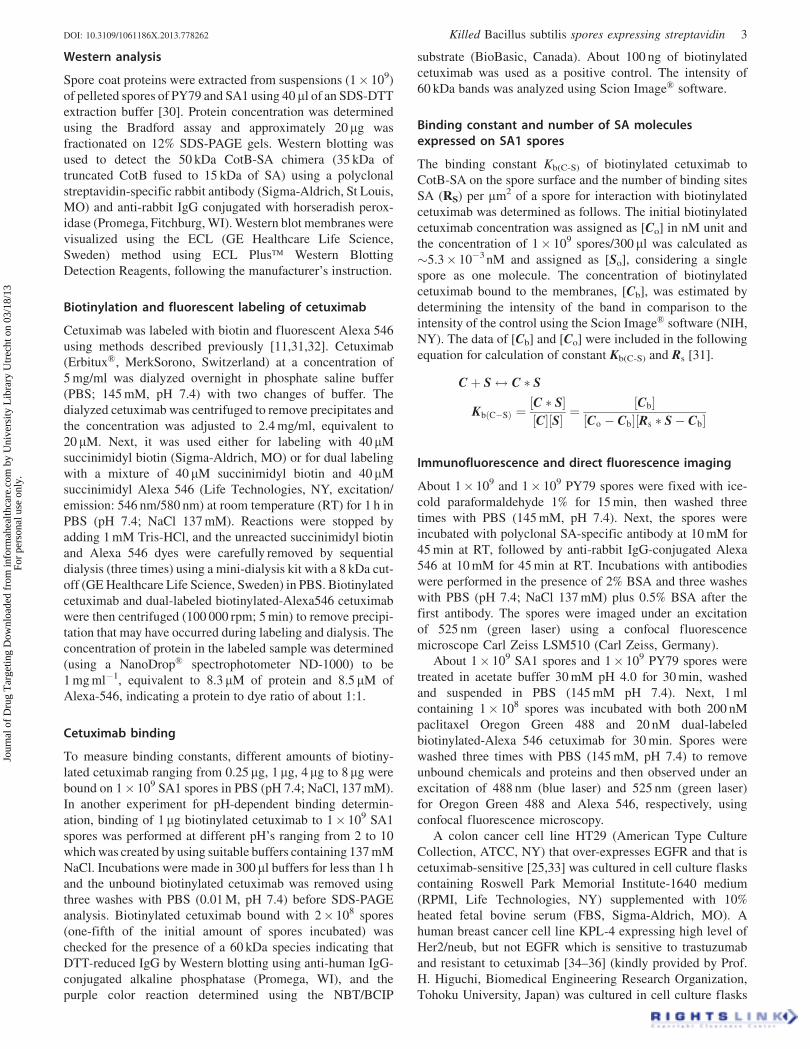
Binding affinity and pH stability of biotinylatedcetuximab to killed spores expressing SA
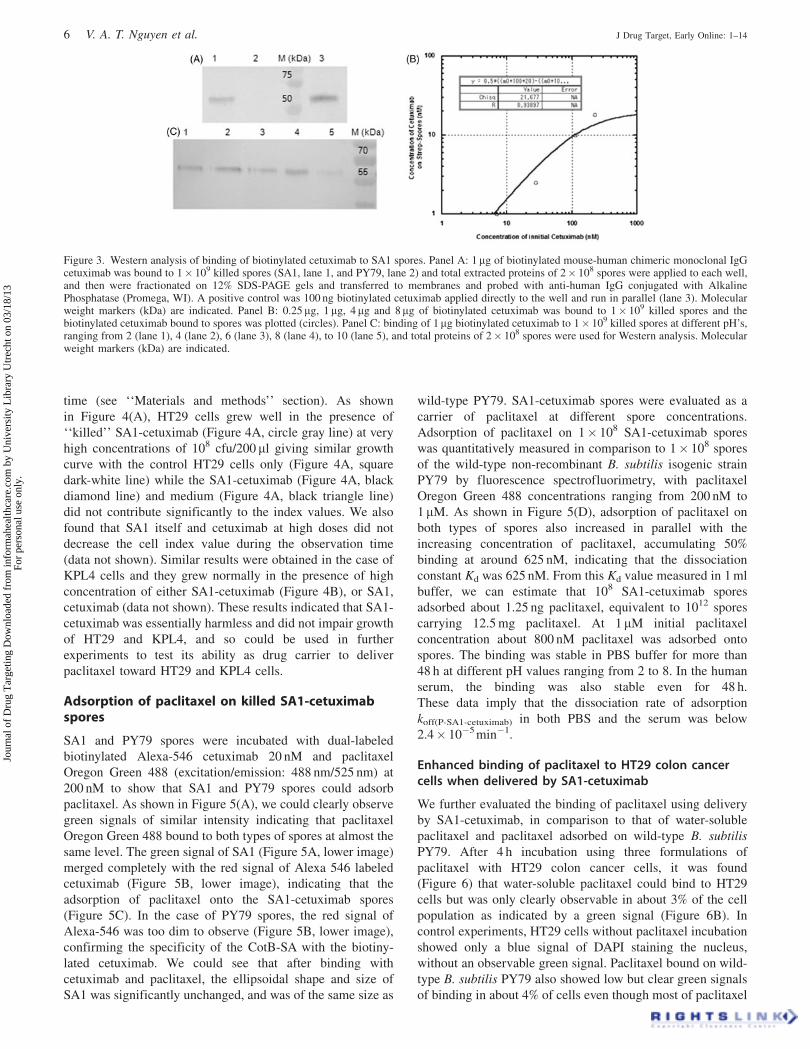
SA1 spores (1� 109) were firstly killed by autoclaving, and
then tested for binding with cetuximab, an inhibitor of EGFR.
Biotinylated anti-EGFR monoclonal IgG (cetuximab) at 1 mg
was bound to spores. The unbound cetuximab was washed
off and then 2� 108 cetuximab bound SA1 spores were
examined by SDS-PAGE fractionation and Western blotting
(Figure 3A). The DTT in the SDS-PAGE loading buffer
would reduce the disulfide bridge of IgG, resulting in two
fragments corresponding to the light and heavy chains. We
could clearly observe a band of about 60 kDa indicating the
size of cetuximab which was bound to the spores (Figure 3A,
lane 1). The intensity of this band was equal to 45% intensity
of the control 100 ng biotinylated cetuximab (Figure 3A, lane
3), indicating that the amount of cetuximab bound on 2� 108
SA1 spores was about 45 ng, which implied that about 225 ng
from the 1 mg of incubated cetuximab had bound to 1� 109
SA1 spores. On the other hand, PY79 did not show any
observable band (Figure 3A, lane 2) demonstrating specific
binding of biotinylated cetuximab to the SA expressed as a
fusion protein with CotB on the spores. We next verified the
binding constants of biotinylated cetuximab to SA1 based on
an equation (as described in the ‘‘Materials and methods’’
section) and which was used to correlate binding cetuximab
concentration against initial cetuximab concentration. As
shown in Figure 3(B), the binding curve correlated well with
the equation with an R value of � 0.94. The number of CotB-
SA molecules per mm2 on a spore was 3.7� 103 and the
binding constant (KS-C) between the SA1 on spores with
biotinylated cetuximab was 107 M�1. This binding was
particularly stable since we obtained the same intensity of
cetuximab bound on spores either at day 0 or after 7 days.
This implied that the dissociation rate koff(S-C) was fairly low
and below 6.87� 10�5 min�1. We further tested if this
binding was stable at different pH, resembling the changing
pH in the gastrointestinal tract. We found that binding was
stable from pH 2 to pH 8 (Figure 3C, lanes 1–4) and reduced
only to half at pH 10 (Figure 3C, lane 5). Therefore, we
succeeded in creating a stable carrier (SA1 spores) that
expressed SA and which could bind biotinylated cetuximab
(we refer to this henceforth as SA1-cetuximab).
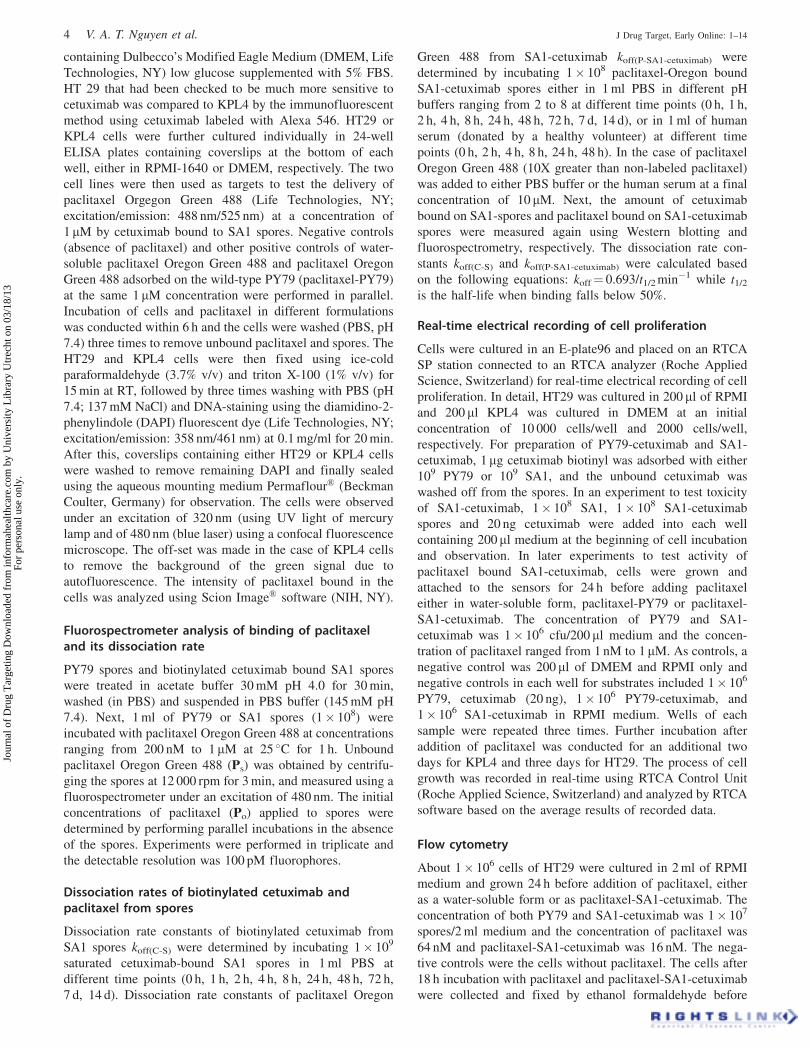
Toxicity of killed SA1-cetuximab spores towardgrowth of HT29 and KPL4 cells
‘‘Killed’’ SA1 spores (1� 108 cfu), ‘‘killed’’ SA1-cetuximab
spores (1� 108 cfu) and cetuximab (20 ng) were added to
individual wells containing 200 ml medium to test whether
they produced a defect in the normal growth of colon cancer
cells using HT29 and breast cancer KPL4 cells. The final
concentration of cetuximab in each well was calculated as
100 ng/ml, equivalent to 8.3 nM (since the molecular weight
of cetuximab is 120 kDa). We performed real-time observa-
tion of cell growth as indicated by the cell index against
Figure 2. Expression of CotB-SA on the B. subtilis outer spore coat.Panel A: coat proteins were extracted from spores (2� 108) of wild-typePY79 (lanes 1 and 2) and two SA1 isolates carrying the recombinantCotB-SA gene (lanes 3 and 4). The SA chimeric protein was detectedusing an anti-SA polyclonal antibody (Sigma-Aldrich, NY). Panel B:laser scanning confocal micrographs showing individual PY79 (upperimages) and SA1 spores (lower images) labeled with anti-SA andsecondary, anti-rabbit, antibodies conjugated with Alexa 546 as indicatedby red signals (left panel) under excitation by green laser. The middlepanel shows images of spores under white light. The right panel is amerged image of the left and middle panels. For interpretation of thereferences to color in this figure legend, the reader is referred to the webversion of the article.
DOI: 10.3109/1061186X.2013.778262 Killed Bacillus subtilis spores expressing streptavidin 5
Jour
nal o
f D
rug
Tar
getin
g D
ownl
oade
d fr
om in
form
ahea
lthca
re.c
om b
y U
nive
rsity
Lib
rary
Utr
echt
on
03/1
8/13
For
pers
onal
use
onl
y.
time (see ‘‘Materials and methods’’ section). As shown
in Figure 4(A), HT29 cells grew well in the presence of
‘‘killed’’ SA1-cetuximab (Figure 4A, circle gray line) at very
high concentrations of 108 cfu/200 ml giving similar growth
curve with the control HT29 cells only (Figure 4A, square
dark-white line) while the SA1-cetuximab (Figure 4A, black
diamond line) and medium (Figure 4A, black triangle line)
did not contribute significantly to the index values. We also
found that SA1 itself and cetuximab at high doses did not
decrease the cell index value during the observation time
(data not shown). Similar results were obtained in the case of
KPL4 cells and they grew normally in the presence of high
concentration of either SA1-cetuximab (Figure 4B), or SA1,
cetuximab (data not shown). These results indicated that SA1-
cetuximab was essentially harmless and did not impair growth
of HT29 and KPL4, and so could be used in further
experiments to test its ability as drug carrier to deliver
paclitaxel toward HT29 and KPL4 cells.
Adsorption of paclitaxel on killed SA1-cetuximabspores
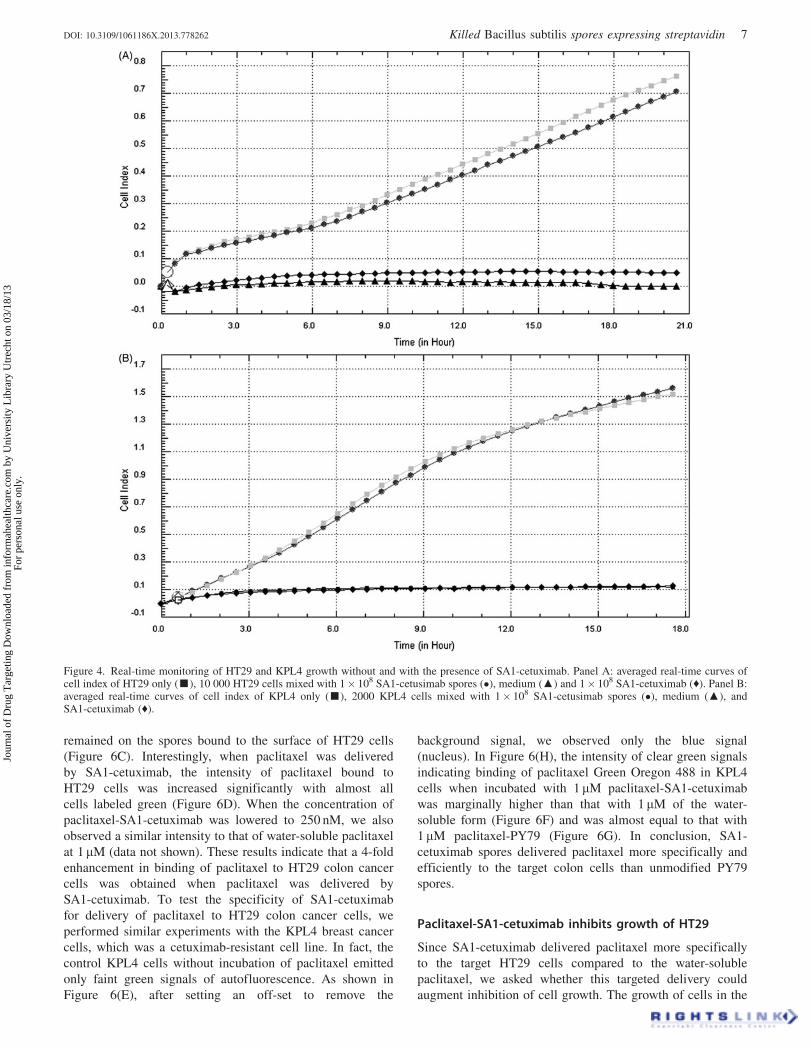
SA1 and PY79 spores were incubated with dual-labeled
biotinylated Alexa-546 cetuximab 20 nM and paclitaxel
Oregon Green 488 (excitation/emission: 488 nm/525 nm) at
200 nM to show that SA1 and PY79 spores could adsorb
paclitaxel. As shown in Figure 5(A), we could clearly observe
green signals of similar intensity indicating that paclitaxel
Oregon Green 488 bound to both types of spores at almost the
same level. The green signal of SA1 (Figure 5A, lower image)
merged completely with the red signal of Alexa 546 labeled
cetuximab (Figure 5B, lower image), indicating that the
adsorption of paclitaxel onto the SA1-cetuximab spores
(Figure 5C). In the case of PY79 spores, the red signal of
Alexa-546 was too dim to observe (Figure 5B, lower image),
confirming the specificity of the CotB-SA with the biotiny-
lated cetuximab. We could see that after binding with
cetuximab and paclitaxel, the ellipsoidal shape and size of
SA1 was significantly unchanged, and was of the same size as
wild-type PY79. SA1-cetuximab spores were evaluated as a
carrier of paclitaxel at different spore concentrations.
Adsorption of paclitaxel on 1� 108 SA1-cetuximab spores
was quantitatively measured in comparison to 1� 108 spores
of the wild-type non-recombinant B. subtilis isogenic strain
PY79 by fluorescence spectrofluorimetry, with paclitaxel
Oregon Green 488 concentrations ranging from 200 nM to
1 mM. As shown in Figure 5(D), adsorption of paclitaxel on
both types of spores also increased in parallel with the
increasing concentration of paclitaxel, accumulating 50%
binding at around 625 nM, indicating that the dissociation
constant Kd was 625 nM. From this Kd value measured in 1 ml
buffer, we can estimate that 108 SA1-cetuximab spores
adsorbed about 1.25 ng paclitaxel, equivalent to 1012 spores
carrying 12.5 mg paclitaxel. At 1 mM initial paclitaxel
concentration about 800 nM paclitaxel was adsorbed onto
spores. The binding was stable in PBS buffer for more than
48 h at different pH values ranging from 2 to 8. In the human
serum, the binding was also stable even for 48 h.
These data imply that the dissociation rate of adsorption
koff(P-SA1-cetuximab) in both PBS and the serum was below
2.4� 10�5 min�1.
Enhanced binding of paclitaxel to HT29 colon cancercells when delivered by SA1-cetuximab
We further evaluated the binding of paclitaxel using delivery
by SA1-cetuximab, in comparison to that of water-soluble
paclitaxel and paclitaxel adsorbed on wild-type B. subtilis
PY79. After 4 h incubation using three formulations of
paclitaxel with HT29 colon cancer cells, it was found
(Figure 6) that water-soluble paclitaxel could bind to HT29
cells but was only clearly observable in about 3% of the cell
population as indicated by a green signal (Figure 6B). In
control experiments, HT29 cells without paclitaxel incubation
showed only a blue signal of DAPI staining the nucleus,
without an observable green signal. Paclitaxel bound on wild-
type B. subtilis PY79 also showed low but clear green signals
of binding in about 4% of cells even though most of paclitaxel
Figure 3. Western analysis of binding of biotinylated cetuximab to SA1 spores. Panel A: 1mg of biotinylated mouse-human chimeric monoclonal IgGcetuximab was bound to 1� 109 killed spores (SA1, lane 1, and PY79, lane 2) and total extracted proteins of 2� 108 spores were applied to each well,and then were fractionated on 12% SDS-PAGE gels and transferred to membranes and probed with anti-human IgG conjugated with AlkalinePhosphatase (Promega, WI). A positive control was 100 ng biotinylated cetuximab applied directly to the well and run in parallel (lane 3). Molecularweight markers (kDa) are indicated. Panel B: 0.25mg, 1 mg, 4 mg and 8mg of biotinylated cetuximab was bound to 1� 109 killed spores and thebiotinylated cetuximab bound to spores was plotted (circles). Panel C: binding of 1mg biotinylated cetuximab to 1� 109 killed spores at different pH’s,ranging from 2 (lane 1), 4 (lane 2), 6 (lane 3), 8 (lane 4), to 10 (lane 5), and total proteins of 2� 108 spores were used for Western analysis. Molecularweight markers (kDa) are indicated.
6 V. A. T. Nguyen et al. J Drug Target, Early Online: 1–14
Jour
nal o
f D
rug
Tar
getin
g D
ownl
oade
d fr
om in
form
ahea
lthca
re.c
om b
y U
nive
rsity
Lib
rary
Utr
echt
on
03/1
8/13
For
pers
onal
use
onl
y.
remained on the spores bound to the surface of HT29 cells
(Figure 6C). Interestingly, when paclitaxel was delivered
by SA1-cetuximab, the intensity of paclitaxel bound to
HT29 cells was increased significantly with almost all
cells labeled green (Figure 6D). When the concentration of
paclitaxel-SA1-cetuximab was lowered to 250 nM, we also
observed a similar intensity to that of water-soluble paclitaxel
at 1 mM (data not shown). These results indicate that a 4-fold
enhancement in binding of paclitaxel to HT29 colon cancer
cells was obtained when paclitaxel was delivered by
SA1-cetuximab. To test the specificity of SA1-cetuximab
for delivery of paclitaxel to HT29 colon cancer cells, we
performed similar experiments with the KPL4 breast cancer
cells, which was a cetuximab-resistant cell line. In fact, the
control KPL4 cells without incubation of paclitaxel emitted
only faint green signals of autofluorescence. As shown in
Figure 6(E), after setting an off-set to remove the
background signal, we observed only the blue signal
(nucleus). In Figure 6(H), the intensity of clear green signals
indicating binding of paclitaxel Green Oregon 488 in KPL4
cells when incubated with 1 mM paclitaxel-SA1-cetuximab
was marginally higher than that with 1 mM of the water-
soluble form (Figure 6F) and was almost equal to that with
1 mM paclitaxel-PY79 (Figure 6G). In conclusion, SA1-
cetuximab spores delivered paclitaxel more specifically and
efficiently to the target colon cells than unmodified PY79
spores.
Paclitaxel-SA1-cetuximab inhibits growth of HT29
Since SA1-cetuximab delivered paclitaxel more specifically
to the target HT29 cells compared to the water-soluble
paclitaxel, we asked whether this targeted delivery could
augment inhibition of cell growth. The growth of cells in the
Figure 4. Real-time monitoring of HT29 and KPL4 growth without and with the presence of SA1-cetuximab. Panel A: averaged real-time curves ofcell index of HT29 only (g), 10 000 HT29 cells mixed with 1� 108 SA1-cetusimab spores (�), medium (m) and 1� 108 SA1-cetuximab (˙). Panel B:averaged real-time curves of cell index of KPL4 only (g), 2000 KPL4 cells mixed with 1� 108 SA1-cetusimab spores (�), medium (m), andSA1-cetuximab (˙).
DOI: 10.3109/1061186X.2013.778262 Killed Bacillus subtilis spores expressing streptavidin 7
Jour
nal o
f D
rug
Tar
getin
g D
ownl
oade
d fr
om in
form
ahea
lthca
re.c
om b
y U
nive
rsity
Lib
rary
Utr
echt
on
03/1
8/13
For
pers
onal
use
onl
y.
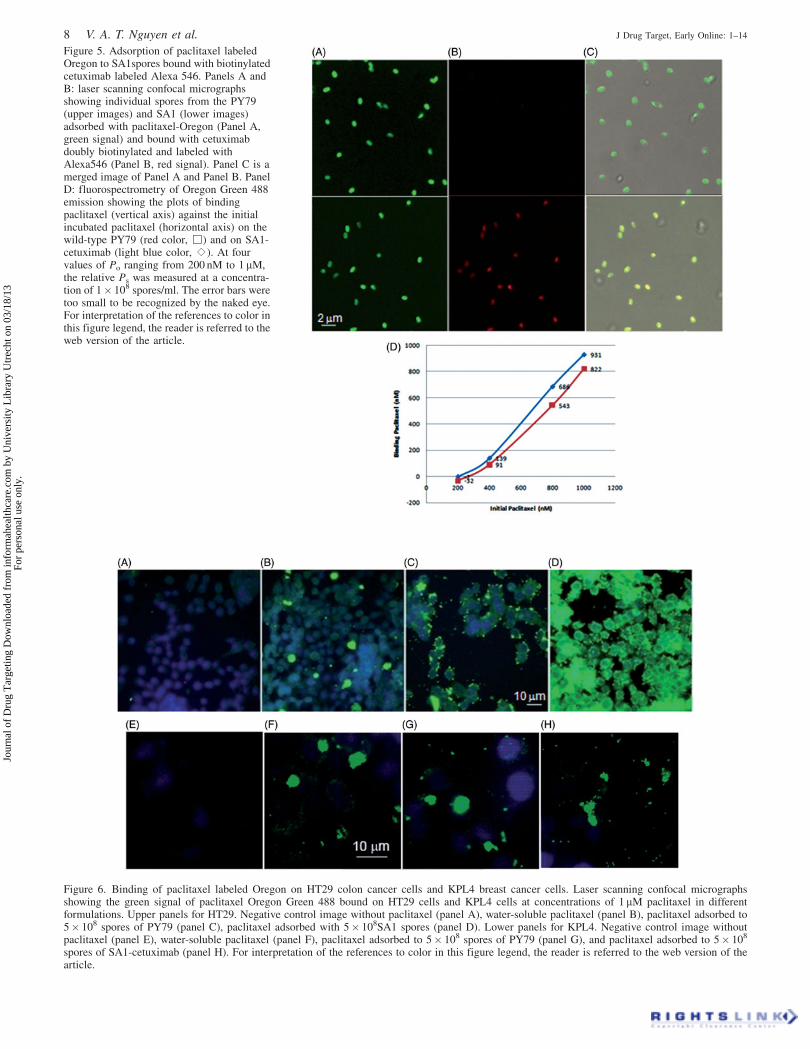
Figure 5. Adsorption of paclitaxel labeledOregon to SA1spores bound with biotinylatedcetuximab labeled Alexa 546. Panels A andB: laser scanning confocal micrographsshowing individual spores from the PY79(upper images) and SA1 (lower images)adsorbed with paclitaxel-Oregon (Panel A,green signal) and bound with cetuximabdoubly biotinylated and labeled withAlexa546 (Panel B, red signal). Panel C is amerged image of Panel A and Panel B. PanelD: fluorospectrometry of Oregon Green 488emission showing the plots of bindingpaclitaxel (vertical axis) against the initialincubated paclitaxel (horizontal axis) on thewild-type PY79 (red color, œ) and on SA1-cetuximab (light blue color, s). At fourvalues of Po ranging from 200 nM to 1 mM,the relative Ps was measured at a concentra-tion of 1� 108 spores/ml. The error bars weretoo small to be recognized by the naked eye.For interpretation of the references to color inthis figure legend, the reader is referred to theweb version of the article.
Figure 6. Binding of paclitaxel labeled Oregon on HT29 colon cancer cells and KPL4 breast cancer cells. Laser scanning confocal micrographsshowing the green signal of paclitaxel Oregon Green 488 bound on HT29 cells and KPL4 cells at concentrations of 1 mM paclitaxel in differentformulations. Upper panels for HT29. Negative control image without paclitaxel (panel A), water-soluble paclitaxel (panel B), paclitaxel adsorbed to5� 108 spores of PY79 (panel C), paclitaxel adsorbed with 5� 108SA1 spores (panel D). Lower panels for KPL4. Negative control image withoutpaclitaxel (panel E), water-soluble paclitaxel (panel F), paclitaxel adsorbed to 5� 108 spores of PY79 (panel G), and paclitaxel adsorbed to 5� 108
spores of SA1-cetuximab (panel H). For interpretation of the references to color in this figure legend, the reader is referred to the web version of thearticle.
8 V. A. T. Nguyen et al. J Drug Target, Early Online: 1–14
Jour
nal o
f D
rug
Tar
getin
g D
ownl
oade
d fr
om in
form
ahea
lthca
re.c
om b
y U
nive
rsity
Lib
rary
Utr
echt
on
03/1
8/13
For
pers
onal
use
onl
y.
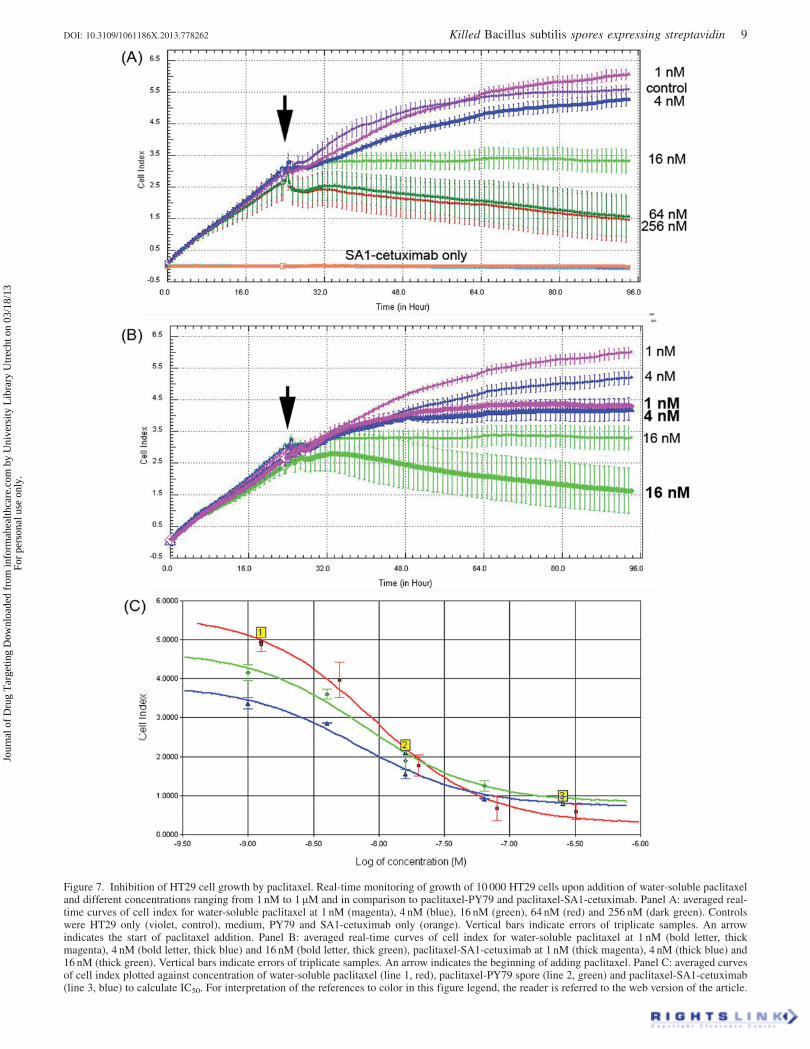
Figure 7. Inhibition of HT29 cell growth by paclitaxel. Real-time monitoring of growth of 10 000 HT29 cells upon addition of water-soluble paclitaxeland different concentrations ranging from 1 nM to 1 mM and in comparison to paclitaxel-PY79 and paclitaxel-SA1-cetuximab. Panel A: averaged real-time curves of cell index for water-soluble paclitaxel at 1 nM (magenta), 4 nM (blue), 16 nM (green), 64 nM (red) and 256 nM (dark green). Controlswere HT29 only (violet, control), medium, PY79 and SA1-cetuximab only (orange). Vertical bars indicate errors of triplicate samples. An arrowindicates the start of paclitaxel addition. Panel B: averaged real-time curves of cell index for water-soluble paclitaxel at 1 nM (bold letter, thickmagenta), 4 nM (bold letter, thick blue) and 16 nM (bold letter, thick green), paclitaxel-SA1-cetuximab at 1 nM (thick magenta), 4 nM (thick blue) and16 nM (thick green). Vertical bars indicate errors of triplicate samples. An arrow indicates the beginning of adding paclitaxel. Panel C: averaged curvesof cell index plotted against concentration of water-soluble paclitaxel (line 1, red), paclitaxel-PY79 spore (line 2, green) and paclitaxel-SA1-cetuximab(line 3, blue) to calculate IC50. For interpretation of the references to color in this figure legend, the reader is referred to the web version of the article.
DOI: 10.3109/1061186X.2013.778262 Killed Bacillus subtilis spores expressing streptavidin 9
Jour
nal o
f D
rug
Tar
getin
g D
ownl
oade
d fr
om in
form
ahea
lthca
re.c
om b
y U
nive
rsity
Lib
rary
Utr
echt
on
03/1
8/13
For
pers
onal
use
onl
y.
presence of water-soluble paclitaxel or paclitaxel-SA1-
cetuximab was recorded in a real-time profile (Figure 7).
At 1 nM paclitaxel (Figure 7A, magenta thin line) the growth
of cells was almost normal and the same as when paclitaxel
was not added (Figure 7A, blue violet thin line). As controls,
we found that either 1� 106 SA1-cetuximab spores (contain-
ing �0.2 ng cetuximab), PY79 (1� 106 PY79 spores), or
cetuximab (up to 20 ng, 100-fold higher amount compared to
that of cetuximab bound on SA1) did not cause any defect in
cell growth in the 200 ml well. At increasing concentrations
from 4 nM to 64 nM of paclitaxel added to cells (as indicated
by an arrow), the growth of cells was inhibited at increasing
levels as shown in Figure 7(A). In detail, at 64 nM (Figure 7A,
dark green line) the inhibition of growth was the same as that
at 256 nM (Figure 7A, red line) and 1 mM (data not shown),
indicating the saturation of cell-growth inhibition was
obtained at 64 nM, and that reliability in paclitaxel concen-
trations for electric measurement of cell growth inhibition was
within 1–64 nM. When we used the paclitaxel-SA1-cetuximab
at the same concentration ranging from 1 nM to 16 nM, we
always obtained a higher level of cell growth inhibition as
indicated by the thick lines, in comparison to that as indicated
by the thin lines for water-soluble paclitaxel (Figure 7B).
Specifically, the level of inhibition of cell growth at 1 nM
paclitaxel-SA1-cetuximab (Figure 7B, bold letter, thick
magenta line) was much stronger than that at 1 nM and
even at 4 nM water-soluble paclitaxel (Figure 7B, magenta
and blue thin lines). When paclitaxel-SA1-cetuximab was
increased to 16 nM, the inhibition curve (Figure 7B, bold
letter, thick green line) was similar to that at 64 nM water-
soluble paclitaxel (Figure 7A, thin green line). When we
compared the IC50 of paclitaxel at different formulations,
either in water-soluble form or paclitaxel adsorbed on PY79
or SA1-cetuximab (Figure 7C), we realized that the IC50 of
paclitaxel-SA1-cetuximab was much lower (2.9 nM) than that
of the IC50 of paclitaxel-PY79 (7.8 nM) and the IC50 of water-
soluble paclitaxel (14.5 nM). These data confirm an approxi-
mate 5-fold enhancement of HT29 cell inhibition when
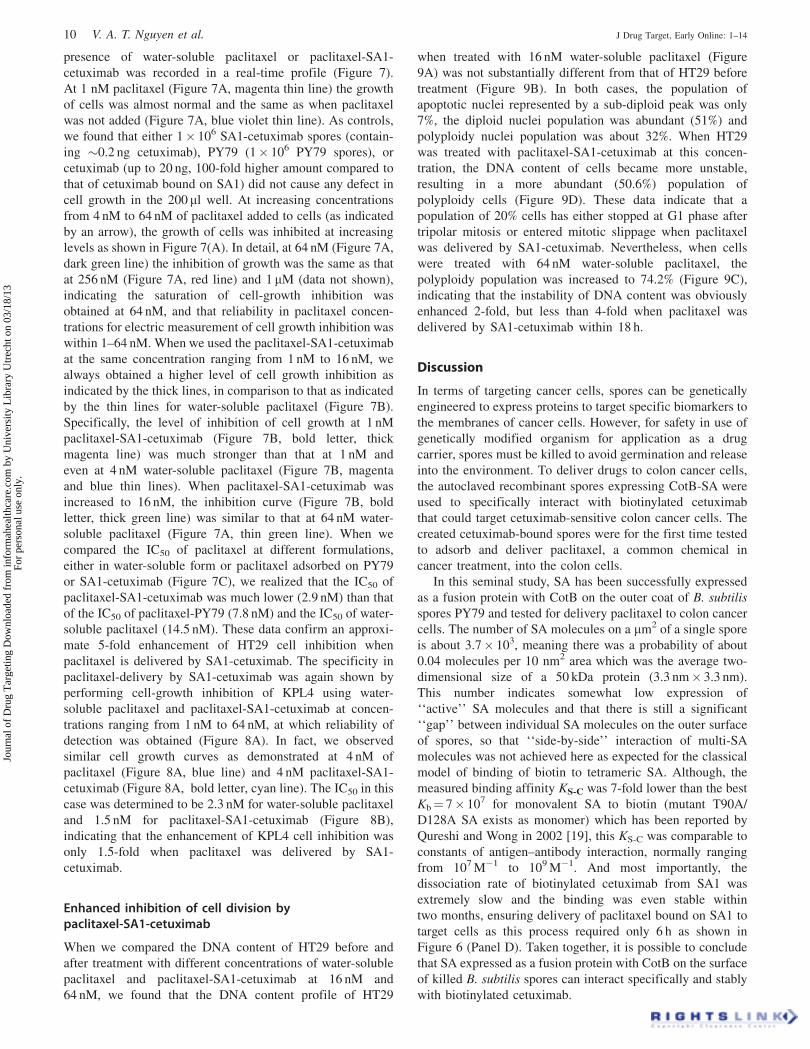
paclitaxel is delivered by SA1-cetuximab. The specificity in
paclitaxel-delivery by SA1-cetuximab was again shown by
performing cell-growth inhibition of KPL4 using water-
soluble paclitaxel and paclitaxel-SA1-cetuximab at concen-
trations ranging from 1 nM to 64 nM, at which reliability of
detection was obtained (Figure 8A). In fact, we observed
similar cell growth curves as demonstrated at 4 nM of
paclitaxel (Figure 8A, blue line) and 4 nM paclitaxel-SA1-
cetuximab (Figure 8A, bold letter, cyan line). The IC50 in this
case was determined to be 2.3 nM for water-soluble paclitaxel
and 1.5 nM for paclitaxel-SA1-cetuximab (Figure 8B),
indicating that the enhancement of KPL4 cell inhibition was
only 1.5-fold when paclitaxel was delivered by SA1-
cetuximab.
Enhanced inhibition of cell division bypaclitaxel-SA1-cetuximab
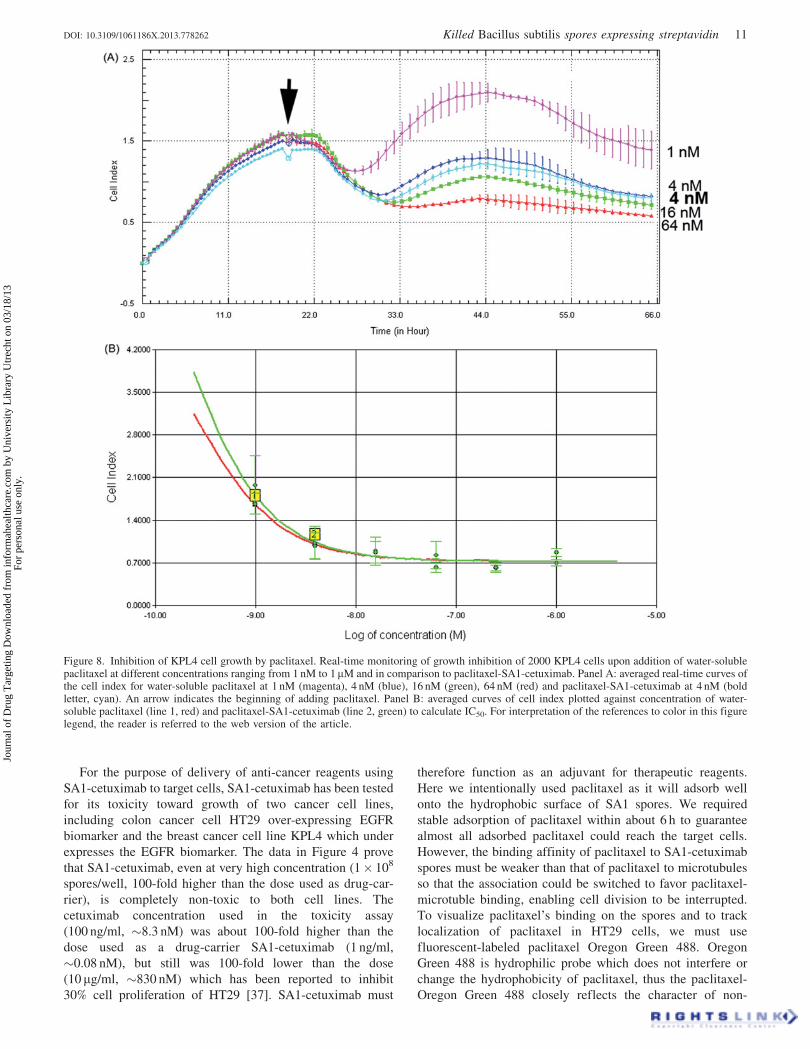
When we compared the DNA content of HT29 before and
after treatment with different concentrations of water-soluble
paclitaxel and paclitaxel-SA1-cetuximab at 16 nM and
64 nM, we found that the DNA content profile of HT29
when treated with 16 nM water-soluble paclitaxel (Figure
9A) was not substantially different from that of HT29 before
treatment (Figure 9B). In both cases, the population of
apoptotic nuclei represented by a sub-diploid peak was only
7%, the diploid nuclei population was abundant (51%) and
polyploidy nuclei population was about 32%. When HT29
was treated with paclitaxel-SA1-cetuximab at this concen-
tration, the DNA content of cells became more unstable,
resulting in a more abundant (50.6%) population of
polyploidy cells (Figure 9D). These data indicate that a
population of 20% cells has either stopped at G1 phase after
tripolar mitosis or entered mitotic slippage when paclitaxel
was delivered by SA1-cetuximab. Nevertheless, when cells
were treated with 64 nM water-soluble paclitaxel, the
polyploidy population was increased to 74.2% (Figure 9C),
indicating that the instability of DNA content was obviously
enhanced 2-fold, but less than 4-fold when paclitaxel was
delivered by SA1-cetuximab within 18 h.
Discussion
In terms of targeting cancer cells, spores can be genetically
engineered to express proteins to target specific biomarkers to
the membranes of cancer cells. However, for safety in use of
genetically modified organism for application as a drug
carrier, spores must be killed to avoid germination and release
into the environment. To deliver drugs to colon cancer cells,
the autoclaved recombinant spores expressing CotB-SA were
used to specifically interact with biotinylated cetuximab
that could target cetuximab-sensitive colon cancer cells. The
created cetuximab-bound spores were for the first time tested
to adsorb and deliver paclitaxel, a common chemical in
cancer treatment, into the colon cells.
In this seminal study, SA has been successfully expressed
as a fusion protein with CotB on the outer coat of B. subtilis
spores PY79 and tested for delivery paclitaxel to colon cancer
cells. The number of SA molecules on a mm2 of a single spore
is about 3.7� 103, meaning there was a probability of about
0.04 molecules per 10 nm2 area which was the average two-
dimensional size of a 50 kDa protein (3.3 nm� 3.3 nm).
This number indicates somewhat low expression of
‘‘active’’ SA molecules and that there is still a significant
‘‘gap’’ between individual SA molecules on the outer surface
of spores, so that ‘‘side-by-side’’ interaction of multi-SA
molecules was not achieved here as expected for the classical
model of binding of biotin to tetrameric SA. Although, the
measured binding affinity KS-C was 7-fold lower than the best
Kb¼ 7� 107 for monovalent SA to biotin (mutant T90A/
D128A SA exists as monomer) which has been reported by
Qureshi and Wong in 2002 [19], this KS-C was comparable to
constants of antigen–antibody interaction, normally ranging
from 107 M�1 to 109 M�1. And most importantly, the
dissociation rate of biotinylated cetuximab from SA1 was
extremely slow and the binding was even stable within
two months, ensuring delivery of paclitaxel bound on SA1 to
target cells as this process required only 6 h as shown in
Figure 6 (Panel D). Taken together, it is possible to conclude
that SA expressed as a fusion protein with CotB on the surface
of killed B. subtilis spores can interact specifically and stably
with biotinylated cetuximab.
10 V. A. T. Nguyen et al. J Drug Target, Early Online: 1–14
Jour
nal o
f D
rug
Tar
getin
g D
ownl
oade
d fr
om in
form
ahea
lthca
re.c
om b
y U
nive
rsity
Lib
rary
Utr
echt
on
03/1
8/13
For
pers
onal
use
onl
y.
For the purpose of delivery of anti-cancer reagents using
SA1-cetuximab to target cells, SA1-cetuximab has been tested
for its toxicity toward growth of two cancer cell lines,
including colon cancer cell HT29 over-expressing EGFR
biomarker and the breast cancer cell line KPL4 which under
expresses the EGFR biomarker. The data in Figure 4 prove
that SA1-cetuximab, even at very high concentration (1� 108
spores/well, 100-fold higher than the dose used as drug-car-
rier), is completely non-toxic to both cell lines. The
cetuximab concentration used in the toxicity assay
(100 ng/ml, �8.3 nM) was about 100-fold higher than the
dose used as a drug-carrier SA1-cetuximab (1 ng/ml,
�0.08 nM), but still was 100-fold lower than the dose
(10mg/ml, �830 nM) which has been reported to inhibit
30% cell proliferation of HT29 [37]. SA1-cetuximab must
therefore function as an adjuvant for therapeutic reagents.
Here we intentionally used paclitaxel as it will adsorb well
onto the hydrophobic surface of SA1 spores. We required
stable adsorption of paclitaxel within about 6 h to guarantee
almost all adsorbed paclitaxel could reach the target cells.
However, the binding affinity of paclitaxel to SA1-cetuximab
spores must be weaker than that of paclitaxel to microtubules
so that the association could be switched to favor paclitaxel-
microtuble binding, enabling cell division to be interrupted.
To visualize paclitaxel’s binding on the spores and to track
localization of paclitaxel in HT29 cells, we must use
fluorescent-labeled paclitaxel Oregon Green 488. Oregon
Green 488 is hydrophilic probe which does not interfere or
change the hydrophobicity of paclitaxel, thus the paclitaxel-
Oregon Green 488 closely reflects the character of non-
Figure 8. Inhibition of KPL4 cell growth by paclitaxel. Real-time monitoring of growth inhibition of 2000 KPL4 cells upon addition of water-solublepaclitaxel at different concentrations ranging from 1 nM to 1mM and in comparison to paclitaxel-SA1-cetuximab. Panel A: averaged real-time curves ofthe cell index for water-soluble paclitaxel at 1 nM (magenta), 4 nM (blue), 16 nM (green), 64 nM (red) and paclitaxel-SA1-cetuximab at 4 nM (boldletter, cyan). An arrow indicates the beginning of adding paclitaxel. Panel B: averaged curves of cell index plotted against concentration of water-soluble paclitaxel (line 1, red) and paclitaxel-SA1-cetuximab (line 2, green) to calculate IC50. For interpretation of the references to color in this figurelegend, the reader is referred to the web version of the article.
DOI: 10.3109/1061186X.2013.778262 Killed Bacillus subtilis spores expressing streptavidin 11
Jour
nal o
f D
rug
Tar
getin
g D
ownl
oade
d fr
om in
form
ahea
lthca
re.c
om b
y U
nive
rsity
Lib
rary
Utr
echt
on
03/1
8/13
For
pers
onal
use
onl
y.
labeled paclitaxel. Our observation in Figure 5 indicates that
the shape and size of SA1-cetuximab-paclitaxel is signifi-
cantly unchanged compared to either SA1 or wild-type PY79
spores. The ellipsoidal dimensions of B. subtilis PY79 spores
have been measured to be about 600 nm� 900 nm by Huynh
and her colleagues using transmission electron microscopy
[38], and these are therefore much larger than the size of
conventional nanoparticles, typically less than 100 nm.
Instead, the binding capacity for antibodies and or various
chemical moieties (e.g. paclitaxel) of our spores is much
greater than that of conventional nanoparticles, and the
increase in spherical dimension of the spores after binding
with cetuximab and paclitaxel is negligible. Additionally, as
shown in Figure 5, the stability and uniformity of our spores
are much greater than that of conventional nanoparticles.
The dissociation rate for paclitaxel-Oregon from SA1-
cetuximab in both PBS (at different pH) and even in the
serum was quite slow, as indicated by the half-life which
was greater than 48 h. This value was much longer than
that required for paclitaxel to reach the target cells, thus we
believe that almost all adsorbed paclitaxel was likely to be
delivered to the HT29 colon cancer cells, and that paclitaxel
could target colon cancer tumors if tested in an in vivo model.
This might result from the highly hydrophobic character of
the outer layer of PY79 spores which could promote tight
binding between paclitaxel and the outer layer of PY79
spores. As shown in Figure 6(C), paclitaxel could also bind to
B. subtilis wild-type PY79 spores attached to surrounding
HT29 cells. However, we observed a low intensity of
paclitaxel inside the HT29 cells, indicating that paclitaxel
could not enter the cells efficiently even though it was
brought in close contact with the cell membranes. By contrast,
the high intensity of paclitaxel Oregon Green 488 in Figure
6(D) suggests that SA1-cetuximab spores not only delivers
paclitaxel to HT29 cell membranes, but may also enter the
cells through endocytosis via specific interaction between
cetuximab and EGFR. However, to prove specificity in the
‘‘SA1-cetuximab-EGFR’’ models, further experiments of
knock-down expression of EGFR levels in HT29 cell line
should be performed. The 4-fold increasing intensity of
paclitaxel Oregon Green 488 inside the HT29 cells when
paclitaxel is adsorbed on SA1-cetuximab has proven the
specificity of delivery. The dissociation constant (Kd) of
paclitaxel from SA1 spores was about 625 nM which was
about 10-fold weaker than that (Kd� 60 nM) of paclitaxel-
microtubules [39]. Therefore, if paclitaxel-SA1-cetuximab
could enter the cells, the association direction could be
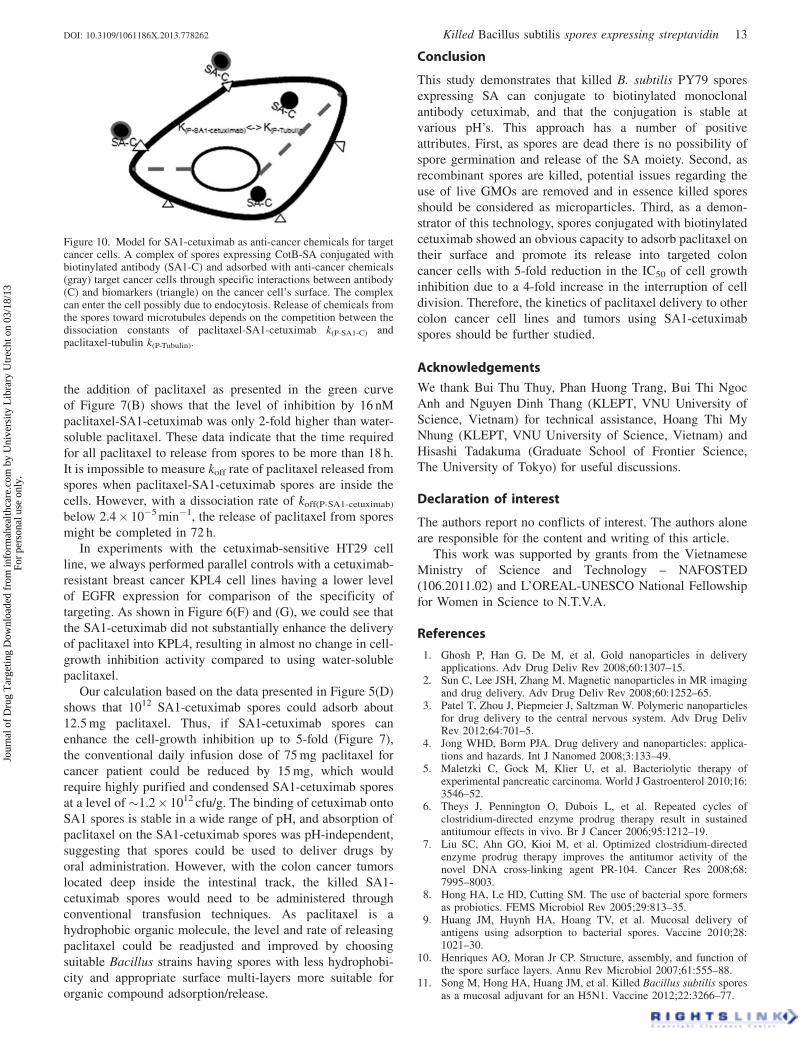
switched toward paclitaxel-microtubules. We propose this
hypothetical model for delivery of paclitaxel to HT29 colon
cancer cells by SA1-cetuximab in Figure 10.
The 4-fold enhancement in binding of paclitaxel to HT29
cells (Figure 6D) was almost in agreement with the 5-fold
reduction in value of IC50 (Figure 7C), suggesting that the
DNA instability or inhibition in cell division should be
increased within a range of about 4- to 5-fold. However,
we obtained only a 2-fold increase in the population of
polyploidy nucleic cells using a treatment of 16 nM
paclitaxel-SA1-cetuximab compared to that of 16 nM water
soluble paclitaxel (Figure 9B and D). This population was less
abundant to that in the case of 64 nM water-soluble paclitaxel
(Figure 9C), indicating that the DNA instability has not yet
increased to 4- or 5-fold and was similar to our data for cell
growth inhibition. This difference could be explained due to
the different observation times, 72 h in case of cell growth
inhibition, and only 18 h in the case of DNA content analysis.
Re-examination of the inhibition of cell growth at 18 h after
Figure 9. Effect of paclitaxel and paclitaxel-SA1-cetuximabon DNA-content of HT29cells. Flow cytometric analysis of HT29 cellpopulations having different DNA contentprofiles as indicated by the intensity of theDNA-specific fluorescent dye PI (PE-A).Panel A: populations of sub-diploid cells(7.6%), diploid cells (60.9%) and polyploidycells (32.6%) in control HT29 without treat-ment of paclitaxel. Panel B: populations ofsub-diploid cells (7.1%), diploid cells(62.9%), and polyploidy cells (31.5%) inHT29 treated with 16 nM paclitaxel. Panel C:populations of sub-diploid cells (5.1%), dip-loid cells (22.4%), and polyploidy cells(74.2%) in HT29 cells treated with 64 nMpaclitaxel. Panel D: populations of sub-diploid cells (6.9%), diploid cells (44.5%),and polyploidy cells (50.6%) in HT29 treatedwith 16 nM paclitaxel-SA1-cetuximab.
12 V. A. T. Nguyen et al. J Drug Target, Early Online: 1–14
Jour
nal o
f D
rug
Tar
getin
g D
ownl
oade
d fr
om in
form
ahea
lthca
re.c
om b
y U
nive
rsity
Lib
rary
Utr
echt
on
03/1
8/13
For
pers
onal
use
onl
y.
the addition of paclitaxel as presented in the green curve
of Figure 7(B) shows that the level of inhibition by 16 nM
paclitaxel-SA1-cetuximab was only 2-fold higher than water-
soluble paclitaxel. These data indicate that the time required
for all paclitaxel to release from spores to be more than 18 h.
It is impossible to measure koff rate of paclitaxel released from
spores when paclitaxel-SA1-cetuximab spores are inside the
cells. However, with a dissociation rate of koff(P-SA1-cetuximab)
below 2.4� 10�5 min�1, the release of paclitaxel from spores
might be completed in 72 h.
In experiments with the cetuximab-sensitive HT29 cell
line, we always performed parallel controls with a cetuximab-
resistant breast cancer KPL4 cell lines having a lower level
of EGFR expression for comparison of the specificity of
targeting. As shown in Figure 6(F) and (G), we could see that
the SA1-cetuximab did not substantially enhance the delivery
of paclitaxel into KPL4, resulting in almost no change in cell-
growth inhibition activity compared to using water-soluble
paclitaxel.
Our calculation based on the data presented in Figure 5(D)
shows that 1012 SA1-cetuximab spores could adsorb about
12.5 mg paclitaxel. Thus, if SA1-cetuximab spores can
enhance the cell-growth inhibition up to 5-fold (Figure 7),
the conventional daily infusion dose of 75 mg paclitaxel for
cancer patient could be reduced by 15 mg, which would
require highly purified and condensed SA1-cetuximab spores
at a level of �1.2� 1012 cfu/g. The binding of cetuximab onto
SA1 spores is stable in a wide range of pH, and absorption of
paclitaxel on the SA1-cetuximab spores was pH-independent,
suggesting that spores could be used to deliver drugs by
oral administration. However, with the colon cancer tumors
located deep inside the intestinal track, the killed SA1-
cetuximab spores would need to be administered through
conventional transfusion techniques. As paclitaxel is a
hydrophobic organic molecule, the level and rate of releasing
paclitaxel could be readjusted and improved by choosing
suitable Bacillus strains having spores with less hydrophobi-
city and appropriate surface multi-layers more suitable for
organic compound adsorption/release.
Conclusion
This study demonstrates that killed B. subtilis PY79 spores
expressing SA can conjugate to biotinylated monoclonal
antibody cetuximab, and that the conjugation is stable at
various pH’s. This approach has a number of positive
attributes. First, as spores are dead there is no possibility of
spore germination and release of the SA moiety. Second, as
recombinant spores are killed, potential issues regarding the
use of live GMOs are removed and in essence killed spores
should be considered as microparticles. Third, as a demon-
strator of this technology, spores conjugated with biotinylated
cetuximab showed an obvious capacity to adsorb paclitaxel on
their surface and promote its release into targeted colon
cancer cells with 5-fold reduction in the IC50 of cell growth
inhibition due to a 4-fold increase in the interruption of cell
division. Therefore, the kinetics of paclitaxel delivery to other
colon cancer cell lines and tumors using SA1-cetuximab
spores should be further studied.
Acknowledgements
We thank Bui Thu Thuy, Phan Huong Trang, Bui Thi Ngoc
Anh and Nguyen Dinh Thang (KLEPT, VNU University of
Science, Vietnam) for technical assistance, Hoang Thi My
Nhung (KLEPT, VNU University of Science, Vietnam) and
Hisashi Tadakuma (Graduate School of Frontier Science,
The University of Tokyo) for useful discussions.
Declaration of interest
The authors report no conflicts of interest. The authors alone
are responsible for the content and writing of this article.
This work was supported by grants from the Vietnamese
Ministry of Science and Technology – NAFOSTED
(106.2011.02) and L’OREAL-UNESCO National Fellowship
for Women in Science to N.T.V.A.
References
1. Ghosh P, Han G, De M, et al. Gold nanoparticles in deliveryapplications. Adv Drug Deliv Rev 2008;60:1307–15.
2. Sun C, Lee JSH, Zhang M. Magnetic nanoparticles in MR imagingand drug delivery. Adv Drug Deliv Rev 2008;60:1252–65.
3. Patel T, Zhou J, Piepmeier J, Saltzman W. Polymeric nanoparticlesfor drug delivery to the central nervous system. Adv Drug DelivRev 2012;64:701–5.
4. Jong WHD, Borm PJA. Drug delivery and nanoparticles: applica-tions and hazards. Int J Nanomed 2008;3:133–49.
5. Maletzki C, Gock M, Klier U, et al. Bacteriolytic therapy ofexperimental pancreatic carcinoma. World J Gastroenterol 2010;16:3546–52.
6. Theys J, Pennington O, Dubois L, et al. Repeated cycles ofclostridium-directed enzyme prodrug therapy result in sustainedantitumour effects in vivo. Br J Cancer 2006;95:1212–19.
7. Liu SC, Ahn GO, Kioi M, et al. Optimized clostridium-directedenzyme prodrug therapy improves the antitumor activity of thenovel DNA cross-linking agent PR-104. Cancer Res 2008;68:7995–8003.
8. Hong HA, Le HD, Cutting SM. The use of bacterial spore formersas probiotics. FEMS Microbiol Rev 2005;29:813–35.
9. Huang JM, Huynh HA, Hoang TV, et al. Mucosal delivery ofantigens using adsorption to bacterial spores. Vaccine 2010;28:1021–30.
10. Henriques AO, Moran Jr CP. Structure, assembly, and function ofthe spore surface layers. Annu Rev Microbiol 2007;61:555–88.
11. Song M, Hong HA, Huang JM, et al. Killed Bacillus subtilis sporesas a mucosal adjuvant for an H5N1. Vaccine 2012;22:3266–77.
Figure 10. Model for SA1-cetuximab as anti-cancer chemicals for targetcancer cells. A complex of spores expressing CotB-SA conjugated withbiotinylated antibody (SA1-C) and adsorbed with anti-cancer chemicals(gray) target cancer cells through specific interactions between antibody(C) and biomarkers (triangle) on the cancer cell’s surface. The complexcan enter the cell possibly due to endocytosis. Release of chemicals fromthe spores toward microtubules depends on the competition between thedissociation constants of paclitaxel-SA1-cetuximab k(P-SA1-C) andpaclitaxel-tubulin k(P-Tubulin).
DOI: 10.3109/1061186X.2013.778262 Killed Bacillus subtilis spores expressing streptavidin 13
Jour
nal o
f D
rug
Tar
getin
g D
ownl
oade
d fr
om in
form
ahea
lthca
re.c
om b
y U
nive
rsity
Lib
rary
Utr
echt
on
03/1
8/13
For
pers
onal
use
onl
y.
12. Ricca E, Cutting SM. Emerging applications of bacterial spores innanobiotechnology. J Nanobiotechnol 2003;1:6–16.
13. Le DH, Huynh HA, Fairweather N, et al. Bacterial spores asvaccine vehicles. Infect Immun 2003;71:2810–18.
14. Le DH, Huynh HA, Atkins HS, et al. Immunization against anthraxusing Bacillus subtilis spores expressing the anthrax protectiveantigen. Vaccine 2006;25:346–55.
15. Cutting SM. Spores as oral vaccines. In: Ricca E, HenriquesAO, Cutting SM, eds. Bacterial spore formers: probiotics andemerging applications. Norfolk: Horizon Bioscience Press; 2004:201–6.
16. Mauriello EMF. Display of heterologous antigens on the Bacillussubtilis spore coat using CotC as a fusion partner. Vaccine 2004;22:1177–87.
17. Kim LH, Lee CS, Kim BG. Spore-displayed streptavidin: a livediagnostic tool in biotechnology. Biochem Biophys Res Commun2005;331:210–14.
18. Green NM. Avidin and streptavidin. Methods Enzymol 1990;84:51–67.
19. Qureshi, MH, Wong SL. Design, production, and characterizationof a monomeric streptavidin and its application for affinitypurification of biotinylated proteins. Protein Express Purification2002;25:409–15.
20. Wilchek M, Bayer EA, Livnah O. Essentials of biorecognition: thestreptavidin–biotin system as a model for protein–protein andprotein–ligand interaction. Immunol Lett 2006;103:27–32.
21. Mendelsohn J, Baselga J. The EGF receptor family as targets forcancer therapy. Oncogene 2000;19:6550–65.
22. Sanford D, Markowitz SD, Bertagnolli M. Molecular basis ofcolorectal cancer. New Engl J Med 2009;361:2449–60.
23. Jhawer M. PIK3CA mutation/PTEN expression status predictsresponse of colon cancer cells to the epidermal growth factorreceptor inhibitor cetuximab. Cancer Res 2008;68:1953–61.
24. Mckay JA, Murray LJ, Curran S. Evaluation of the epidermalgrowth factor receptor (EGFR) in colorectal tumours and lymphnode metastases. Eur J Cancer 2002;38:2258–64.
25. Cunningham D, Humblet Y, Siena S, et al. Cetuximab monotherapyand cetuximab plus irinotecan in irinotecan-refractory metastaticcolorectal cancer. New Eng J Med 2008;351:337–45.
26. Horwitz SB. Mechanism of action of taxol. Trends Pharmacol Sci1992;13:134–6.
27. Sambrook J, Fritsch EF, Maniatis T. Molecular cloning: alaboratory manual. 2nd ed. Cold Spring Harbor (NY): ColdSpring Harbor Laboratory; 1989.
28. Cutting SM, Vander Horn PB. Genetic analysis. In: Harwood CR,Cutting SM, eds. Molecular biological methods for Bacillus.Chichester, UK: Wiley; 1990:27–74.
29. Isticato R, Cangiano G, Tran HT, et al. Surface display ofrecombinant proteins on Bacillus subtilis spores. J Bacteriol 2001;183:6294–301.
30. Nicholson WL, Setlow P. Sporulation, germination, and outgrowth.In: Harwood CR, Cutting SM, eds. Molecular biological methodsfor Bacillus. Sussex, UK: Wiley;1990; 391–450.
31. Nguyen TVA, Kamio Y, Higuchi H. Single-molecule imaging ofcooperative assembly of g-hemolysin on erythrocyte membranes.EMBO J 2003;22:4968–79.
32. Nguyen HA, Nguyen TVA, Kamio Y, Higuchi H. Single-molecule environment-sensitive fluorophores inserted into cellmembranes by staphylococcal g-hemolysin. Biochemistry 2006;45:2570–6.
33. Mariadason JM, Arango D, Qiuhu S, et al. Gene expressionprofiling-based prediction of response of colon carcinoma cells to5-fluorouracil and camptothecin. Cancer Res 2003;63:8791–812.
34. Kurebayashi J, Otsuki T, Tang CK, et al. Isolation and character-ization of a new human breast cancer cell line, KPL-4, expressingthe Erb B family receptors and interleukin-6. Br J Cancer 1999;79:707–17.
35. Fujimoto-Ouchi K, Sekiguchi F, Tanaka Y. Antitumor activity ofcombinations of anti-HER-2 antibody trastuzumab and oralfluoropyrimidines capecitabine/50-dFUrd in human breast cancermodels. Cancer Chemother Pharmacol 2002;49:211–16.
36. Tada H, Higuchi H, Watanabe TM, Ohuchi N. In vivo real-timetracking of single quantum dots conjugated with monoclonal anti-HER2 antibody in tumors of mice. Cancer Res 2007;67:1138–44.
37. Xu H, Yu Y, Marciniak D, et al. Epidermal growth factor receptor(EGFR)-related protein inhibits multiple members of the EGFRfamily in colon and breast cancer cells. Mol Cancer Ther 1989;4:435–42.
38. Huynh H, To E, Fakhry S, et al. Defining the natural habitat ofBacillus spore-formers. Res Microbiol 2009;160:134–43.
39. Li Y, Edsall Jr R, Jagtap PG, et al. Equilibrium studies ofa fluorescent paclitaxel derivative binding to microtubules.Biochemistry 2000;39:616–23.
14 V. A. T. Nguyen et al. J Drug Target, Early Online: 1–14
Jour
nal o
f D
rug
Tar
getin
g D
ownl
oade
d fr
om in
form
ahea
lthca
re.c
om b
y U
nive
rsity
Lib
rary
Utr
echt
on
03/1
8/13
For
pers
onal
use
onl
y.