kilbride's tools for managers and teams · kilbride's tools for managers and teams ... l...
TRANSCRIPT

KKiillbbrriiddee''ss TToooollss ffoorrMMaannaaggeerrss aanndd TTeeaammss
© Kilbride Consulting, Inc., Downers Grove, IL 630-515-9882

Tools for Managers and Teams
Page 1© Kilbride Consulting, Inc.
Process Definition (5x5)
What is it?
This tool outlines the major steps in a process, but limitsthe detail (to 25 steps) until an area is selected for detailedmapping. It can be used to:
u Design new processes, or
u Identify the boundaries and focus of an effort toimprove an existing process.
It is often helpful to use this tool prior to mapping theCurrent State of a process.
How do I use It?
Ê Name the process to be defined.
Ë Clarify roles and allow 45-60 minutes.
u If someone is not designated as process Owner,identify who will assume that role.
u Also identify those who operate/perform theprocess.
If the Owner and some Operators arenot involved, stop! You can't separateWHAT process you study from WHOdoes so.
Are the meeting participantsresponsible for the process?
Do they have authority to change it?
If not, change the team or pick adifferent process.
Ì Write the 5 Major Steps to establish the boundaries ofthe process.
Write major steps and sub-steps on stickynotes. This makes it is easy to move them ifyou change your mind about sequence.
Write process steps in <Verb + Object>format e.g., Write the order, Select vendors,Order materials, Submit the order, etc.
The major steps/boundaries are oftenestablished by the team leader, owner, orsponsor prior to the first team meeting.

Tools for Managers and Teams
Page 2© Kilbride Consulting, Inc.
TOOL TIP: If a P4 tool for chartering animprovement team (page xx) wascompleted previously, then 5 MajorSteps have already been identified.
It is best to use the 5x5 tool to study a process that:
u Is an integral "whole, with clear start/endpoints and provides a product or service ofvalue to a customer.
u Is more versus less complex.
u Involves multiple individuals, groups orfunctions.
u The right team can be assembled, includingthose with sufficient understanding of how itworks and authority to change it.
u The sponsor agrees it is a priority.
u Is likely to yield significant payoff as a resultof improvement.
u You are enthusiastic about changing.
u You aren't certain how to improve it, i.e.,the answer is "unknown".
Í List up to 5 sub-steps for each of the Major Steps.
HINT: Process steps and sub-steps should bewritten on sticky notes in <Verb + Object>format e.g., Write the order, Select vendors,Order materials, Submit the order, etc.
Î Write the product or service Output that results fromthis process.
HINT: Write the Output in <Object + PastTense Verb > format e.g., Order written,Problem solved, Vendor selected, MaterialOrdered, Position filled, Pizza delivered, etc.
The Output describes the purpose of the process, i.e.,the reason we do it. Consider the following:
u Is the Output absolutely necessary? Why?
u Is it essential that we continue to deliver thisOutput? To operate this process?
If the purpose of a process is to rework,revise, check or correct something,then the best improvement strategy isusually to eliminate the need for thisprocess entirely.

Tools for Managers and Teams
Page 3© Kilbride Consulting, Inc.
Ï List the key Customers of the process.
u Who receives and uses the outputs of thisprocess?
u Customers can be either internal or external toyour organization.
Ð List the Requirements of those customers for theproduct/service output of this process.
u What do your customers need/want from theoutput provided by this process?
u What are their most important requirements?
Ñ Review existing data to document Current performancelevels for Cost, Quantity, Cycle Time, Quality, etc.
If existing data for Current performanceare not available, gather data to establishthe baseline performance of the process.
• Do not spend a great deal of time and money to measure a process you are about to significantly change, or
• Establish measures that will likely beuseful for measurement ofperformance after the redesign iscomplete.
• COST (HOW MUCH?) cost to operate the processaccounts for people, materials and equipment, plus thecost of poor quality due to scrap, rework, waste, etc.Target price accounts for cost plus desired margins.
• QUANTITY (HOW MANY?) the number of unitsproduced or services delivered during a given timeperiod, i.e., the capacity or throughput of a process.Process capacity, or throughput, is determined by asingle constraint, which may be internal (productionlimited) or external (market, or demand limited).
• TIME (BY WHEN?) Cycle time is the total time fromstart to completion of a process. This is a key driver ofIn-time performance, which refers to the ability todeliver a product or service rapidly, i.e., when thecustomer needs it. When the constraint is internal,capacity is a key driver of On-time performance, whichrefers to the ability to deliver a product or servicereliably, i.e., when you said you would. Value-addedIndex (VAI) refers to the percentage of total cycle timespent in value-added operations (time in value-addedsteps ÷ total cycle time). For many organizations, VAI isless than 10%.
• QUALITY (WHAT is GOOD ENOUGH?) measurable criteria for determining whether an outputmeets or exceeds requirements. This could includePredictability (i.e., the amount and type of variation inthe process), Capability (i.e., the level at which theprocess is able to operate), and/or Satisfaction, (i.e.,the customer's perception of the product or serviceexperience).

Tools for Managers and Teams
Page 4© Kilbride Consulting, Inc.
HINT: You may also decide to measureother process dimensions such as:
l SAFETY and/or SATISFACTION of those who operate the process.
l RELIABILITY of outputs, e.g., the mean time between failures, or level of repairs, returns, warranty claims, etc.
l FLEXIBILITY, i.e., able to customize products/services or simplify acquisition
of the product, etc.
Ò Determine or estimate the Benchmark level ofperformance.
u What is the best performance known?
u What is possible?
This step may require you to do some "quick and dirty"Benchmark analysis to determine what is a "good"performance level.
Benchmark data can be based upon any appropriatecomparison for a given measure. At this point, it isonly important to know what the performance level isfor the known "best practice" or benchmark, not how itwas achieved (which is learned during Benchmarking).
Ó Clarify the Target for each performance dimension.This is generally not as simple as the differencebetween baseline and benchmark performance levels.
Instead, to establish Targets for Cost, Quantity, Timeand Quality, etc. you should consider what level ofperformance is necessary to:
u Meet key customer requirements orexpectations?
u Meet key operating requirements?
u Successfully compete in the marketplace?What is the size of our "gap" versuscompetitors?
u What is the team's level of enthusiasm forimproving in each key dimension?
u What is the feasibility of improvement?
For most measures, targets can simply be to getbetter.
However, it may be necessary to establish a target thatwill drive you to achieve breakthrough in a key processperformance dimension.
Select the VITAL few areas for stretch targets usingthe following:
Tools for Managers and Teams
Page 5© Kilbride Consulting, Inc.
To select the VITAL few goals orprocesses to improve, consider:
VVersus—How great is the need forimprovement when comparing ourperformance versus competitors?Versus customers’ perceptions?
IInfluence—How much will improvement inthis area leverage other areas?
TTiming—How urgent is it that we improvein that area now? Is there a naturalsequence? Does it make sense to improvethis area first? Or are there other things weneed to do first?
AAppetite—Is there energy and enthusiasmfor improvement in this area? Achievingthis goal?
LLikelihood of success—How feasible is it?Do we currently have the capabilitiesrequired to make significant improvementsin this area? Can we develop them?
A word about "stretch" goals…
"Stretch goals" can drive imaginative andaggressive improvements… or paralyzeyour team. No one can say which willhappen to your organization, so beware.
Given this, it may be best limit your stretchgoals to one dimension, while maintainingperformance in other areas.
In developing a rationale for "Stretch" targets,consider the following:
HINT: To build commitment amongstakeholders for achievement of stretchperformance targets:
ll Develop a clear and compellingbusiness case for the need toachieve the stretch target.
ll Get benchmarks. People will think:“If company X can, why can’t we?”
ll Deconstruct the stretch target intoachievable sub-objectives.
ll Let targets evolve during theimprovement process. Asstakeholders learn more about thecurrent state and benchmark what ispossible, targets can be adjusted toreflect their increasing aspirations.
Tools for Managers and Teams
Page 6© Kilbride Consulting, Inc.
Targets should be written in the form
"To + action + MEASURE + amount + deadline".
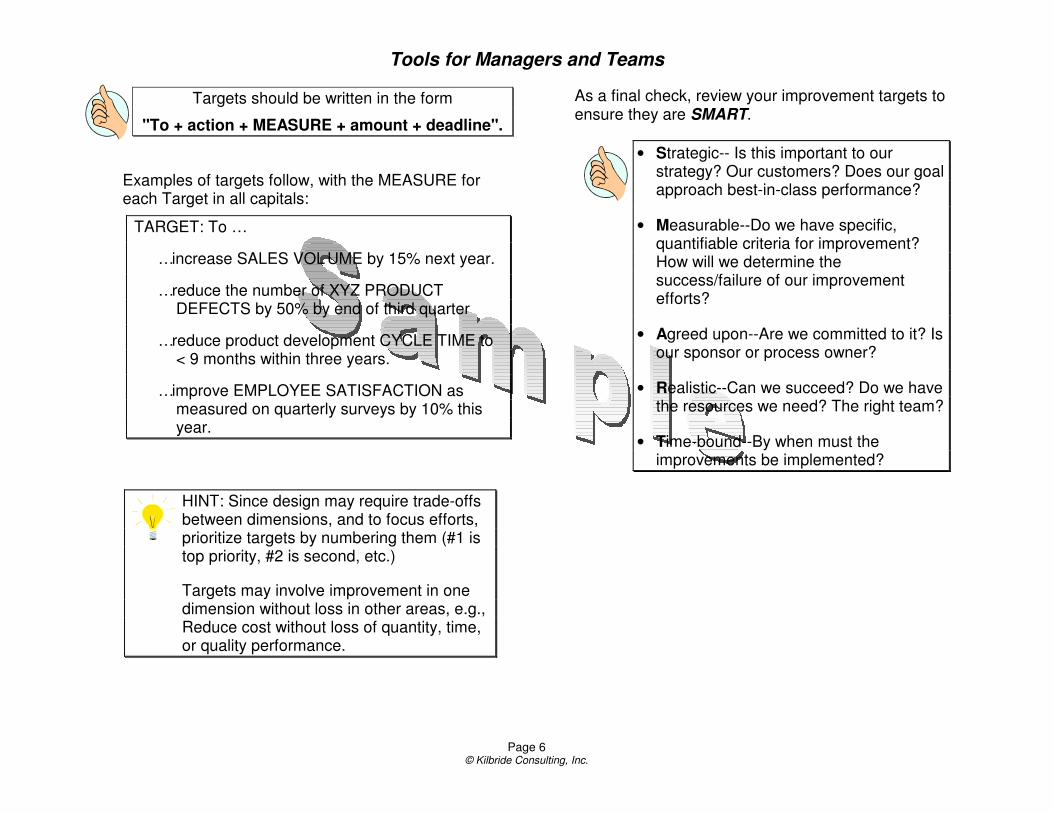
Examples of targets follow, with the MEASURE foreach Target in all capitals:
TARGET: To …
…increase SALES VOLUME by 15% next year.
…reduce the number of XYZ PRODUCT DEFECTS by 50% by end of third quarter
…reduce product development CYCLE TIME to< 9 months within three years.
…improve EMPLOYEE SATISFACTION as measured on quarterly surveys by 10% this year.
HINT: Since design may require trade-offsbetween dimensions, and to focus efforts,prioritize targets by numbering them (#1 istop priority, #2 is second, etc.)
Targets may involve improvement in onedimension without loss in other areas, e.g.,Reduce cost without loss of quantity, time,or quality performance.
As a final check, review your improvement targets toensure they are SMART.
• Strategic-- Is this important to ourstrategy? Our customers? Does our goalapproach best-in-class performance?
• Measurable--Do we have specific,quantifiable criteria for improvement?How will we determine thesuccess/failure of our improvementefforts?
• Agreed upon--Are we committed to it? Isour sponsor or process owner?
• Realistic--Can we succeed? Do we havethe resources we need? The right team?
• Time-bound--By when must theimprovements be implemented?

Tools for Managers and Teams
Page 7© Kilbride Consulting, Inc.
11 Review the “5x5” and analyze each step in terms of its’Impact on the process overall in terms of achieving yourdesired or target levels of Cost, Quantity, Cycle Time,Quality, etc.
u Use checkmarks to nominate those sub-stepssuggested as having the greatest Impact.
u Agree upon and circle in red the 3-4 steps (total)with the greatest Impact on overall processperformance.
Typically you will focus your further process analysisand improvement efforts on these key process steps.
HINT: Also consider the impact of supplierson achievement of your desired or targetlevels of performance. Identify any new ormodified Supplier Requirements thatresult from these performance targets, i.e.,What do you need from your Suppliers toachieve these goals?
Suppliers are not part of the process, butmay provide materials or information at anytime during operation of the process. Inreviewing implications to suppliers, don’t gooverboard; focus on the key ones.
On the next page is an example Process Definition(5x5) for pizza delivery.
On the page after that is a blank Process Definition(5x5) worksheet.

Tools for Managers and Teams
Page 8© Kilbride Consulting, Inc.
Ì Process Boundaries and Major Steps
Process Definition (5x5)Ê PROCESS: Deliver Pizza Scribe: Joe Facilitator: Dan Date: N ov. 28, 1999 Meeting participants: Fred, Ethel, Lucy, Ricky, Jan, Peter Timekeeper: Rollie Process Owner: P. Pie Process Operators/Performers: Bill, Ed, Jim, Leo, Pat, M argaret, M arie
Í “5x5” Substeps
1.1
Answer
phone and
greet the
customer
2.1
Roll dough
3.1
Determine
oven time
4.1
Put separator
on pizza
5.1
Determine
route
1.2
W rite down
order/info
2.2
Spread sauce
3.2
Determine
place in queue
4.2
Fold box
5.2
Sequence
pizzas
1.3
Repeat
order/info
2.3
Cover with
cheese
3.3
Put into oven
4.3
Insert pizza
into box
5.3
Stack pizzas
1.4
State
delivery time
2.4
Gather
toppings
3.4
Check and
rotate
4.4
Close box
5.4
Drive route
1.5
Pass order
to kitchen
2.5
Place toppings
3.5
Remove from
oven
4.5
Ring for
delivery
5.5
Deliver and
collect $
1. Takethe
order
2. Prep thepizza
3. Cook thepizza
4. Pack thepizza
5. Deliverthe
pizza
Î Output Ï Customers Ð Requirements
Families • Variety
• Healthy
Party givers • Value
• O n-time
Pizza
Delivered
(all want taste,
cost, options)Busy people • In time
Ñ Baseline (current)Performance
Ò BenchmarkPerformance
Ó TargetPerformance
Cost
• 8 cents perinch
• 6 cents perinch
Reduce by 2
cents per
inch (# 6)Quantity
• 175 per night • 225 per
night
Increase by
10 per night
(# 3)
Time
• 87% on time • 93% ontime
Improve
O TD by 6%
(# 5)Quality
• 5 wrongpizzas per
month
• 89%favorable
rating
• 0 wrongpizzas per
month
• 96%favorable
rating
Reduce #
wrong pizzas
by 5 per
month (# 4)
Improve
favorable
rating 7%
(# 2)Safety
• 5 accidentslast year
• 0 accidentsper year
Reduce by 5
accidents
(# 1)
Ë Roles

Tools for Managers and Teams
Page 9© Kilbride Consulting, Inc.
Ì Process Boundaries and Major Steps
Process Definition (5x5)Ê PROCESS: Scribe: Facilitator: Date: Meeting participants: Timekeeper: Process Owner: Process Operators/Performers:
Ë Roles
Í “5x5” Substeps
1.1 2.1 3.1 4.1 5.1
1.2 2.2 3.2 4.2 5.2
1.3 2.3 3.3 4.3 5.3
1.4 2.4 3.4 4.4 5.4
1.5 2.5 3.5 4.5 5.5
1. 2. 3. 4. 5.
Î Output Ï Customers Ð Requirements
Ñ Baseline (current)Performance
Ò BenchmarkPerformance
Ó TargetPerformance
Cost
Quantity
Time
Quality

Tools for Managers and Teams
Page A-10© Kilbride Consulting, Inc.
12 Checklist -- After completing the 5x5, consider thefollowing checklist, which is intended to remind the teamof areas that frequently determine the success or failureof an improvement effort.
In reviewing this checklist, recognize thatsome of the items will be more meaningfulto your team than others. Don't get "hungup" on any one item. Simply use thechecklist to clarify what you know, andidentify what you still need to decide ordiscover.
Purpose & Scope --What & Why?
4 Is the purpose of the improvement effort clear?Have goals/priorities for improvement beenestablished? Agreed to by all key parties?
4 How far will this team carry the project? Will itonly study the current process and recommendchanges? Or plan for implementation of theredesigned process? Or develop and implementthe redesign? Or operate the redesignedprocess?
4 Is there a known BEST PRACTICE for thisprocess the team should study?
4 What resources (people, time, money) will theteam have access to?
4 What is outside the team’s scope or authority?
The Team and Other Key Players -- Who?
4 Who will serve as the team's Sponsor, i.e., theperson who initiates and funds the team?
4 Will someone outside the team serve as aGatekeeper, i.e., to review and approves teamrecommendations at key points? If so, who?
4 Who will serve as the Team Leader, i.e., theperson accountable to the sponsor for results?
4 Given the clarified scope and purpose of theimprovement effort, who should be members ofthe core improvement team (5-7)?
4 Who might be needed as extended teammembers, i.e., individuals brought in for theirexpertise at key points, but not needed throughoutentire project?
4 Will the team have an Advisor or Consultant, i.e.,someone to support the team and provideexpertise on the improvement process itself?
4 Who are Customers or users of theproduct/service output that is produced by thisprocess? How/when will they be involved?
4 Who will Implement the process changes?How/when will that team be involved?
4 Who will "own" the redesigned Process? ie., theperson who will manage the process day-to-day?
4 Who will "operate" the redesigned process?How/when will that team be involved?

Tools for Managers and Teams
Page A-11© Kilbride Consulting, Inc.
Project Timeline -- When?
4 What is the timeline for completing the project?
4 What are the key milestones or checkpoints?
4 When/how will the team's progress bemonitored?
4 Is there a deadline for recommending changesto the process? For implementation of processchanges? For realizing improved performancefrom the redesigned process?
4 Have the appropriate parties agreed to theteam's overall plan for the improvement project?To the key process measures?
4 How will the team be held ACCOUNTABLE forresults?
4 What is the priority of this improvement effortrelative to other responsibilities of the team?
Below is an example Gantt chart for an improvement project.
HINT: If the project will be more than 1/4-time forteam members, or last for more than one month,establish specific measures and rewards forindividual performance. For even longer projects,clarify team members' opportunities for futurepositions after completion of the project.
Performance Measures -- How Much?If data for current performance is lacking…
4 WHAT data will be collected to establishbaseline levels of performance for key resultareas?
4 WHO will collect the data?
4 WHAT methods will be used to collect andrecord the data?
4 WHEN will the data be collected? Howfrequently? For how long?
4 HOW much data will be collected? 100% ofevents or samples? If sampling is done…-- HOW will you define rational sub-groups to ensure validity?-- HOW will you select samples randomly to minimize bias?
4 HOW will reliability of the data be assured?
4 HOW will the data be sourced or identified?
4 HOW will the data be reported? Reviewed?
Project Steps
Calendar(Meetings, Weeks or Months)
1. Scope the project2. Analyze Current State
– Define process– Observe & review data
3. Create Desired State– Generate options– Define new process
4. Plan for Implementation5. Design/Develop Solution6. Implement Solution7a. Measure & review
performance7b. Make Adjustments
– Corrective actions– Refine and standardize– Share learnings
Gantt ChartGantt Chart
Ong
oing

Tools for Managers and Teams
Page A-12© Kilbride Consulting, Inc.
Following are optional exercises a team may complete as away to finalize the kick-off of a process improvementproject and ensure clarity among team members.
13 The Name Game--The name of your team or project canhave significant impact on the outcomes you achieve. Thefollowing is a fun way to revisit Step #1 and:
u Finalize the team's purpose,
u Improve team members' understanding of theproject purpose and aims,
u Determine an effective name for communicatingabout the project with others.
As the illustration at right suggests, theName Game involves a cycle which theteam completes several times as follows:
u Propose a name for the project.
u Identify 3 reasons why this name is not adequate.
u Propose another name that eliminates theseproblems.
u Identify 3 reasons why this name is not adequate.
u Continue until you have a usable name.
HINT: Remember, there is noperfect name. Strive for improvedclarity, not perfection.
Name
3 Reasonswhy not

Tools for Managers and Teams
Page A-13© Kilbride Consulting, Inc.
14 The Clarity Ratio—Since clarity is simply the level of agreement about what is to be accomplished during a project, you can measure the degree of clarity present at the scoping stage of a project:
u Give 5-10 qualified individuals the project charterand/or scope document. Make sure some of theseindividuals were not involved in the chartering work.
u Ask each to independently estimate the project’slikely cost or cycle time. For example, ask forestimates of such parameters as:
• Total cost to complete the project, or
• Time in calendar days or person-hours tofinish, or
• Required level of performance for some keydesign characteristics such as reliability,durability, efficiency, capacity, etc.
u The degree of clarity can be estimated by"calculating" the level of agreement among differentindividuals on such parameters.
u Estimate the degree of clarity present in the projectcharter or scope using the formula below.
Highest EstimateClarity ≈≈ ------------------------------ Lowest Estimate
For example…$420,000
Clarity ≈≈ ------------------------ ≈≈ 5.25 $80,000
u Perfect clarity is indicated by a Clarity Ratio =1.This never occurs, but if your Clarity Ratio is toohigh (>4), continue clarifying project scope orrequirements.
u Talk with the high and low estimators to uncoverassumptions behind their answers. Use thesediscussions to locate the sources of remainingambiguity.

Tools for Managers and Teams
Page 14© Kilbride Consulting, Inc.
A Sample ofTools for Managers and Teams