keysight technologies accurate pulsed...
TRANSCRIPT
Keysight Technologies Accurate Pulsed Measurements with the PNA Microwave Network Analyzers
Application Note

Introduction
Vector network analyzers are traditionally used to measure the continuous wave (CW) S-parameter performance of components. Often under these operating conditions the analyzer is functioning as a narrowband measurement instrument. It transmits a known CW frequency to the component and measures the CW frequency response. If we were to look at the response of a single CW frequency we would see a single spectral tone in the frequency domain. The analyzer has a built in source and receivers that are designed to operate together in a synchronous manner, utilizing narrowband detection, to measure the frequency response of the component. Most analyzers can be conigured to generate a frequency sweep over many frequency tones.
3
In some cases the signal applied to the component must be pulsed (turned on and off)
at a specific rate and duration. If we were to look at the frequency domain response of
a single pulsed tone, it would contain an infinite number of spectral tones making it
challenging to utilize a standard narrowband VNA. This article describes how to config-
ure and make accurate pulsed S-parameter measurements using the Keysight
Technologies, Inc. microwave PNA network analyzer.
Pulsed Signals
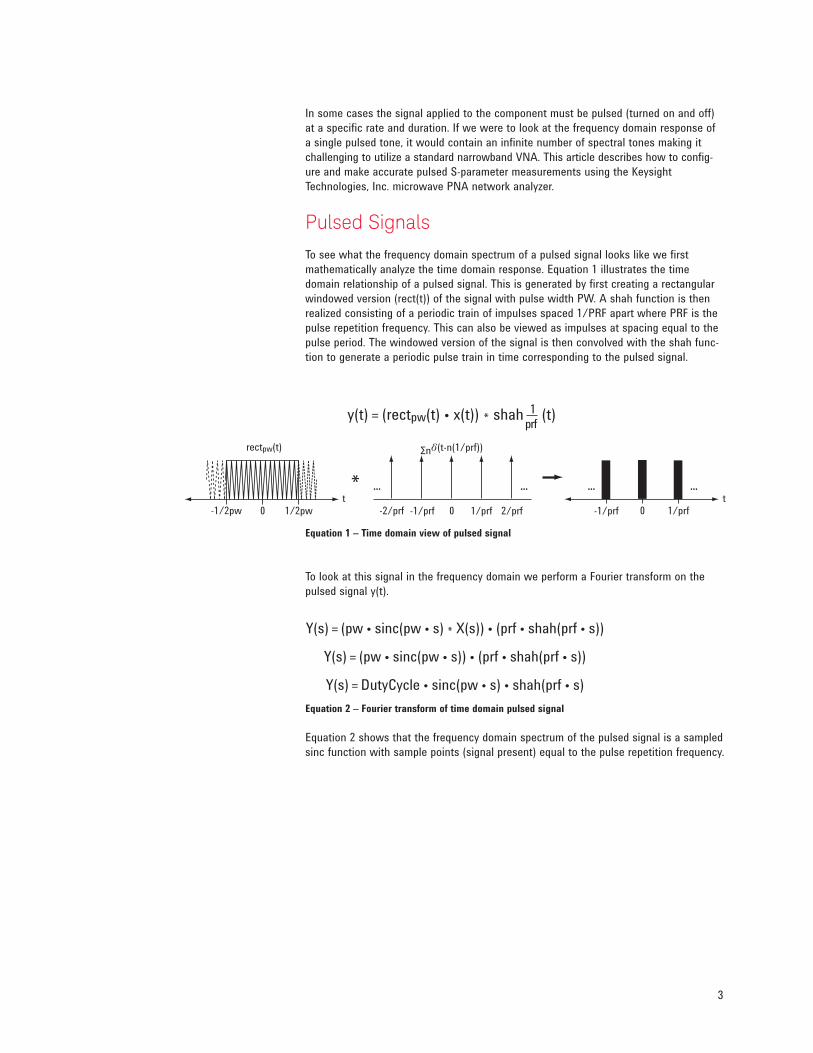
To see what the frequency domain spectrum of a pulsed signal looks like we first
mathematically analyze the time domain response. Equation 1 illustrates the time
domain relationship of a pulsed signal. This is generated by first creating a rectangular
windowed version (rect(t)) of the signal with pulse width PW. A shah function is then
realized consisting of a periodic train of impulses spaced 1/PRF apart where PRF is the
pulse repetition frequency. This can also be viewed as impulses at spacing equal to the
pulse period. The windowed version of the signal is then convolved with the shah func-
tion to generate a periodic pulse train in time corresponding to the pulsed signal.
Equation 1 – Time domain view of pulsed signal
To look at this signal in the frequency domain we perform a Fourier transform on the
pulsed signal y(t).
Equation 2 – Fourier transform of time domain pulsed signal
Equation 2 shows that the frequency domain spectrum of the pulsed signal is a sampled
sinc function with sample points (signal present) equal to the pulse repetition frequency.
rectpw(t)
-1/2pw 0 1/2pw
y(t) = (rectpw(t) • x(t)) * shah 1 (t)prf
* ... ...
-1/prf 0 1/prf
... ...
-2/prf 0 1/prf-1/prf 2/prf
Σnd(t-n(1/prf))
t t
Y(s) = (pw • sinc(pw • s) * X(s)) • (prf • shah(prf • s))
Y(s) = (pw • sinc(pw • s)) • (prf • shah(prf • s))
Y(s) = DutyCycle • sinc(pw • s) • shah(prf • s)
4
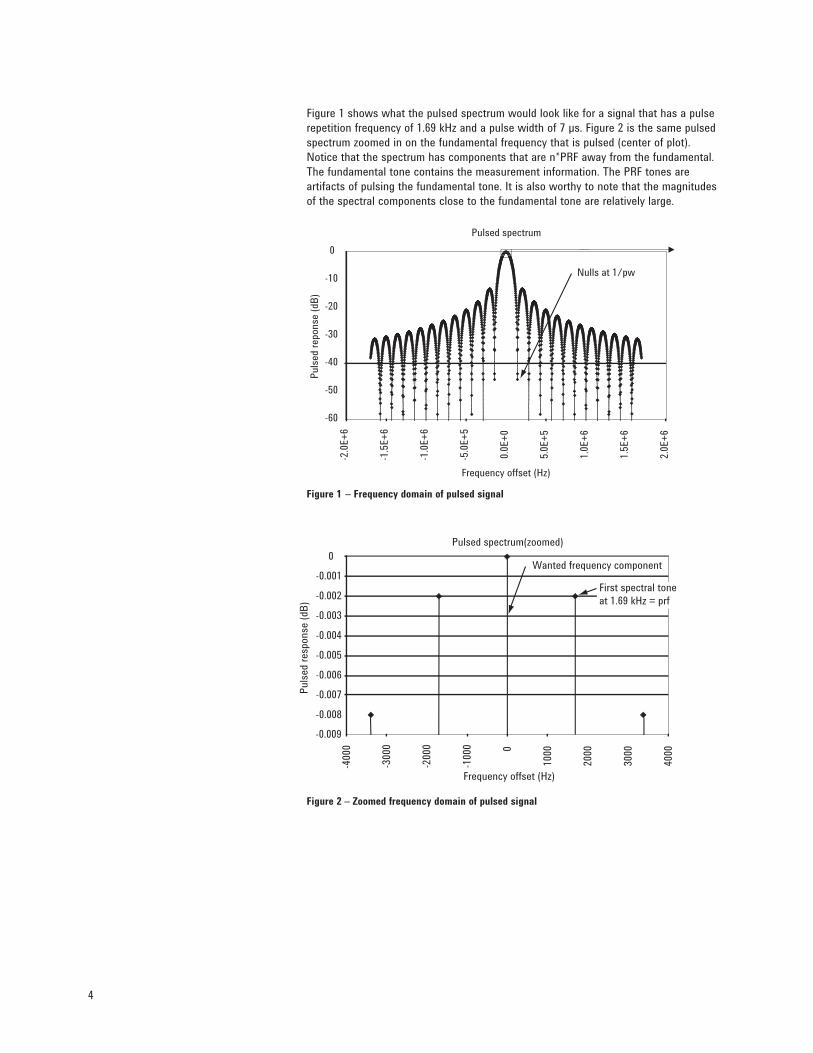
Figure 1 shows what the pulsed spectrum would look like for a signal that has a pulse
repetition frequency of 1.69 kHz and a pulse width of 7 µs. Figure 2 is the same pulsed
spectrum zoomed in on the fundamental frequency that is pulsed (center of plot).
Notice that the spectrum has components that are n*PRF away from the fundamental.
The fundamental tone contains the measurement information. The PRF tones are
artifacts of pulsing the fundamental tone. It is also worthy to note that the magnitudes
of the spectral components close to the fundamental tone are relatively large.
Figure 1 – Frequency domain of pulsed signal
Figure 2 – Zoomed frequency domain of pulsed signal
Pulsed spectrum
-60
-50
-40
-30
-20
-10
0
-2.0
E+
6
-1.5
E+
6
-1.0
E+
6
-5.0
E+
5
0.0
E+
0
5.0
E+
5
1.0
E+
6
1.5
E+
6
2.0
E+
6
Frequency offset (Hz)
Puls
ed r
eponse
(dB
)
Nulls at 1/pw
Pulsed spectrum(zoomed)
-0.009
-0.008
-0.007
-0.006
-0.005
-0.004
-0.003
-0.002
-0.001
0
-4000
-3000
-2000
-1000 0
1000
2000
3000
4000
Frequency offset (Hz)
Puls
ed r
esp
onse
(dB
)
Wanted frequency component
First spectral tone
at 1.69 kHz = prf
5
Microwave PNA Pulsed Measurement Techniques
The Keysight microwave PNA is a high-performance network analyzer that utilizes nar-
rowband detection of microwave energy. It downconverts the received signal to an intermedi-
ate frequency (IF) that is then digitized (sampled at discrete intervals) and digitally filtered
for display and analysis. There are two different methods for measuring the S-parameters
of a pulsed signal using the microwave PNA: ‘Synchronic Pulse Acquisition’ and ‘Spectral
Nulling’. Synchronic pulse acquisition is analogous to the ‘Full Pulse Characterization’
mode of operation on the Keysight 8510 network analyzer. Spectral nulling is analogous to
the ‘High PRF’ mode of operation in the 8510 series except that point-in-pulse and
pulse-profiling can be performed whereas they could not on the 8510 in ‘High PRF’ mode.
Synchronic pulse acquisition
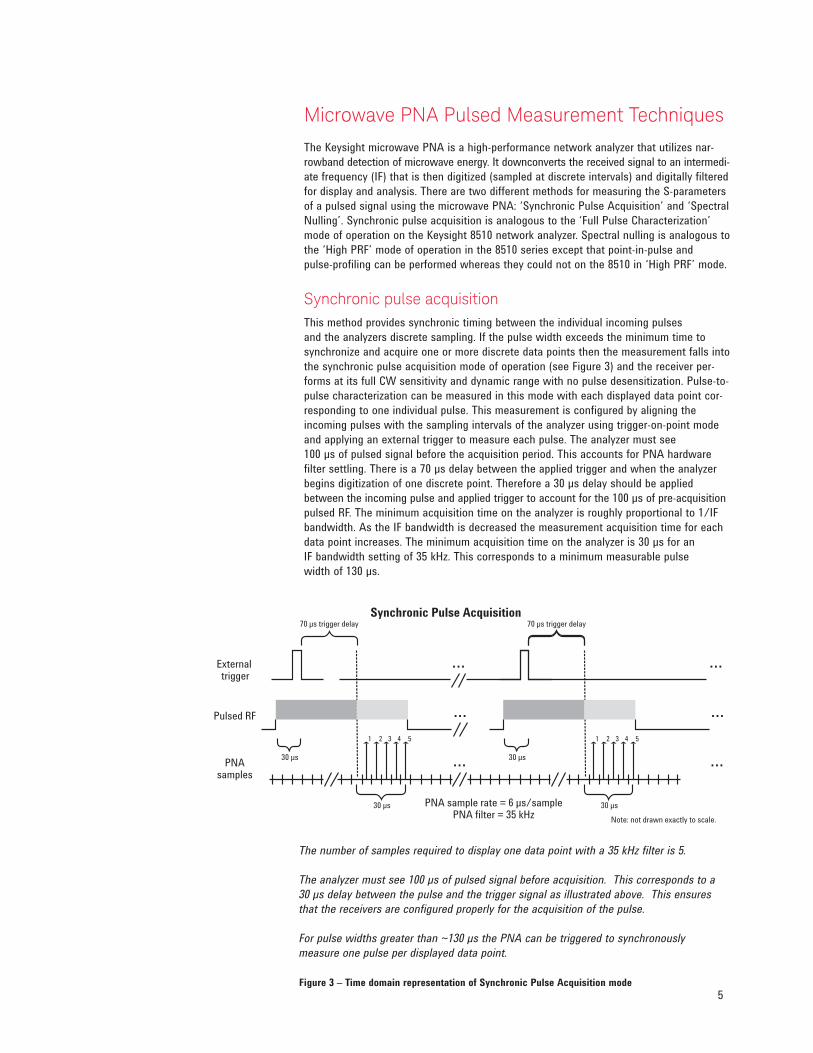
This method provides synchronic timing between the individual incoming pulses
and the analyzers discrete sampling. If the pulse width exceeds the minimum time to
synchronize and acquire one or more discrete data points then the measurement falls into
the synchronic pulse acquisition mode of operation (see Figure 3) and the receiver per-
forms at its full CW sensitivity and dynamic range with no pulse desensitization. Pulse-to-
pulse characterization can be measured in this mode with each displayed data point cor-
responding to one individual pulse. This measurement is configured by aligning the
incoming pulses with the sampling intervals of the analyzer using trigger-on-point mode
and applying an external trigger to measure each pulse. The analyzer must see
100 µs of pulsed signal before the acquisition period. This accounts for PNA hardware
filter settling. There is a 70 µs delay between the applied trigger and when the analyzer
begins digitization of one discrete point. Therefore a 30 µs delay should be applied
between the incoming pulse and applied trigger to account for the 100 µs of pre-acquisition
pulsed RF. The minimum acquisition time on the analyzer is roughly proportional to 1/IF
bandwidth. As the IF bandwidth is decreased the measurement acquisition time for each
data point increases. The minimum acquisition time on the analyzer is 30 µs for an
IF bandwidth setting of 35 kHz. This corresponds to a minimum measurable pulse
width of 130 µs.
...
1 2 3 4 5
...
...External trigger
Pulsed RF
PNAsamples
70 µs trigger delay
30 µs
30 µs
Note: not drawn exactly to scale.
...
1 2 3 4 5
...
...
70 µs trigger delay
30 µs
30 µsPNA sample rate = 6 µs/samplePNA filter = 35 kHz
Synchronic Pulse Acquisition
The number of samples required to display one data point with a 35 kHz filter is 5.
The analyzer must see 100 µs of pulsed signal before acquisition. This corresponds to a
30 µs delay between the pulse and the trigger signal as illustrated above. This ensures
that the receivers are configured properly for the acquisition of the pulse.
For pulse widths greater than ~130 µs the PNA can be triggered to synchronously
measure one pulse per displayed data point.
Figure 3 – Time domain representation of Synchronic Pulse Acquisition mode
6
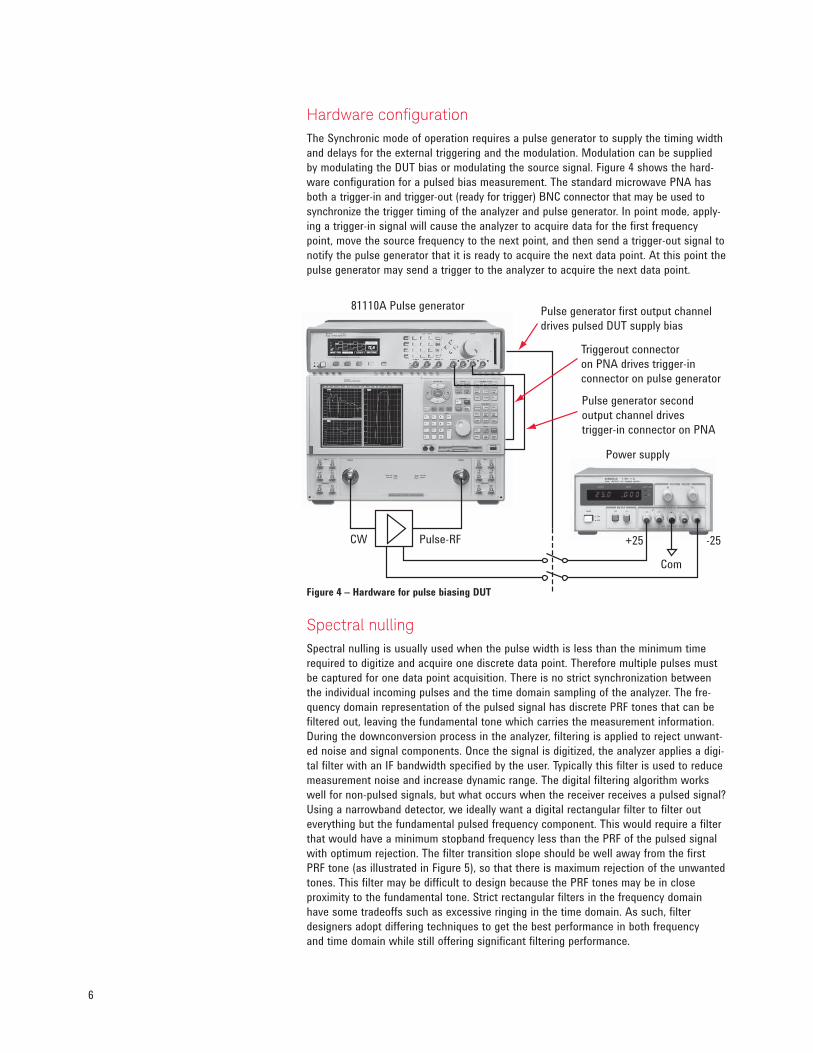
Hardware conigurationThe Synchronic mode of operation requires a pulse generator to supply the timing width
and delays for the external triggering and the modulation. Modulation can be supplied
by modulating the DUT bias or modulating the source signal. Figure 4 shows the hard-
ware configuration for a pulsed bias measurement. The standard microwave PNA has
both a trigger-in and trigger-out (ready for trigger) BNC connector that may be used to
synchronize the trigger timing of the analyzer and pulse generator. In point mode, apply-
ing a trigger-in signal will cause the analyzer to acquire data for the first frequency
point, move the source frequency to the next point, and then send a trigger-out signal to
notify the pulse generator that it is ready to acquire the next data point. At this point the
pulse generator may send a trigger to the analyzer to acquire the next data point.
Figure 4 – Hardware for pulse biasing DUT
Spectral nulling
Spectral nulling is usually used when the pulse width is less than the minimum time
required to digitize and acquire one discrete data point. Therefore multiple pulses must
be captured for one data point acquisition. There is no strict synchronization between
the individual incoming pulses and the time domain sampling of the analyzer. The fre-
quency domain representation of the pulsed signal has discrete PRF tones that can be
filtered out, leaving the fundamental tone which carries the measurement information.
During the downconversion process in the analyzer, filtering is applied to reject unwant-
ed noise and signal components. Once the signal is digitized, the analyzer applies a digi-
tal filter with an IF bandwidth specified by the user. Typically this filter is used to reduce
measurement noise and increase dynamic range. The digital filtering algorithm works
well for non-pulsed signals, but what occurs when the receiver receives a pulsed signal?
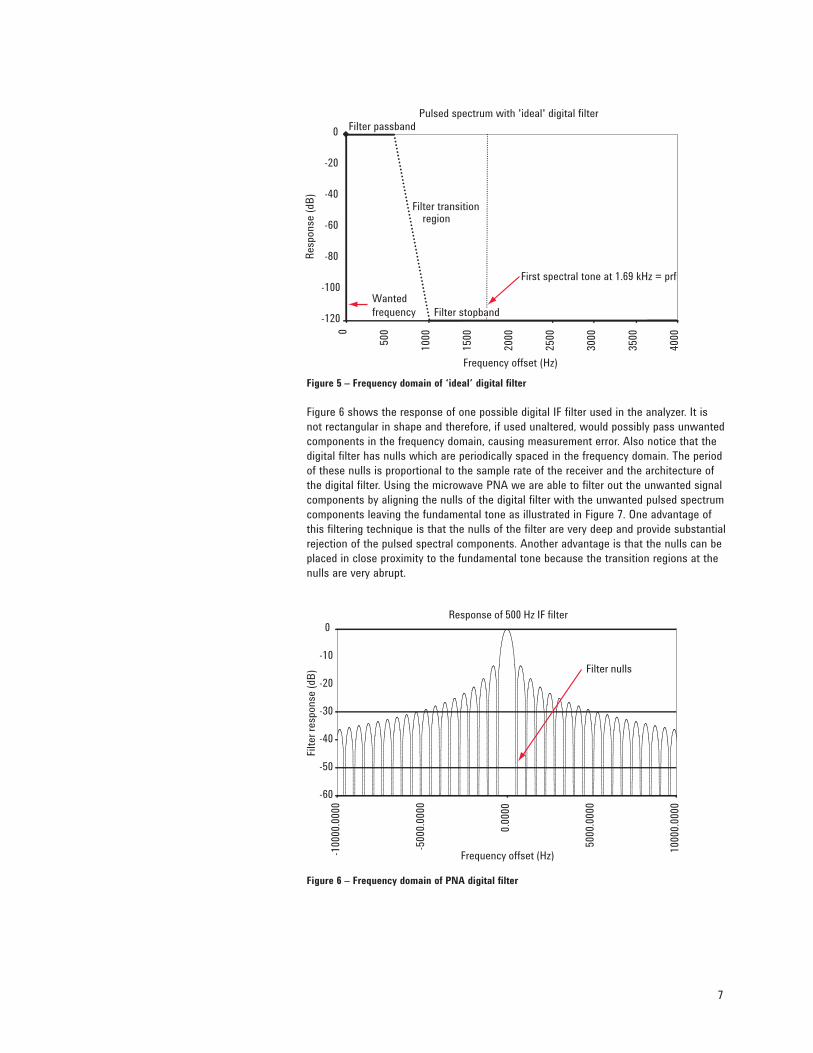
Using a narrowband detector, we ideally want a digital rectangular filter to filter out
everything but the fundamental pulsed frequency component. This would require a filter
that would have a minimum stopband frequency less than the PRF of the pulsed signal
with optimum rejection. The filter transition slope should be well away from the first
PRF tone (as illustrated in Figure 5), so that there is maximum rejection of the unwanted
tones. This filter may be difficult to design because the PRF tones may be in close
proximity to the fundamental tone. Strict rectangular filters in the frequency domain
have some tradeoffs such as excessive ringing in the time domain. As such, filter
designers adopt differing techniques to get the best performance in both frequency
and time domain while still offering significant filtering performance.
CW Pulse-RF
Power supply
Com
+25 -25
Pulse generator first output channel
drives pulsed DUT supply bias
Triggerout connector
on PNA drives trigger-in
connector on pulse generator
Pulse generator second
output channel drives
trigger-in connector on PNA
81110A Pulse generator
7
Pulsed spectrum with 'ideal' digital filter
-120
-100
-80
-60
-40
-20
0
0
500
1000
1500
2000
2500
3000
3500
4000
Frequency offset (Hz)
Resp
onse
(dB
)Wanted
frequency
First spectral tone at 1.69 kHz = prf
Filter passband
Filter transitionregion
Filter stopband
Response of 500 Hz IF filter
-60
-50
-40
-30
-20
-10
0
-10
00
0.0
00
0
-50
00
.00
00
0.0
00
0
50
00
.00
00
10
00
0.0
00
0
Frequency offset (Hz)
Filt
er
resp
on
se (
dB
) Filter nulls
Figure 5 – Frequency domain of ‘ideal’ digital filter
Figure 6 shows the response of one possible digital IF filter used in the analyzer. It is
not rectangular in shape and therefore, if used unaltered, would possibly pass unwanted
components in the frequency domain, causing measurement error. Also notice that the
digital filter has nulls which are periodically spaced in the frequency domain. The period
of these nulls is proportional to the sample rate of the receiver and the architecture of
the digital filter. Using the microwave PNA we are able to filter out the unwanted signal
components by aligning the nulls of the digital filter with the unwanted pulsed spectrum
components leaving the fundamental tone as illustrated in Figure 7. One advantage of
this filtering technique is that the nulls of the filter are very deep and provide substantial
rejection of the pulsed spectral components. Another advantage is that the nulls can be
placed in close proximity to the fundamental tone because the transition regions at the
nulls are very abrupt.
Figure 6 – Frequency domain of PNA digital filter
8
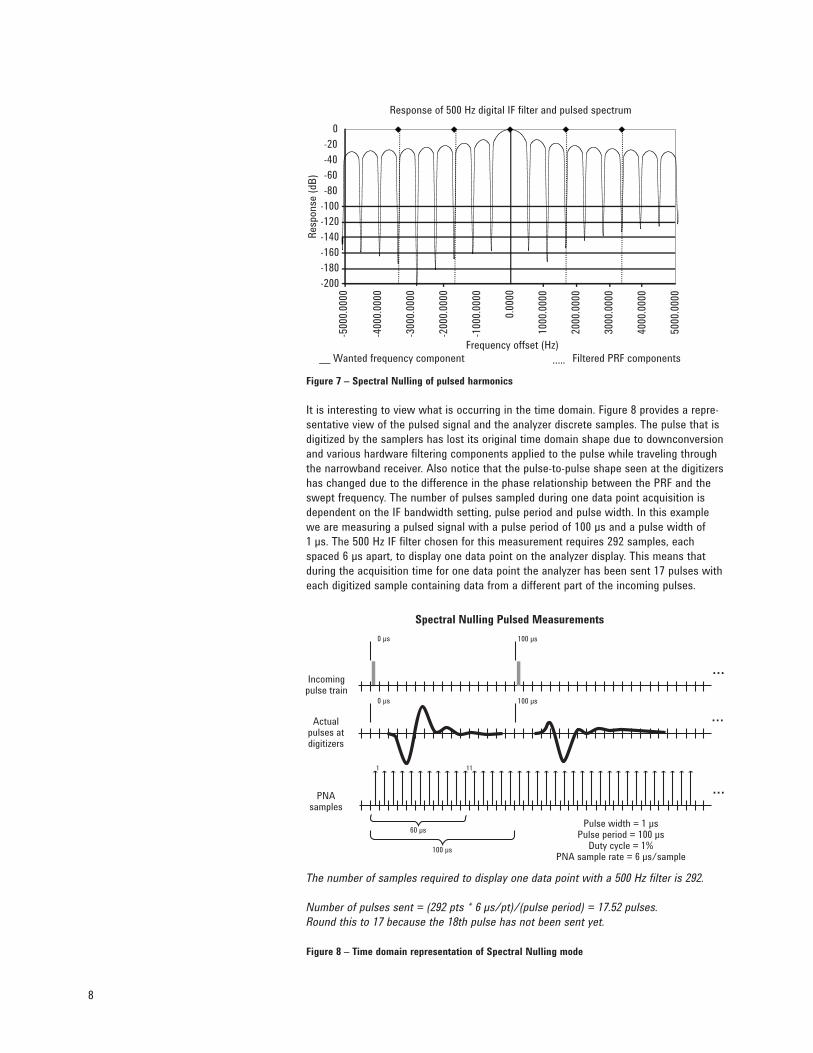
Figure 7 – Spectral Nulling of pulsed harmonics
It is interesting to view what is occurring in the time domain. Figure 8 provides a repre-
sentative view of the pulsed signal and the analyzer discrete samples. The pulse that is
digitized by the samplers has lost its original time domain shape due to downconversion
and various hardware filtering components applied to the pulse while traveling through
the narrowband receiver. Also notice that the pulse-to-pulse shape seen at the digitizers
has changed due to the difference in the phase relationship between the PRF and the
swept frequency. The number of pulses sampled during one data point acquisition is
dependent on the IF bandwidth setting, pulse period and pulse width. In this example
we are measuring a pulsed signal with a pulse period of 100 µs and a pulse width of
1 µs. The 500 Hz IF filter chosen for this measurement requires 292 samples, each
spaced 6 µs apart, to display one data point on the analyzer display. This means that
during the acquisition time for one data point the analyzer has been sent 17 pulses with
each digitized sample containing data from a different part of the incoming pulses.
The number of samples required to display one data point with a 500 Hz filter is 292.
Number of pulses sent = (292 pts * 6 µs/pt)/(pulse period) = 17.52 pulses.
Round this to 17 because the 18th pulse has not been sent yet.
Figure 8 – Time domain representation of Spectral Nulling mode
…..
Response of 500 Hz digital IF filter and pulsed spectrum
-200
-180
-160
-140
-120
-100
-80
-60
-40
-20
0
-5000.0
000
-4000.0
000
-3000.0
000
-2000.0
000
-1000.0
000
0.0
000
1000.0
000
2000.0
000
3000.0
000
4000.0
000
5000.0
000
Frequency offset (Hz)
Resp
onse
(dB
)
Filtered PRF components__ Wanted frequency component
1
Incomingpulse train
Actualpulses atdigitizers
PNAsamples
0 μs
60 μs
...
...100 μs
Pulse width = 1 μsPulse period = 100 μs
Duty cycle = 1%PNA sample rate = 6 μs/sample
Spectral Nulling Pulsed Measurements
11
...
0 μs 100 μs
100 μs
9
Duty cycle (%)
100 10.0 1.0 0.1
Dyn
am
ic r
ang
e (
dB
)
100
80
60
40
20
0
Widebanddetection8510
Narrowband detection 8510
Narrowband detection PNA
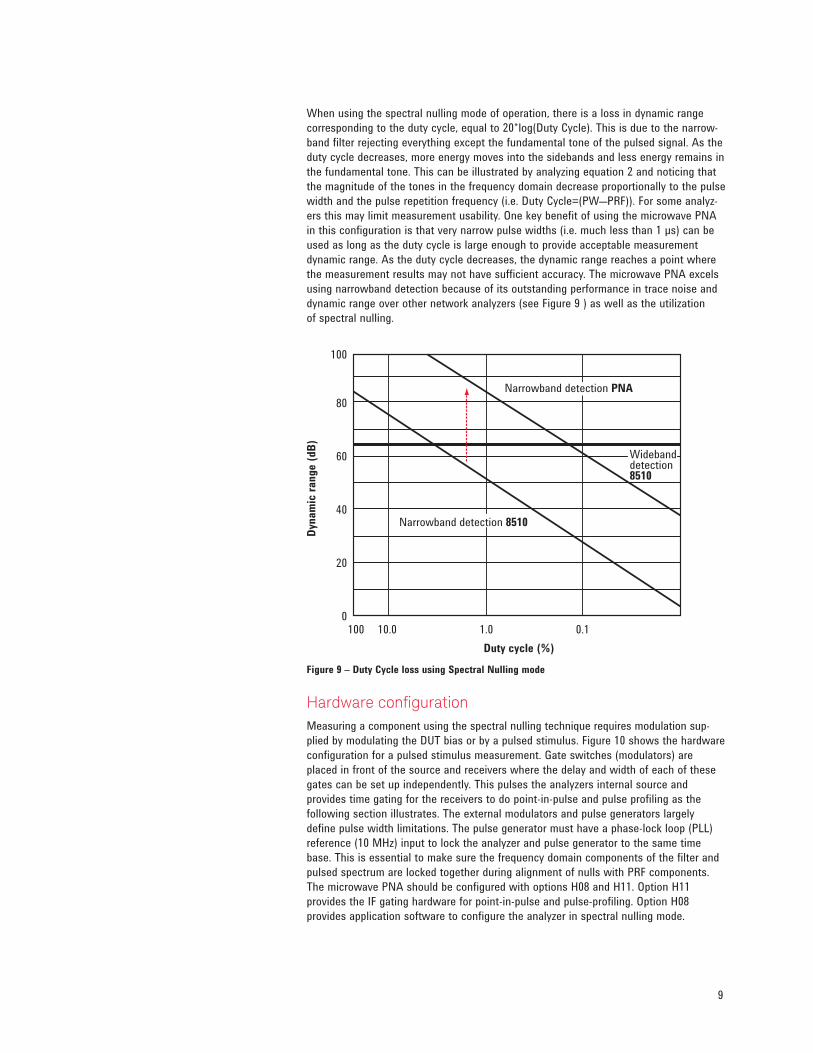
When using the spectral nulling mode of operation, there is a loss in dynamic range
corresponding to the duty cycle, equal to 20*log(Duty Cycle). This is due to the narrow-
band filter rejecting everything except the fundamental tone of the pulsed signal. As the
duty cycle decreases, more energy moves into the sidebands and less energy remains in
the fundamental tone. This can be illustrated by analyzing equation 2 and noticing that
the magnitude of the tones in the frequency domain decrease proportionally to the pulse
width and the pulse repetition frequency (i.e. Duty Cycle=(PW–PRF)). For some analyz-
ers this may limit measurement usability. One key benefit of using the microwave PNA
in this configuration is that very narrow pulse widths (i.e. much less than 1 µs) can be
used as long as the duty cycle is large enough to provide acceptable measurement
dynamic range. As the duty cycle decreases, the dynamic range reaches a point where
the measurement results may not have sufficient accuracy. The microwave PNA excels
using narrowband detection because of its outstanding performance in trace noise and
dynamic range over other network analyzers (see Figure 9 ) as well as the utilization
of spectral nulling.
Figure 9 – Duty Cycle loss using Spectral Nulling mode
Hardware conigurationMeasuring a component using the spectral nulling technique requires modulation sup-
plied by modulating the DUT bias or by a pulsed stimulus. Figure 10 shows the hardware
configuration for a pulsed stimulus measurement. Gate switches (modulators) are
placed in front of the source and receivers where the delay and width of each of these
gates can be set up independently. This pulses the analyzers internal source and
provides time gating for the receivers to do point-in-pulse and pulse profiling as the
following section illustrates. The external modulators and pulse generators largely
define pulse width limitations. The pulse generator must have a phase-lock loop (PLL)
reference (10 MHz) input to lock the analyzer and pulse generator to the same time
base. This is essential to make sure the frequency domain components of the filter and
pulsed spectrum are locked together during alignment of nulls with PRF components.
The microwave PNA should be configured with options H08 and H11. Option H11
provides the IF gating hardware for point-in-pulse and pulse-profiling. Option H08
provides application software to configure the analyzer in spectral nulling mode.
10
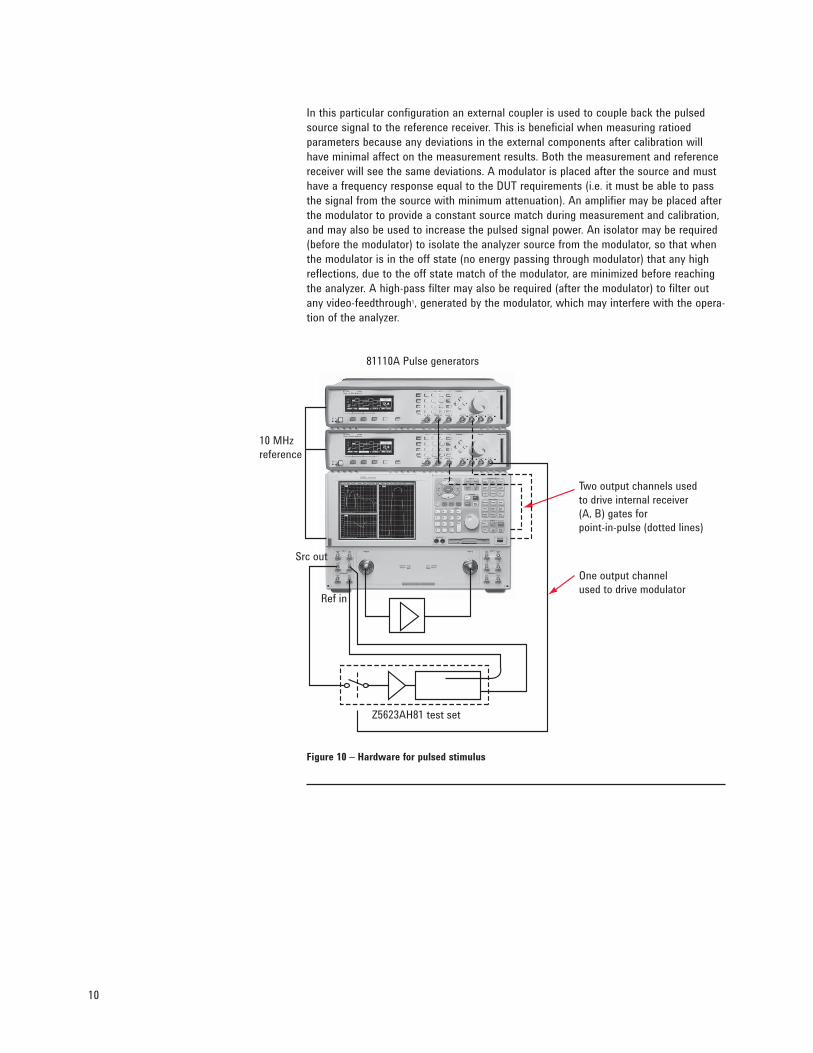
In this particular configuration an external coupler is used to couple back the pulsed
source signal to the reference receiver. This is beneficial when measuring ratioed
parameters because any deviations in the external components after calibration will
have minimal affect on the measurement results. Both the measurement and reference
receiver will see the same deviations. A modulator is placed after the source and must
have a frequency response equal to the DUT requirements (i.e. it must be able to pass
the signal from the source with minimum attenuation). An amplifier may be placed after
the modulator to provide a constant source match during measurement and calibration,
and may also be used to increase the pulsed signal power. An isolator may be required
(before the modulator) to isolate the analyzer source from the modulator, so that when
the modulator is in the off state (no energy passing through modulator) that any high
reflections, due to the off state match of the modulator, are minimized before reaching
the analyzer. A high-pass filter may also be required (after the modulator) to filter out
any video-feedthrough1, generated by the modulator, which may interfere with the opera-
tion of the analyzer.
Figure 10 – Hardware for pulsed stimulus
Src out
10 MHz
reference
Two output channels used
to drive internal receiver
(A, B) gates for
point-in-pulse (dotted lines)
One output channel
used to drive modulatorRef in
Z5623AH81 test set
81110A Pulse generators
11
A/D
Test port 2
A/D
A/D
Test port 1
A/D
IF gate
LO
A B
R1 R2
Vtune0
Phase-locked loop
8.33 MHz
reference
Offset LO
Offesetreceiver
X Multipliers (2, 4, 8)
YIG source ( 3 to 10 GHz)
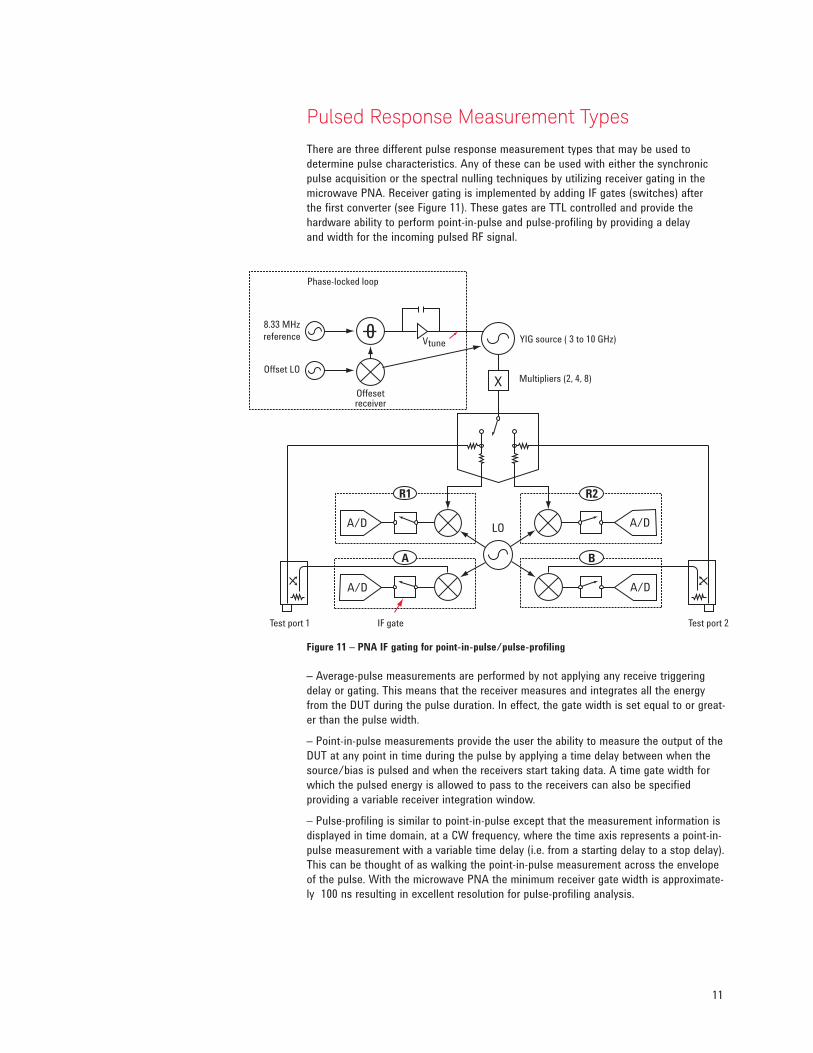
Pulsed Response Measurement Types
There are three different pulse response measurement types that may be used to
determine pulse characteristics. Any of these can be used with either the synchronic
pulse acquisition or the spectral nulling techniques by utilizing receiver gating in the
microwave PNA. Receiver gating is implemented by adding IF gates (switches) after
the first converter (see Figure 11). These gates are TTL controlled and provide the
hardware ability to perform point-in-pulse and pulse-profiling by providing a delay
and width for the incoming pulsed RF signal.
Figure 11 – PNA IF gating for point-in-pulse/pulse-profiling
– Average-pulse measurements are performed by not applying any receive triggering
delay or gating. This means that the receiver measures and integrates all the energy
from the DUT during the pulse duration. In effect, the gate width is set equal to or great-
er than the pulse width.
– Point-in-pulse measurements provide the user the ability to measure the output of the
DUT at any point in time during the pulse by applying a time delay between when the
source/bias is pulsed and when the receivers start taking data. A time gate width for
which the pulsed energy is allowed to pass to the receivers can also be specified
providing a variable receiver integration window.
– Pulse-profiling is similar to point-in-pulse except that the measurement information is
displayed in time domain, at a CW frequency, where the time axis represents a point-in-
pulse measurement with a variable time delay (i.e. from a starting delay to a stop delay).
This can be thought of as walking the point-in-pulse measurement across the envelope
of the pulse. With the microwave PNA the minimum receiver gate width is approximate-
ly 100 ns resulting in excellent resolution for pulse-profiling analysis.
12
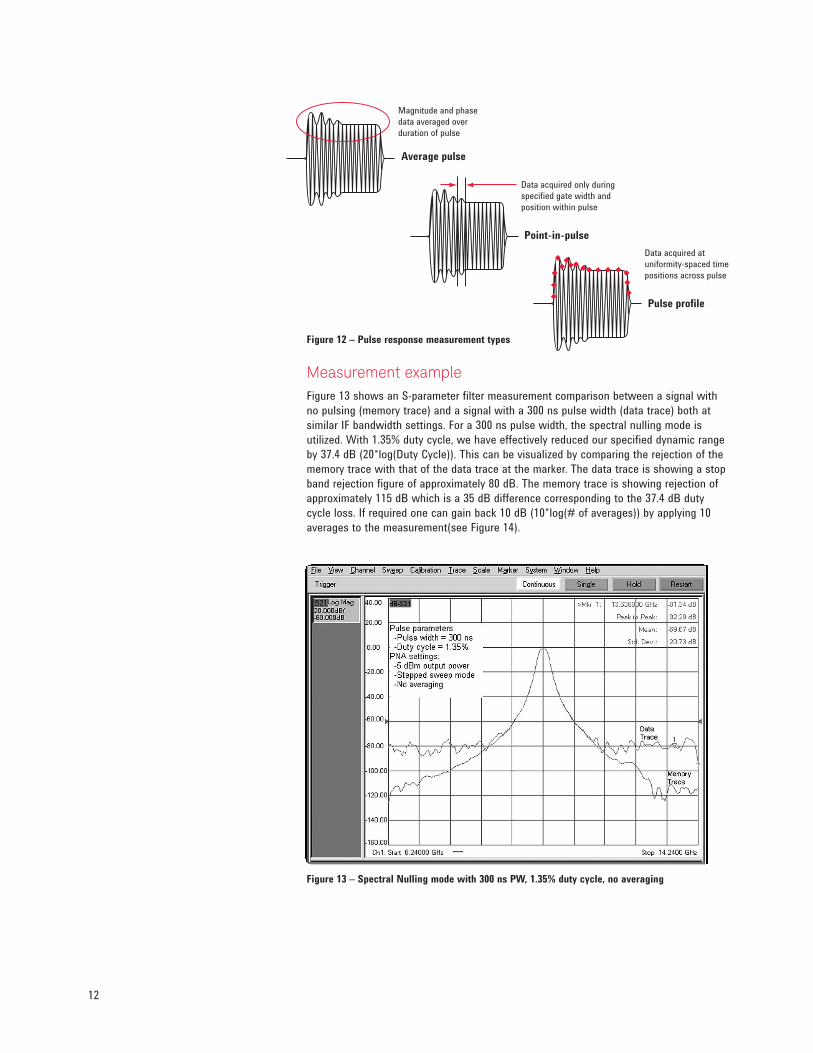
Figure 12 – Pulse response measurement types
Measurement example
Figure 13 shows an S-parameter filter measurement comparison between a signal with
no pulsing (memory trace) and a signal with a 300 ns pulse width (data trace) both at
similar IF bandwidth settings. For a 300 ns pulse width, the spectral nulling mode is
utilized. With 1.35% duty cycle, we have effectively reduced our specified dynamic range
by 37.4 dB (20*log(Duty Cycle)). This can be visualized by comparing the rejection of the
memory trace with that of the data trace at the marker. The data trace is showing a stop
band rejection figure of approximately 80 dB. The memory trace is showing rejection of
approximately 115 dB which is a 35 dB difference corresponding to the 37.4 dB duty
cycle loss. If required one can gain back 10 dB (10*log(# of averages)) by applying 10
averages to the measurement(see Figure 14).
Figure 13 – Spectral Nulling mode with 300 ns PW, 1.35% duty cycle, no averaging
Magnitude and phase
data averaged over
duration of pulse
Average pulse
Data acquired only during
specified gate width and
position within pulse
Point-in-pulse
Data acquired at
uniformity-spaced time
positions across pulse
Pulse profile
13
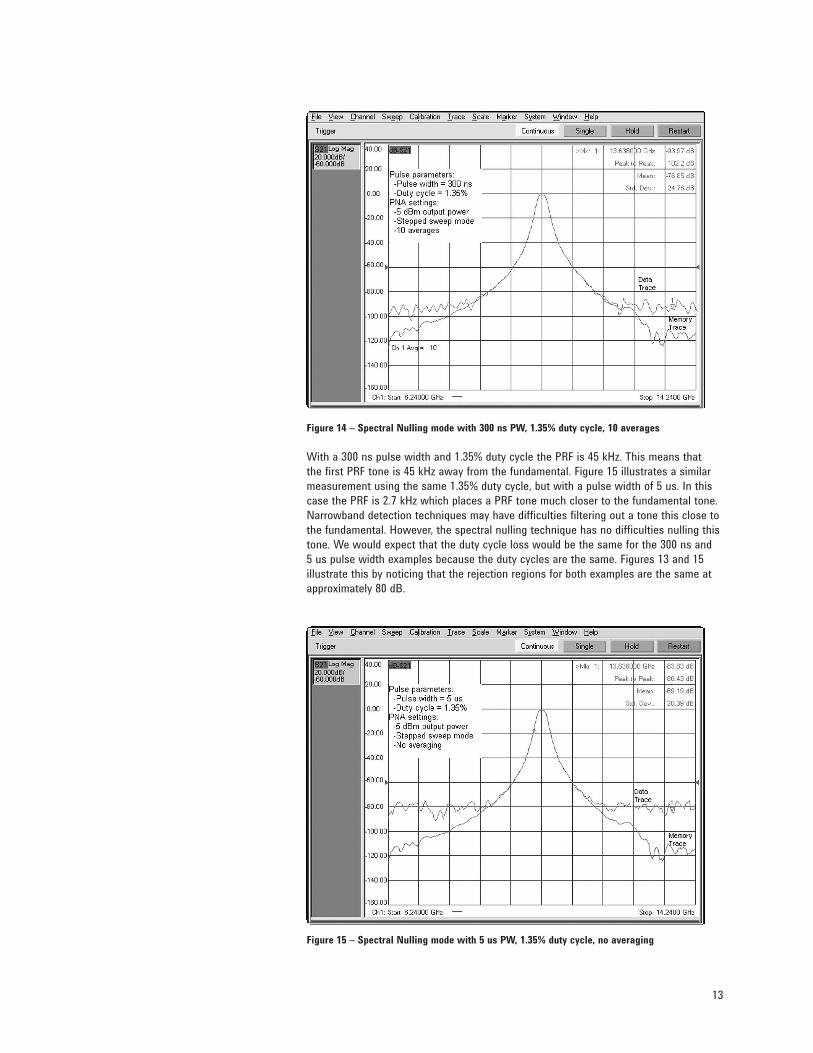
Figure 14 – Spectral Nulling mode with 300 ns PW, 1.35% duty cycle, 10 averages
With a 300 ns pulse width and 1.35% duty cycle the PRF is 45 kHz. This means that
the first PRF tone is 45 kHz away from the fundamental. Figure 15 illustrates a similar
measurement using the same 1.35% duty cycle, but with a pulse width of 5 us. In this
case the PRF is 2.7 kHz which places a PRF tone much closer to the fundamental tone.
Narrowband detection techniques may have difficulties filtering out a tone this close to
the fundamental. However, the spectral nulling technique has no difficulties nulling this
tone. We would expect that the duty cycle loss would be the same for the 300 ns and
5 us pulse width examples because the duty cycles are the same. Figures 13 and 15
illustrate this by noticing that the rejection regions for both examples are the same at
approximately 80 dB.
Figure 15 – Spectral Nulling mode with 5 us PW, 1.35% duty cycle, no averaging
14
Conclusion
The results show that accurate pulsed measurements can be made with the Keysight
microwave PNA. Both the Synchronic Pulse Acquisition and Spectral Nulling modes
offer flexible alternatives for measuring the pulsed S-parameters of components. Very
narrow pulse widths (<1 µs) can be used as long as the duty cycle is large enough for
acceptable measurement dynamic range. The exceptional hardware performance of the
microwave PNA, and the use of the spectral nulling mode, largely offset the limitations
of using a narrowband detection technique for pulsed measurements. The E8362/3/4B
and E8361A microwave series of PNA network analyzers should be configured with
Option H08 and H11 if using the spectral nulling technique and/or if point-in-pulse/
pulse-profiling is required.
Contact Keysight for more information on pulsed configurations.

15
References
Pulsed Measurements using the Microwave PNA Series Network Analyzer, Keysight
Technologies White Paper, publication number 5988-9480EN.
Triggering the PNA Series Network Analyzer for Antenna Measurements, Keysight
Technologies White Paper, publication number 5988-9518EN.
Pulsed Measurements with the Keysight 8720ES and 8753ES Network Analyzers,
Keysight Technologies Product Note, May 2000, publication number 5980-0798E.
Using a Network Analyzer to Characterize High-Power Components, Keysight
Technologies Application Note AN 1287-6, Mar 2003.
J. Barr, R. Grimmet, and R. McAleenan, "Pulsed-RF Measurements and the HP 8510B
Network Analyzer," HP RF & Microwave Measurement Symposium and Exhibition, Aug
1988.
85108A Pulsed Network Analyzer System, Hewlett Packard System Manual, March 1995.
HP 8510B Pulsed-RF Network Analyzer, HP Users Guide, March 1995.
J. Scott, M. Sayed, P. Schmitz, and A. Parker, "Pulsed-bias/Pulsed-RF Device
Measurement System Requirements," 24th European Microwave Conference, pp. 951-
961, Cannes France, September 5-8, 1994.
J. Swanstrom, R. Shoulders, "Pulsed Antenna Measurements with the 8530A
Microwave
Receiver, Hewlett Packard," AMTA conference, undated.
P. Schmitz, M. Sayed, "Techniques for Measuring RF and MW Devices in a Pulsed
Environment," Hewlett Packard, Feb 1993.
B. Taylor, M. Sayed, K. Kerwin, "A Pulse Bias / RF Environment for Device
Characterization," 42nd IEEE ARFTG, San Jose, CA, Dec 1993.
Pulsed-RF Network Analysis using the 8510B, HP Product Note 8510-9, Jan. 1988.
Spectrum Analysis - Pulsed-RF, HP Application Note 150-2.
D. C. Nichols, "Capture and Analysis of Individual Radar Pulses Using a High-Speed,
High-Resolution Digitizer," HP RF & Microwave Measurement Symposium, Sept. 1987.
For more information on Keysight
Technologies’ products, applications or
services, please contact your local Keysight
office. The complete list is available at:
www.keysight.com/find/contactus
Americas
Canada (877) 894 4414Brazil 55 11 3351 7010Mexico 001 800 254 2440United States (800) 829 4444
Asia PaciicAustralia 1 800 629 485China 800 810 0189Hong Kong 800 938 693India 1 800 112 929Japan 0120 (421) 345Korea 080 769 0800Malaysia 1 800 888 848Singapore 1 800 375 8100Taiwan 0800 047 866Other AP Countries (65) 6375 8100
Europe & Middle East
Austria 0800 001122Belgium 0800 58580Finland 0800 523252France 0805 980333Germany 0800 6270999Ireland 1800 832700Israel 1 809 343051Italy 800 599100Luxembourg +32 800 58580Netherlands 0800 0233200Russia 8800 5009286Spain 800 000154Sweden 0200 882255Switzerland 0800 805353
Opt. 1 (DE)Opt. 2 (FR)Opt. 3 (IT)
United Kingdom 0800 0260637
For other unlisted countries:
www.keysight.com/find/contactus
(BP-09-23-14)
myKeysight
www.keysight.com/find/mykeysight
A personalized view into the information most relevant to you.
Keysight Channel Partners
www.keysight.com/find/channelpartners
Get the best of both worlds: Keysight’s measurement expertise and product
breadth, combined with channel partner convenience.
This document was formerly known as application note number 1408-11.
www.keysight.com/find/pna
www.keysight.com/find/ecal
16 | Keysight | Accurate Pulsed Measurements with the PNA Microwave Network Analyzers - Application Note
This information is subject to change without notice.© Keysight Technologies, 2004 - 2014Published in USA, July 31, 20145989-0563ENwww.keysight.com