key performance indicators (kpis) - school nutrition · pdf filenational survey results - how...
TRANSCRIPT

© COPYRIGHT 2016 SCHOOL NUTRITION ASSOCIATION – #ANC16 – SAN ANTONIO, TEXAS
Key Performance Indicators (KPIs):
Practical Applications

© COPYRIGHT 2016 SCHOOL NUTRITION ASSOCIATION – #ANC16 – SAN ANTONIO, TEXAS
Presenters:
Keith Rushing, PhD, RD Research Scientist ICN, ARD Hattiesburg, MS Gay Anderson SNS Child Nutrition Director Brandon Valley Schools Brandon, SD
Julie Boettger, PhD, RD Director, Food & Nutr Services School City of Hammond Hammond, IN

© COPYRIGHT 2016 SCHOOL NUTRITION ASSOCIATION – #ANC16 – SAN ANTONIO, TEXAS
Topics:
National Survey Results - how KPIs are utilized by School Nutrition (SN) Directors
Real Life Examples – Successful Utilization of KPIs for Decision Making & Program Evaluation.
Basic Revenues & Expenses Cost as a Percent of Revenue Meals Per Labor Hour Absenteeism Rate Breakeven point
Per meal costs Calculating MEQs Days Inventory On-Hand Inventory Turnover Rate

© COPYRIGHT 2016 SCHOOL NUTRITION ASSOCIATION – #ANC16 – SAN ANTONIO, TEXAS
Learning Objectives:
Participants will: Understand how most SN professionals
utilize KPIs Be able to apply KPIs for decision
making Be able to utilize KPIs for program
evaluation

© COPYRIGHT 2016 SCHOOL NUTRITION ASSOCIATION – #ANC16 – SAN ANTONIO, TEXAS
Part I
How Most School Nutrition Professionals
Utilize
Key Performance Indicators
Speaker: Keith Rushing

© COPYRIGHT 2016 SCHOOL NUTRITION ASSOCIATION – #ANC16 – SAN ANTONIO, TEXAS
2014 National Survey
Explore SN Professionals’ Usage & Perceptions
of KPIs
105 Multiple Choice Questions
Development Assisted by SN professionals:
Expert Panel (8)
Review Panel (21)

© COPYRIGHT 2016 SCHOOL NUTRITION ASSOCIATION – #ANC16 – SAN ANTONIO, TEXAS
2014 National Survey cont.
Random Sample: 700 SN directors
Stratified by USDA Region Response Rate: 29% (N=205)
© COPYRIGHT 2016 SCHOOL NUTRITION ASSOCIATION – #ANC16 – SAN ANTONIO, TEXAS
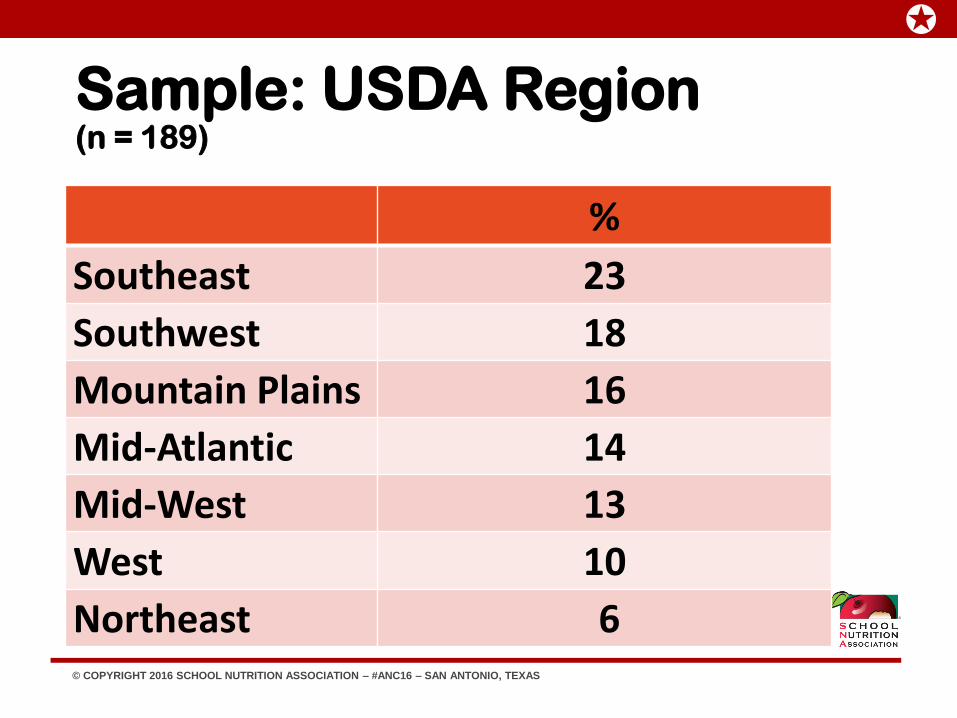
Sample: USDA Region (n = 189)
%
Southeast 23
Southwest 18
Mountain Plains 16
Mid-Atlantic 14
Mid-West 13
West 10
Northeast 6
© COPYRIGHT 2016 SCHOOL NUTRITION ASSOCIATION – #ANC16 – SAN ANTONIO, TEXAS
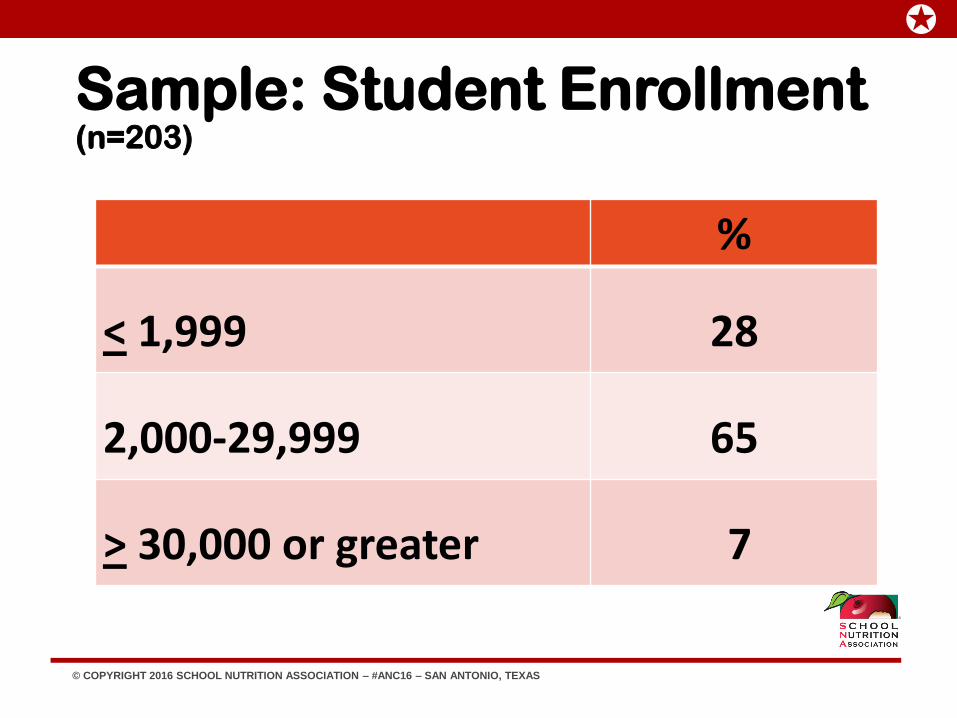
Sample: Student Enrollment (n=203)
%
< 1,999 28
2,000-29,999 65
> 30,000 or greater 7

© COPYRIGHT 2016 SCHOOL NUTRITION ASSOCIATION – #ANC16 – SAN ANTONIO, TEXAS
Sample: Position Title (n=197)
%
SN Director 78
District-Level SN Supervisor 17
School-Level SN Manager 5

© COPYRIGHT 2016 SCHOOL NUTRITION ASSOCIATION – #ANC16 – SAN ANTONIO, TEXAS
Sample: Education level (n=189)
%
High School / GED 25
Associate’s Degree 15
Bachelor’s Degree 32
Master’s Degree 23
Doctorate Degree 5
© COPYRIGHT 2016 SCHOOL NUTRITION ASSOCIATION – #ANC16 – SAN ANTONIO, TEXAS
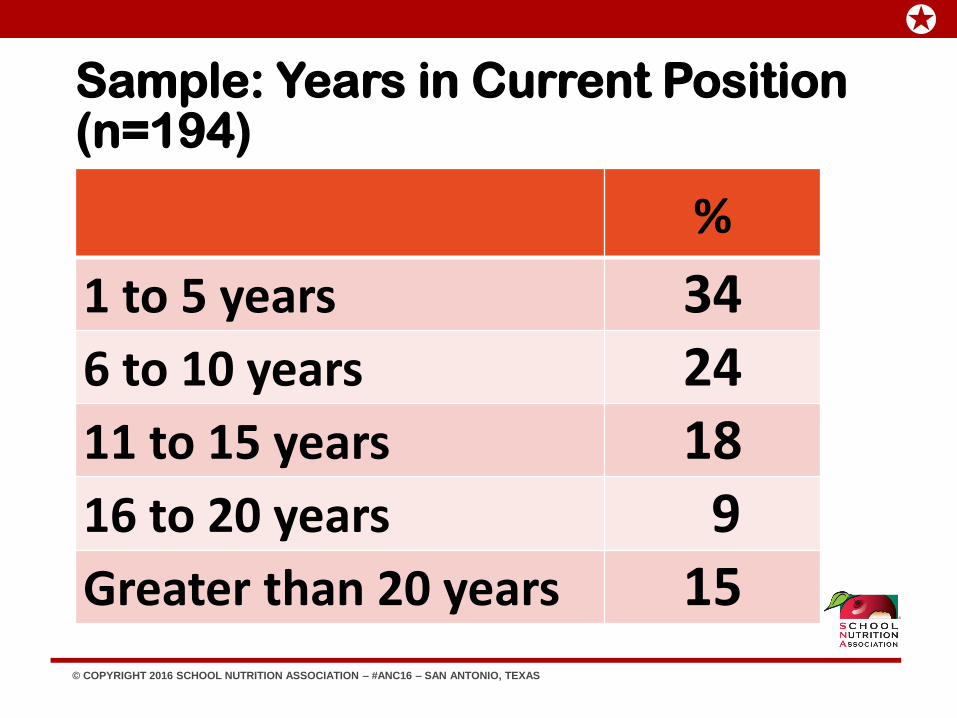
Sample: Years in Current Position (n=194)
%
1 to 5 years 34 6 to 10 years 24 11 to 15 years 18 16 to 20 years 9 Greater than 20 years 15

© COPYRIGHT 2016 SCHOOL NUTRITION ASSOCIATION – #ANC16 – SAN ANTONIO, TEXAS
11 Survey KPIs:
1. Average Daily Participation
2. Cost Per Meal
3. Cost as a Percent of Revenue
4. Revenue Per Meal
5. Breakeven Point
6. Meals Per Labor Hour
© COPYRIGHT 2016 SCHOOL NUTRITION ASSOCIATION – #ANC16 – SAN ANTONIO, TEXAS
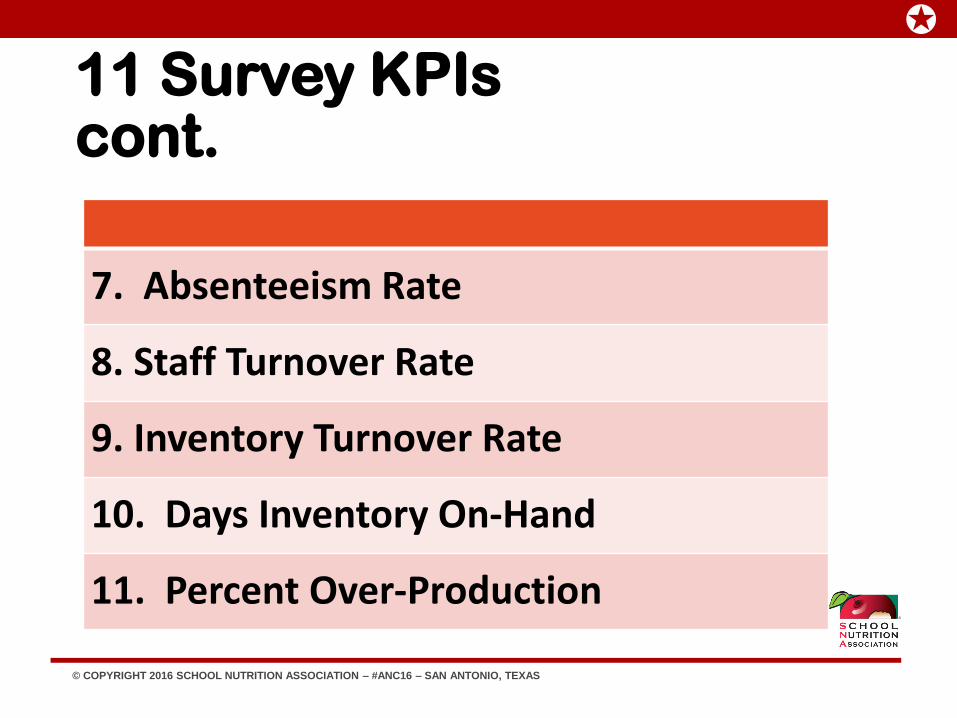
11 Survey KPIs cont.
7. Absenteeism Rate
8. Staff Turnover Rate
9. Inventory Turnover Rate
10. Days Inventory On-Hand
11. Percent Over-Production

© COPYRIGHT 2016 SCHOOL NUTRITION ASSOCIATION – #ANC16 – SAN ANTONIO, TEXAS
Level of Understanding of KPIs (n varies from 201 - 204)
Adequate Partial No
Average Daily Participation 96% 3% 1%
Meals per Labor Hour 88% 10% 2%
Cost Per Meal 85% 13% 2%
Revenue Per Meal 77% 22% 1%
Staff Turnover Rate 73% 21% 6%
Absenteeism Rate 73% 23% 4%

© COPYRIGHT 2016 SCHOOL NUTRITION ASSOCIATION – #ANC16 – SAN ANTONIO, TEXAS
Level of Understanding of KPIs continued (n varies from 201 - 204)
Adequate Partial No
Cost as a Percent of Revenue 71% 24% 5%
Breakeven Point 70% 24% 6%
Days of Inventory On-Hand 65% 28% 7%
Inventory Turnover Rate 61% 31% 8%
Percent Over-Production 45% 36% 19%

© COPYRIGHT 2016 SCHOOL NUTRITION ASSOCIATION – #ANC16 – SAN ANTONIO, TEXAS
Use of KPIs for Decision Making (n varies from198 - 204)
Yes
Average Daily Participation 91%
Cost Per Meal 89%
Meals Per Labor Hour 82%
Revenue Per Meal 64%
Cost as a Percent of Revenue 61%
Breakeven Point 53%

© COPYRIGHT 2016 SCHOOL NUTRITION ASSOCIATION – #ANC16 – SAN ANTONIO, TEXAS
Use of KPIs for Decision Making continued (n varies from198 - 204)
Yes
Days of Inventory On-Hand 44%
Absenteeism Rate 42%
Inventory Turnover Rate 36%
Percent Over-Production 33%
Staff Turnover Rate 30%

© COPYRIGHT 2016 SCHOOL NUTRITION ASSOCIATION – #ANC16 – SAN ANTONIO, TEXAS
Other SN Professionals in District that Use KPIs (n varies from 199 - 203)
Yes No ?
District Level Supervisors 57% 30% 13%
School Level Managers 43% 57% 10%
Cooks 15% 79% 6%
© COPYRIGHT 2016 SCHOOL NUTRITION ASSOCIATION – #ANC16 – SAN ANTONIO, TEXAS
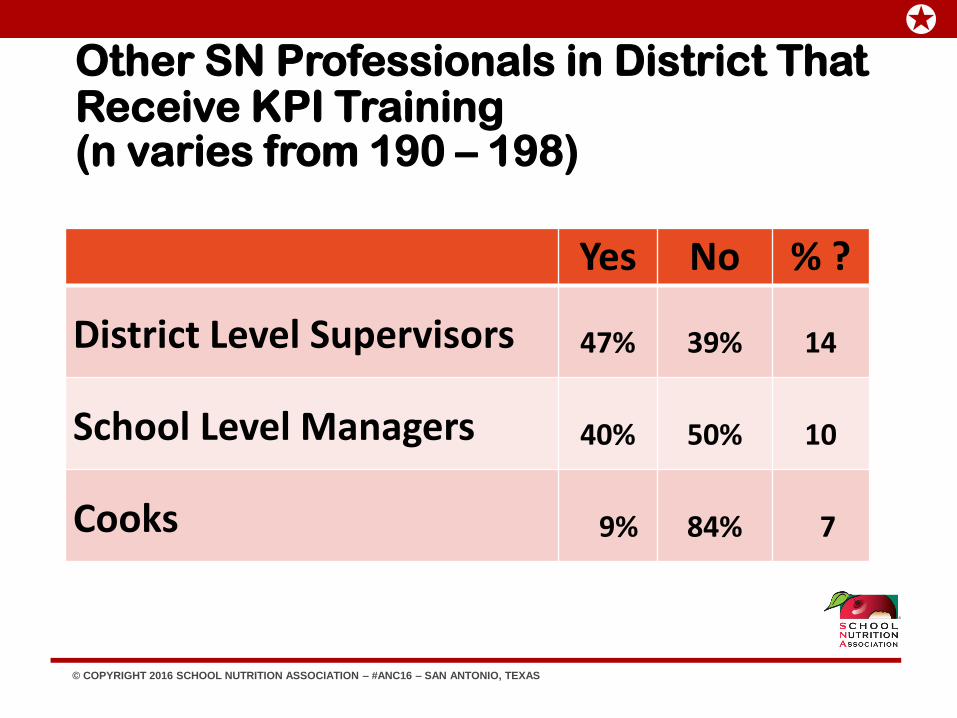
Other SN Professionals in District That Receive KPI Training (n varies from 190 – 198)
Yes No % ?
District Level Supervisors 47% 39% 14
School Level Managers 40% 50% 10
Cooks 9% 84% 7

© COPYRIGHT 2016 SCHOOL NUTRITION ASSOCIATION – #ANC16 – SAN ANTONIO, TEXAS
Agreement with KPI Statements (n varies from 201 – 203)
Agree / Strongly Agree
KPIs are useful for decision making 98%
KPIs are valuable tools for evaluating a school nutrition program
96%
KPIs are time consuming to calculate 76%

© COPYRIGHT 2016 SCHOOL NUTRITION ASSOCIATION – #ANC16 – SAN ANTONIO, TEXAS
Agreement with KPI Statements continued (n varies from 201 – 203)
Agree / Strongly
Agree
KPIs are easy to calculate 72%
KPIs are difficult to interpret 39%
School nutrition professions receive adequate training on KPIs
13%

© COPYRIGHT 2016 SCHOOL NUTRITION ASSOCIATION – #ANC16 – SAN ANTONIO, TEXAS
Conclusions
Understanding of most KPIs is good, but room for improvement
The majority of SN professionals do not use 6 of the KPIs for decision making
Other than directors, most SN professionals receive no KPI training, yet 65% of Supervisors and 43% of Managers use KPIs

© COPYRIGHT 2016 SCHOOL NUTRITION ASSOCIATION – #ANC16 – SAN ANTONIO, TEXAS
Conclusions
KPIs are:
Useful for decision making
Valuable for program evaluation
Time consuming to calculate
Easy to calculate and interpret

© COPYRIGHT 2016 SCHOOL NUTRITION ASSOCIATION – #ANC16 – SAN ANTONIO, TEXAS
Conclusions
•Most SN professionals agree that the KPI training received is inadequate.

© COPYRIGHT 2016 SCHOOL NUTRITION ASSOCIATION – #ANC16 – SAN ANTONIO, TEXAS
Take Home Message:
•More KPI training and resources are needed for SN professionals, especially those that have the potential to become program directors.

© COPYRIGHT 2016 SCHOOL NUTRITION ASSOCIATION – #ANC16 – SAN ANTONIO, TEXAS
Part II
Application of KPIs for Decision Making and Program Evaluation
Speaker: Gay Anderson
Per meal costs Calculating MEQs Days Inventory On-Hand Inventory Turnover Rate

© COPYRIGHT 2016 SCHOOL NUTRITION ASSOCIATION – #ANC16 – SAN ANTONIO, TEXAS
Per Meal Costs
• Objective:
• Share the importance in knowing and understanding daily meal costs.
• Understanding how to calculate meal costs
• What to do with this information once you have it available

© COPYRIGHT 2016 SCHOOL NUTRITION ASSOCIATION – #ANC16 – SAN ANTONIO, TEXAS
What is an acceptable standard for a daily meal cost?
• There are not any solid figures to use as we all have unique variables in each district and schools that are factored in. • Are you a full service kitchen?
• Do you satellite food to other locations?
• What quality levels of food do you purchase or expected to purchase?
• What is your past average?
• Where do you want your %’s or costs to be?
• Setting Goals for your program
© COPYRIGHT 2016 SCHOOL NUTRITION ASSOCIATION – #ANC16 – SAN ANTONIO, TEXAS
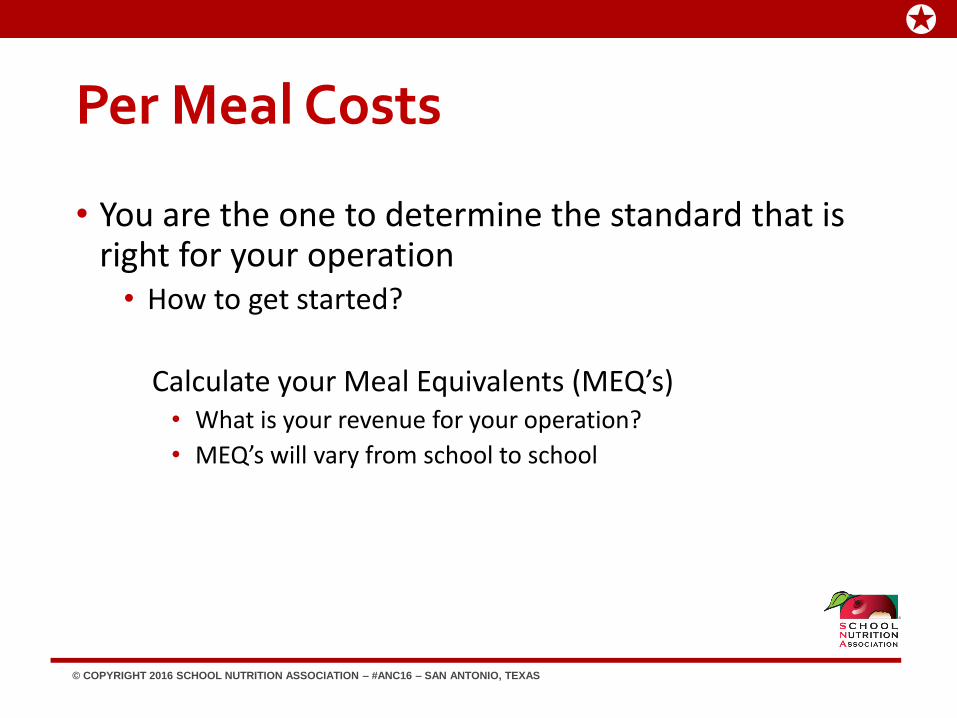
Per Meal Costs
• You are the one to determine the standard that is right for your operation • How to get started?
Calculate your Meal Equivalents (MEQ’s) • What is your revenue for your operation?
• MEQ’s will vary from school to school

© COPYRIGHT 2016 SCHOOL NUTRITION ASSOCIATION – #ANC16 – SAN ANTONIO, TEXAS
Calculating MEQ’S
Standard conversions 1 Lunch = 1 MEQ 3 Breakfasts *.67 = 2 MEQ’s 1 Dinner = 1 MEQ 3 Snacks = 1 MEQ Ala Carte Sales / Total Federal Reimbursement

© COPYRIGHT 2016 SCHOOL NUTRITION ASSOCIATION – #ANC16 – SAN ANTONIO, TEXAS
MEQ’s Example
• 100 Breakfasts X .67 = 67 MEQ’s
• 455 Lunches = 455 MEQ’s
• 70 Snacks X .33 = 23 MEQ’s
• Nonprogram Foods $432.00 / 3.07 + .06 + .29 (3.42) = 126 MEQ’s
• Total MEQ’s for day = 671

© COPYRIGHT 2016 SCHOOL NUTRITION ASSOCIATION – #ANC16 – SAN ANTONIO, TEXAS
MEAL COSTS & MEQ’s
• Total Expenses for the day are?
Total Food Costs
Total Labor
Total Other
• Can Demonstrate individually or as a total
• Expenses were $1971.65 / MEQ’s 671 = 2.94
Where do you need to see yourself

© COPYRIGHT 2016 SCHOOL NUTRITION ASSOCIATION – #ANC16 – SAN ANTONIO, TEXAS
MEAL COSTS & MEQ’s
• I prefer to take food out and look at this separately
Total Food Costs / Total MEQ’s provides a clean
picture of the day to day meal costs and you are
better able to compare menus and days you have
Peaks in Cost and days you have your Lower Costs
Total Food Cost = $1060.18 / 671 MEQ’s
PER MEAL COST = $1.58

© COPYRIGHT 2016 SCHOOL NUTRITION ASSOCIATION – #ANC16 – SAN ANTONIO, TEXAS
Understanding Meal Costs
• Note: One other significant factor in completing this process is in planning the menu and setting a target for you daily meal costs.
• Strongly suggest calculating out what an average
per meal cost is when writing the menu based on
planning. This will assist as you monitor multiple
locations and compare variances along with what
took place on the specific day.

© COPYRIGHT 2016 SCHOOL NUTRITION ASSOCIATION – #ANC16 – SAN ANTONIO, TEXAS
Day Inventory On-Hand
• Begin by finding out what you need based on deliveries • Money on the shelf is costly
• How many times should inventory be turned each month and why? • 3-4 times per month
• System controls
• Money on the shelf
• Quality factors
• Prevents or lessens the opportunity of theft

© COPYRIGHT 2016 SCHOOL NUTRITION ASSOCIATION – #ANC16 – SAN ANTONIO, TEXAS
Days Inventory On-Hand
• How to calculate # of inventory turns.
Need to know total cost of food for previous month
Beginning Inventory + Purchases – Ending inventory
= Cost of Food Used
Cost of Food Used / by two = Average Inventory
Cost of Food Used /by Average Inventory = Inventory turns

© COPYRIGHT 2016 SCHOOL NUTRITION ASSOCIATION – #ANC16 – SAN ANTONIO, TEXAS
Understanding Inventory Turnover Rate
• Objectives
• How to calculate an inventory turn
• Understand why one needs to know and monitor inventory turns
• Suggestions for improving turns

© COPYRIGHT 2016 SCHOOL NUTRITION ASSOCIATION – #ANC16 – SAN ANTONIO, TEXAS
INVENTORY Turnover Rate EXAMPLE
• January ending inventory $10,000. PLUS
• February purchases $50,000 =
• $60,000
• February ending inventory $ 8,000 -
• Total cost of food $52,000 / 2
Average Inventory $26,000
Total cost of food/average inventory = 2 turns

© COPYRIGHT 2016 SCHOOL NUTRITION ASSOCIATION – #ANC16 – SAN ANTONIO, TEXAS
How To Change Inventory Turnover Rate
Reduce number of SKUS – Find ways to use items
in multiple ways.
Cycle menus
Set pars for what managers can keep on hand
When possible share between sites.

© COPYRIGHT 2016 SCHOOL NUTRITION ASSOCIATION – #ANC16 – SAN ANTONIO, TEXAS
CONCLUSION
Understand you are running a business
Sound business practices in inventory controls
and monitoring food costs are imperative in
making your program successful
.

© COPYRIGHT 2016 SCHOOL NUTRITION ASSOCIATION – #ANC16 – SAN ANTONIO, TEXAS
Part III
Application of KPIs for Decision Making and Program Evaluation
Speaker: Julie Boettger
Basic Revenues & Expenses Cost as a Percent of Revenue Meals Per Labor Hour Absenteeism Rate Breakeven point

© COPYRIGHT 2016 SCHOOL NUTRITION ASSOCIATION – #ANC16 – SAN ANTONIO, TEXAS
School City of Hammond
• 22 schools in greater Chicago area, 14,000 students
• 140 employees with 15-18 benefit days/year
• Wages in 2013-14 $7.81 – 17.69
• Wages in 2015-16 $9.02 – 20.16 (14-15% increase)
• CEP in elementary schools
• 80% free/reduced in secondary schools
• All on-site preparation
• 7 At-Risk Supper sites
• After School Snacks
• 6 Fresh Fruit and Vegetable Program sites
• Summer Food Program

© COPYRIGHT 2016 SCHOOL NUTRITION ASSOCIATION – #ANC16 – SAN ANTONIO, TEXAS
Revenues and Expenses Revenue (Income)
Federal Reimbursements $ 7,432,520
Cash from meals, adults 951,053
FFVP 218,912
State Matching 16,040
Other Revenue 31,224
Total Revenue $8,649,749
Expenses
Food Used (-rebates) $3,340,044
Labor (including benefits) 2,988,906
Other direct 1,525,739
Other indirect 0
Total Expenses $7,854,689
Profit (Loss) $795,060
© COPYRIGHT 2016 SCHOOL NUTRITION ASSOCIATION – #ANC16 – SAN ANTONIO, TEXAS
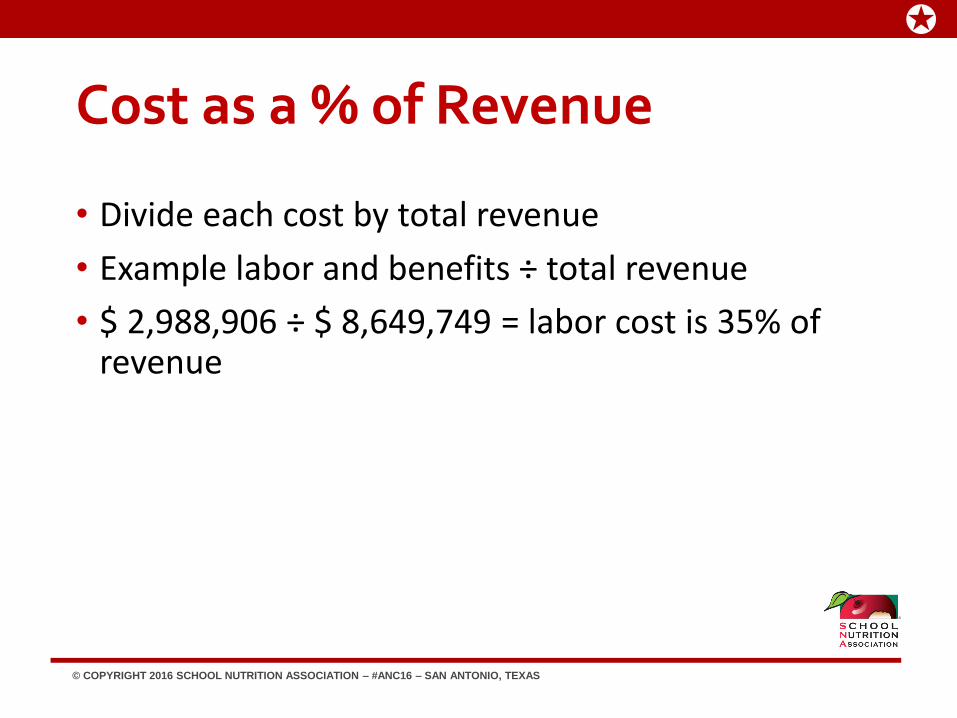
Cost as a % of Revenue
• Divide each cost by total revenue
• Example labor and benefits ÷ total revenue
• $ 2,988,906 ÷ $ 8,649,749 = labor cost is 35% of revenue

© COPYRIGHT 2016 SCHOOL NUTRITION ASSOCIATION – #ANC16 – SAN ANTONIO, TEXAS
Cost as a % of Revenue Revenue (Income) % of Revenue
Federal Reimbursements $ 7,432,520 86%
Cash from meals, adults 951,053 11%
FFVP 218,912 3%
State Matching 16,040 0%
Other Revenue 31,224 0%
Total Revenue $8,649,749 100%
Expenses
Food Used (-rebates) $3,340,044 38%
Labor (including benefits) 2,988,906 35%
Other direct 1,525,739 18%
Other indirect 0 0%
Total Expenses $7,854,689 91%
Profit (Loss) $795,060 9%

© COPYRIGHT 2016 SCHOOL NUTRITION ASSOCIATION – #ANC16 – SAN ANTONIO, TEXAS
Projected Effect of Raise on Labor Cost • $2,988,906 x 1.15 = $3,437,241
• $3,437,241 ÷ $ 8,649,749 = 39.7% Labor Cost

© COPYRIGHT 2016 SCHOOL NUTRITION ASSOCIATION – #ANC16 – SAN ANTONIO, TEXAS
Meals Per Labor Hour (MPLH)
• Measure of productivity • Meal equivalents (MEQ) ÷ labor hours • Labor hours includes site based labor:
• Manager • Kitchen staff • Substitutes
• Labor does not include • Personal illness, vacation, holiday pay • Supervision of students
• Compare site productivity against industry standard for similar type of production, service, and size of operation

© COPYRIGHT 2016 SCHOOL NUTRITION ASSOCIATION – #ANC16 – SAN ANTONIO, TEXAS
Determine Meals Per Labor Hour – Edison Elementary
Meals MEQ
___411__Breakfast ÷ 3 137
___565__Lunch 565
___10__Supper 10
__58__After School Snacks ÷ 4 14
_ $15__A la carte ÷ 3 5
Total MEQ 731
Labor Hours 36

© COPYRIGHT 2016 SCHOOL NUTRITION ASSOCIATION – #ANC16 – SAN ANTONIO, TEXAS
On-Site Staffing Guidelines
Example:
731 MEQ ÷ 20 MPLH = 36.5 Labor Hours
20 22 17 19 701-800
16 18 14 16 301-400
Low High Low High Number MEQ
Convenience Conventional
MPLH MPLH

© COPYRIGHT 2016 SCHOOL NUTRITION ASSOCIATION – #ANC16 – SAN ANTONIO, TEXAS
Hammond MPLH
• Target 10 – 21 MPLH
• Actual Range is 9.7 – 25.6 MPLH
• High schools tend to be below target
• Middle tend to be above target

© COPYRIGHT 2016 SCHOOL NUTRITION ASSOCIATION – #ANC16 – SAN ANTONIO, TEXAS
Total Labor Costs in Hammond
• Total labor costs affected by • Productivity
• Labor rates
• Cost of benefits
• Absenteeism (paying twice for same labor hour)
• Turnover rate (17.7%)
• Vacancy rate (9.9 % of positions are not filled)

© COPYRIGHT 2016 SCHOOL NUTRITION ASSOCIATION – #ANC16 – SAN ANTONIO, TEXAS
Absenteeism Rate • The rate at which employee miss work due to illness,
personal business or other reasons.
• ((# hours lost for the period) ÷ ((number of days in the period x average # of hours worked for the period)x (average # employees during the period))) x 100 = absenteeism rate
• Step 1 - (number of days in the period x average # of hours worked for the period)x (average # employees during the period) THEN
• Step 2 - (# hours lost for the period) ÷ the calculation above
• Step 3 - The calculation above x 100 = absenteeism rate

© COPYRIGHT 2016 SCHOOL NUTRITION ASSOCIATION – #ANC16 – SAN ANTONIO, TEXAS
Hammond Absenteeism
• 6.21 average hours/day; 156 days in year, 120.5 average number of employees, 5,675.25 total days absent YTD
• (5,675.25 ÷ (120.5 x (156 x 6.21))) x 100 = 4.86
• Range for personal absenteeism 25% - 0%
• Policy is more than 5% (9 days for the year) absenteeism is considered excessive
• If employee uses all benefits days they can be terminated
• If their attendance is poor they are eliminated from summer food program assignments
© COPYRIGHT 2016 SCHOOL NUTRITION ASSOCIATION – #ANC16 – SAN ANTONIO, TEXAS
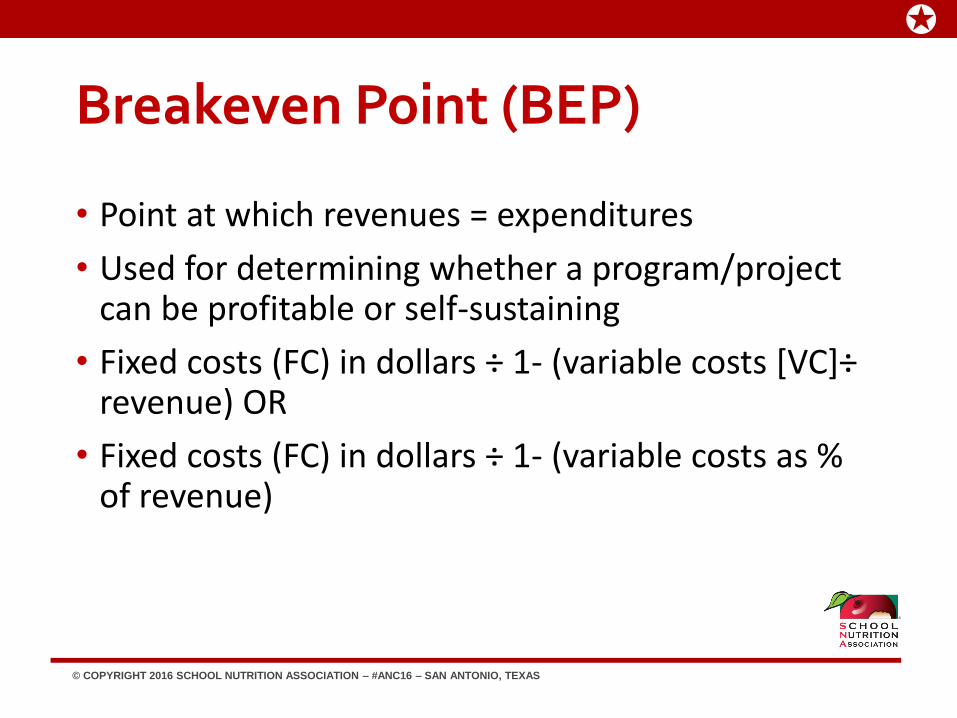
Breakeven Point (BEP)
• Point at which revenues = expenditures
• Used for determining whether a program/project can be profitable or self-sustaining
• Fixed costs (FC) in dollars ÷ 1- (variable costs [VC]÷ revenue) OR
• Fixed costs (FC) in dollars ÷ 1- (variable costs as % of revenue)

© COPYRIGHT 2016 SCHOOL NUTRITION ASSOCIATION – #ANC16 – SAN ANTONIO, TEXAS
BEP Case Study – Saturday Success Camp Proposed Revenue
Item Revenue FC VC VC%
Breakfast 100 @ $1.99
$ 199.00
Snacks 100 @ $ .84
$ 84.00
Food Cost $ 113.20 40 %
Labor Cost $17.63 x 4 hrs
$ 70.52
Supplies $ 14.15 5 %
Totals $283.00 $127.35
BEP $70.52 ÷ .55 = $128.22

© COPYRIGHT 2016 SCHOOL NUTRITION ASSOCIATION – #ANC16 – SAN ANTONIO, TEXAS
Actual Revenue for Saturday Success Camp Item Revenue Fixed Cost Variable Cost VC %
Breakfast 50 @ $1.99
$ 99.50
Snacks 50 @ $ .84
$ 42.00
Food $56.50 40%
Labor $17.63 x 4 hrs
$ 70.52
Supplies $ 7.08 5%
Totals $ 141.50 $63.58
BEP $70.52 ÷ .55 = $128.22

© COPYRIGHT 2016 SCHOOL NUTRITION ASSOCIATION – #ANC16 – SAN ANTONIO, TEXAS
Questions?