key markets
TRANSCRIPT

The M25 & South East Office Market Report
Key Markets
ww
w.kn
ight
frank
.com
/M25
-offi
ces
2021

The 18 Markets
Blackwater Valley
Bracknell
Brighton
Cambridge
Crawley/Gatwick
Croydon
Guildford
Heathrow
Maidenhead
Oxford
Reading
Slough
Staines
Uxbridge
Watford
West London
Wimbledon
Woking
Click to navigate
K N I G H T F R A N K
1
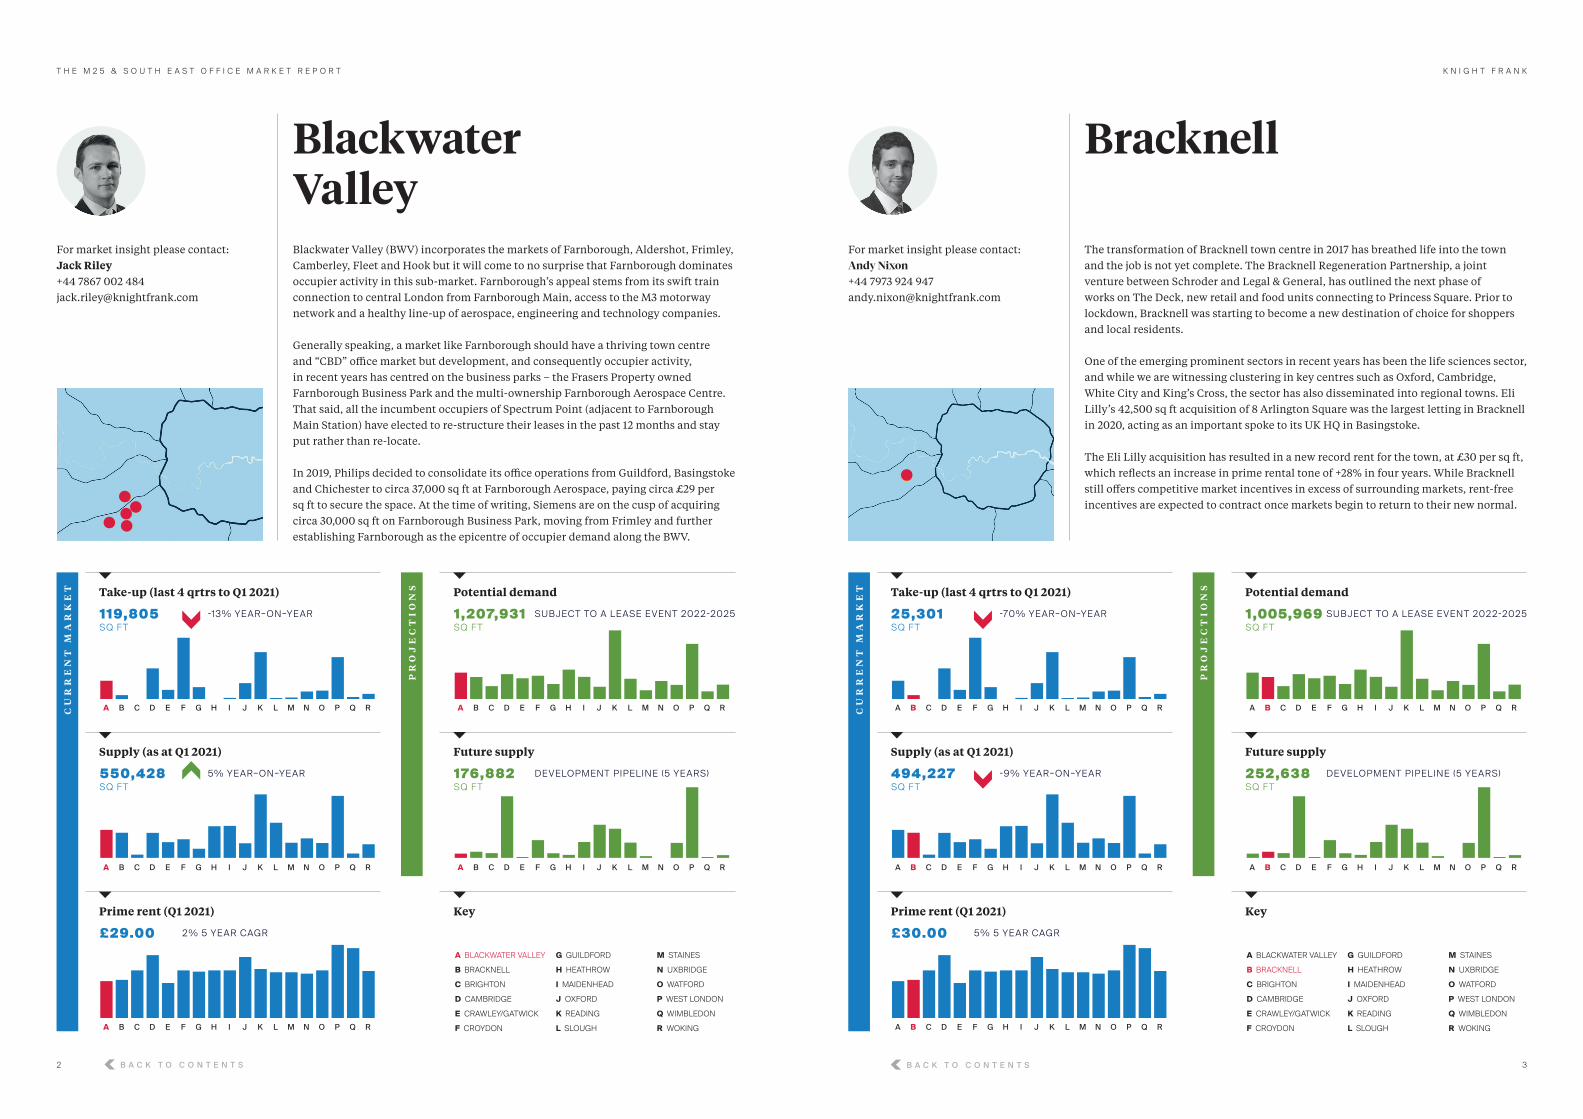
Blackwater Valley (BWV) incorporates the markets of Farnborough, Aldershot, Frimley, Camberley, Fleet and Hook but it will come to no surprise that Farnborough dominates occupier activity in this sub-market. Farnborough’s appeal stems from its swift train connection to central London from Farnborough Main, access to the M3 motorway network and a healthy line-up of aerospace, engineering and technology companies.
Generally speaking, a market like Farnborough should have a thriving town centre and “CBD” office market but development, and consequently occupier activity, in recent years has centred on the business parks – the Frasers Property owned Farnborough Business Park and the multi-ownership Farnborough Aerospace Centre. That said, all the incumbent occupiers of Spectrum Point (adjacent to Farnborough Main Station) have elected to re-structure their leases in the past 12 months and stay put rather than re-locate.
In 2019, Philips decided to consolidate its office operations from Guildford, Basingstoke and Chichester to circa 37,000 sq ft at Farnborough Aerospace, paying circa £29 per sq ft to secure the space. At the time of writing, Siemens are on the cusp of acquiring circa 30,000 sq ft on Farnborough Business Park, moving from Frimley and further establishing Farnborough as the epicentre of occupier demand along the BWV.
Blackwater Valley
A BLACKWATER VALLEY
B BRACKNELL
C BRIGHTON
D CAMBRIDGE
E CRAWLEY/GATWICK
F CROYDON
G GUILDFORD
H HEATHROW
I MAIDENHEAD
J OXFORD
K READING
L SLOUGH
M STAINES
N UXBRIDGE
O WATFORD
P WEST LONDON
Q WIMBLEDON
R WOKING
CU
RR
EN
T M
AR
KE
T
PR
OJ
EC
TI
ON
S
A B F J NC G K OD H L PE I M Q R
Take-up (last 4 qrtrs to Q1 2021)
119,805 SQ F T
A B F J NC G K OD H L PE I M Q R
Potential demand
1,207,931 SQ F T
A B F J NC G K OD H L PE I M Q R
Supply (as at Q1 2021)
550,428 SQ F T
5% YE AR–ON–YE AR
A B F J NC G K OD H L PE I M Q R
Future supply
176,882 SQ F T
A B F J NC G K OD H L PE I M Q R
Prime rent (Q1 2021)
£29.00 2% 5 YE AR CAGR
Key
For market insight please contact: Jack Riley+44 7867 002 [email protected]
SUBJECT TO A LE ASE E VENT 2022-2025
DE VELOPMENT PIPELINE (5 YE ARS)
The transformation of Bracknell town centre in 2017 has breathed life into the town and the job is not yet complete. The Bracknell Regeneration Partnership, a joint venture between Schroder and Legal & General, has outlined the next phase of works on The Deck, new retail and food units connecting to Princess Square. Prior to lockdown, Bracknell was starting to become a new destination of choice for shoppers and local residents.
One of the emerging prominent sectors in recent years has been the life sciences sector, and while we are witnessing clustering in key centres such as Oxford, Cambridge, White City and King’s Cross, the sector has also disseminated into regional towns. Eli Lilly’s 42,500 sq ft acquisition of 8 Arlington Square was the largest letting in Bracknell in 2020, acting as an important spoke to its UK HQ in Basingstoke.
The Eli Lilly acquisition has resulted in a new record rent for the town, at £30 per sq ft, which reflects an increase in prime rental tone of +28% in four years. While Bracknell still offers competitive market incentives in excess of surrounding markets, rent-free incentives are expected to contract once markets begin to return to their new normal.
Bracknell
A BLACKWATER VALLEY
B BRACKNELL
C BRIGHTON
D CAMBRIDGE
E CRAWLEY/GATWICK
F CROYDON
G GUILDFORD
H HEATHROW
I MAIDENHEAD
J OXFORD
K READING
L SLOUGH
M STAINES
N UXBRIDGE
O WATFORD
P WEST LONDON
Q WIMBLEDON
R WOKING
CU
RR
EN
T M
AR
KE
T
PR
OJ
EC
TI
ON
S
A B F J NC G K OD H L PE I M Q R
Take-up (last 4 qrtrs to Q1 2021)
25,301 SQ F T
-70% YE AR–ON–YE AR
A B F J NC G K OD H L PE I M Q R
Potential demand
1,005,969 SQ F T
A B F J NC G K OD H L PE I M Q R
Supply (as at Q1 2021)
494,227 SQ F T
-9% YE AR–ON–YE AR
A B F J NC G K OD H L PE I M Q R
Future supply
252,638 SQ F T
A B F J NC G K OD H L PE I M Q R
Prime rent (Q1 2021)
£30.00 5% 5 YE AR CAGR
Key
For market insight please contact: Andy Nixon
+44 7973 924 947 [email protected]
SUBJECT TO A LE ASE E VENT 2022-2025
DE VELOPMENT PIPELINE (5 YE ARS)
-13% YE AR–ON–YE AR
B A C K T O C O N T E N T S B A C K T O C O N T E N T S
T H E M 2 5 & S O U T H E A S T O F F I C E M A R K E T R E P O R T
2
K N I G H T F R A N K
3

Brighton has been one of the most exciting south east office markets in recent years because of its local culture, combination of big business (L&G, D&G, Amex) and TMT start-ups. Brighton has become a place where people (typically the millennial and Gen Z generations) want to work and where business wants to grow. Couple these factors with a constrained development pipeline and landlords have rejoiced at the demand and supply imbalance, while occupiers wait for the next wave of quality office product.
The Brinell Building set a new record headline rent for the city at £32 per sq ft in 2019. The 65,000 sq ft building was speculatively developed and fully committed to three tenants nine months ahead of PC, proving that Brighton is a market justifying the “build it and they will come” tagline with no Grade A supply delivered since. Pent-up demand continues, with just a couple of pipeline schemes due for completion in the next 12 months – circa 145,000 sq ft at Circus Street and Edward Street Quarter. Expect headline rents to show further growth in the coming years as the city quickly bounces back from pandemic restrictions and “life on the lanes” resumes.
Brighton
A BLACKWATER VALLEY
B BRACKNELL
C BRIGHTON
D CAMBRIDGE
E CRAWLEY/GATWICK
F CROYDON
G GUILDFORD
H HEATHROW
I MAIDENHEAD
J OXFORD
K READING
L SLOUGH
M STAINES
N UXBRIDGE
O WATFORD
P WEST LONDON
Q WIMBLEDON
R WOKING
CU
RR
EN
T M
AR
KE
T
PR
OJ
EC
TI
ON
S
A B F J NC G K OD H L PE I M Q R
Take-up (last 4 qrtrs to Q1 2021)
– SQ F T
A B F J NC G K OD H L PE I M Q R
Potential demand
588,917 SQ F T
A B F J NC G K OD H L PE I M Q R
Supply (as at Q1 2021)
64,7 76 SQ F T
146% YE AR–ON–YE AR
A B F J NC G K OD H L PE I M Q R
Future supply
195,910 SQ F T
A B F J NC G K OD H L PE I M Q R
Prime rent (Q1 2021)
£37.50 6% 5 YE AR CAGR
Key
For market insight please contact: Jack Riley+44 7867 002 [email protected]
SUBJECT TO A LE ASE E VENT 2022-2025
DE VELOPMENT PIPELINE (5 YE ARS)
Cambridge has strong credentials for growth. An ecosystem of science and technology has developed, with the sector accounting for 70% of take-up in 2020. The clusters north and south of the city have recorded strong activity, headed by the letting of 93,000 sq ft at Cambridge Science Park to MathWorks. Brockton Everlast, who outbid an extensive list of interested investors, acquired 214-240 Cambridge Science Park from L&G in Q1 2021 demonstrating investor appetite. The shortage of laboratory and lab-enabled offices has spurred Abstract to submit planning for the first phase of Cambridge International Technology Park. The scheme spans 15 acres to the east of the city centre, where phase 1 will comprise 105,000 sq ft, with a further 400,000 sq ft remaining. The prime location in the city centre is Station Road, where Brookgate and Aviva have agreed pre-let’s with Apple and Fora.
City centre rents are circa mid/late £40s per sq ft and have room to grow. Rental growth is forecast for peripheral locations too, albeit because of the use mix (laboratory, office and hybrid space) benchmarking values is difficult. Latent demand of between 400,000 sq ft and 800,000 sq ft remains meaning further rental growth can be expected.
Cambridge
A BLACKWATER VALLEY
B BRACKNELL
C BRIGHTON
D CAMBRIDGE
E CRAWLEY/GATWICK
F CROYDON
G GUILDFORD
H HEATHROW
I MAIDENHEAD
J OXFORD
K READING
L SLOUGH
M STAINES
N UXBRIDGE
O WATFORD
P WEST LONDON
Q WIMBLEDON
R WOKING
CU
RR
EN
T M
AR
KE
T
PR
OJ
EC
TI
ON
S
A B F J NC G K OD H L PE I M Q R
Take-up (last 4 qrtrs to Q1 2021)
200,749 SQ F T
-52% YE AR–ON–YE AR
A B F J NC G K OD H L PE I M Q R
Potential demand
1,140,7 7 7 SQ F T
A B F J NC G K OD H L PE I M Q R
Supply (as at Q1 2021)
492,864 SQ F T
67% YE AR–ON–YE AR
A B F J NC G K OD H L PE I M Q R
Future supply
2,521,830 SQ F T
A B F J NC G K OD H L PE I M Q R
Prime rent (Q1 2021)
£49.50 7% 5 YE AR CAGR
Key
SUBJECT TO A LE ASE E VENT 2022-2025
DE VELOPMENT PIPELINE (5 YE ARS)
-100% YE AR–ON–YE AR
For market insight please contact: Emma Goodford +44 7831 581 258 [email protected]
B A C K T O C O N T E N T S B A C K T O C O N T E N T S
T H E M 2 5 & S O U T H E A S T O F F I C E M A R K E T R E P O R T
4
K N I G H T F R A N K
5
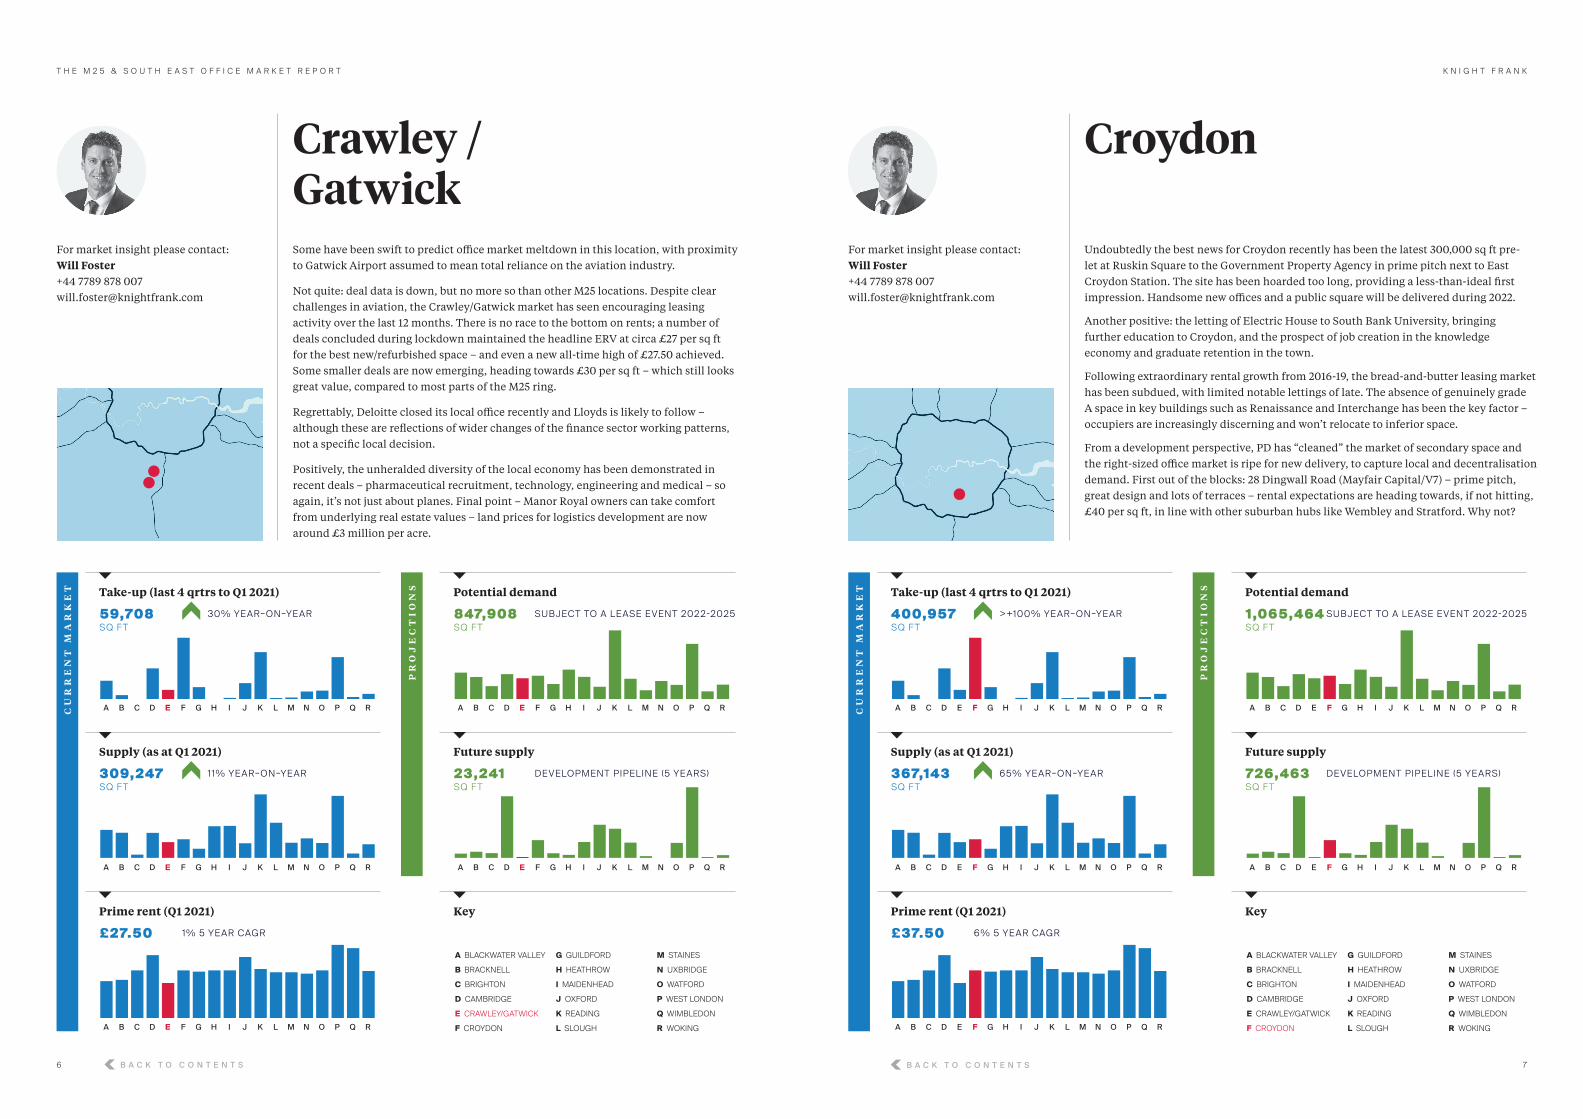
Some have been swift to predict office market meltdown in this location, with proximity to Gatwick Airport assumed to mean total reliance on the aviation industry.
Not quite: deal data is down, but no more so than other M25 locations. Despite clear challenges in aviation, the Crawley/Gatwick market has seen encouraging leasing activity over the last 12 months. There is no race to the bottom on rents; a number of deals concluded during lockdown maintained the headline ERV at circa £27 per sq ft for the best new/refurbished space – and even a new all-time high of £27.50 achieved. Some smaller deals are now emerging, heading towards £30 per sq ft – which still looks great value, compared to most parts of the M25 ring.
Regrettably, Deloitte closed its local office recently and Lloyds is likely to follow – although these are reflections of wider changes of the finance sector working patterns, not a specific local decision.
Positively, the unheralded diversity of the local economy has been demonstrated in recent deals – pharmaceutical recruitment, technology, engineering and medical – so again, it’s not just about planes. Final point – Manor Royal owners can take comfort from underlying real estate values – land prices for logistics development are now around £3 million per acre.
Crawley / Gatwick
A BLACKWATER VALLEY
B BRACKNELL
C BRIGHTON
D CAMBRIDGE
E CRAWLEY/GATWICK
F CROYDON
G GUILDFORD
H HEATHROW
I MAIDENHEAD
J OXFORD
K READING
L SLOUGH
M STAINES
N UXBRIDGE
O WATFORD
P WEST LONDON
Q WIMBLEDON
R WOKING
CU
RR
EN
T M
AR
KE
T
PR
OJ
EC
TI
ON
S
A B F J NC G K OD H L PE I M Q R
Take-up (last 4 qrtrs to Q1 2021)
59,708 SQ F T
A B F J NC G K OD H L PE I M Q R
Potential demand
847,908 SQ F T
A B F J NC G K OD H L PE I M Q R
Supply (as at Q1 2021)
309,247 SQ F T
11% YE AR–ON–YE AR
A B F J NC G K OD H L PE I M Q R
Future supply
23,241 SQ F T
A B F J NC G K OD H L PE I M Q R
Prime rent (Q1 2021)
£27.50 1% 5 YE AR CAGR
Key
For market insight please contact: Will Foster +44 7789 878 007 [email protected]
SUBJECT TO A LE ASE E VENT 2022-2025
DE VELOPMENT PIPELINE (5 YE ARS)
30% YE AR–ON–YE AR
Undoubtedly the best news for Croydon recently has been the latest 300,000 sq ft pre-let at Ruskin Square to the Government Property Agency in prime pitch next to East Croydon Station. The site has been hoarded too long, providing a less-than-ideal first impression. Handsome new offices and a public square will be delivered during 2022.
Another positive: the letting of Electric House to South Bank University, bringing further education to Croydon, and the prospect of job creation in the knowledge economy and graduate retention in the town.
Following extraordinary rental growth from 2016-19, the bread-and-butter leasing market has been subdued, with limited notable lettings of late. The absence of genuinely grade A space in key buildings such as Renaissance and Interchange has been the key factor – occupiers are increasingly discerning and won’t relocate to inferior space.
From a development perspective, PD has “cleaned” the market of secondary space and the right-sized office market is ripe for new delivery, to capture local and decentralisation demand. First out of the blocks: 28 Dingwall Road (Mayfair Capital/V7) – prime pitch, great design and lots of terraces – rental expectations are heading towards, if not hitting, £40 per sq ft, in line with other suburban hubs like Wembley and Stratford. Why not?
Croydon
A BLACKWATER VALLEY
B BRACKNELL
C BRIGHTON
D CAMBRIDGE
E CRAWLEY/GATWICK
F CROYDON
G GUILDFORD
H HEATHROW
I MAIDENHEAD
J OXFORD
K READING
L SLOUGH
M STAINES
N UXBRIDGE
O WATFORD
P WEST LONDON
Q WIMBLEDON
R WOKING
CU
RR
EN
T M
AR
KE
T
PR
OJ
EC
TI
ON
S
A B F J NC G K OD H L PE I M Q R
Take-up (last 4 qrtrs to Q1 2021)
400,957 SQ F T
>+100% YE AR–ON–YE AR
A B F J NC G K OD H L PE I M Q R
Potential demand
1,065,464 SQ F T
A B F J NC G K OD H L PE I M Q R
Supply (as at Q1 2021)
367,143 SQ F T
65% YE AR–ON–YE AR
A B F J NC G K OD H L PE I M Q R
Future supply
726,463 SQ F T
A B F J NC G K OD H L PE I M Q R
Prime rent (Q1 2021)
£37.50 6% 5 YE AR CAGR
Key
For market insight please contact: Will Foster +44 7789 878 007 [email protected]
SUBJECT TO A LE ASE E VENT 2022-2025
DE VELOPMENT PIPELINE (5 YE ARS)
B A C K T O C O N T E N T S B A C K T O C O N T E N T S
T H E M 2 5 & S O U T H E A S T O F F I C E M A R K E T R E P O R T
6
K N I G H T F R A N K
7

Guildford took a blow to its civic pride with the departures of Philips, Honeywell and Sanofi, but bounced back well during 2020 despite Covid-19. Office take-up was the best for several years, at over 100,000 sq ft.
Much of this was sub-10,000 sq ft units, a trend seen across the wider M25 market towards well-presented multi-let properties. Both in and out-of-town markets have fared well, with rents reaching a new record of £36.50 per sq ft for the best floor at 255 High Street. Several other deals reached £36 per sq ft. Finance, legal, gaming, medical and technology remain key active sectors.
The gaming community continues to be the Next Big Thing – business is booming, and although the occupiers are plentiful, most are young businesses, generally 20-100 employees and are focused around the mainline station for amenity provision, plus access to customers and funding partners in London.
Prime office development opportunities remain scarce, with strong residential pressures for unallocated sites and stringent local planning policy. Scarcity is therefore likely to ensure the continuing robustness of the rental picture, especially in the town centre – although many landlords will need to assume a focussed asset-management approach, rather than yesterday’s drier single-let tenancies.
Guildford
A BLACKWATER VALLEY
B BRACKNELL
C BRIGHTON
D CAMBRIDGE
E CRAWLEY/GATWICK
F CROYDON
G GUILDFORD
H HEATHROW
I MAIDENHEAD
J OXFORD
K READING
L SLOUGH
M STAINES
N UXBRIDGE
O WATFORD
P WEST LONDON
Q WIMBLEDON
R WOKING
CU
RR
EN
T M
AR
KE
T
PR
OJ
EC
TI
ON
S
A B F J NC G K OD H L PE I M Q R
Take-up (last 4 qrtrs to Q1 2021)
78,097 SQ F T
A B F J NC G K OD H L PE I M Q R
Potential demand
685,926 SQ F T
A B F J NC G K OD H L PE I M Q R
Supply (as at Q1 2021)
180,709 SQ F T
-26% YE AR–ON–YE AR
A B F J NC G K OD H L PE I M Q R
Future supply
191,000 SQ F T
A B F J NC G K OD H L PE I M Q R
Prime rent (Q1 2021)
£36.50 2% 5 YE AR CAGR
Key
For market insight please contact: Will Foster +44 7789 878 007 [email protected]
SUBJECT TO A LE ASE E VENT 2022-2025
DE VELOPMENT PIPELINE (5 YE ARS)
-11% YE AR–ON–YE AR
The Heathrow office market is now almost solely focused on Stockley Park and Bedfont Lakes. The last five years have seen significant erosion of office stock along the Bath Road to residential and hotel use, other than the specific air-related users.
Stockley Park is already home to big-name brands such as Gilead, IMG, Apple, Canon and Marks & Spencer. With current supply levels reaching a historic high, landlords are having to work harder to deliver a more appealing and differentiated product. The recent delivery of 6 Roundwood Avenue (Kennedy Wilson) and Union (Tritax/Marick) provides the market with this quality of supply.
Rental levels are likely to remain in the high £30s per sq ft until take-up levels return and the existing levels of supply reduce. The post-pandemic office world could lend itself well to Heathrow as businesses seek a green, healthy business park environment with easy travel routes to both central London and Heathrow Airport.
Heathrow
A BLACKWATER VALLEY
B BRACKNELL
C BRIGHTON
D CAMBRIDGE
E CRAWLEY/GATWICK
F CROYDON
G GUILDFORD
H HEATHROW
I MAIDENHEAD
J OXFORD
K READING
L SLOUGH
M STAINES
N UXBRIDGE
O WATFORD
P WEST LONDON
Q WIMBLEDON
R WOKING
CU
RR
EN
T M
AR
KE
T
PR
OJ
EC
TI
ON
S
A B F J NC G K OD H L PE I M Q R
Take-up (last 4 qrtrs to Q1 2021)
- SQ F T
-100% YE AR–ON–YE AR
A B F J NC G K OD H L PE I M Q R
Potential demand
1,346,568 SQ F T
A B F J NC G K OD H L PE I M Q R
Supply (as at Q1 2021)
623,183 SQ F T
19% YE AR–ON–YE AR
A B F J NC G K OD H L PE I M Q R
Future supply
122,490 SQ F T
A B F J NC G K OD H L PE I M Q R
Prime rent (Q1 2021)
£37.50 1% 5 YE AR CAGR
Key
SUBJECT TO A LE ASE E VENT 2022-2025
DE VELOPMENT PIPELINE (5 YE ARS)
For market insight please contact: Roddy Abram
+44 7899 001 028 [email protected]
B A C K T O C O N T E N T S B A C K T O C O N T E N T S
T H E M 2 5 & S O U T H E A S T O F F I C E M A R K E T R E P O R T
8
K N I G H T F R A N K
9

Maidenhead’s town centre is crying out for some TLC. Supply remains tight, so the proposed development of the Nicholson Quarter, The Landing and Star House offer the perfect opportunity for three significant development sites to reinvent the town centre, with the introduction of a mix of uses around a carefully curated public realm.
The arrival of Crossrail to Maidenhead will help to further establish Maidenhead town centre as a direct rival to its more established neighbour in Reading. As a central point in the Thames Valley, with an educated and affluent surrounding population, Maidenhead has historically punched below its weight.
There remains competitive tension between the out-of-town business parks, Vanwall, Foundation and Maidenhead Office Park. The pending relocation of Johnson & Johnson magnifies this and puts focus on which park works the hardest to create the most engaging service offering in addition to the buildings themselves.
Maidenhead
A BLACKWATER VALLEY
B BRACKNELL
C BRIGHTON
D CAMBRIDGE
E CRAWLEY/GATWICK
F CROYDON
G GUILDFORD
H HEATHROW
I MAIDENHEAD
J OXFORD
K READING
L SLOUGH
M STAINES
N UXBRIDGE
O WATFORD
P WEST LONDON
Q WIMBLEDON
R WOKING
CU
RR
EN
T M
AR
KE
T
PR
OJ
EC
TI
ON
S
A B F J NC G K OD H L PE I M Q R
Take-up (last 4 qrtrs to Q1 2021)
7,035 SQ F T
A B F J NC G K OD H L PE I M Q R
Potential demand
1,011,768 SQ F T
A B F J NC G K OD H L PE I M Q R
Supply (as at Q1 2021)
628,628 SQ F T
0% YE AR–ON–YE AR
A B F J NC G K OD H L PE I M Q R
Future supply
651,745 SQ F T
A B F J NC G K OD H L PE I M Q R
Prime rent (Q1 2021)
£37.50 0% 5 YE AR CAGR
Key
SUBJECT TO A LE ASE E VENT 2022-2025
DE VELOPMENT PIPELINE (5 YE ARS)
-91% YE AR–ON–YE AR
City of dreaming spires, Oxford is a cornerstone of the life sciences golden triangle and a market upon which attention has heightened during the Covid-19 pandemic. Already home to four unicorn life sciences companies, the city has become a magnet for fledgling firms and established multinationals alike. Take-up in Oxford was 76% of average levels in 2020, with offices in the edge-of-town science parks fashioned for laboratory use. In turn, this has driven rents across the city to new levels, now in excess of £35 per sq ft for edge-of-town schemes and in the mid £40s per sq ft in the core.
The rental rise is spurring a new speculative development pipeline. Thomas White Oxford, soon to be in conjunction with Stanhope, will bring forward Oxford North with around 1 million sq ft of commercial space focused on life sciences. The next phase of The Oxford Science Park also beckons, beautifully designed by Perkins&Will, and will complement Brookfield Asset Management’s investment at Harwell to refresh this core technology and science scheme. To the north, Begbroke Science Park will have a new focus, with L&G and Bruntwood SciTech investing. As connections improve across the Oxford-Cambridge Arc by train, the city is set for further growth, physically and in rental value.
Oxford
A BLACKWATER VALLEY
B BRACKNELL
C BRIGHTON
D CAMBRIDGE
E CRAWLEY/GATWICK
F CROYDON
G GUILDFORD
H HEATHROW
I MAIDENHEAD
J OXFORD
K READING
L SLOUGH
M STAINES
N UXBRIDGE
O WATFORD
P WEST LONDON
Q WIMBLEDON
R WOKING
CU
RR
EN
T M
AR
KE
T
PR
OJ
EC
TI
ON
S
A B F J NC G K OD H L PE I M Q R
Take-up (last 4 qrtrs to Q1 2021)
103,679 SQ F T
5% YE AR–ON–YE AR
A B F J NC G K OD H L PE I M Q R
Potential demand
561,473 SQ F T
A B F J NC G K OD H L PE I M Q R
Supply (as at Q1 2021)
288,829 SQ F T
50% YE AR–ON–YE AR
A B F J NC G K OD H L PE I M Q R
Future supply
1,356,439 SQ F T
A B F J NC G K OD H L PE I M Q R
Prime rent (Q1 2021)
£48.00 12% 5 YE AR CAGR
Key
SUBJECT TO A LE ASE E VENT 2022-2025
DE VELOPMENT PIPELINE (5 YE ARS)
For market insight please contact: Emma Goodford +44 7831 581 258 [email protected]
For market insight please contact: Roddy Abram
+44 7899 001 028 [email protected]
B A C K T O C O N T E N T S B A C K T O C O N T E N T S
T H E M 2 5 & S O U T H E A S T O F F I C E M A R K E T R E P O R T
1 0
K N I G H T F R A N K
1 1

Reading has once again proved its resilience. Occupiers continue to see the abundance of amenities in the centre and out-of-town business parks, excellent connectivity and higher education providing a wealth of talent. This resilience continues to encourage landlords to invest in their assets and create the highest-quality office space tailored to occupier demand. We are not only talking about refurbishment projects of existing stock but also buildings that have been upgraded – we’re talking building apps that can analyse air quality, Dyson hairdryers in changing rooms, and touch-free access systems.
Further positive affirmation of the confidence in the Reading office market arose earlier this year, with Lincoln MGT confirming that it will be speculatively developing the first phase of Station Hill, including 276,000 sq ft of offices.
2020 was a robust year for the out-of-town Reading market, with three-quarters of overall take-up featuring in this sub-market, spurring Baumont with V7 to buy Buildings 4 and 5 at TVP for speculative refurbishment. We have already seen a continuation of this trend, with the Three UK deal completing in March this year, acquiring one of the two new office developments at Green Park – 117,000 sq ft at 450 Longwater Avenue. The town continues to act as a magnet for tech occupiers, with over 77% of the take-up last year being within the TMT sector.
Reading
A BLACKWATER VALLEY
B BRACKNELL
C BRIGHTON
D CAMBRIDGE
E CRAWLEY/GATWICK
F CROYDON
G GUILDFORD
H HEATHROW
I MAIDENHEAD
J OXFORD
K READING
L SLOUGH
M STAINES
N UXBRIDGE
O WATFORD
P WEST LONDON
Q WIMBLEDON
R WOKING
CU
RR
EN
T M
AR
KE
T
PR
OJ
EC
TI
ON
S
A B F J NC G K OD H L PE I M Q R
Take-up (last 4 qrtrs to Q1 2021)
307,102 SQ F T
A B F J NC G K OD H L PE I M Q R
Potential demand
3,146,572 SQ F T
A B F J NC G K OD H L PE I M Q R
Supply (as at Q1 2021)
1,249,279 SQ F T
1% YE AR–ON–YE AR
A B F J NC G K OD H L PE I M Q R
Future supply
1,193,756 SQ F T
A B F J NC G K OD H L PE I M Q R
Prime rent (Q1 2021)
£38.50 1% 5 YE AR CAGR
Key
SUBJECT TO A LE ASE E VENT 2022-2025
DE VELOPMENT PIPELINE (5 YE ARS)
22% YE AR–ON–YE AR
The Slough office market continues to slowly develop within the town centre and more specifically around the train station. However, following the success of The Porter Building’s letting campaign with Mattel and Fiserv as new entries to the Slough market, annual take-up has slowed.
The planned development across four key town centre development sites including The Future Works, SL1, North West Quadrant and the Queensmere Observatory Shopping Centre is desperately needed as part of Slough’s regeneration. An enhanced retail and food and beverage offering will complement the proposed office and residential development planned.
The Bath Road has seen a significant number of buildings converted to residential on the southern side of the road. The announcement that UCB has acquired Eli Lilly’s old HQ in Windlesham further shines the light on the future of the Slough Trading Estate as an office location. Buoyant industrial and data centre sectors would appear to be the likely direction of travel.
Slough
A BLACKWATER VALLEY
B BRACKNELL
C BRIGHTON
D CAMBRIDGE
E CRAWLEY/GATWICK
F CROYDON
G GUILDFORD
H HEATHROW
I MAIDENHEAD
J OXFORD
K READING
L SLOUGH
M STAINES
N UXBRIDGE
O WATFORD
P WEST LONDON
Q WIMBLEDON
R WOKING
CU
RR
EN
T M
AR
KE
T
PR
OJ
EC
TI
ON
S
A B F J NC G K OD H L PE I M Q R
Take-up (last 4 qrtrs to Q1 2021)
6,707 SQ F T
-85% YE AR–ON–YE AR
A B F J NC G K OD H L PE I M Q R
Potential demand
930,092 SQ F T
A B F J NC G K OD H L PE I M Q R
Supply (as at Q1 2021)
691,650 SQ F T
26% YE AR–ON–YE AR
A B F J NC G K OD H L PE I M Q R
Future supply
622,608 SQ F T
A B F J NC G K OD H L PE I M Q R
Prime rent (Q1 2021)
£36.00 2% 5 YE AR CAGR
Key
SUBJECT TO A LE ASE E VENT 2022-2025
DE VELOPMENT PIPELINE (5 YE ARS)
For market insight please contact: Andy Nixon
+44 7973 924 947 [email protected]
For market insight please contact: Roddy Abram
+44 7899 001 028 [email protected]
B A C K T O C O N T E N T S B A C K T O C O N T E N T S
T H E M 2 5 & S O U T H E A S T O F F I C E M A R K E T R E P O R T
1 2
K N I G H T F R A N K
1 3

Staines is often considered “Heathrow’s town centre” and many of the major occupiers are international corporations who use the airport frequently – ServiceNow, Wood PLC, Gartner Group, Future Electronics and VMware. These businesses form a glass and steel US-style “strip”, The Causeway, leading from Staines Bridge to the M25. Gartner has recently signed a pre-let of 50,000 sq ft of growth space in a new 110,000 sq ft property, which completes shortly.
Grade A office product in the town is not at scarcity level, but rents have continued to creep upwards regardless and are now at circa £36 per sq ft for best space. The town centre is solid rather than glamorous but offers the shops and amenities that office staff seek.
Residential product is definitely improving as well; London Square and Berkeley’s Eden Grove are major apartment developments on large, unwieldy former office sites, adding to the sense of a balanced town centre environment.
Some concerns remain that when the Elizabeth Line finally, fully opens, Staines may find itself adrift of the main public transport route in the Thames Valley, but a general availability of parking and an M25 intersection close by are giving Staines a degree of resilience.
Staines-Upon-Thames
A BLACKWATER VALLEY
B BRACKNELL
C BRIGHTON
D CAMBRIDGE
E CRAWLEY/GATWICK
F CROYDON
G GUILDFORD
H HEATHROW
I MAIDENHEAD
J OXFORD
K READING
L SLOUGH
M STAINES
N UXBRIDGE
O WATFORD
P WEST LONDON
Q WIMBLEDON
R WOKING
CU
RR
EN
T M
AR
KE
T
PR
OJ
EC
TI
ON
S
A B F J NC G K OD H L PE I M Q R
Take-up (last 4 qrtrs to Q1 2021)
9,678 SQ F T
A B F J NC G K OD H L PE I M Q R
Potential demand
402,856 SQ F T
A B F J NC G K OD H L PE I M Q R
Supply (as at Q1 2021)
297,812 SQ F T
7 7% YE AR–ON–YE AR
A B F J NC G K OD H L PE I M Q R
Future supply
74,595 SQ F T
A B F J NC G K OD H L PE I M Q R
Prime rent (Q1 2021)
£36.00 1% 5 YE AR CAGR
Key
SUBJECT TO A LE ASE E VENT 2022-2025
DE VELOPMENT PIPELINE (5 YE ARS)
-91% YE AR–ON–YE AR
Covid-19 has fast-tracked a lot of emerging trends across the south east, including the need to offer increased on-site amenities/facilities to occupiers. This has been increasingly evident in the Uxbridge market. Stock levels are continuing to reduce following the conversion of secondary offices into residential with further anticipated development being touted across the town. This has left a limited amount of core good-quality office stock. Nonetheless, with the reduced levels of occupier demand, landlords with stock in the core are having to be competitive on terms to secure lettings with both headline rents marginally reducing and rent-free incentives moving out. Meanwhile, on The Business Park headline rents are holding at a mid £30’s level as occupiers see the value of the improved park amenity and wellness offer.
A number of occupiers have cemented their future in the town with recent regear activity including Mondelez in Uxbridge Business Park and even a few occupiers expanding their office footprint including Regeneron at The Charter Building. This illustrates the value existing occupiers are placing on the town.
Rental levels will continue to show disparity in and out of town with the core remaining above £30 per sq ft, down from a mid-£30s rent at its peak, but the edge of town is up to £5 higher. There is no expectation that headline rents will dip any further – however, the market terms being offered are attracting occupiers to consider Uxbridge as a location.
Uxbridge
A BLACKWATER VALLEY
B BRACKNELL
C BRIGHTON
D CAMBRIDGE
E CRAWLEY/GATWICK
F CROYDON
G GUILDFORD
H HEATHROW
I MAIDENHEAD
J OXFORD
K READING
L SLOUGH
M STAINES
N UXBRIDGE
O WATFORD
P WEST LONDON
Q WIMBLEDON
R WOKING
CU
RR
EN
T M
AR
KE
T
PR
OJ
EC
TI
ON
S
A B F J NC G K OD H L PE I M Q R
Take-up (last 4 qrtrs to Q1 2021)
49,038 SQ F T
-59% YE AR–ON–YE AR
A B F J NC G K OD H L PE I M Q R
Potential demand
824,630 SQ F T
A B F J NC G K OD H L PE I M Q R
Supply (as at Q1 2021)
382,791 SQ F T
-3% YE AR–ON–YE AR
A B F J NC G K OD H L PE I M Q R
Future supply
- SQ F T
A B F J NC G K OD H L PE I M Q R
Prime rent (Q1 2021)
£35.00 -2% 5 YE AR CAGR
Key
SUBJECT TO A LE ASE E VENT 2022-2025
DE VELOPMENT PIPELINE (5 YE ARS)
For market insight please contact: Will Foster +44 7789 878 007 [email protected]
For market insight please contact: Andy Nixon
+44 7973 924 947 [email protected]
B A C K T O C O N T E N T S B A C K T O C O N T E N T S
T H E M 2 5 & S O U T H E A S T O F F I C E M A R K E T R E P O R T
1 4
K N I G H T F R A N K
1 5

Traditionally, the Watford office market has been all about Clarendon Road – shopping one end, mainline station the other. This hasn’t changed, in that rental growth has mainly been observed here, with the fall-off beyond Clarendon Road being significant.
Rents in the prime pitch are now firmly late-£30s and older buildings are continually being upgraded. Amongst the notable current activity, Enterprise Finance are reportedly under offer at Hyde, Clarendon Road, moving from Borehamwood, a more secondary office location, reflecting Watford’s status as the primary office critical mass in Hertfordshire.
Out of town, Croxley Park has been delivering some excellent buildings and the results have followed: the latest new speculative product of 85,000 sq ft is allegedly under offer at £37.50 per sq ft on a long lease, prior to completion.
Watford
A BLACKWATER VALLEY
B BRACKNELL
C BRIGHTON
D CAMBRIDGE
E CRAWLEY/GATWICK
F CROYDON
G GUILDFORD
H HEATHROW
I MAIDENHEAD
J OXFORD
K READING
L SLOUGH
M STAINES
N UXBRIDGE
O WATFORD
P WEST LONDON
Q WIMBLEDON
R WOKING
CU
RR
EN
T M
AR
KE
T
PR
OJ
EC
TI
ON
S
A B F J NC G K OD H L PE I M Q R
Take-up (last 4 qrtrs to Q1 2021)
54,399 SQ F T
A B F J NC G K OD H L PE I M Q R
Potential demand
646,17 7 SQ F T
A B F J NC G K OD H L PE I M Q R
Supply (as at Q1 2021)
292,372 SQ F T
85% YE AR–ON–YE AR
A B F J NC G K OD H L PE I M Q R
Future supply
613,331 SQ F T
A B F J NC G K OD H L PE I M Q R
Prime rent (Q1 2021)
£37.50 6% 5 YE AR CAGR
Key
SUBJECT TO A LE ASE E VENT 2022-2025
DE VELOPMENT PIPELINE (5 YE ARS)
-11% YE AR–ON–YE AR
The west London markets have continued to benefit from the ever-expanding London markets. Occupiers searching for space that can offer large open plan floorplates at a more affordable occupational cost has created more activity in sub-market movement.
White City stands out from the pack as a thriving commercial district with a particular focus from the retail and life sciences sectors. Recent pre-lets from L’Oréal and PVH Group further backs up the popularity of the area and has also amplified the rental tone.
Hammersmith has felt the effects of the up-and-coming star of White City over the last three years but still holds its own. A strong transport hub and an improving amenity offering will cement Hammersmith performance as a recognised commercial location going forward.
Chiswick Park continues to offer a highly sought-after urban business park environment, with the ‘Enjoy-Work’ service going from strength to strength. Ealing has historically lagged behind the prime west London markets. However, the refurbishment of 54 The Broadway and the letting of the whole building at £52.50 per sq ft proves Ealing has the potential to compete with the other west London markets – and soon it will have Crossrail.
West London
A BLACKWATER VALLEY
B BRACKNELL
C BRIGHTON
D CAMBRIDGE
E CRAWLEY/GATWICK
F CROYDON
G GUILDFORD
H HEATHROW
I MAIDENHEAD
J OXFORD
K READING
L SLOUGH
M STAINES
N UXBRIDGE
O WATFORD
P WEST LONDON
Q WIMBLEDON
R WOKING
CU
RR
EN
T M
AR
KE
T
PR
OJ
EC
TI
ON
S
A B F J NC G K OD H L PE I M Q R
Take-up (last 4 qrtrs to Q1 2021)
273,889 SQ F T
-49% YE AR–ON–YE AR
A B F J NC G K OD H L PE I M Q R
Potential demand
2,526,152 SQ F T
A B F J NC G K OD H L PE I M Q R
Supply (as at Q1 2021)
1,219,946 SQ F T
12% YE AR–ON–YE AR
A B F J NC G K OD H L PE I M Q R
Future supply
2,885,298 SQ F T
A B F J NC G K OD H L PE I M Q R
Prime rent (Q1 2021)
£57.50 1% 5 YE AR CAGR
Key
SUBJECT TO A LE ASE E VENT 2022-2025
DE VELOPMENT PIPELINE (5 YE ARS)
For market insight please contact: Roddy Abram
+44 7899 001 028 [email protected]
For market insight please contact: Will Foster +44 7789 878 007 [email protected]
B A C K T O C O N T E N T S B A C K T O C O N T E N T S
T H E M 2 5 & S O U T H E A S T O F F I C E M A R K E T R E P O R T
1 6
K N I G H T F R A N K
1 7

Wimbledon continues to deliver consistent, strong rental growth from its relatively compact office stock, which is firmly focussed around the mainline station in a handful of sizeable buildings.
With high-value residential on all sides, the commercial core is constrained. Merton Council is openly inviting applications for commercial towers – if anyone was bold enough to deliver one. In the clever refurbishments undertaken, rents have reached £55 per sq ft already, with space in legals set to go higher. Wimbledon is therefore now up there with Hammersmith and ahead of Richmond, the usual comparison town.
Accessibility and amenity have always been Wimbledon’s key strengths, rather than the “tennis factor”. The proof is the youthful working population at Unibet, Coty and DomGen who commute in from across south and west London. Although Centre Court Shopping has been sold and the Debenhams is gone, The Broadway remains a very vibrant A1 and A3 retail pitch, bringing the future prospect of a shrunken shopping centre.
Crossrail 2 remains a distraction on the horizon and should remain as such – the enormous disruption and cost seem difficult to justify, when the town is already one of the best connected in suburban London – offering rail, tube and Tramlink.
Wimbledon
A BLACKWATER VALLEY
B BRACKNELL
C BRIGHTON
D CAMBRIDGE
E CRAWLEY/GATWICK
F CROYDON
G GUILDFORD
H HEATHROW
I MAIDENHEAD
J OXFORD
K READING
L SLOUGH
M STAINES
N UXBRIDGE
O WATFORD
P WEST LONDON
Q WIMBLEDON
R WOKING
CU
RR
EN
T M
AR
KE
T
PR
OJ
EC
TI
ON
S
A B F J NC G K OD H L PE I M Q R
Take-up (last 4 qrtrs to Q1 2021)
12,626 SQ F T
A B F J NC G K OD H L PE I M Q R
Potential demand
351,704 SQ F T
A B F J NC G K OD H L PE I M Q R
Supply (as at Q1 2021)
65,830 SQ F T
87% YE AR–ON–YE AR
A B F J NC G K OD H L PE I M Q R
Future supply
26,000 SQ F T
A B F J NC G K OD H L PE I M Q R
Prime rent (Q1 2021)
£55.00 3% 5 YE AR CAGR
Key
SUBJECT TO A LE ASE E VENT 2022-2025
DE VELOPMENT PIPELINE (5 YE ARS)
-74% YE AR–ON–YE AR
For market insight please contact: Will Foster +44 7789 878 007 [email protected]
Woking has seen significant public and private sector development in recent years. The public realm and retail development has been key in underpinning the amenity piece required for the new office developments to achieve record headline rents. Recent key office lettings have firmly established Woking as an investment competitor to Guildford which had traditionally been the more glamorous (and expensive) market.
Woking Borough Council has led the charge on regeneration projects such as the circa £700 million Victoria Square development which will see two 32/34 storey residential towers, a 23 storey Hilton Hotel with sky bar, 125,000 sq ft of commercial space including a new M&S completed this year.
Asahi’s pre-let of Brook House at £36 per sq ft is demonstrative of a local lease event moving to best quality product, while Space has succeeded in enticing Astellas Pharma from Chertsey, proving in-migration is possible. This success is tempered against McLaren recently putting around 20,000 sq ft on the market at their recently acquired Victoria Gate scheme, indicating local business putting “grey space” on the market. Woking is becoming a two tier market to a degree with transactional evidence suggesting at least £10 per sq ft between prime and secondary rents.
Woking
A BLACKWATER VALLEY
B BRACKNELL
C BRIGHTON
D CAMBRIDGE
E CRAWLEY/GATWICK
F CROYDON
G GUILDFORD
H HEATHROW
I MAIDENHEAD
J OXFORD
K READING
L SLOUGH
M STAINES
N UXBRIDGE
O WATFORD
P WEST LONDON
Q WIMBLEDON
R WOKING
CU
RR
EN
T M
AR
KE
T
PR
OJ
EC
TI
ON
S
A B F J NC G K OD H L PE I M Q R
Take-up (last 4 qrtrs to Q1 2021)
33,874 SQ F T
-52% YE AR–ON–YE AR
A B F J NC G K OD H L PE I M Q R
Potential demand
656,476 SQ F T
A B F J NC G K OD H L PE I M Q R
Supply (as at Q1 2021)
268,229 SQ F T
21% YE AR–ON–YE AR
A B F J NC G K OD H L PE I M Q R
Future supply
111,161 SQ F T
A B F J NC G K OD H L PE I M Q R
Prime rent (Q1 2021)
£37.00 4% 5 YE AR CAGR
Key
SUBJECT TO A LE ASE E VENT 2022-2025
DE VELOPMENT PIPELINE (5 YE ARS)
For market insight please contact: Jack Riley+44 7867 002 [email protected]
B A C K T O C O N T E N T S B A C K T O C O N T E N T S
T H E M 2 5 & S O U T H E A S T O F F I C E M A R K E T R E P O R T
1 8
K N I G H T F R A N K
1 9

M25 innovation index: top 15 centres
Sources: Knight Frank, Times Higher Education, CFE Business Startup Index, World Report, Oxford Economics, grid.ac, ONS, Meetups
CA
MB
RID
GE
OX
FOR
D
BR
IGH
TO
N
RE
AD
ING
GU
ILD
FOR
D
RIC
HM
ON
D
MIL
TO
N K
EY
NE
S
UX
BR
IDG
E
HA
TFI
ELD
KIN
GS
TO
N
TH
EA
LE
TW
ICK
EN
HA
M
BA
SIN
GS
TO
KE
SLO
UG
H
MA
IDE
NH
EA
D
1 2 3 4 5 6 7 8 9 10 1 1 12 13 14 15
Up-and-coming
16.ST ALBANS 17.BROMLEY 18.BRENTFORD 19.FARNBOROUGH 20.HIGH WYCOMBE
M25 connectivity index: top 15 centres
213 4 5 6 7 8 9 10 11 12 13 14 15
RIC
HM
ON
D
WIM
BLE
DO
N
BR
OM
LEY
BR
EN
TFO
RD
EA
LIN
G
KIN
GS
TO
N
BO
RE
HA
MW
OO
D
TW
ICK
EN
HA
M
HA
MM
ER
SM
ITH
ST
AIN
ES
WA
TFO
RD
SLO
UG
H
UX
BR
IDG
E
CR
OY
DO
N
Sources: Knight Frank, ,Ofcom, ONS, Signal Checker, DC Byte, CACI
CH
ISW
ICK
2 0
T H E M 2 5 & S O U T H E A S T O F F I C E M A R K E T R E P O R T
Connectivity and Innovation
Connectivity
Covid-19 has forced organisations across the spectrum to re-evaluate both near and long-term business strategy. The pandemic has provided first-hand evidence of the importance of a seamless interaction between people and technology.
To understand the strengths of this combination across the key markets of the south east, we examined 17 metrics across 48 locations, generating over 800 data points. Each were equally weighted to explore and understand connectivity attributes, both digital and physical. Combining both components provides a rounded assessment of the connectivity capabilities of a location. You can find out more at www.knightfrank.com/M25-offices.
Innovation
Innovation has long since been regarded as an essential driver of long-term economic growth and forms the aspiration of many national or local authority. Innovation is really quite simple: knowledge drives innovation, innovation drives productivity, and productivity drives economic growth.
Expanding on our Knight Frank Active Capital research, the M25 and south east Innovation Index uniquely examines statistically significant drivers of innovation in relation to the south east region. The index combines 34 variables and 1,500 innovation data points across 43 locations to identify Innovation-led centres, thus creating the south east’s first innovation index. You can find out more at www.knightfrank.com/M25-offices.
T H E M 2 5 & S O U T H E A S T O F F I C E M A R K E T R E P O R T
2 0
K N I G H T F R A N K
2 1
T H E M 2 5 & S O U T H E A S T O F F I C E M A R K E T R E P O R T
2 1
K N I G H T F R A N K

The M25 & South East Office Market Report
Knight Frank Commercial Research provides strategic advice, consultancy services and forecasting to a wide range of clients worldwide including developers, investors, funding organisations, corporate institutions and the public sector. All our clients recognise the need for expert independent advice customised to their specific needs. Important Notice: This general document is provided strictly on the basis that you cannot rely on its contents and Knight Frank LLP (and our affiliates, members and employees) will have no responsibility or liability whatsoever in relation to the accuracy, reliability, currency, completeness or otherwise of its contents or as to any assumption made or as to any errors or for any loss or damage resulting from any use of or reference to the contents. You must take specific independent advice in each case. It is for general outline interest only and will contain selective information. It does not purport to be definitive or complete. Its contents will not necessarily be within the knowledge or represent the opinion of Knight Frank LLP. Knight Frank LLP is a property consultant regulated by the Royal Institution of Chartered Surveyors and only provides services relating to real estate, not financial services. It was prepared during the period of April 2021. It uses certain data available then, and reflects views of market sentiment at that time. Details or anticipated details may be provisional or have been estimated or otherwise provided by others without verification and may not be up to date when you read them. Computer-generated and other sample images or plans may only be broadly indicative and their subject matter may change. Images and photographs may show only certain parts of any property as they appeared at the time they were taken or as they were projected. Any forecasts or projections of future performance are inherently uncertain and liable to different outcomes or changes caused by circumstances whether of a political, economic, social or property market nature. Prices indicated in any currencies are usually based on a local figure provided to us and/or on a rate of exchange quoted on a selected date and may be rounded up or down. Any price indicated cannot be relied upon because the source or any relevant rate of exchange may not be accurate or up to date. VAT and other taxes may be payable in addition to any price in respect of any property according to the law applicable. © Knight Frank LLP 2021. All rights reserved. No part of this presentation may be copied, disclosed or transmitted in any form or by any means, electronic or otherwise, without prior written permission from Knight Frank LLP for the specific form and content within which it appears. Each of the provisions set out in this notice shall only apply to the extent that any applicable laws permit. Knight Frank LLP is a limited liability partnership registered in England with registered number OC305934 and trades as Knight Frank. Our registered office is 55 Baker Street, London W1U 8AN, where you may look at a list of members’ names. Any person described as a partner is a member, consultant or employee of Knight Frank LLP, not a partner in a partnership.
TECHNICAL NOTE
- The figures in this report relate to the availability of built, up-and-ready office/B1 accommodation within the M25 market. Vacant premises and leased space which is being actively marketed are included.
- All floorspace figures are given on a net internal area basis (as defined by the RICS).
- A minimum 10,000 sq f t (net) cut-off has been employed throughout. Major and minor refurbishment have been treated as new and second-hand respectively. Data is presented on a centre and quadrant basis. Classification by centre relates to the locational details contained within the marketing material for available properties. Classification in this manner is clearly somewhat arbitrary.
- The development pipeline is a combined total of speculative schemes that are either under construction, proposed and expected to start within the next 24 months, and those with potential to start within five years.
- Second-hand floorspace has been sub-divided into A and B grade accommodation, reflecting high and low quality respectively. Whilst subjective, this categorisation is based on an assessment of each property’s age, specification, location and overall attractiveness.
- Pre-let = The letting of proposed schemes not yet under construction and those let during the construction process.
- Headline rent assumes a new building let on a 10-year lease.
- Headline rent assumes a transaction over 10,000 sq f t new office space.
- Rents are stated per sq f t per annum NIA.
- All data presented is correct as at 31st March 2021.
Further M25 and South East Office
Market Research available at:
knightfrank.com/M25-offices