key issues for seawater desalination in california: energy and
TRANSCRIPT


Key Issues for Seawater Desalination in California
Energy and Greenhouse Gas Emissions
May 2013
Authors: Heather Cooley and Matthew Heberger
The full report is available online at
www.pacinst.org/reports/desalination_2013/energy
©Copyright 2013, All Rights Reserved
ISBN: 1-893790-49-5 ISBN 13: 978-1-893790-49-0
Pacific Institute
654 13th Street, Preservation Park
Oakland, California 94612
www.pacinst.org
Phone: 510.251.1600
Facsimile: 510.251.2206
Designers: Nancy Ross and Paula Luu
Cover photo: iStockphoto.com, © Trudy Karl

Key Issues for Seawater Desalination in California: Energy and Greenhouse Gas Emissions | i
About the Pacific Institute
The Pacific Institute is one of the world’s leading nonprofit research and policy organizations working to create a
healthier planet and sustainable communities. Based in Oakland, California, we conduct interdisciplinary
research and partner with stakeholders to produce solutions that advance environmental protection, economic
development, and social equity – in California, nationally, and internationally. We work to change policy and find
real-world solutions to problems like water shortages, habitat destruction, climate change, and environmental
injustice. Since our founding in 1987, the Pacific Institute has become a locus for independent, innovative
thinking that cuts across traditional areas of study, helping us make connections and bring opposing groups
together. The result is effective, actionable solutions addressing issues in the fields of freshwater resources,
climate change, environmental justice, and globalization. More information about the Institute and our staff,
directors, funders, and programs can be found at www.pacinst.org.

Key Issues for Seawater Desalination in California: Energy and Greenhouse Gas Emissions | ii
About the Authors
Heather Cooley
Heather Cooley is the co-director of the Pacific Institute Water Program. She conducts and oversees research on
an array of water issues, such as the connections between water and energy, sustainable water use and
management, and the hydrologic impacts of climate change. Ms. Cooley has authored numerous scientific
papers and co-authored five books, including The World’s Water, A 21st Century U.S. Water Policy, and The
Water-Energy Nexus in the American West. Ms. Cooley is a recipient of the Environmental Protection Agency’s
Award for Outstanding Achievement and serves on the Board of Directors of the California Urban Water
Conservation Council. She also serves on the California Commercial, Industrial, and Institutional Task Force. Ms.
Cooley received a B.S. in Molecular Environmental Biology and an M.S. in Energy and Resources from the
University of California at Berkeley.
Matthew Heberger
Matthew Heberger is a research associate with the Pacific Institute. He spent 12 years working on water issues as
a consulting engineer, in water policy in Washington D.C., and as a hygiene and sanitation educator in West
Africa. Mr. Heberger is currently researching issues related to water supply and quality, the nexus between water
and energy, and impacts of climate change on water resources. He holds a B.S. in Agricultural and Biological
Engineering from Cornell University and an M.S. in Water Resources Engineering from Tufts University in Boston
and is a licensed professional engineer.

Key Issues for Seawater Desalination in California: Energy and Greenhouse Gas Emissions | iii
Acknowledgements
This work was generously supported by The David and Lucile Packard Foundation. We thank them for their
support. We would also like to thank all those who have offered ideas, data, information, and comments on the
report, including (in alphabetical order) Debbie Cook, Kristina Donnelly, Max Gomberg, and Robert Wilkinson.
And, last but not least, we would like to thank Nancy Ross and Paula Luu of the Pacific Institute for their help with
editing, formatting, and producing the report. All errors and omissions are, of course, our own.

Key Issues for Seawater Desalination in California: Energy and Greenhouse Gas Emissions | iv
Table of Contents
Executive Summary 1
Introduction 4
Energy Requirements of Seawater Desalination 4
Energy Use Comparisons 6
Energy Reduction Strategies 8
Energy Use and Cost 11
Energy Use and Greenhouse Gas Emissions 15
Background on Carbon Emissions in California 15
Potential Emissions from Desalination 17
Regulatory Framework 19
The California Environmental Quality Act 19
California Coastal Commission 21
Integrated Regional Water Management Planning Guidelines 21
Greenhouse Gas Emissions Reduction Strategies 22
Renewable Energy Sources 22
Carbon Offsets 24
Going Carbon Neutral in California? 28
Conclusions 29
References 32

Key Issues for Seawater Desalination in California: Energy and Greenhouse Gas Emissions | v
Tables and Figures
Figure 1. Energy Use for Various Elements of the Desalination Process 6
Figure 2. Comparison of the Energy Intensity of California Water Supplies 7
Figure 3. Time Series (above) and Scatterplot (below) of PG&E’s Retail Energy Rates Versus California’s Two-Year
Precipitation Totals for the Two Previous Years, 1982–2010 13
Figure 4. California’s Projected Greenhouse Gas Emissions in 2020 and Planned Reductions 16
Figure 5. Global Renewable Energy Seawater Desalination Plants by Energy Source, 2010 23
Table 1. Energy Requirements (kWh/MG) for Seawater Desalination Plants Using Reverse Osmosis 5
Table 2. Estimated Water-related Electricity and Natural Gas Consumption in 2001 6
Table 3. Correlation between Precipitation and Retail Energy Price for Six Major California Utilities 12
Table 4. Planned Greenhouse Gas Emissions Reductions by California’s Water Sector 17
Table 5. Theoretical Emissions Associated with Proposed Desalination Plants in California 18

Key Issues for Seawater Desalination in California: Energy and Greenhouse Gas Emissions | 1
Executive Summary
In June 2006, the Pacific Institute released
Desalination, With a Grain of Salt, an assessment
of the advantages and disadvantages of seawater
desalination for California. At that time, there
were 21 active seawater desalination proposals
along the California coast. Since then, only one
project, a small plant in Sand City, has been
permitted and built. A second project, in Carlsbad,
recently secured financing and is now under
construction. Interest in seawater desalination,
however, remains high in California, and many
agencies are conducting technical and
environmental studies and pilot projects to
determine whether to develop full-scale facilities.
Beginning in 2011, the Pacific Institute initiated a
new research project on seawater desalination. As
part of that effort, we conducted some 25 one-on-
one interviews with industry experts, water
agencies, community groups, and regulatory
agencies to identify some of the key outstanding
issues for seawater desalination projects in
California. Throughout 2012 and 2013, we are
producing a series of research reports that address
these issues. The first report, released in July
2012, provided an update of the proposed seawater
desalination projects along the coast of California.
The second report, released in November 2012,
discusses the costs, financing, and risks related to
desalination projects.
In this report, the third in the series, we describe
the energy requirements of seawater desalination
and the associated greenhouse gas emissions. We
also evaluate the impact of short-term and long-
term energy price variability on the cost of
desalinated water. Finally, we describe the current
regulations on greenhouse gas emissions in
California and identify approaches for mitigating
emissions, including strategies used by those who
have recently proposed or built new plants in
California and Australia. Future reports will
evaluate the impacts of seawater desalination on
marine life and coastal ecosystems and discuss the
permitting process and regulations associated with
building new plants in California.
Energy Requirements for Seawater
Desalination
Removing the salt from seawater is an energy-
intensive process and consumes more energy per
gallon than most other water supply and treatment
options. On average, desalinations plants use about
15,000 kWh per million gallons of water produced
(kWh/MG), or 4.0 kWh per cubic meter (kWh/m3).
We note that these estimates refer to the rated
energy use, i.e., the energy required under a
standard, fixed set of conditions. The actual
energy use may be higher, as actual operating
conditions are often not ideal.
The overall energy implications of a seawater
desalination project will depend on whether the
water produced replaces an existing water supply
or provides a new source of water for growth and
development. If water from a desalination plant
replaces an existing supply, then the additional
energy requirements are simply the difference
between the energy use of the seawater
desalination plant and those of the existing supply.
Producing a new source of water, however,
increases the total amount of water that must be
delivered, used, and disposed of. Thus, the overall
energy implications of the desalination project
include the energy requirements for the

Key Issues for Seawater Desalination in California: Energy and Greenhouse Gas Emissions | 2
desalination plant plus the energy required to
deliver, use, and dispose of the water that is
produced. We note that conservation and
efficiency, by contrast, can help meet the
anticipated needs associated with growth by
reducing total water demand while simultaneously
maintaining or even reducing total energy use.
Energy requirements for desalination have declined
dramatically over the past 40 years due to a variety
of technological advances, and desalination
designers and researchers are continuously seeking
ways to further reduce energy consumption.
Despite the potential for future energy use
reductions, however, there is a theoretical
minimum energy requirement beyond which there
are no opportunities for further reductions.
Desalination plants are currently operating at 3-4
times the theoretical minimum energy
requirements, and despite hope and efforts to
reduce the energy cost of desalination, there do
not appear to be significant reductions in energy
use on the near-term horizon.
Energy Use and Cost
The high energy requirements of seawater
desalination raise several concerns, including
sensitivity to energy price variability. Energy is the
largest single variable cost for a desalination plant,
varying from one-third to more than one-half the
cost of produced water (Chaudhry 2003). As result,
desalination creates or increases the water
supplier’s exposure to energy price variability. In
California, and in other regions dependent on
hydropower, electricity prices tend to rise during
droughts, when runoff, and thus power production,
is constrained and electricity demands are high.
Additionally, electricity prices in California are
projected to rise by nearly 27% between 2008 and
2020 (in inflation-adjusted dollars) to maintain and
replace aging transmission and distribution
infrastructure, install advanced metering
infrastructure, comply with once-through cooling
regulations, meet new demand growth, and
increase renewable energy production (CPUC
2009). Rising energy prices will affect the price of
all water sources, although they will have a greater
impact on those that are the most energy
intensive.
Energy Use and Greenhouse Gas
Emissions
The high energy requirements of seawater
desalination also raise concerns about greenhouse
gas emissions. In 2006, California lawmakers passed
the Global Warming Solutions Act, or Assembly Bill
32 (AB 32), which requires the state to reduce
greenhouse gas emissions to 1990 levels by 2020.
Thus, the state has committed itself to a program
of steadily reducing its greenhouse gas emissions in
both the short- and long-term, which includes
cutting current emissions and preventing future
emissions associated with growth. Action and
awareness has, until recently, been uneven and
slow to spread to the local level. While the state
has directed local and regional water managers to
begin considering emissions reductions when
selecting water projects, they were not subject to
mandatory cuts during the state’s first round of
emissions reductions. As the state moves forward
with its plans to cut carbon emissions further,
however, every sector of the economy is likely to
come under increased scrutiny by regulators.
Desalination – through increased energy use – can
cause an increase in greenhouse gas emissions,
further contributing to the root cause of climate
change and thus running counter to the state’s
greenhouse gas reduction goals.
While there is “no clear-cut regulatory standard
related to energy use and greenhouse gas
emissions,” (Pankratz 2012) there are a variety of
state programs, policies, and agencies that must be
considered when developing a desalination project.
These include environmental review requirements
under the California Environmental Quality Act, the
issuance of permits by the Coastal Commission, the
Integrated Regional Water Management Planning
process, and policies of other state agencies, such
Key Issues for Seawater Desalination in California: Energy and Greenhouse Gas Emissions | 3
as the State Lands Commission and the State Water
Resources Control Board. These agencies have
increasingly emphasized the importance of
planning for climate change and reducing
greenhouse gas emissions. While none of these
preclude the construction of new desalination
plants, the State’s mandate to reduce emissions
creates an additional planning element that must
be addressed.
There is growing interest in reducing or eliminating
greenhouse gas emissions by powering desalination
with renewables, directly or indirectly, or
purchasing carbon offsets. In California, we are
unlikely to see desalination plants that are directly
powered by renewables in the near future. A more
likely scenario is that project developers will pay
to develop renewables in other parts of the state
that partially or fully offset the energy
requirements of the desalination plant. Offsets can
also reduce emissions, although caution is required
when purchasing offsets, particularly on the
voluntary market, to ensure that they are
effective, meaningful, and do no harm. A
commitment to go “carbon neutral” is laudable;
however, project developers should commit to
purchasing high-quality offsets from certified
sources, and independent parties should verify
these claims.
Powering desalination with renewables can reduce
or eliminate the greenhouse gas emissions
associated with a particular project. This may
assuage some concerns about the massive energy
requirements of these systems and may help to
gain local, and even regulatory, support. But it is
important to look at the larger context. Even
renewables have a social, economic, and
environmental cost, albeit much less than
conventional fossil fuels. Furthermore, these
renewables could be used to reduce existing
emissions, rather than offset new emissions and
maintain current greenhouse gas levels.
Communities should consider whether there are
less energy-intensive options available to meet
water demand, such as through conservation and
efficiency, water reuse, brackish water
desalination, stormwater capture, and rainwater
harvesting. We note that energy use is not the only
factor that should be used to guide decision
making. However, given the increased
understanding of the risks of climate change for
our water resources, the importance of evaluating
and mitigating energy use and greenhouse gas
emissions are likely to grow.

Key Issues for Seawater Desalination in California: Energy and Greenhouse Gas Emissions | 4
Introduction
In June 2006, the Pacific Institute released
Desalination, With a Grain of Salt, an assessment of
the advantages and disadvantages of seawater
desalination for California. At that time, there
were 21 active seawater desalination proposals
along the California coast. Since then, only one
project, a small plant in Sand City, has been
permitted and built. A second project, in Carlsbad,
has recently secured financing and is now under
construction. Interest in seawater desalination,
however, remains high in California, and many
agencies are conducting technical and
environmental studies and pilot projects to
determine whether to develop full-scale facilities.
In 2011, the Pacific Institute began new research
on seawater desalination. As part of that effort, we
conducted some 25 one-on-one interviews with
industry experts, environmental and community
groups, and staff of water agencies and regulatory
agencies to identify some of the key outstanding
issues for seawater desalination projects in
California. This is the third in a series of research
reports that address these issues. The first report,
released in July 2012, describes the 19 proposed
projects along the California coast. The second
report, released in November 2012, discusses the
costs, financing, and risks related to desalination
projects.
In this report, we describe the energy requirements
of seawater desalination and the associated
greenhouse gas emissions. We also evaluate the
impact of short-term and long-term energy price
variability on the cost of desalinated water.
Finally, we describe current regulations on
greenhouse gas emissions in California and identify
approaches for mitigating emissions, including
strategies used by those who have recently
proposed or built new plants in California and
Australia. Future reports will evaluate the impacts
of seawater desalination on marine life and coastal
ecosystems, and discuss the permitting process and
regulations associated with building new plants in
California.
Energy Requirements of Seawater
Desalination
Removing the salt from seawater is an energy-
intensive process and consumes more energy per
gallon than most other water supply and treatment
options. The energy requirements for desalination
are determined by several factors related to the
site and design of the plant. Design considerations
include the desalination technology employed,
whether energy recovery devices are used, and the
rate of recovery, e.g., the volume of freshwater
produced per volume of seawater taken into the
plant. Site-specific factors include source-water
salinity and temperature and the desired quality of
the product water.
Table 1 summarizes energy use at 15 large reverse
osmosis (RO) seawater desalination plants that
have been constructed since 2005. On average,
these plants use about 15,000 kWh per million
gallons of water produced (kWh/MG), or 4.0 kWh

Key Issues for Seawater Desalination in California: Energy and Greenhouse Gas Emissions | 5
per cubic meter (kWh/m3).
1 We note that these
estimates refer to the rated energy use, i.e., the
energy required under a standard, fixed set of
conditions. The actual energy use may be higher,
as actual operating conditions are often not ideal.
Membrane fouling, for example, can increase the
amount of energy required to desalinate water.
1 In this report, we use the units of kWh to refer to units of
electrical energy. This is also sometimes referred to as kWhe. By contrast, kWhth represent a unit of heat and does not account for efficiency losses in the conversion of heat to electricity; e.g., for a typical power plant operating at 33% efficiency, there are 3 kWhth per kWhe.
Table 1. Energy Requirements (kWh/MG) for Seawater Desalination Plants Using Reverse Osmosis
Note: All numbers rounded to two significant figures.
Source: GWI 2010
As shown in Figure 1, the reverse osmosis process
accounts for nearly 70% of the total energy use,
while pre- and post-treatment and pumping each
account for 13%. Another 7% of energy is used to
pump water from the ocean to the plant.

Key Issues for Seawater Desalination in California: Energy and Greenhouse Gas Emissions | 6
Over the lifetime of a desalination plant, different
forms of energy – electricity, gasoline, and other
fuels – are required to construct, operate,
maintain, and eventually decommission the plant.
A full lifecycle analysis of desalination energy use
would also include energy for the production,
transport, and disposal of chemicals, membranes,
and others materials that are consumed over the
plant’s operational life. Accounting for all of these
energy uses is beyond the scope of this paper.
However, life-cycle analyses have been conducted
for seawater desalination plants, and these suggest
that operations dominate the life-cycle energy use,
accounting for about 95% of total energy use
(Stokes and Horvath 2006, Stokes and Horvath
2008).
Energy Use Comparisons
The water sector in California is a large user of
electricity and natural gas. The California Energy
Commission (CEC) (2005) estimates that capturing,
transporting, and treating water and wastewater
uses approximately 5% of the electrical energy and
1% of the natural gas consumed in the state (Table
1). Water-related energy use in homes, businesses,
and institutions accounts for an additional 13% of
the state’s electricity and 31% of the state’s
natural gas usage. In total, approximately 19% and
32% of the state’s electricity and natural gas usage,
respectively, is water related. Nearly three-
quarters of the electricity and almost all of the
natural gas use occurs inside homes and businesses,
mostly for heating. We note that recent studies
suggest that the CEC estimates may be low. An
analysis by GEI Consultants and Navigant Consulting
(2010), for example, estimates that the energy
requirements for water and wastewater systems
are 8%, higher than the 5% estimate by the CEC.
Additional effort is needed to refine these
estimates.
Table 2. Estimated Water-related Electricity and Natural Gas Consumption in 2001
Electricity
(GWh)
Natural Gas
(million therms)
Water Supply and Treatment
10,742 (4%) 19 (<1%)
End Uses 35,259 (13%) 4,238 (31%)
Wastewater Treatment
2,012 (<1%) 27 (<1%)
Total Water-Related Energy Use
48,012 (19%) 4,284 (32%)
Total California Energy Use
250,494 13,571
Source: CEC 2005
Note: Numbers may not add up due to rounding.
Intake7%
Pre-Treatment13%
RO Desalination
67%
Post-Treatment &
Pumping13%
Figure 1. Energy Use for Various Elements of the Desalination Process Source: Kennedy/Jenks Consultants 2011

Key Issues for Seawater Desalination in California: Energy and Greenhouse Gas Emissions | 7
Seawater desalination is considerably more energy-
intensive than most other water supply options.
Figure 2 shows the energy intensity, in kilowatt-
hours (kWh) per million gallons, of various water
supply options. Local sources of groundwater and
surface water are among the least energy-intensive
options available. The energy requirements for
recycled water vary, depending on the level of
treatment required to meet the water quality of a
desired end use.2 Wastewater that will be reused
2 Energy requirements for recycled water refer to the energy
required to bring the wastewater that would have been discharged to recycled water standards. If wastewater is treated to primary or secondary standards before discharge,
for irrigation and other non-potable uses typically
undergoes tertiary treatment and has an energy
intensity of 1,000 – 1,800 kWh per million gallons
(0.26 – 0.48 kWh/m3). Wastewater that will be
used to recharge aquifers may undergo membrane
treatment, with an energy requirement of 3,300 –
8,300 kWh per million gallons (0.87 – 2.2 kWh/m3).
Imported water can be especially energy intensive,
depending on the distance the water is moved and
the change in elevation. Some imported water
then additional treatment is required to bring it to reuse standards, and the energy required for that additional treatment is attributed to the recycled water.
Figure 2. Comparison of the Energy Intensity of California Water Supplies Notes: Estimates for local and imported water sources shown here do not include treatment, while those for desalination and recycled water
include treatment. Typical treatment requires less than 500 kWh per million gallons. The upper range of imported water for Northern California
is based on the energy requirements of the State Water Project along the South Bay Aqueduct. Energy requirements for recycled water refer to
the energy required to bring the wastewater that would have been discharged to recycled water standards. Estimates for brackish water
desalination are based on a salinity range of 600 – 7,000 mg/l.
Sources: Veerapaneni et al. 2011; GWI 2010; Cooley et al. 2012; GEI Consultants/Navigant Consulting, Inc. 2010
0 4,000 8,000 12,000 16,000 20,000
Local Surface Water
Local Groundwater
Recycled Water (Tertiary Treatment)
Imported Water (Northern California)
Brackish Water Desalination
Recycled Water (Membrane Treatment)
Imported Water (Colorado River Aqueduct/So. CA)
Imported Water (State Water Project/So. CA)
Seawater Desalination
Energy Intensity (kWh per million gallons)

Key Issues for Seawater Desalination in California: Energy and Greenhouse Gas Emissions | 8
systems use little energy and may even generate it.
Examples in California include the Los Angeles
Aqueduct, San Francisco’s Hetch Hetchy Aqueduc
and East Bay Municipal Utility District’s Mokelumne
Aqueduct. Most water systems that convey water
to Southern California, however, use large amounts
of energy. Water imported through the Colorado
River Aqueduct, for example, requires about 6,100
kWh per million gallons (1.6 kWh/m3). Energy
requirements for the State Water Project, which
pumps water from the Sacramento-San Joaquin
Delta to Southern California, are even higher,
ranging from 7,900 – 14,000 kWh per million gallons
(2.1 – 3.7 kWh/m3).
In comparison, energy requirements for seawater
desalination range from 12,000 – 18,000 kWh per
million gallons (3.2 – 4.8 kWh/m3) (Table 1).
Seawater desalination is thus considerably more
energy intensive than almost every other water
supply option available. While there are some
inland areas, such as in parts of Riverside County,
where the energy intensity of imported water is
comparable to that of seawater desalination, these
are in relatively limited areas with a small
population.
The overall energy implications of a seawater
desalination project will depend on whether the
water produced replaces an existing water supply
or provides a new source of water for growth and
development. If water from a desalination plant
replaces an existing supply, then the additional
energy requirements are simply the difference
between the energy use of the seawater
desalination plant and those of the existing supply.
Producing a new source of water, however,
increases the total amount of water that must be
delivered, used, and disposed of. Thus, the overall
energy implications of the desalination project
include the energy requirements for the
desalination plant plus the energy required to
deliver, use, and dispose of the water that is
produced. We note that conservation and
efficiency, by contrast, can help meet the
anticipated needs associated with growth and
development by reducing total water demand while
simultaneously maintaining or even reducing total
energy use (Cooley et al. 2010).
Energy Reduction Strategies
Energy requirements for desalination have declined
substantially over the past 40 years due to a
variety of technological advances. Membranes, for
example, have advanced considerably over the past
two decades, and most new plants use membrane-
based technology (e.g., reverse osmosis) that are
less energy-intensive than thermal-based
technology (e.g., multi-stage flash distillation).
Additionally, energy recovery devices are now
standard in newer plants and can capture 76% to
96% of the energy contained within the brine
concentrate (NRC 2008), further reducing energy
requirements (Box 1). Other advances that have
reduced energy requirements include higher-
permeability membranes and more efficient pumps
(Fritzmann et al. 2007). In looking to further
reductions, the National Research Council notes
that some of the most promising research is
focused on alternative desalination technologies,
such as forward osmosis (Box 2) and membrane
distillation; hybrid membrane-thermal
desalination; improved energy recovery devices;
and utilization of waste or low-grade heat (NRC
2008).
Desalination designers and researchers are
continuously seeking ways to further reduce energy
consumption. This research has been supported by
state and federal funding as well as by the private
sector. In a recent industry-led initiative, the
International Desalination Association created an
Energy Task Force in order to develop a framework
for reducing energy consumption by 20% for all
major seawater desalination processes. The Task
Force, which includes engineers, consultants, and
researchers from governments, corporations, and
academia, is working to establish a benchmark of
energy use at existing plants and a preliminary
methodology for reporting energy consumption.
The Task Force is also developing guidelines for

Key Issues for Seawater Desalination in California: Energy and Greenhouse Gas Emissions | 9
reducing energy use and exploring the further
development and use of alternative energy sources
and hybrid processes that combine thermal and
membrane desalination technologies (Stedman
2012). The Task Force held its first meeting in
January 2013 and will complete work in 2015.
Despite the potential for future energy use
reductions, however, there is a theoretical
minimum energy requirement beyond which there
are no opportunities for further reductions. The
theoretical minimum amount of energy required to
remove salt from seawater using reverse osmosis at
25°C is around 3,400 kWh per million gallons (0.90
kWh/m3) for 40% recovery (NRC 2008).
3 Note that
this estimate is for the removal of salts from
seawater and does not include the energy required
to pump water to the facility, pre- and post-
treatment, and deliver water to the distribution
system. Desalination plants are currently operating
at 3-4 times the theoretical minimum energy
requirements. The Affordable Desalination
Collaboration, a California-based group, has
constructed a bench-scale plant that has
demonstrated energy intensities ranging from 6,800
to 8,200 kWh per million gallons (1.8 – 2.2 kWh/m3)
for the reverse-osmosis process alone using
commercially available energy recovery devices,
efficient pumps, and low-energy membranes; the
total energy use, including water intake, pre-
filtration, and permeate treatment, for a 50 MGD
plant would be about 50% higher (WateReuse
Association 2011). These results, while promising,
are for a demonstration plant and have not yet
been achieved at a full-scale commercial plant.
3 The recovery rate is the volume of freshwater produced per
volume of seawater taken into the plant. Typical recovery rates for a seawater desalination plant are 40-50%. The minimum energy requirements increase at higher recovery rates.
In reverse-osmosis desalination systems,
seawater is pressurized using high-pressure
pumps. The pressurized water is forced
through the membrane, producing low-
pressure freshwater and high-pressure brine.
Energy-recovery devices have been developed
to re-capture some of the hydraulic energy of
the high-pressure brine.
Energy-recovery devices have been employed
in seawater reverse-osmosis plants since the
1980s. Early devices – Pelton and Francis
turbines and hydraulic turbochargers – were
centrifugal devices that used hydraulic energy
in the brine to power a turbine. The turbine
would then spin a shaft that would power the
high-pressure pumps used to move seawater
into the desalination plant. The overall
efficiency of the systems is determined by the
combined efficiency of the turbine and the
high-pressure pump. In general, centrifugal
devices have a maximum energy recovery rate
of 80% (Stover 2007).
Today, these mechanical turbines are
increasingly being replaced by more efficient
devices called isobaric energy-recovery
devices. Isobaric energy-recovery devices
directly transfer pressure from the brine to the
incoming seawater and can recover up to 98%
of the energy in the waste stream (Grondhuis
n.d.). While centrifugal devices are usually
optimized for a relatively narrow range of
flow- and pressure-operating conditions,
isobaric energy-recovery devices operate at
high efficiency over a much broader range of
conditions. While some mixing of brine and
feed water occurs, these shortcomings are
offset by reductions in energy use (Grondhuis
n.d.).

Key Issues for Seawater Desalination in California: Energy and Greenhouse Gas Emissions | 10
Under ambient conditions, water will naturally diffuse through a semi-permeable membrane from a solution of
lower concentration to a solution with a higher concentration. That is, if freshwater and saline water are
separated by a membrane, then the freshwater will naturally move across the membrane to dilute the saline
water so that the salt concentrations of the two solutions are equal. This process is referred to as osmosis. The
pressure required to stop the flow of water across the membrane is referred to as osmotic pressure. Reverse
osmosis plants apply pressure to the saline water in excess of the osmotic pressure, thereby forcing freshwater
to flow against its natural tendency, e.g., from a solution of high concentration to low concentration.
Forward osmosis is a process that also uses a semipermeable membrane to separate water from dissolved
solutes. Forward osmosis uses a “draw solution” with a relatively high solute concentration (compared to the
feedwater) that allows the natural movement of water across the membrane (Figure B2-1). Once equilibrium
has been achieved, the constituents of the draw solution can be separated to produce pure water, and the draw
solution can be reused. Drinking water forward osmosis systems are not yet commercially viable (Qin et al.
2012).
In general, commercial forward osmosis systems
are expected to have lower operational and
maintenance costs than reverse osmosis systems.
With forward osmosis, energy use and fouling are
greatly reduced as the water is drawn, rather
than forced, through the membrane (Cath et al.
2006). Moreover, membrane fouling reduces
treatment efficiency in a typical reverse osmosis
system, something that is avoided in an
unpressurized forward osmosis system.
Additionally, unpressurized systems are less
expensive to build and maintain.
Achieving commercial-scale production of
forward osmosis desalination has been limited by
the ability to identify a suitable membrane and draw
solution. The draw solution must have two key
characteristics: a higher osmotic potential than the
feedwater and characteristics that permit the freshwater to be separated from the draw solute with low energy
input (Li et al. 2011a). Draw solutes that have been studied include carbon dioxide and ammonia, sugar, and
ethanol (Li et al. 2011b). The membranes must be chemically stable and have a high flow rate and solute
rejection capacity (D&WR 2010). The only membrane suitable for forward osmosis that is currently
commercially available, however, cannot tolerate a wide pH range of the draw solution (Qin et al. 2012).
Forward osmosis is being researched and implemented in laboratories and small, pilot-scale facilities. For
example, Modern Water built the world’s first near-commercial forward osmosis desalination plants in
Gibraltar and Oman, producing 18 and 100 cubic meters per day, respectively (D&WR 2012a; Thompson and
Nicoll 2011; desalination.com n.d.). Independent research on the cost, effectiveness, and flexibility of these
systems has not yet been conducted.
Figure B2-1. Forward Osmosis Schematic

Key Issues for Seawater Desalination in California: Energy and Greenhouse Gas Emissions | 11
Energy Use and Cost
Desalinated seawater is an energy-intensive water
source and relying on it increases the water
supplier’s exposure to near- and long-term
variability in energy prices. Energy is the largest
single variable cost for a desalination plant,
varying from one-third to more than one-half of the
cost of produced water (Chaudhry 2003). The
National Research Council (2008) reports that
energy accounts for 36% of the typical water costs
of a reverse osmosis plant, with the remainder
from other operation and maintenance expenses
and fixed charges.4 Energy requirements for
thermal plants are even higher, accounting for
nearly 60% of the typical cost of produced water
for large thermal seawater desalination plant
(Wangnick 2002). At these percentages, a 25%
increase in energy cost would increase the cost of
produced water by 9% and 15% for reverse osmosis
and thermal plants, respectively. Unless there is a
way to greatly reduce the actual amount of energy
used in desalination processes, the share of
desalination costs attributable to energy will rise
as energy prices increase.
Energy prices exhibit both near-term and long-term
variability. Many factors can affect near-term
energy prices, including energy demand and fuel
prices. To determine whether dry conditions affect
electricity prices, we analyzed historical electricity
prices and precipitation in California. Our analysis
found that there is a negative correlation between
precipitation and electricity prices for four out of
4 This estimate is based on an energy cost of $0.07 per
kilowatt-hour, a 5-year membrane life, a 5% nominal interest rate, and a 25-year depreciation period.
six of California’s major utilities (Table 3). At each
of these, lower-than-average precipitation in the
previous two years is associated with higher
electricity prices. Thus, electricity costs more in
drier years. This makes sense given that relatively
inexpensive hydropower is an important source of
electricity in California and that less precipitation
means that less water is available to generate
hydroelectricity. In response, utilities must
purchase more electricity on the market or
generate it from more expensive coal and natural
gas power plants.
The relationship between precipitation and
electricity price varies among the utilities and is
stronger for those utilities more dependent on
hydroelectricity. For PG&E, for example, 69% of
the variance in energy prices can be explained by
precipitation, as indicated by a correlation
coefficient of -0.69 (Table 3). PG&E’s retail
electricity prices closely track California’s total
two-year precipitation, as shown in Figure 3.
Indeed, 22% of PG&E’s generation portfolio comes
from hydroelectricity (PG&E 2012). By contrast,
only about 0.1% of SDG&E’s generation portfolio
comes from hydropower (SDG&E 2013), and thus no
statistically significant relationship was found
between precipitation and electricity prices.

Key Issues for Seawater Desalination in California: Energy and Greenhouse Gas Emissions | 12
Table 3. Correlation between Precipitation and Retail Energy Price for Six Major California Utilities
Direction of Correlation
Correlation Coefficient
Pearson’s R P-value
Mann-Kendall P-value
Pacific Gas and Electric (PG&E) –0.69 <0.001 <0.001
Southern California Edison (SCE) –0.49 0.005 0.003
San Diego Gas and Electric (SDG&E) --* +0.31 0.05 0.32
Los Angeles Department of Water and Power (LADWP)
–0.38 0.02 0.03*
Sacramento Municipal Utility District (SMUD)
–0.59 <0.001 <0.001
Burbank-Glendale-Pasadena (BGP) --* –0.25 0.15 0.10
Note: Two different statistical methods were used to test the significance of the relationship between precipitation and electricity price:
Pearson’s correlation coefficient test and the non-parametric Mann-Kendall test. We used a two-tailed hypothesis test at the 95% confidence
level. The null hypothesis is that there is no relationship between precipitation and energy price. When the test gives a probability (or P-value)
of less than 0.025, we reject the null hypothesis and conclude that there is evidence that precipitation and energy prices are correlated.
Alternatively, when the P-value is greater than 0.025, we fail to reject the null hypothesis and find that there is not enough evidence for a
relationship between precipitation and energy price. In the table, “--*”means that the relationship is not significant at the 95% confidence level.
These results suggest that desalination plants
served by energy utilities dependent on
hydropower may be more vulnerable to short-term
energy price increases associated with dry
conditions in California. If the desalination plant is
operated more in dry years than in wet years, the
average cost per unit of water produced will be
higher than the estimated cost based on the
average electricity price. This is because more
units of electricity will be purchased at prices
higher than average (during drought) than at prices
lower than average (during wet years). This can be
especially challenging during a drought, when
revenues may be down due to reduced water sales.
Since desalination plants will likely be operated at
peak output during drought, unexpectedly high
costs could amplify revenue instability already
experienced by water suppliers.
It is important to note that water from a
desalination plant may be worth more in a drought
year because other sources of water will be
limited, thereby justifying the higher cost. Thus,
building a desalination plant may reduce a water
utility’s exposure to water reliability risks at the
added expense of an increase in exposure to
energy price risk. Project developers may pay an
energy or project developer to hedge against this
uncertainty, e.g., through a long-term energy
purchase contract or through on-site energy
production from sources with less variability. such
as solar electric. The hedging options, however,
may increase the overall cost. In any case, energy
price uncertainty creates costs that should be
incorporated into any estimate of project cost.

Key Issues for Seawater Desalination in California: Energy and Greenhouse Gas Emissions | 13
$0.00
$0.02
$0.04
$0.06
$0.08
$0.10
$0.12
$0.14
$0.16
$0.18
$0.20
0 20 40 60 80
PG&E retail rate ($/kWh)
Total Precipitation in past two years (inches)
W GW
Trend Tests
Pearson:
Mann-Kendall:
P < 0.001
P < 0.001
Figure 3. Time Series (above) and Scatterplot (below) of PG&E’s Retail Energy Rates Versus California’s Two-Year Precipitation Totals for the Two Previous Years, 1982–2010
Source: Statewide precipitation estimates are from Abatzoglou (2009). Energy price data from a dataset published by the California Energy Commission (“Statewide Electricity Rates by Utility, Class and other,” Excel workbook, http://energyalmanac.ca.gov/electricity/Electricity_Rates_Combined.xls)

Key Issues for Seawater Desalination in California: Energy and Greenhouse Gas Emissions | 14
In addition to near-term variability, energy prices
exhibit long-term variability. Future electricity
prices in California remain uncertain but are likely
to rise for several reasons. For example, the San
Onofre Nuclear Generating Plant has been shut
down for more than a year, and there is some
uncertainty about whether it will be repaired or
retired and replaced, and at what cost. Electricity
infrastructure must be maintained, and new
infrastructure may be needed. Additionally,
California, like many states, has established a
Renewables Portfolio Standard that requires
investor-owned utilities, electric service providers,
and community choice aggregators to source 33% of
their power from eligible renewable energy
resources by 2020.5
5 Eligible renewable energy sources include biomass, solar
thermal, photovoltaic, wind, geothermal, fuel cells using renewable fuels, small hydroelectric generation of 30 megawatts or less, digester gas, municipal solid waste conversion, landfill gas, ocean wave, ocean thermal, or tidal current.
The future cost of these renewables, and even
fossil fuels, is uncertain. The California Public
Utilities Commission estimates that electricity
prices will rise by nearly 27% in inflation-adjusted
dollars from 2008 to 2020, driven by the need to
maintain and replace aging transmission and
distribution infrastructure, install advanced
metering infrastructure, comply with once-through
cooling regulations and the Renewable Portfolio
Standard, and meet new demand growth (CPUC
2009). We note, however, that the price of
renewables and natural gas has declined
considerably since the CPUC developed these
estimates and that the actual cost increase may be
less than originally anticipated. Project developers
should periodically examine long-term energy price
projections to appropriately capture impacts on
desalination costs.

Key Issues for Seawater Desalination in California: Energy and Greenhouse Gas Emissions | 15
Energy Use and Greenhouse Gas Emissions
Seawater desalination, through its energy use and
other processes, contributes to the emissions of air
pollutants and greenhouse gases. The high energy
requirements of seawater desalination raise
concerns about the associated greenhouse gas
emissions. In this section, we discuss how
regulators are handling the challenge of
greenhouse gas (GHG) emissions from desalination
plants and examine the role these emissions play in
obtaining permits and approvals from state and
federal regulators. We look at the laws, policies,
and programs related to GHG emissions, and what
effect these may have on proposed desalination
plants. Finally, we discuss how proponents of
existing and proposed desalination plants are
handling the issue, including efforts to reduce their
GHG emissions.
Background on Carbon Emissions in
California
In 2006, California lawmakers passed the Global
Warming Solutions Act, or Assembly Bill 32 (AB 32).
AB 32 requires the state, the 14th largest emitter
of greenhouse gases in the world (ARB 2008), to
reduce greenhouse gas emissions to 1990 levels by
2020. Thus, the state has committed itself to a
program of steadily reducing its greenhouse gas
emissions in both the short- and long-term, which
includes cutting current emissions and preventing
future emissions associated with growth. According
to the California Air Resources Board (ARB), which
has been tasked with implementing the GHG
reduction law, “reducing greenhouse gas emissions
to 1990 levels means cutting approximately 30
percent from business-as-usual emission levels
projected for 2020, or about 15 percent from
today’s levels” (ARB 2008). ARB plans to achieve
these reductions through a combination of energy
efficiency, clean energy, clean transportation, and
market-based programs.
Under AB 32, the state must reduce emissions to
1990 levels, i.e., 427 million metric tonnes of
carbon dioxide equivalent (MMTCO2e), by 2020
(ARB 2008, 5). The roadmap for achieving these
reductions was laid out by ARB in 2008 in its
Climate Change Scoping Plan. ARB originally
estimated the reductions needed based on
emissions data for 2002–2004. Emissions during that
period were 469 MMTCO2e. The authors envisioned
a continually growing population and strong
economic growth, and the challenge for the state
was to encourage “clean development” to avoid
the huge emissions increases that would occur
under a “business-as-usual” scenario. To
accommodate this future growth while still
meeting the targets set forth in AB 32, the Scoping
Plan called for a reduction of 169 MMTCO2e from
several required measures and an additional 44
MMTCO2e from “other recommended measures.”
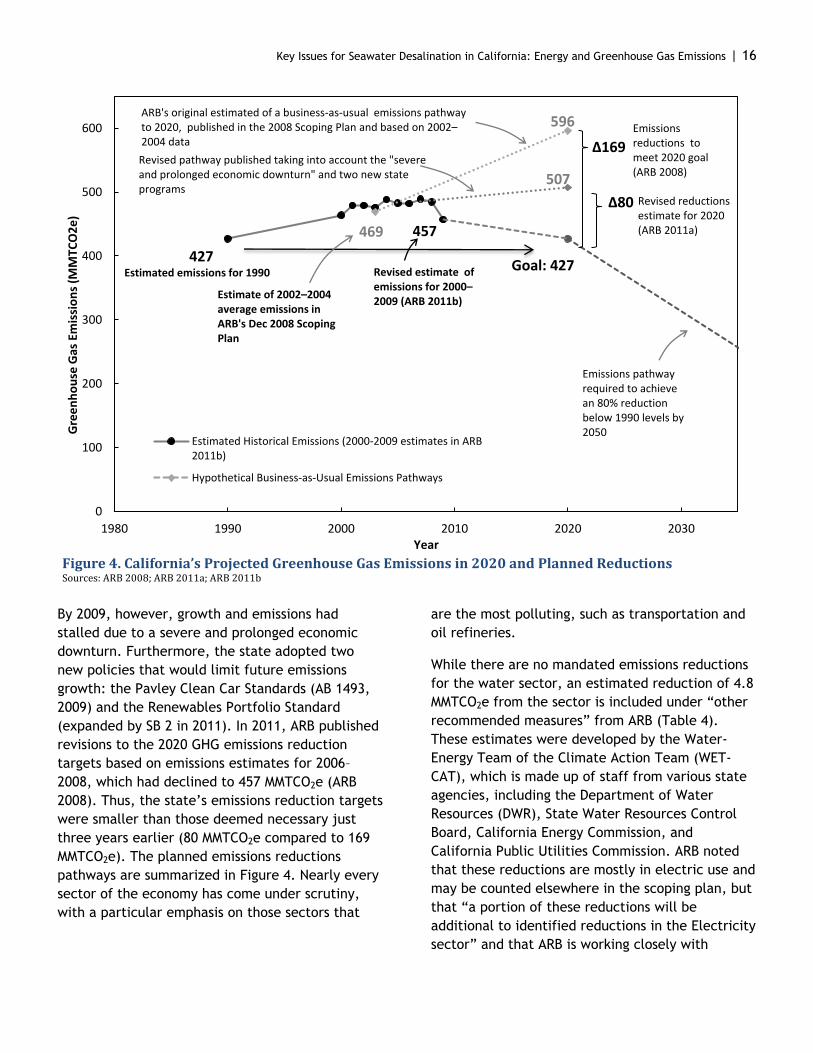
Key Issues for Seawater Desalination in California: Energy and Greenhouse Gas Emissions | 16
By 2009, however, growth and emissions had
stalled due to a severe and prolonged economic
downturn. Furthermore, the state adopted two
new policies that would limit future emissions
growth: the Pavley Clean Car Standards (AB 1493,
2009) and the Renewables Portfolio Standard
(expanded by SB 2 in 2011). In 2011, ARB published
revisions to the 2020 GHG emissions reduction
targets based on emissions estimates for 2006–
2008, which had declined to 457 MMTCO2e (ARB
2008). Thus, the state’s emissions reduction targets
were smaller than those deemed necessary just
three years earlier (80 MMTCO2e compared to 169
MMTCO2e). The planned emissions reductions
pathways are summarized in Figure 4. Nearly every
sector of the economy has come under scrutiny,
with a particular emphasis on those sectors that
are the most polluting, such as transportation and
oil refineries.
While there are no mandated emissions reductions
for the water sector, an estimated reduction of 4.8
MMTCO2e from the sector is included under “other
recommended measures” from ARB (Table 4).
These estimates were developed by the Water-
Energy Team of the Climate Action Team (WET-
CAT), which is made up of staff from various state
agencies, including the Department of Water
Resources (DWR), State Water Resources Control
Board, California Energy Commission, and
California Public Utilities Commission. ARB noted
that these reductions are mostly in electric use and
may be counted elsewhere in the scoping plan, but
that “a portion of these reductions will be
additional to identified reductions in the Electricity
sector” and that ARB is working closely with
Figure 4. California’s Projected Greenhouse Gas Emissions in 2020 and Planned Reductions Sources: ARB 2008; ARB 2011a; ARB 2011b
0
100
200
300
400
500
600
1980 1990 2000 2010 2020 2030
Gre
en
ho
use
Gas
Em
issi
on
s (M
MTC
O2
e)
Year
Estimated Historical Emissions (2000-2009 estimates in ARB2011b)
Hypothetical Business-as-Usual Emissions Pathways
Estimated emissions for 1990
Estimate of 2002–2004 average emissions in ARB's Dec 2008 Scoping Plan
Revised estimate of emissions for 2000–2009 (ARB 2011b)
ARB's original estimated of a business-as-usual emissions pathway to 2020, published in the 2008 Scoping Plan and based on 2002–2004 data
Revised pathway published taking into account the "severe and prolonged economic downturn" and two new state programs
Emissions pathway required to achieve an 80% reduction below 1990 levels by 2050
Emissions reductions to meet 2020 goal (ARB 2008)
469 457
427
596
507
Goal: 427
Δ80
Δ169
Revised reductions estimate for 2020 (ARB 2011a)

Key Issues for Seawater Desalination in California: Energy and Greenhouse Gas Emissions | 17
appropriate agencies to refine these estimates
(ARB 2008, 66).
The water sector is a large energy user in
California. As described previously, about 19% of
the state’s electricity use and 33% of the state’s
non-electricity natural gas consumption is water
related. Water managers are increasingly aware of
the risks associated with climate change, and there
appears to be a strong desire in the sector (at least
at the state level and among some large municipal
utilities, such as the East Bay Municipal Utilities
District, Sonoma County Water Agency, and Inland
Empire Utilities Agency) to increase efficiency and
reduce emissions. DWR, which operates the State
Water Project, a large system of dams, canals,
pipelines, and pumps that delivers water to cities
and farms in the Central Valley and Southern
California, is the single largest user of energy in
the state. DWR plans to reduce its emissions, which
peaked at 4.1 MMTCO2e in 2003, to 1.65 MMTCO2e
by 2020 through a variety of actions, including
phasing out coal power (Schwarz 2012).
Table 4. Planned Greenhouse Gas Emissions Reductions by California’s Water Sector, from ARB’s 2008 Scoping Plan
Measure Reduction (MMTCO2e)
Water Use Efficiency 1.4
Water Recycling 0.3
Water System Energy Efficiency 2.0
Reuse Urban Runoff 0.2
Increase Renewable Energy Production 0.9
Public Goods Charge TBD
Total 4.8
Source: ARB 2008
Potential Emissions from Desalination
As noted earlier, desalination is among the most
energy-intensive source of water in California.
Producing a million gallons of desalinated seawater
requires an average of 15,000 kWh (4.0 kWh/m3),
considerably more than other water supply and
treatment options available in California. We have
estimated the theoretical potential emissions that
could occur if all of the currently proposed
desalination plants are eventually built. Overall,
we estimate that expanding the state’s seawater
desalination capacity by 514 million gallons per day
(MGD) would increase energy use by about 2,800
GWh per year.6 To put this in perspective, the total
electricity use in California in 2011 was 270,000
GWh (CEC 2012). Thus, desalination build-out
would represent about a 1% increase above current
electricity use.
If we assume that all of the desalination plants are
powered by the electricity grid, we estimate that
the build-out of the currently proposed
desalination plants would lead to emissions of
about 1.0 MMTCO2e annually (Table 4), a 0.2%
increase in the state’s current emissions.7 The
potential emissions increase from build out of the
desalination plants alone is equivalent to about
one-fifth of the planned reductions in the water
sector identified in the 2008 AB 32 Scoping Plan
(4.8 MMTCO2e). Additionally, introducing a new
source of water increases the amount of water that
must be delivered to customers, used in homes and
businesses, collected, treated again as wastewater,
and discharged – all of which use energy and result
in GHG emissions. This increase in emissions is
antithetical to the state’s directive to reduce GHG
emissions.
6 Based on an energy requirement of 15,000 kWh/MG.
7 Potential desalination-related emissions are calculated based
on 2009 emissions factors.

Key Issues for Seawater Desalination in California: Energy and Greenhouse Gas Emissions | 18
Table 5. Theoretical Emissions Associated with Proposed Desalination Plants in California
Project Partners Location Capacity (MGD)
Energy Use (MWh per day)
Emissions (MMT CO2e per yr)
East Bay Municipal Utilities District, San Francisco Public Utilities Commission, Contra Costa Water District, Santa Clara Valley Water District, Zone 7 Water Agency
Pittsburg 19.8 300 0.03
City of Santa Cruz, Soquel Creek Water District
Santa Cruz 5 75 0.007
DeepWater, LLC Moss Landing 2.5 38 0.003
The People’s Moss Landing Water Desal Project
Moss Landing 25 380 0.03
California American Water North Marina 10 150 0.01
California Water Service Company Not known 9 140 0.01
Ocean View Plaza Monterey 0.25 3.8 0.003
Monterey Peninsula Water Management District
Del Monte Beach, Monterey
2 30 0.0003
Seawater Desalination Vessel Monterey Bay 20 300 0.06
Cambria Community Services District/U.S. Army Corps of Engineers
Cambria 0.6 9.0 0.0008
Arroyo Grande, Grover Beach, Oceano Community Services District
Oceano 2 30 0.003
West Basin Municipal Water District El Segundo 18 270 0.03
Poseidon Resources Huntington
Beach 50 750 0.08
Municipal Water District of Orange County, Laguna Beach County Water District, Moulton Niguel Water District, City of San Clemente, City of San Juan Capistrano, South Coast Water District
Dana Point 15 230 0.03
City of Oceanside City of Oceanside 10 150 0.02
Poseidon Resources, San Diego County Water Authority
Carlsbad 50 750 0.09
San Diego County Water Authority Camp Pendleton 150 2,300 0.3
NSC Agua Rosarito, Mexico 100 1,500 0.08
San Diego County Water Authority Rosarito, Mexico 25 380 0.3
TOTAL 514 7,700 1.0
Note: Based on an energy intensity of desalination equal to 15,000 kWh per million gallons (4.0 kWh/m3). Emissions factors for regional utilities from the California Climate Registry (ARB 2010). Numbers may not add up due to rounding.

Key Issues for Seawater Desalination in California: Energy and Greenhouse Gas Emissions | 19
We note that the proposed desalination facilities may replace, to some extent, existing water supply and treatment facilities. In other words, they may not all be “additional” to existing water supply systems, and some of the GHG emissions included in the estimate above may already be occurring. Additionally, as renewables are added to California’s grid, emissions may decrease over time. Thus, while we can analyze the potential effects of desalination build out, the precise amount of future electricity use and emissions depends on a number of factors that are difficult to quantify.
Regulatory Framework
The California Environmental Quality Act
The California Environmental Quality Act, or CEQA,
is the State’s premiere environmental law,
requiring that “state and local agencies disclose
and evaluate the significant environmental impacts
of proposed projects and adopt all feasible
mitigation measures to reduce or eliminate those
impacts” (California Department of Justice 2012).
The law, as enacted in 1972, contained no
provisions specifically related to climate change or
carbon emissions. In 2007, however, state
lawmakers passed SB 97, directing the Natural
Resources Agency to adopt amendments to the
CEQA guidelines to address greenhouse gases.
These are now codified in state law, as part of
California’s Code of Regulations, Title 14: Natural
Resources Law (Natural Resources Agency 2009).
Agencies have always been required under CEQA to
identify significant environmental impacts and
adopt all feasible measures to mitigate (or lessen)
those impacts.8 Henceforth, project applicants are
expressly required to analyze GHG emissions during
the CEQA process.
8 The word mitigation can cause some confusion, as it has
different meanings in the climate change community and in CEQA practice. When discussing CEQA, mitigation refers to measures to avoid or substantially reduce a project’s significant environmental impacts.
The issue of cumulative impacts of pollutants,
including GHG emissions, has been argued in the
courts for years. When faced with a global
environmental problem, project applicants could
reasonably state that their emissions were so small
that they represent a de minimis source of
pollution and therefore should not be regulated.
However, while individual polluters may cause
little harm on their own, their cumulative impacts
can be significant. State and national
environmental laws are designed to protect natural
resources from the cumulative effects of
pollutants. The courts have begun to recognize
this, and recent rulings have eroded the de minimis
argument. For example, a federal court ruled in
2008 that “the impact of greenhouse gas emissions
on climate change is precisely the kind of
cumulative impacts analysis that the National
Environmental Protection Act requires agencies to
conduct” (cited in Baldwin 2008, 792).
The State CEQA Guidelines (2012, Section 2109)
require “lead agencies” to evaluate the GHG
emissions of a proposed project.9 Additional
guidance is provided by the Governor’s Office of
Research and Planning (OPR): “Lead agencies
should make a good-faith effort, based on available
information, to calculate, model, or estimate the
amount of CO2 and other GHG emissions from a
project, including the emissions associated with
vehicular traffic, energy consumption, water
usage, and construction activities.” Lead agencies
must also reach a conclusion regarding the
significance of a project’s emissions (OPR 2012)
and describe how they will mitigate significant
emissions.
State regulators realized that including GHG
emissions in CEQA could hold up or derail nearly
9The lead agency is the government agency which has the
discretion to approve or deny a project and is responsible for producing the CEQA analysis. A project applicant is often not the same entity as the lead agency. The applicant is the entity that wants to develop a project.

Key Issues for Seawater Desalination in California: Energy and Greenhouse Gas Emissions | 20
any project. To avoid this, the State CEQA
Guidelines, as revised in 2010, allow lead agencies
to create programmatic greenhouse gas reduction
plans that cover all resources within the agency’s
jurisdiction, rather than dealing with the emissions
from projects individually (Schwarz 2012, 17). In
other words, the agency could analyze the total
emissions that will result from or be influenced by
all of its future activities in aggregate. If an
individual project is consistent with the regional
plan, then its GHG emissions will not be flagged as
a significant impact.
Appendix G of the State CEQA Guidelines includes
sample questions for evaluating project impacts.
The two questions applicable to a project’s
climate-change-related impacts are:
Would the project generate greenhouse gas
emissions, either directly or indirectly, that
may have a significant impact on the
environment?
Would the project conflict with an
applicable plan, policy, or regulation
adopted for the purpose of reducing the
emissions of greenhouse gases?
Kerr (2012) reports that there are three basic types
of thresholds that lead agencies may select for
determining significance:
mass emission thresholds;
efficiency-based thresholds; or
consistency with an adopted plan.
One mass emission threshold that some lead
agencies have used is 10,000 metric tonnes of CO2e
per year, which is the level at which individual
stationary sources are required to quantify and
report their GHG emissions to the California Air
Resources Board ARB. Other lead agencies have
used a mass emission threshold of 25,000 metric
tonnes of CO2e per year, the level at which most
stationary sources are required to participate in
the State’s Cap and Trade Program. Examples of
efficiency-based metrics include the GHG intensity
of the water produced by a desalination facility
expressed in units of metric tonnes of CO2e per
million gallons or metric tonnes of CO2e per
customer served. Under a “consistency approach,”
the lead agency determines whether the project is
consistent with a local Climate Action Plan, for
example, by demonstrating whether a proposed
project would interfere with planned region-wide
emissions reductions.
Some regional agencies have recommended or
adopted numeric significance thresholds for
evaluating GHGs. For example, the South Coast Air
Quality Management District issued rules in
December 2008, creating a two-step method for
determining whether a project’s emissions are
deemed “significant” under CEQA. First, if a
project’s emissions exceed the GHG budgets in an
approved regional plan, then the lead agency must
look at numerical thresholds created by the Air
District. The project’s emissions are deemed
significant if emissions exceed (after mitigation)
the following screening levels:
10,000 metric tonnes of CO2e per year for
industrial projects; or
3,000 metric tonnes of CO2e per year for
commercial or residential projects.
The threshold for commercial and residential
projects is equivalent to the emissions from about
230 average American homes (Jones and Kammen
2011).
Here is how this might work in practice. Suppose a
Southern California community has created an
emissions reduction plan and its goal is to reduce
GHG emissions to 1990 levels by 2020. This plan
allows for 1,000 new housing units and includes
emissions reduction measures through land use and
transportation planning, energy efficiency
programs, and purchasing renewable energy. In this
community, a proposal for a new 500-unit
subdivision, if it is otherwise compatible with the
plan, could be approved more quickly and its CO₂
emissions would not be flagged as “significant”

Key Issues for Seawater Desalination in California: Energy and Greenhouse Gas Emissions | 21
during CEQA review. In a community without an
approved emissions reduction plan, the lead
agency would need to determine whether GHG
emissions associated with the proposed subdivision
are significant and support its conclusion with
substantial evidence. If the lead agency
determined that GHG emissions associated with the
proposed subdivision would be significant, then all
feasible mitigation measures must be implemented
to reduce the impact to a less-than-significant
level.
California Coastal Commission
The California Coastal Commission is charged with
protecting the ocean environment off of
California’s shores, and obtaining a Coastal
Development Permit from the Commission is one of
the key regulatory approvals for a new desalination
plant. The Coastal Commission looks at many
factors when considering issuing this permit,
including greenhouse gas emissions. Staff of the
Coastal Commission has noted that “desalination is
a relatively energy-intensive water source, and
depending on a facility’s source of electricity, it
may result in relatively high indirect greenhouse
gas emissions, which further exacerbate the ocean
acidification process” (Luster 2011).
GHG emissions have not yet been a major issue
with the Coastal Commission. For Poseidon’s 50
MGD plant in Carlsbad, the largest desalination
plant that has been permitted in California, the
applicant voluntarily developed an energy
minimization and greenhouse gas emissions
reduction plan, which is discussed further below.
The Coastal Commission, however, did not require
GHG reduction or mitigation from the newest
desalination plant in California, the 0.6 MGD plant
built in Sand City in 2010. Nonetheless, the plant’s
designers have taken steps to maximize its energy
efficiency, but managers have not chosen to
purchase renewable energy or carbon offsets
(Sabolsice 2013). This is an emerging issue,
however, that may factor into the debate over
future coastal permits.
Integrated Regional Water Management Planning Guidelines
In 2002, the California legislature passed the
Integrated Regional Water Management Act (SB
1672) “to encourage local agencies to work
cooperatively to manage local and imported water
supplies to improve the quality, quantity, and
reliability” (DWR 2012a). The IRWM program is
administered largely by DWR, with support from
the State Water Resources Control Board. Under
this program, local governments, utilities,
watershed groups, and other interested parties
develop an Integrated Regional Water Management
Plan (IRWMP). Subsequent legislation made funding
available to regional bodies to support planning
activities, including $380 million from Proposition
50 in 2002 and $1 billion from Propositions 84 and
1E in 2006. Further legislation in 2008 (SB1, the
IRWM Planning Act) provided a general definition of
an IRWM plan and guidance on what IRWM program
guidelines must contain. Today, there are 48 IRWM
regions in the state, bringing together a variety of
stakeholder groups to develop IRWM plans.
In 2010, the state created new requirements for
IRWM regions to assess climate change vulnerability
and consider greenhouse gas emissions as a part of
the planning process. DWR released revised IRWM
Guidelines in 2010 and again in 2012, which include
climate change as one of 16 “standards” that must
be included in IRWM plans in order to receive
planning and implementation funds from state
grant programs. According to these guidelines,
IRWM plans must include both mitigation and
adaptation strategies.10
In practice, this means
that planners should include a greenhouse gas
emissions inventory for all aspects of the region’s
existing and planned water system, including as
much detailed and quantitative data as is feasible
given time, expertise, and financial resources. In
addition, IRWM plans must include “a process that
10 In the climate change literature, mitigation refers to efforts
to reduce greenhouse gas emissions, while adaptation refers to strategies to deal with climate change impacts.

Key Issues for Seawater Desalination in California: Energy and Greenhouse Gas Emissions | 22
considers GHG emissions when choosing between
project alternatives” (DWR 2012b, 23). While GHG
emissions must be considered, the guidelines do
not state that lower-emission alternatives must be
chosen, or even given preference.
In an effort to promote compliance with the new
guidelines, DWR, the Environmental Protection
Agency, and the US Bureau of Reclamation
developed the Climate Change Handbook for
Regional Water Planning (Schwarz et al. 2011).
According to these guidelines, planners must
consider GHG emissions reduction in the project-
review process, but as a “secondary criterion” (p
72). To be eligible for state funding, all projects
must have an analysis of GHG emissions which must
be quantitative, and the guidelines suggest several
analytical tools for performing the analysis.
Regions must also join the California Climate
Action Registry, an organization that catalogs and
tracks GHG emissions for businesses and
governments in the state.
A recent review of the program studied how
climate change is being addressed during the
planning process (Conrad 2012). Conrad found that
only about a third of the plans created before the
new 2010 guidelines included a discussion about
climate change. In more recent plans, the level of
detail varies, as does the approach; however, all
regions stated that they would consider GHG
emissions in project selection. Thus, state water
management agencies have expressed their
preference for reduced emissions among all water
projects in the state and directed local decision
makers to consider making reductions, although
they have not yet established a specific mandate or
targets for local or regional water projects.
Greenhouse Gas Emissions Reduction
Strategies
There are several ways to reduce the greenhouse
gas emissions associated with desalination plants.
These include (1) reducing the total energy
requirements of the plant; (2) powering the
desalination plant with renewable energy; and (3)
purchasing carbon offsets. Energy reduction
strategies are described on page 8 of this report.
Here, we describe strategies for powering
desalination plants with renewables and purchasing
carbon offsets as a means of reducing GHG
emissions.
Renewable Energy Sources
Some desalination proponents have pointed to the
possibility of running desalination plants with
alternative energy systems, from solar to nuclear,
as a way of reducing dependence on fossil fuels and
reducing greenhouse gas emissions and their
contribution to climate change. Indeed, solar
energy has been used for over a century to distill
brackish water and seawater. The simplest
example of this process is the greenhouse solar
still, in which saline water is heated and
evaporated by incoming solar radiation in a basin
on the floor, and the water vapor condenses on a
sloping glass roof that covers the basin. One of the
first successful solar systems was built in 1872 in
Las Salinas, Chile, an area with very limited
freshwater. This still covered 4,500 square meters,
operated for 40 years, and produced over 5,000
gallons of freshwater per day (Delyannis and
Delyannis 1984). Variations of this type of solar still
have been tested in an effort to increase
efficiency, but they all share some major
difficulties, including large land area requirements,
high capital costs, and vulnerability to weather-
related damage.

Key Issues for Seawater Desalination in California: Energy and Greenhouse Gas Emissions | 23
In addition to solar stills, there are several other
ways to couple desalination plants with renewable
energy, either directly or indirectly.11
Plants
directly powered by renewables have a dedicated
renewable energy source whereas those indirectly
powered by renewables draw power from an
electricity grid that includes renewables. Interest
in directly powering desalination plants with
renewables is growing, although most plants built
to date are small demonstration plants. Since 1974,
an estimated 132 renewable-energy desalination
plants, with a combined capacity of less than 1
MGD (3,600 m3/d), have been installed worldwide
(ProDes 2010). Energy sources for these systems
include geothermal energy, wind, solar thermal,
and solar photovoltaic. Seawater desalination
represented 63% of the total number of plants
powered by renewables and 86% of the total
renewable energy desalination capacity. As shown
11 Although there is interest in powering desalination plants
with nuclear energy in some parts of the world, we do not discuss that here given strong opposition to nuclear and bans on the development of new nuclear reactors in California.
in Figure 5, the overwhelming majority of these
seawater desalination plants use solar power, in
part because it is a more reliable energy source
than wind in most areas (World Bank 2012). The
largest of the renewable desalination plants,
however, are powered by wind, which tends to be
less expensive than solar photovoltaic.
Powering desalination plants directly by
renewables faces several challenges, one of the
biggest of which is the availability of sufficient
energy where and when it is needed. Desalination
plants, especially those using membrane
technologies, require a continuous source of
energy. Solar and wind energy, however, are
subject to daily and seasonal fluctuations.
Geothermal energy is more consistent; however, it
is only available in certain areas. While there are
means for storing renewable energy, such as
pumping water into hilltop reservoirs and
recovering the energy with hydroelectric
generators or storing excess heat in associated
thermal storage systems that can later be
converted to electricity, these storage systems
have not yet been employed on a large scale.
Figure 5. Global Renewable Energy Seawater Desalination Plants by Energy Source, 2010 Source: ProDes 2010

Key Issues for Seawater Desalination in California: Energy and Greenhouse Gas Emissions | 24
Desalination plants can also be indirectly powered
by renewables by increasing the amount of
renewable energy supply to the grid, relative to
the needs of the desalination facility. With this
approach, the plant developer would construct or
fund the construction of renewable energy plants
(on- or off-site) to feed energy into the same
electricity grid to which the desalination plant is
connected. Supporters say that this approach is
generally simpler and more flexible than building
dedicated renewables, as it taps into existing
markets for renewable energy and the
infrastructure is already in place to deliver the
electricity where it is needed. Furthermore, grid
electricity is always on, as opposed to more
intermittent sources like wind and solar.
This approach has been widely used in Australia
through the purchase of Renewable Energy
Certificates (RECs). In Australia, an REC, which
represents 1 megawatt-hour of electricity
generated from a renewable energy source, can be
sold and traded or bartered. The funds received
from the sale of RECs are intended to allow
renewable energy companies to cover the higher
cost of generating renewables. Several large-scale
desalination facilities in Australia have purchased
RECs from new offsite renewable energy projects
(Box 3). In order for these plants to be completely
carbon neutral, however, the purchase of RECs
must offset all of the energy required by the
facility and must result in new sources of
renewable energy. RECs for existing or planned
facilities would not serve to offset the emissions
from the desalination facility since the renewable
energy would have been generated with or without
the desalination plant. Although energy users
purchase RECs from specific renewable energy
projects, it is often difficult to confirm whether
new renewable energy projects were built because
the desalination plants purchased their certificates
or whether the projects would have been built
anyway.
Carbon Offsets
In addition to reducing GHG emissions though
energy efficiency measures or investing in
renewables, project developers may also purchase
carbon offsets to mitigate GHG emissions. The idea
behind offsets is to pay someone else to reduce
their emissions to “cancel out” your own emissions.
Today, there is an international market in carbon
offsets, with thousands of buyers and sellers. There
is also a wide variety in the price and type of
offsets. Some offset providers invest in renewable
energy, such as wind, solar, hydroelectric, or
biofuels; the concept is that these new energy
sources will reduce consumption of fossil fuels.
Other offset sellers engage in projects that are
meant to reduce greenhouse gas emissions. For
example, an offset project may help a hog farmer
to install a system to capture methane from animal
waste. Or it may help a factory in a developing
country to install emissions controls to prevent the
release of potent greenhouse gases, such as
hydrofluorocarbons and perfluorocarbons. Yet
another class of offsets is designed to prevent
deforestation or land degradation, which includes
schemes called REDD (Reducing emissions from
deforestation and forest degradation).
With the exception of DWR, California water
suppliers are not currently regulated under AB 32,
and thus desalination proponents that pursue this
option would be purchasing voluntary offsets.
Under California’s emissions reduction scheme,
regulated entities are allowed to purchase offsets
to fulfill up to 8% of their required emissions
reductions. For companies to obtain credit toward
their required reductions, the offsets they
purchase must be certified by ARB. At present, ARB
has stated that it will certify only certain types of
domestic offsets, while considering expanding the
program in the future. Voluntary offsets, on the
other hand, can be purchased from any number of
private companies, or from clearinghouses that are
part of emissions trading programs, such as
Europe’s Clean Development Mechanism (CDM).

Key Issues for Seawater Desalination in California: Energy and Greenhouse Gas Emissions | 25
Outside of the regulated offset market, the price
of private offsets varies greatly, with prices in 2012
ranging from $0.50 to $30 per metric tonne of CO₂.
The quality of offsets also appears to vary greatly.
Under the CDM -- Europe’s experiment with carbon
offsets -- there have been many poorly designed
projects and some cases of outright fraud (McCully
2008). In response, scholars and regulators have
developed a number of concepts to verify the
quality of offsets. California regulators, for
example, have drawn on international experience
and scholarship and created rules stating that
regulated offset allowances must “represent a GHG
emission reduction or GHG removal enhancement
that is real, additional, quantifiable, permanent,
verifiable, and enforceable” (ARB 2012). These
criteria capture how difficult it can be to ensure
that promised emissions reductions are tangible
and would not have otherwise occurred without the
influence of the offset project.
For example, an offset may pay a subsidy to a
company for solar energy to make it more
attractive to the buyer, compared to conventional
fossil fuel sources. However, would the company
have purchased solar anyway, without the subsidy?
The burden is on the offset provider to prove that
its investment resulted in “additional” emissions
reductions that would not have happened without
are uncontrolled or uncounted? For example, will
protecting a plot of rainforest from agricultural
development simply result in another piece of land
being clear-cut and converted to farming? And will
that forest be protected in perpetuity? Given all of
these questions, it can be difficult to prove that
offsets will prduce meaningful long-term emissions
reductions.
Offsets have been criticized on other grounds as
well. English environmentalist and writer George
Monbiot has likened offsets to indulgences granted
by churches in the Middle Ages, as they allow
polluters to continue with business as usual by
simply making payments. He argues that the
system of offsets “persuades us we can carry on
polluting” and delays the changes necessary to
slow climate change (Monbiot 2006).
Further, because of the proliferation of companies
selling offsets and the lack of regulation in the
voluntary market, there is evidence that “many
offset reduction claims are exaggerated or
misleading” and even cases of outright fraud
(Carbon Offset 2013). Forestry projects under REDD
have been particularly controversial, and several
cases of human rights abuses have been
documented. In Uganda, Oxfam International
described a case where 20,000 farmers were
evicted from their land, without notification or
adequate compensation, to make room for a tree
plantation offset project by the London-based New
Forests Company (Grainger and Geary 2011). In
Brazil, indigenous leaders opposing projects that
would force their communities off of ancestral land
have been harassed by authorities and received
death threats (Goldtooth and Conant 2012).
Carbon offsets have been welcomed by politicians
and regulators in California, who expect them to
play a part of the state’s emissions reductions
goals. However, caution is required when
purchasing offsets, particularly on the voluntary
market, to ensure that they are effective,
meaningful, and do no harm. A commitment to go
“carbon neutral” is laudable. Companies, however,
should commit to purchasing high-quality offsets
from certified sources, and independent parties
should verify these claims.

Key Issues for Seawater Desalination in California: Energy and Greenhouse Gas Emissions | 26
In 2001, the Australian federal government implemented the Mandatory Renewable Energy Target, which now
requires that renewable energy make up 20% of Australia’s electricity mix by 2020. Victoria and New South
Wales have also created state-level renewable energy targets. In Australia, desalination plants can offset their
energy needs by purchasing Renewable Energy Certificates (RECs) equivalent to the amount of electricity
consumed. Below are details on several large-scale desalination facilities that have purchased RECs from new
offsite renewable energy projects.
Kwinana Seawater Desalination Plant (Western Australia)
The Kwinana Seawater Desalination Plant is located near Perth in Western Australia and was completed in late
2006. The 38 MGD (130 megaliters per day) plant produces water for the Perth metropolitan area. Plant
operators purchase electricity generated by the Emu Downs Wind Farm, which is located 120 miles north of
Perth. The wind farm consists of 48 wind turbines and contributes more than 272 GWh per year into the grid,
fully offsetting the estimated 180 GWh per year required by the desalination plant (Sanz and Stover 2007).
Tugun Desalination Plant (Southeast Queensland)
The Tugun Desalination Facility is located along the Gold Coast in Southeast Queensland. The 33 MGD (125
megaliters per day) plant was completed in February 2009. At full production, the plant consumes about 150
GWh per year (WaterSecure n.d.). The plant’s energy use is offset by the purchase of RECs, with solar hot water
systems providing the main source of energy, followed by solar photovoltaic, hydropower, and a small amount of
wind (WaterSecure 2009). The desalination plant was put on standby in December 2010 due to high operating
cost and operational issues (Marschke 2012).
Kurnell Desalination Plant (New South Wales)
The Kurnell Desalination Plant is located near Sydney in New South Wales. The 66 MGD (250 megalitres per
day) plant was completed in early 2010. The plant operators purchased RECs from the 140 MW Capital Wind
Farm near Bungendore. The wind farm was built specifically to supply power to the desalination plant but
provides additional energy to the grid (Infigen Energy n.d.). The desalination plant was put in stand-by mode in
July 2012 due to the availability of less expensive water supply alternatives (AAP News 2012).
(continued on next page)

Key Issues for Seawater Desalination in California: Energy and Greenhouse Gas Emissions | 27
Southern Seawater Desalination Plant (Western Australia)
The Southern Seawater Desalination Plant is located in Western Australia and was completed in August 2011.
Expansion of the facility, which is expected to be completed in 2013, will double the capacity of the plant to 72
MGD (270 megaliters per day) (Water Corporation n.d.a). The plant operators will purchase the entire output of
two new renewable energy projects: the 55MW Mumbida Wind Farm and the 10MW Greenough River Solar Farm
(Water Corporation n.d.b). The electricity produced by these projects will be fed into Western Power’s grid, which
then provides the electricity required for the desalination plant, and will offset all of the energy required by the
desalination plant.
Wonthaggi Desalination Plant (Victoria)
The Wonthaggi Desalination Plant, located in Victoria, was fully operational in late 2012. All the power required to
operate the 109 MGD (410 megaliters per day) desalination plant and distribution pipeline will be fully offset by
RECs, which support the development of the Oaklands Hill wind farm (63 MW); the Macarthur wind farm (420
MW); and several other renewable energy projects. Upon completion, the desalination plant was quickly put on
standby due to lack of demand (Hosking 2012).
Port Stanvac Desalination Plant (Southern Australia)
The Port Stanvac Desalination Plant, located near Adelaide in Southern Australia, is under construction. The 72
MGD (270 megaliters per day) plant will be powered by renewables through the purchase of RECs. The plant is
expected to be completed in 2013 but in an October 2012 statement, SA Water Chief Executive John Ringham
announced that “to keep costs down for our customers, SA Water is planning to use our lower-cost water sources
first, which will mean placing the desalination plant in stand-by mode when these cheaper sources are available”
(Kemp 2012). The desalination plant, which cost nearly $1.9 billion, is slated to go on stand-by mode in 2015. Plant
operators will be required to pay a minimum amount each year while the project is in standby, although they will
not reveal how much due to commercial confidentiality arrangements (Kemp 2012).

Key Issues for Seawater Desalination in California: Energy and Greenhouse Gas Emissions | 28
Going Carbon Neutral in California?
In the absence of state or local mandates,
desalination proponents in California may
voluntarily commit to carbon neutrality, which
requires balancing the amount of carbon released
with an equivalent amount sequestered or offset.
That approach, however, can be controversial. An
interesting example is provided by the 50 MGD
desalination plant proposed in Carlsbad by
Poseidon Resources. Poseidon claims carbon
reductions through a range of activities (Voutchkov
2008). The largest of these is carbon emission
reduction tied to reduced water imports from the
State Water Project, responsible for about 70% of
the carbon budget. They argue that San Diego has
in recent years imported 90% of its water supply
from outside the region, which takes energy to
pump and treat and results in GHG emissions. And
while the desalinated water will take even more
energy, and cause more emissions, Poseidon argues
it is only responsible for offsetting the difference
between these two, or the additional energy
caused by desalination compared to imported
water. Poseidon proposes to mitigate the
remaining 30% of the emissions from the
desalination plant through a variety of means,
including energy recovery devices, solar panels on
the roof, green building design, fuel-efficiency
standards, and by purchasing carbon offsets.
Some groups have criticized Poseidon’s approach,
including the San Diego Coastkeeper and the
Planning and Conservation League (San Diego
Coastkeeper 2010, Minton 2010). The first issue is
whether Poseidon should be responsible for
offsetting all of its emissions, or only its “net”
emissions that take into account reduced water
imports. Some have argued that “the Carlsbad
plant will produce new water, and that taking
emission credit for reduced water imports should
not be permitted in a greenhouse gas reduction
plan” (Heede 2008). While San Diego County Water
Authority staff has publicly stated that water from
the desalination plant would reduce the amount of
imported water purchased from the Metropolitan
Water District (Weinberg 2013), there is no binding
legal agreement to ensure that this occurs. But
even if imports are reduced, the project
proponents state that this would reduce the
amount of water imported from the State Water
Project, the most energy intensive imported water
source in the region. In reality, reductions of
imported water would likely be a combination of
water from the State Water Project and the less
energy- and carbon-intensive Colorado River
Aqueduct.
In an analysis commissioned by the San Diego
Coastkeeper, the consultancy Climate Mitigation
Services (CMS) found that Poseidon overestimated
their potential GHG reductions and underestimated
the amount of offsets it would need to purchase to
achieve net zero emissions (Heede 2008). CMS
raised several concerns about Poseidon’s analysis,
including assumptions about displaced imports
(described on previous page), electricity emissions
factors, and motor efficiency ratings. But even
accepting the displaced imported water argument,
CMS estimated that the number of offsets needed
would equal 53,000 MMTCO2e per year,
significantly higher than Poseidon’s estimate of
16,000 MMTCO2e per year. Assuming an average
offset cost of $8 per MMTCO2e, Poseidon may have
underestimated the annual cost of purchasing
offsets by around $300,000.12
12 In 2012, each offset could be purchased for between $4 (for
wind farms in China) to $120 (for “gold standard” domestic projects) (Peters-Stanley 2013).

Key Issues for Seawater Desalination in California: Energy and Greenhouse Gas Emissions | 29
Conclusions
Removing the salt from seawater is an energy-
intensive process and consumes more energy per
gallon than most other water supply and treatment
options. On average, desalinations plants use about
15,000 kWh per million gallons of water produced
(kWh/MG), or 4.0 kWh per cubic meter (kWh/m3).
We note, however, that these estimates refer to
the rated energy use, i.e., the energy required
under a standard, fixed set of conditions. The
actual energy use may be higher, as actual
operating conditions are often not ideal.
The overall energy implications of a seawater
desalination project will depend on whether the
water produced replaces an existing water supply
or provides a new source of water for growth. If
water from a desalination plant replaces an
existing supply, then the additional energy
requirements are simply the difference between
the energy use of the seawater desalination plant
and those of the existing supply. Producing a new
source of water, however, increases the total
amount of water that must be delivered, used, and
disposed of. Thus, the overall energy implications
of the desalination project include the energy
requirements for the desalination plant plus the
energy required to deliver, use, and dispose of the
water that is produced. We note that conservation
and efficiency, by contrast, can help meet the
anticipated needs associated with growth by
reducing total water demand while simultaneously
maintaining or even reducing total energy use.
Energy requirements for desalination have declined
dramatically over the past 40 years due to a variety
of technological advances, and desalination
designers and researchers are continuously seeking
ways to further reduce energy consumption.
Despite the potential for future energy use
reductions, however, there is a theoretical
minimum energy requirement beyond which there
are no opportunities for further reductions.
Desalination plants are currently operating at 3-4
times the theoretical minimum energy
requirements, and despite hope and efforts to
reduce the energy cost of desalination, there do
not appear to be significant reductions in energy
use on the near-term horizon.
The high energy requirements of seawater
desalination raise several concerns, including
sensitivity to energy price variability. Energy is the
largest single variable cost for a desalination plant,
varying from one-third to more than one-half the
cost of produced water (Chaudhry 2003). As result,
desalination creates or increases the water
supplier’s exposure to energy price variability. In
California, and in other regions dependent on
hydropower, electricity prices tend to rise during
droughts, when runoff, and thus power production,
is constrained and electricity demands are high.
Additionally, electricity prices in California are
projected to rise by nearly 27% between 2008 and
2020 (in inflation-adjusted dollars) to maintain and
replace aging transmission and distribution
infrastructure, install advanced metering
infrastructure, comply with once-through cooling
regulations, meet new demand growth, and
increase renewable energy production (CPUC
2009). Rising energy prices will affect the price of
all water sources, although they will have a greater
impact on those that the most energy intensive.

Key Issues for Seawater Desalination in California: Energy and Greenhouse Gas Emissions | 30
It is important to note that water from a
desalination plant may be worth more in a drought
year because other sources of water will be
limited. Thus, building a desalination plant may
reduce a water utility’s exposure to water
reliability risks at the added expense of an increase
in exposure to energy price risk. Project developers
may pay an energy or project developer to hedge
against this uncertainty, e.g., through a long-term
energy purchase contract or through on-site energy
production from sources with less variability, such
as solar electric. The hedging options, however,
may increase the overall cost. In any case, energy
price uncertainty creates costs that should be
incorporated into any estimate of project cost.
The high energy requirements of seawater
desalination also raise concerns about greenhouse
gas emissions. In 2006, California lawmakers passed
the Global Warming Solutions Act, or Assembly Bill
32 (AB 32), which requires the state to reduce
greenhouse gas emissions to 1990 levels by 2020.
Thus, the state has committed itself to a program
of steadily reducing its greenhouse gas emissions in
both the short- and long-term, which includes
cutting current emissions and preventing future
emissions associated with growth. Action and
awareness has, until recently, been uneven and
slow to spread to the local level. While the state
has directed local and regional water managers to
begin considering emissions reductions when
selecting water projects, they were not subject to
mandatory cuts during the state’s first round of
emissions reductions. As the state moves forward
with its plans to cut carbon emissions further,
however, every sector of the economy is likely to
come under increased scrutiny by regulators.
Desalination – through increased energy use – can
cause an increase in greenhouse gas emissions,
further contributing to the root cause of climate
change and thus running counter to the state’s
greenhouse gas reduction goals.
While there is “no clear-cut regulatory standard
related to energy use and greenhouse gas
emissions,” (Pankratz 2012) there are a variety of
state programs, policies, and agencies that must be
considered when developing a desalination project.
These include environmental review requirements
under the California Environmental Quality Act, the
issuance of permits by the Coastal Commission, the
Integrated Regional Water Management Planning
process, and policies of other state agencies, such
as the State Lands Commission and the State Water
Resources Control Board. These agencies have
increasingly emphasized the importance of
planning for climate change and reducing
greenhouse gas emissions. While none of these
preclude the construction of new desalination
plants, the state’s mandate to reduce emissions
creates an additional planning element that must
be addressed.
There is growing interest in reducing or eliminating
greenhouse gas emissions by powering desalination
with renewables, directly or indirectly, or
purchasing carbon offsets. In California, we are
unlikely to see desalination plants that are directly
powered by renewables in the near future. A more
likely scenario is that project developers will pay
to develop renewables in other parts of the state
that partially or fully offset the energy
requirements of the desalination plant. Offsets can
also reduce emissions, although caution is required
when purchasing offsets, particularly on the
voluntary market, to ensure that they are
effective, meaningful, and do no harm.
Powering desalination with renewables can reduce
or eliminate the greenhouse gas emissions
associated with a particular project. This may
assuage some concerns about the massive energy
requirements of these systems and may help to
gain local, and even regulatory, support. But it is
important to look at the larger context. Even
renewables have a social, economic, and
environmental cost, albeit much less than
conventional fossil fuels. Furthermore, these
renewables could be used to reduce existing
emissions, rather than offset new emissions and
maintain current greenhouse gas levels.
Communities should consider whether there are
less energy-intensive options available to meet
water demand, such as through conservation and

Key Issues for Seawater Desalination in California: Energy and Greenhouse Gas Emissions | 31
efficiency, water reuse, brackish water
desalination, stormwater capture, and rainwater
harvesting. We note that energy use is not the only
factor that should be used to guide decision
making. However, given the increased
understanding of the risks of climate change for
our water resources, the importance of evaluating
and mitigating energy use and greenhouse gas
emissions are likely to grow.

Key Issues for Seawater Desalination in California: Energy and Greenhouse Gas Emissions | 32
References
AAP News (Australia). (2012). Desal Plant Closure
Not Waste: NSW Govt
Abatzoglou, J.T., K.T. Redmond, and L.M.
Edwards. (2009). Classification of Regional
Climate Variability in the State of
California, Journal of Applied Meteorology
and Climatology, 48, 1527-1541.
Air Resources Board (ARB). (2008). Climate Change
Scoping Plan: A Framework for Change.
California Air Resources Board.
http://www.arb.ca.gov/cc/scopingplan/do
cument/adopted_scoping_plan.pdf.
Air Resources Board (ARB). (2010). Local
Government Operations Protocol For the
Quantification and Reporting of Greenhouse
Gas Emissions Inventories Version 1.1.
California Air Resources Board, California
Climate Action Registry, ICLEI - Local
Governments for Sustainability, The
Climate Registry.
http://www.theclimateregistry.org/downlo
ads/2010/05/2010-05-06-LGO-1.1.pdf.
Air Resources Board (ARB). (2011a). Status of AB 32
Scoping Plan Recommended Measures.
California Air Resources Board.
http://www.arb.ca.gov/cc/scopingplan/sta
tus_of_scoping_plan_measures.pdf.
Air Resources Board (ARB). (2011b). California
Greenhouse Gas Emissions Inventory: 2000-
2009. California Air Resources Board.
http://www.arb.ca.gov/cc/inventory/pubs
/reports/ghg_inventory_00-09_report.pdf.
Air Resources Board (ARB). (2012). California Cap
on Greenhouse Gas Emissions and Market-
Based Compliance Mechanisms. California
Code of Regulations.
http://www.arb.ca.gov/cc/capandtrade/se
ptember_2012_regulation.pdf.
Baldwin, K.M. (2008). “NEPA and CEQA: Effective
Legal Frameworks for Compelling
Consideration of Adaptation to Climate
Change.” S. Cal. L. Rev. 82: 769.
California Department of Justice. (2012). California
Environmental Quality Act (CEQA). State of
California Department of Justice, Office of
the Attorney General.
http://oag.ca.gov/environment/ceqa.
“Carbon Offset.” (2013). Wikipedia, the Free
Encyclopedia.
http://en.wikipedia.org/w/index.php?title
=Carbon_offset&oldid=527914164.
California Energy Commission (CEC). (2012).
“Electricity Consumption by County.”
California Energy Consumption Data
Management System, California Energy
Commission.
http://ecdms.energy.ca.gov/elecbycounty.
aspx.
California Energy Commission (CEC). (2005).
California’s Water-Energy Relationship.
Final Staff Report. Sacramento, CA.

Key Issues for Seawater Desalination in California: Energy and Greenhouse Gas Emissions | 33
California Public Utilities Commission (CPUC).
(2009). 33% RPS Implementation Analysis
Preliminary Results. California Public
Utilities Commission: Sacramento, CA.
Accessed on January 2, 2012 at
http://www.cpuc.ca.gov/NR/rdonlyres/B12
3F7A9-17BD-461E-AC34-
973B906CAE8E/0/ExecutiveSummary33perc
entRPSImplementationAnalysis.pdf.
Cath, T.Y., A.E. Childress, M. Elimelech. (2006).
Forward osmosis: Principles, applications,
and recent developments. Journal of
Membrane Science, 281(1–2): 70–87.
Chaudhry, S. (2003). Unit cost of desalination.
California Desalination Task Force,
California Energy Commission. Sacramento,
California.
Chou, B., and J. Schroeder. (2012). Ready or Not:
An Evaluation of State Climate and Water
Preparedness Planning. NRDC.
http://www.nrdc.org/water/readiness/wat
er-readiness-report.asp.
Conrad, E. (2012). Climate Change and Integrated
Regional Water Management in California: A
Preliminary Assessment of Regional
Approaches. Berkeley, California: Dept. of
Environmental Science, Policy and
Management University of California
Berkeley.
http://www.water.ca.gov/climatechange/
docs/IRWM_CCReport_Final_June2012_ECon
rad_UCBerkeley.pdf.
Cooley, H., R. Wilkinson, M. Heberger, L. Allen,
P.H. Gleick, and A. Nuding. (2012).
Implications of Future Water Supply and
Sources for Energy Demands. Alexandria,
VA: WaterReuse Foundation.
Cooley, H. J. Christian-Smith, P.H. Gleick, M.
Cohen, and M. Heberger. (2010).
California's Next Million Acre-Feet: Saving
Water, Energy, and Money. Pacific
Institute: Oakland, California.
Delyannis, A.A. and E. Delyannis. (1984). Solar
desalination. Desalination, 50:71-81.
Department of Water Resources (DWR). (2012a).
Integrated Regional Water Management
Grants.
http://www.water.ca.gov/irwm/grants/ind
ex.cfm.
Department of Water Resources (DWR). (2012b).
IRWM Grant Program Guidelines –
Propositions 84 and 1E. Sacramento:
California Department of Water Resources.
http://www.water.ca.gov/irwm/grants/do
cs/Guidelines/GL_2012_FINAL.pdf.
Desalination & Water Reuse (D&WR). (2012). Low-
temp distillation system uses
waste/renewable energy.
http://www.desalination.biz/news/news_s
tory.asp?id=6766&title=Low-
temp+distillation+system+uses+waste%2Fre
newable+energy
Desalination.com. (N.d.). Supplier Directory -
Modern Water.
http://www.desalination.com/technologies
/ro-epc/modern-water.
Fritzmann, C., J. Lowenberg, Y. Wintgens, and T.
Melin. (2007). State-of-the-Art of Reverse
Osmosis Desalination. Desalination, 216: 1-
76.
GEI Consultants/Navigant Consulting, Inc. (2010).
Embedded Energy in Water Studies, Study
1: Statewide and Regional Water–Energy
Relationship; Draft Final Report.
Global Water Intelligence (GWI). (2010).
Desalination Markets 2010: Global Forecast
and Analysis.

Key Issues for Seawater Desalination in California: Energy and Greenhouse Gas Emissions | 34
Goldtooth, T., and J. Conant. (2012). “Indigenous
Leaders Rejecting California REDD Hold
Governor Responsible for Their Safety.”
October 24.
http://www.foe.org/news/news-
releases/2012-10-indigenous-leaders-
rejecting-california-redd-hold-go.
Grainger, M., and K. Geary. (2011). The New
Forests Company and Its Uganda
Plantations. Oxfam International.
http://www.redd-
monitor.org/wordpress/wp-
content/uploads/2011/09/cs-new-forest-
company-uganda-plantations-220911-
en.pdf.
Grondhuis, F. (N.d.). Examining Isobaric Energy
Recovery Systems at SWRO Plants.
WaterWorld.
http://www.waterworld.com/articles/iww
/print/volume-12/issue-1/feature-
editorial/examining-isobaric-energy-
recovery-systems-at-swro-plants.html.
Heede, R. (2008). Carlsbad Seawater Desalination
Project. Comment letter to California
Coastal Commission.
http://www.climatemitigation.com/public
ations/HeedeCarlsbadRptAug08.pdf.
Hosking, W. (2012). “Water from Wonthaggi
Desalination Plant Flows into Cardinia
Reservoir,” Herald Sun, September 26,
2012.
Infigen Energy. (N.d.). The Capital Wind Farm.
http://www.infigenenergy.com/Media/doc
s/Capital-Wind-Farm-Brochure-fb268c8e-
e14b-4c44-8d95-e8ec2a23e31a-0.pdf
Jones, C. M., and D. M. Kammen. (2011).
Quantifying Carbon Footprint Reduction
Opportunities for US Households and
Communities. Environmental Science and
Technology-Columbus 45(9): 4088.
Kelley, A. H. (2011). Seawater Desalination:
Climate Change Adaptation or Contributor.
Ecology Law Currents 38: 40.
Kemp, M. (2012). “Silver Lining to $1.8bn Port
Stanvac Desalination Plant White
Elephant,” The Advertiser, October 4,
2012.
Kennedy/Jenks Consultants. (2011). Energy White
Paper: Perspectives on Water Supply Energy
Use. Prepared for the City of Santa Cruze
and Soquel Creek Water District scwd2
Desalination Program.
Kerr, A. (2012). Analyzing Greenhouse Gas
Emissions from Desalination Facilities
Pursuant to CEQA. Presented at the
CalDesal First Annual Desalination
Conference, October 25, Sacramento.
http://www.caldesal.org/Day%20One/1.30
%20Foundation%20for%20Policy/North%20Ke
rrGHGs%20&%20Desal.pdf.
Li, D., X. Zhang, J. Yao, G.P. Simon, and H. Wang.
(2011a). Stimuli-responsive polymer
hydrogels as a new class of draw agent for
forward osmosis desalination. Chem.
Commun, 47: 1710-1712.
http://pubs.rsc.org/en/content/articlehtm
l/2011/cc/c0cc04701e.
Li, D., G.P. Simon, and H. Wang. (2011b).
Assessment of Polyelectrolyte Draw Agents
in Forward Osmosis Desalination. Paper
presented at Chemeca 2011 in Sydney, New
South Wales, Australia, September 18-21.
http://www.conference.net.au/chemeca20
11/papers/148.pdf.
Luster, T. (2011). Initial Comments for Monday's
Desalination Policy Workshop. Comments to
State Water Resources Control Board staff.
April 14, San Francisco, CA.
http://www.waterboards.ca.gov/water_iss
ues/programs/ocean/desalination/docs/ccc
_luster2011apr14.pdf.

Key Issues for Seawater Desalination in California: Energy and Greenhouse Gas Emissions | 35
Marschke, T. (2012). “Call to Keep Desal Plant
Running,” Gold Coast Sun. July 12, 2012.
McCully, P. (2008). “UN-run Carbon Trading
Mechanism Questioned Amidst Allegations
of Corruption.” The Guardian, May 20, sec.
Environment.
http://www.guardian.co.uk/environment/2
008/may/21/environment.carbontrading.
Minton, J. (2010). Desal and ‘Carbon’ated Water:
Coastal Commission Should Make the
Carlsbad Project Offset All of Its Carbon
Impacts. California Progress Report,
Planning and Conservation League.
http://www.californiaprogressreport.com/s
ite/node/7315.
Monbiot, G. (2006). “Selling Indulgences.” October
19.
http://www.monbiot.com/2006/10/19/sell
ing-indulgences/.
Murray, B. (2009). Leakage with Forestry and
Agriculture Offsets: What Do We Really
Know? Presented at: Biological
Sequestration through Greenhouse Gas
Offsets Conference April 29, Washington,
DC.
http://pdf.wri.org/bioseq_murray_leakage.
pdf.
National Research Council (NRC). (2008).
Desalination—A National Perspective,
Washington, D.C., National Academies
Press, 312 p.
Natural Resources Agency. (2009). Adopted and
Transmitted Text of SB97 CEQA Guidelines
Amendments.
http://ceres.ca.gov/ceqa/docs/Adopted_a
nd_Transmitted_Text_of_SB97_CEQA_Guide
lines_Amendments.pdf.
Office of Planning and Research (OPR). (2012).
CEQA and Climate Change. California Office
of Planning and Research. Accessed
December 13.
http://opr.ca.gov/s_ceqaandclimatechange
.php.
Pacific Gas & Electric (PG&E). (2012). PG&E’s 2011
Electric Generation Portfolio Mix.
Preliminary Report compiled by PG&E’s
Energy Compliance and Reporting
department as of May 31, 2012.
Pankratz, T. (2012). “Permitting Morass
Explained.” Water Desalination Report,
May 7.
Peters-Stanley, M. (2013). “Carbon Offset Prices
Vary Widely By Standard And Project Type:
Study.” Ecosystem Marketplace. Accessed
January 18.
http://www.ecosystemmarketplace.com/p
ages/dynamic/article.page.php?page_id=90
90§ion=news_articles&eod=1.
ProDes. (2010). RE Desalination Plants. Accessed on
April 23, 2013 at http://www.prodes-
project.org/index.php@id=105.html.
Qin, J., W.C. Loong Lay, and K.A. Kekre. (2012).
Recent developments and future challenges
of forward osmosis for desalination: a
review. Desalination and Water Treatment,
39(1-3): 123-136.
http://www.tandfonline.com/doi/pdf/10.1
080/19443994.2012.669167.
Sabolsice, E. (2013). Personal communication.
California American’s Monterey Regional
Manager.
San Diego Coastkeeper. (2010). “Desalination in
San Diego.” San Diego’s Water Supply.
http://www.sdcoastkeeper.org/learn/san-
diegos-water-supply/desalination.html.

Key Issues for Seawater Desalination in California: Energy and Greenhouse Gas Emissions | 36
San Diego Gas & Electric (SDG&E). (2013). Electric
Generation Fact Sheet. Accessed on April
22, 2013 at
http://www.sdge.com/sites/default/files/
newsroom/factsheets/SDG%26E%20Electric%
20Generation%20Fact%20Sheet.pdf.
Sanz, M.A. and R.L. Stover. (2007). Low Energy
Consumption in the Perth Seawater
Desalination Plant. IDA World Congress –
Maspalomas, Gran Canaria, Spain. October
21-26, 2007.
Schwarz, A. (2012). Climate Action Plan Phase 1:
Greenhouse Gas Emissions Reduction Plan.
California Department of Water Resources.
http://www.water.ca.gov/climatechange/
docs/Final-DWR-ClimateActionPlan.pdf.
Schwarz, A., S. Marr, K. Schwinn, E. Townsley, A.
O’Callaghan, J. Andrew, T. Quasebarth, E.
Lopez-Calva, P. Kulis, and G. Pelletier.
(2011). Climate Change Handbook for
Regional Water Planning. Sacramento: US
Environmental Protection Agency and
California Department of Water Resources.
http://www.water.ca.gov/climatechange/
CCHandbook.cfm.
Stedman, L. (2012). Global: IDA Energy Task Force.
Water21 – Magazine of the International
Water Association. April 17, 2012. Accessed
on January 2, 2012 at
http://www.iwapublishing.com/template.c
fm?name=news1131.
Stokes, J.R. and A. Horvath. (2008). Energy and Air
Emission Effects of Water Supply. Environ.
Sci. Technol., 43(8): 2680-2687.
Stokes, J.R. and A. Horvath. (2006). Life Cycle
Energy Assessment of Alternative Water
Supply Systems. Int J LCA, 11(5): 335-343.
Stover, R.L. (2007). Seawater reverse osmosis with
isobaric energy recovery devices.
Desalination, 203: 168–175.
Thompson, N.A., and P.G. Nicoll. (2011). Forward
Osmosis Desalination: A Commercial
Reality. IDA World Congress – Perth
Convention and Exhibition Centre (PCEC),
Perth, Western Australia September 4-9.
http://www.modernwater.co.uk/assets/pd
fs/PERTH%20Sept11%20-
%20FO%20Desal%20A%20Commercial%20Real
ity.pdf.
Veerapaneni, S., B. Klayman, S. Wang, and R.
Bond. (2011). Desalination Facility Design
and Operation for Maximum Efficiency.
Denver, Colorado: Water Research
Foundation.
Voutchkov, N. (2008). Planning for Carbon-Neutral
Desalination in Carlsbad, California.
Environmental Engineer: Applied Research
and Practice, Summer 2008.
Wangnick, K. (2002). 2002 IDA Worldwide Desalting
Plants Inventory. Gnarrenburg, Germany:
Produced by Wangnick Consulting for the
International Desalination Association.
Water Corporation. (N.d.a.). Southern Seawater
Desalination Plant. Accessed: March 22,
2013.
http://www.watercorporation.com.au/d/d
esalination_plant2.cfm
Water Corporation.( N.d.b.). Renewable Energy.
Accessed: March 22, 2013.
http://www.watercorporation.com.au/D/d
esal_renewables.cfm.
WateReuse Association. (2011). Seawater
Desalination Power Consumption. Accessed
on April 11, 2012 at
http://www.watereuse.org/sites/default/fi
les/u8/Power_consumption_white_paper.p
df.
WaterSecure. (N.d.). Frequently Asked Questions.
Accessed: March 22, 2013.
http://www.watersecure.com.au/pub/faq/
faq.

Key Issues for Seawater Desalination in California: Energy and Greenhouse Gas Emissions | 37
WaterSecure. (2009). Desalination plant turns
“green.” Media Release. Accessed: March
22, 2013.
http://www.watersecure.com.au/pub/ima
ges/stories/media_releases/090825_RECs.p
df.
Weinberg, K. (2013). Personal communication.
Water Education Foundation Executive
Briefing. Sacramento, California.
World Bank. (2012). Renewable Energy
Desalination: An Emerging Solution to Close
the Water Gap in the Middle East and North
Africa. Washington, DC: World Bank.
2012 California Environmental Quality Act (CEQA)
Statute and Guidelines. California Code of
Regulations, 2012.
http://ceres.ca.gov/ceqa/docs/CEQA_Hand
book_2012_wo_covers.pdf.