key indicators for evidence-based spatial planning ... gleeson... · key indicators for...
TRANSCRIPT

National Institute for Regional and Spatial Analysis (NIRSA, NUI Maynooth)
Justin Gleeson
Key Indicators for Evidence-based Spatial Planning Presenting & Disseminating Spatial Data

Overview – Presenting and Disseminating Spatial Data
2
• Census Toolkits – Improving evidence informed planning • Republic of Ireland
• Cross Border / All-Island Mapping Systems • All-Island Accessibility
• All-Island Deprivation Index
• MyPlan.ie (DECLG) • Land Use Planning Toolkit
• KITCASP • Indicators Selection
• Interactive Dashboards (examples from Iceland and Scotland)
• Embedding within websites

All-Island Research Observatory (AIRO)
3
• AIRO is a research unit and spatial data portal focused on improving evidence informed planning in Ireland
– Collects, analyses and provides evidence and tools to support better planning and decision making
• Maps, data, policy advice, research and training
– Maximise the usage and benefit of publically funded and readily available datasets
– Highlight the benefit of proper collection, management and dissemination of datasets
• Who do we work with?
– Government Departments
– Semi-State bodies
– Regional Authorities, Local Authorities, Local Partnerships, Charities etc
– Academics, Researchers, Public
– Funding Bodies (ESPON, SEUPB,INTERREG)
Mapping Resources: Census Toolkits
4
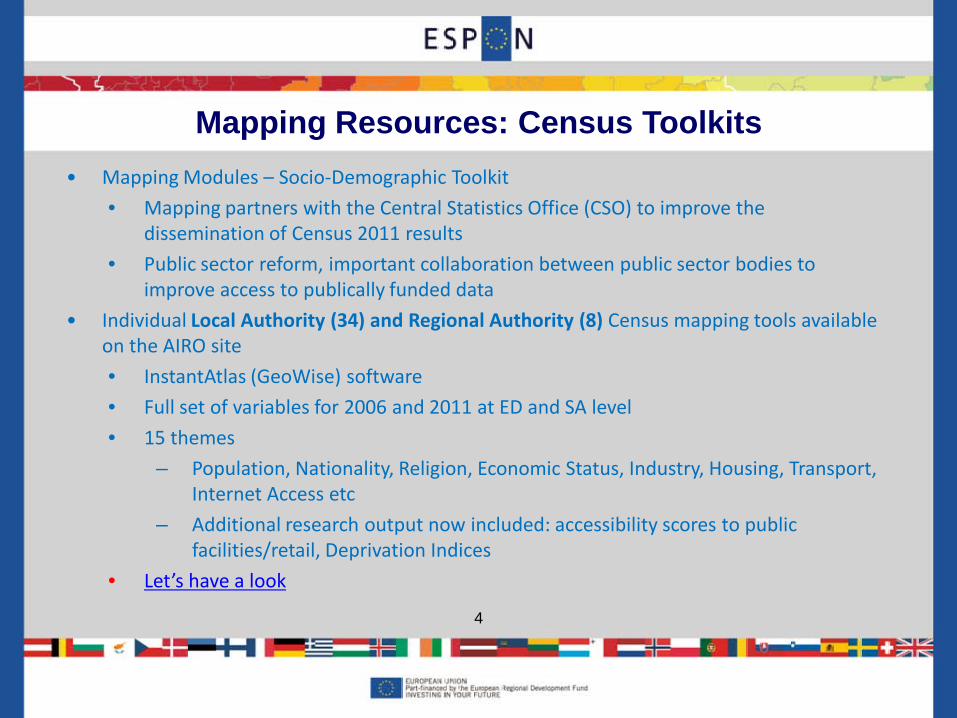
• Mapping Modules – Socio-Demographic Toolkit
• Mapping partners with the Central Statistics Office (CSO) to improve the dissemination of Census 2011 results
• Public sector reform, important collaboration between public sector bodies to improve access to publically funded data
• Individual Local Authority (34) and Regional Authority (8) Census mapping tools available on the AIRO site
• InstantAtlas (GeoWise) software
• Full set of variables for 2006 and 2011 at ED and SA level
• 15 themes
– Population, Nationality, Religion, Economic Status, Industry, Housing, Transport, Internet Access etc
– Additional research output now included: accessibility scores to public facilities/retail, Deprivation Indices
• Let’s have a look

Mapping Resources: Census Toolkits
5
• Invitation to LA and RA to embed these tools within corporate website • Planning sections, Community and Enterprise etc
• No requirement for dependence on GIS/IS staff
• 10 minute job for IT technician to create i-frame and embed link
– It’s a toolkit for planners, policy makers and researchers

Mapping Resources: Census Toolkits
6
• Planning reform in Republic of Ireland • 3 new Regional Assemblies
– Connacht-Ulster Region
– Southern Region
– Eastern-Midland Region

Mapping Resources: Census Toolkits
7
• Planning reform in Northern Ireland • 11 new Districts in Northern Ireland (2015)
Mapping Resources: Census Toolkits
8
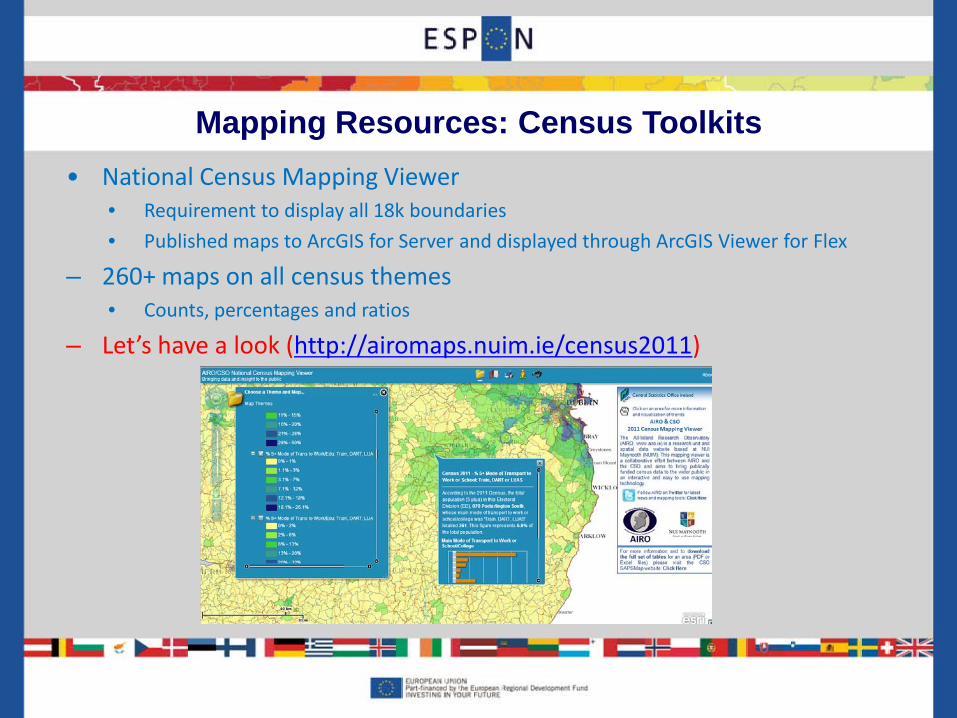
• National Census Mapping Viewer • Requirement to display all 18k boundaries
• Published maps to ArcGIS for Server and displayed through ArcGIS Viewer for Flex
– 260+ maps on all census themes • Counts, percentages and ratios
– Let’s have a look (http://airomaps.nuim.ie/census2011)
Mapping Resources: Census Toolkits
9
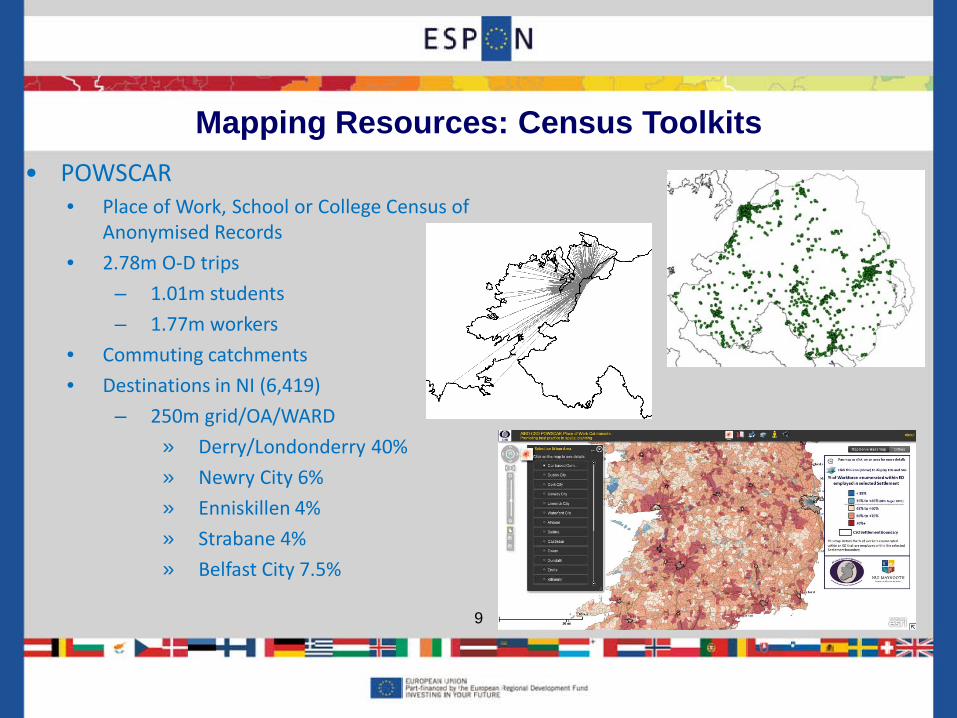
• POWSCAR • Place of Work, School or College Census of
Anonymised Records
• 2.78m O-D trips
– 1.01m students
– 1.77m workers
• Commuting catchments
• Destinations in NI (6,419)
– 250m grid/OA/WARD
» Derry/Londonderry 40%
» Newry City 6%
» Enniskillen 4%
» Strabane 4%
» Belfast City 7.5%
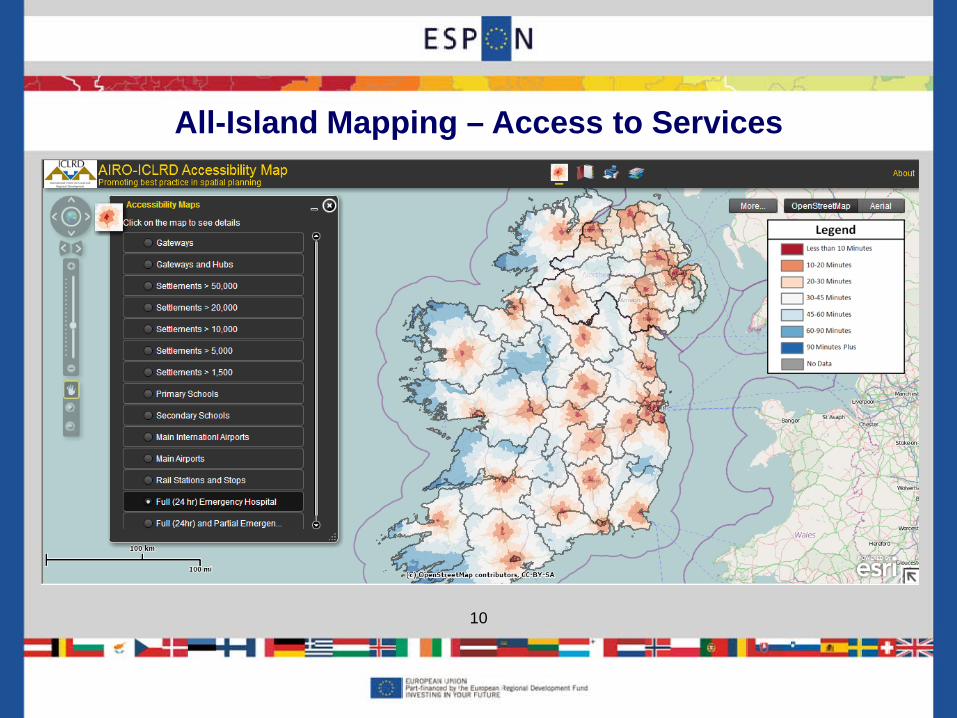

All-Island Mapping – All-Island Deprivation Index
11

All-Island Mapping – All-Island Deprivation Index
12
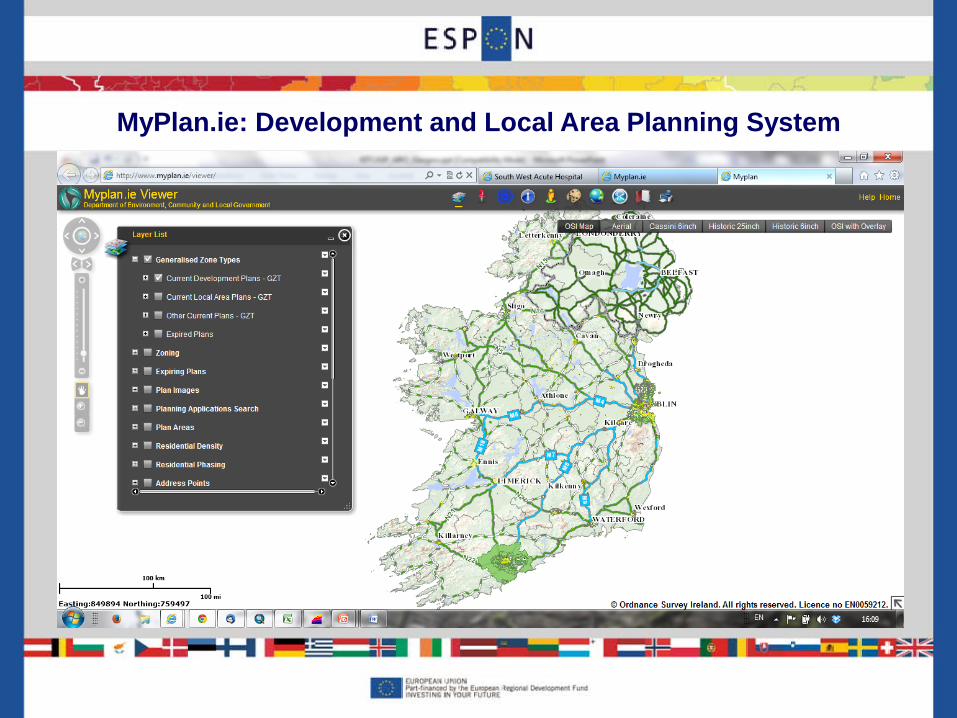
MyPlan.ie: Development and Local Area Planning System
13

MyPlan.ie: Development and Local Area Planning System
14

MyPlan.ie: Development and Local Area Planning System
15
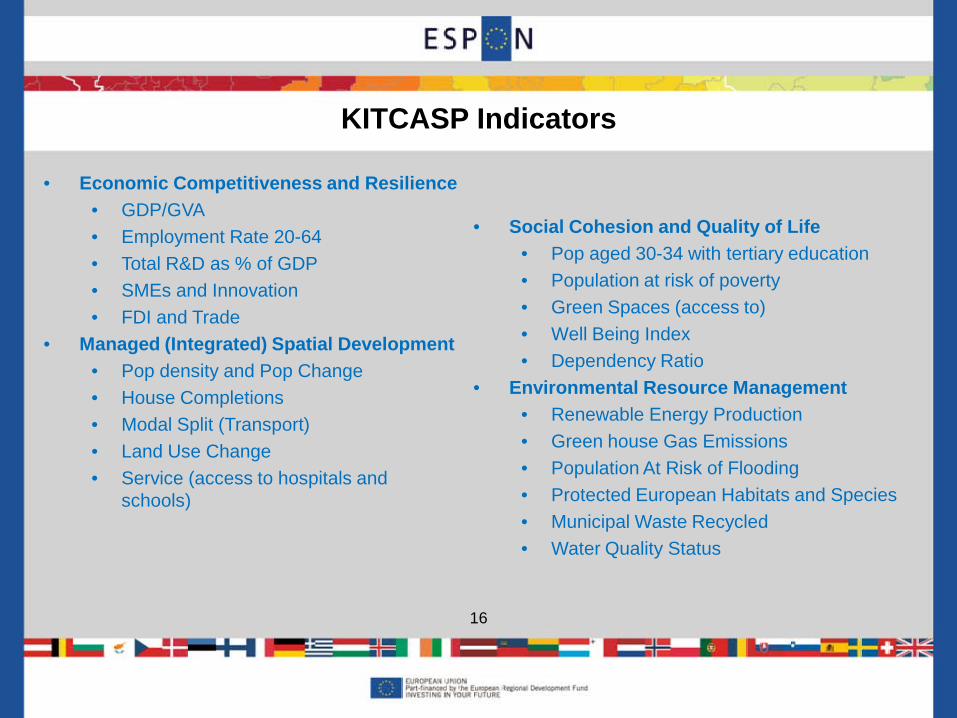
• Economic Competitiveness and Resilience • GDP/GVA • Employment Rate 20-64 • Total R&D as % of GDP • SMEs and Innovation • FDI and Trade
• Managed (Integrated) Spatial Development • Pop density and Pop Change • House Completions • Modal Split (Transport) • Land Use Change • Service (access to hospitals and
schools)
KITCASP Indicators
16
• Social Cohesion and Quality of Life • Pop aged 30-34 with tertiary education • Population at risk of poverty • Green Spaces (access to) • Well Being Index • Dependency Ratio
• Environmental Resource Management • Renewable Energy Production • Green house Gas Emissions • Population At Risk of Flooding • Protected European Habitats and Species • Municipal Waste Recycled • Water Quality Status

Use of ESPON Database for KITCASP
17
https://espondb.liglab.fr/e2/search

• What do we do if it’s not in ESPON Database? • Cross reference indicator list with National Statistics Agency
• Yes/No/Partly • If Partly, can it be re-classified by Agency?
• Create a database with the indicators for the relevant spatial scales
• National, NUTS II, NUTS III, LAU I/II • Spatial Boundaries
Gathering indicators via National Statistics or Other Research Projects
18
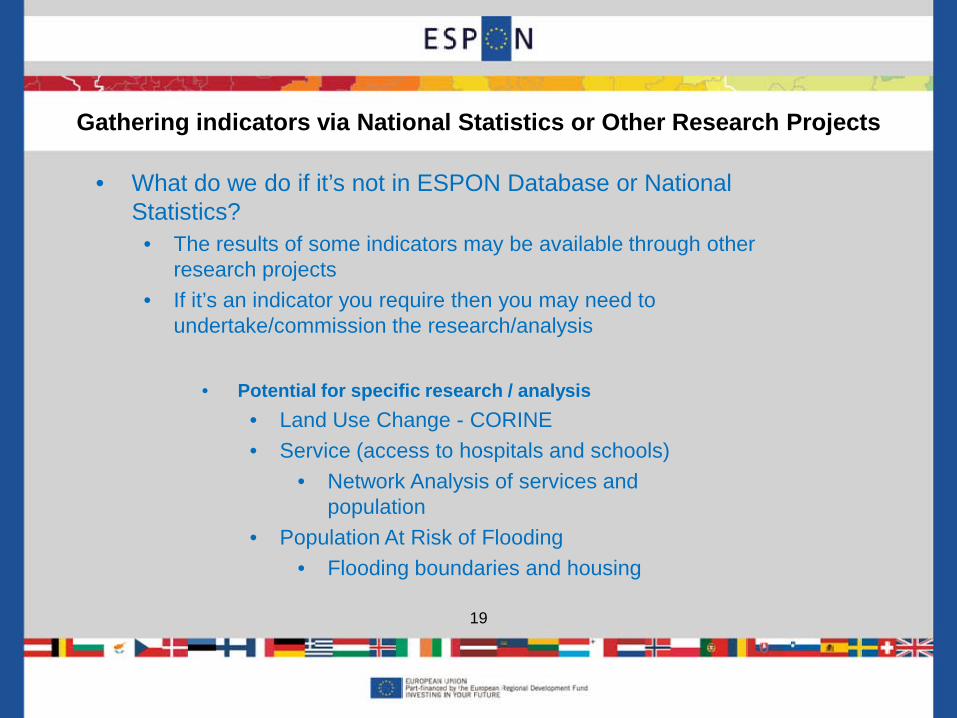
• What do we do if it’s not in ESPON Database or National Statistics?
• The results of some indicators may be available through other research projects
• If it’s an indicator you require then you may need to undertake/commission the research/analysis
Gathering indicators via National Statistics or Other Research Projects
19
• Potential for specific research / analysis • Land Use Change - CORINE • Service (access to hospitals and schools)
• Network Analysis of services and population
• Population At Risk of Flooding • Flooding boundaries and housing
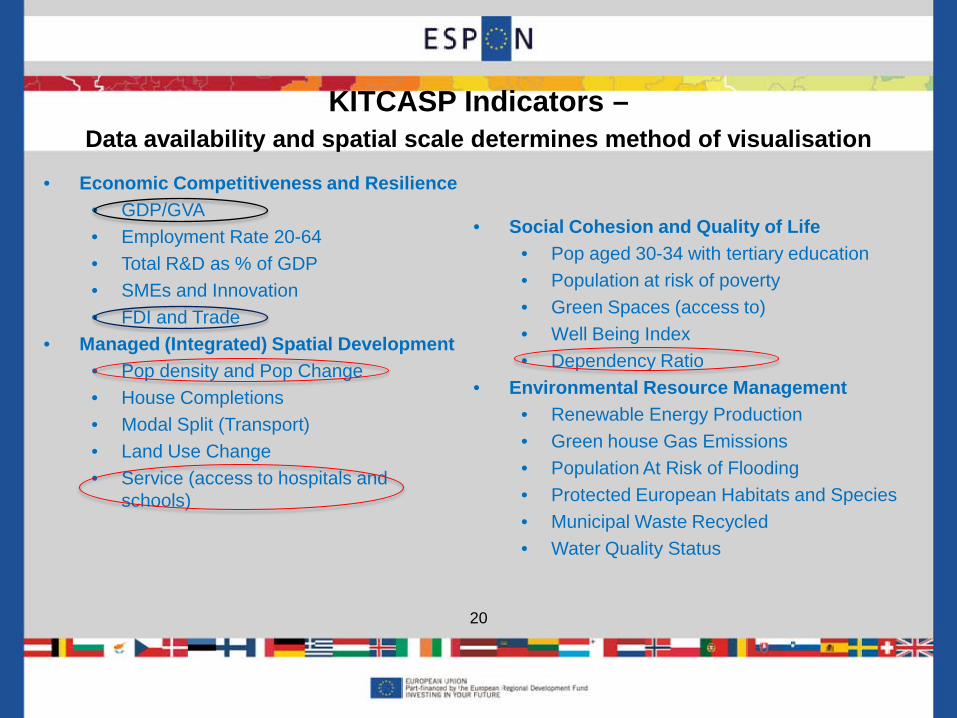
• Economic Competitiveness and Resilience • GDP/GVA • Employment Rate 20-64 • Total R&D as % of GDP • SMEs and Innovation • FDI and Trade
• Managed (Integrated) Spatial Development • Pop density and Pop Change • House Completions • Modal Split (Transport) • Land Use Change • Service (access to hospitals and
schools)
KITCASP Indicators – Data availability and spatial scale determines method of visualisation
20
• Social Cohesion and Quality of Life • Pop aged 30-34 with tertiary education • Population at risk of poverty • Green Spaces (access to) • Well Being Index • Dependency Ratio
• Environmental Resource Management • Renewable Energy Production • Green house Gas Emissions • Population At Risk of Flooding • Protected European Habitats and Species • Municipal Waste Recycled • Water Quality Status

• Regional Planning Guidelines Indicators initiative developed by Regional Planners Network (RPN)
• Need for a monitoring framework to measure progress of (RPGs) 2010-2022 • Input from KITCASP project was key to this process
• Proposed Regional Indicators • Economic Prosperity • People and Place • Environment and Infrastructure
• Methodology • RPG Aim and Objective • Proposed Indicators • Unit of Measurement • Target • Data Source • Presentation of Data: Mapping, Tables, Text
KITCASP Indicators feeding into National Monitoring and Spatial Planning Systems in Ireland
21

• Move from static reports to live monitoring systems • Annual, Quarterly updates • Time-series data
• Planners, Elected Members, Public • Share data, information through email, blogs, websites • Evidence to be used as basis for discussion and decision making
• Interactive Graphics • Unemployment (Monthly, Quarterly) • Commuting (Census)
Monitoring and Spatial Planning Systems in Ireland
22

• Partners were encouraged to supply the full datasets where possible to Irish partner to progress this work • Not necessarily a project output but we are willing to develop something
useful to display indicators • Still a beta tool to be migrated and hosted on new AIRO website in
December • Developed using in-house software at NIRSA
• Tableau • ESRI ArcGIS • Instant Atlas
• Tools developed to date are stored in All-Island Research Observatory website • Large selection of KITCASP indicators included in composite dashboards • http://www.airo.ie/spatial-indicators
Beta KITCASP Indicator System
23
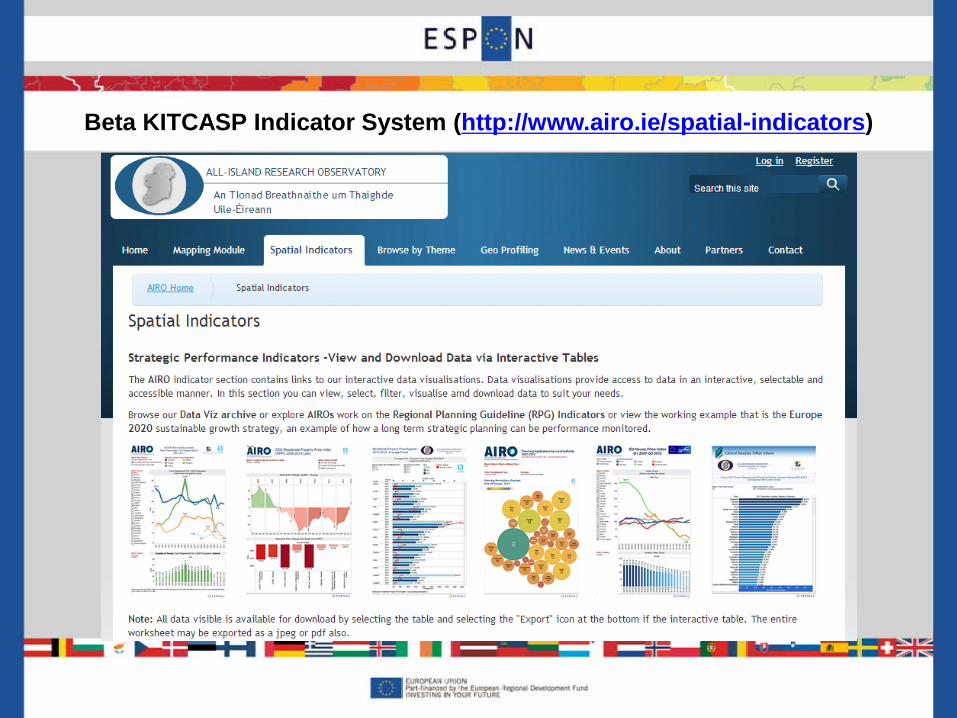
Beta KITCASP Indicator System (http://www.airo.ie/spatial-indicators)
24

Beta KITCASP Indicator System
25