key highlights - amazon web services
TRANSCRIPT
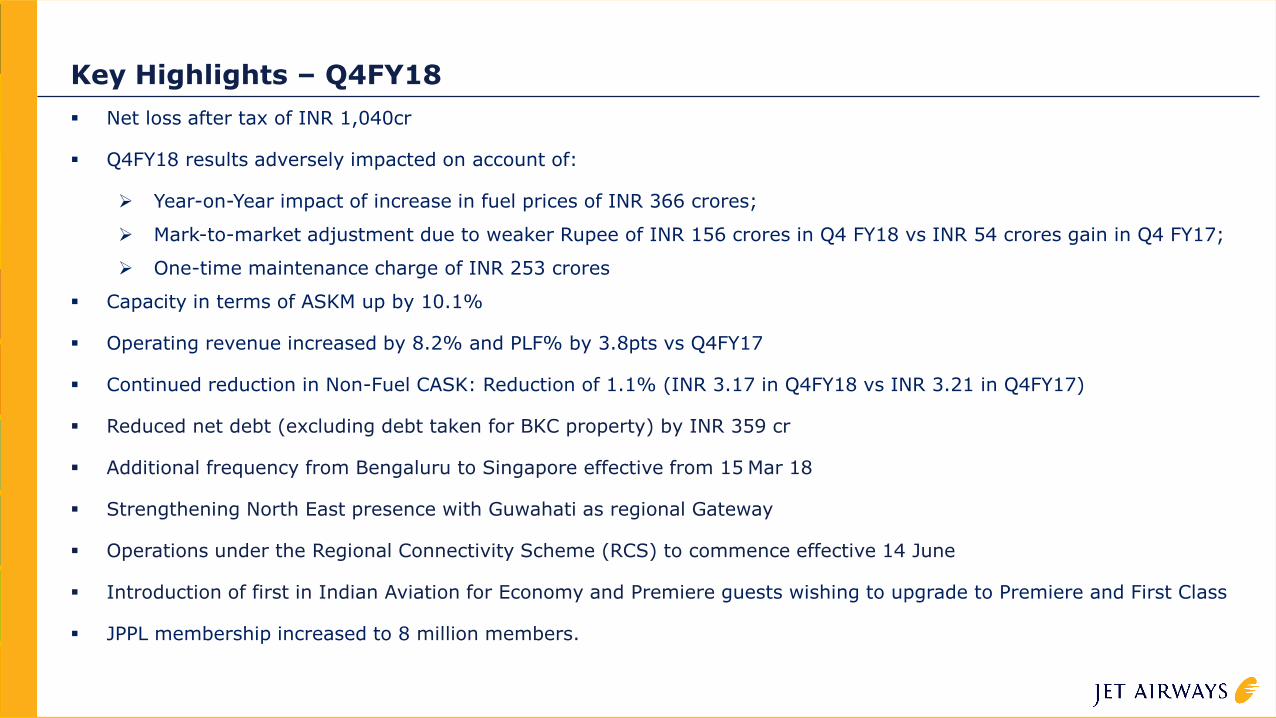
Key Highlights – Q4FY18
Net loss after tax of INR 1,040cr
Q4FY18 results adversely impacted on account of:
Year-on-Year impact of increase in fuel prices of INR 366 crores;
Mark-to-market adjustment due to weaker Rupee of INR 156 crores in Q4 FY18 vs INR 54 crores gain in Q4 FY17;
One-time maintenance charge of INR 253 crores
Capacity in terms of ASKM up by 10.1%
Operating revenue increased by 8.2% and PLF% by 3.8pts vs Q4FY17
Continued reduction in Non-Fuel CASK: Reduction of 1.1% (INR 3.17 in Q4FY18 vs INR 3.21 in Q4FY17)
Reduced net debt (excluding debt taken for BKC property) by INR 359 cr
Additional frequency from Bengaluru to Singapore effective from 15 Mar 18
Strengthening North East presence with Guwahati as regional Gateway
Operations under the Regional Connectivity Scheme (RCS) to commence effective 14 June
Introduction of first in Indian Aviation for Economy and Premiere guests wishing to upgrade to Premiere and First Class
JPPL membership increased to 8 million members.
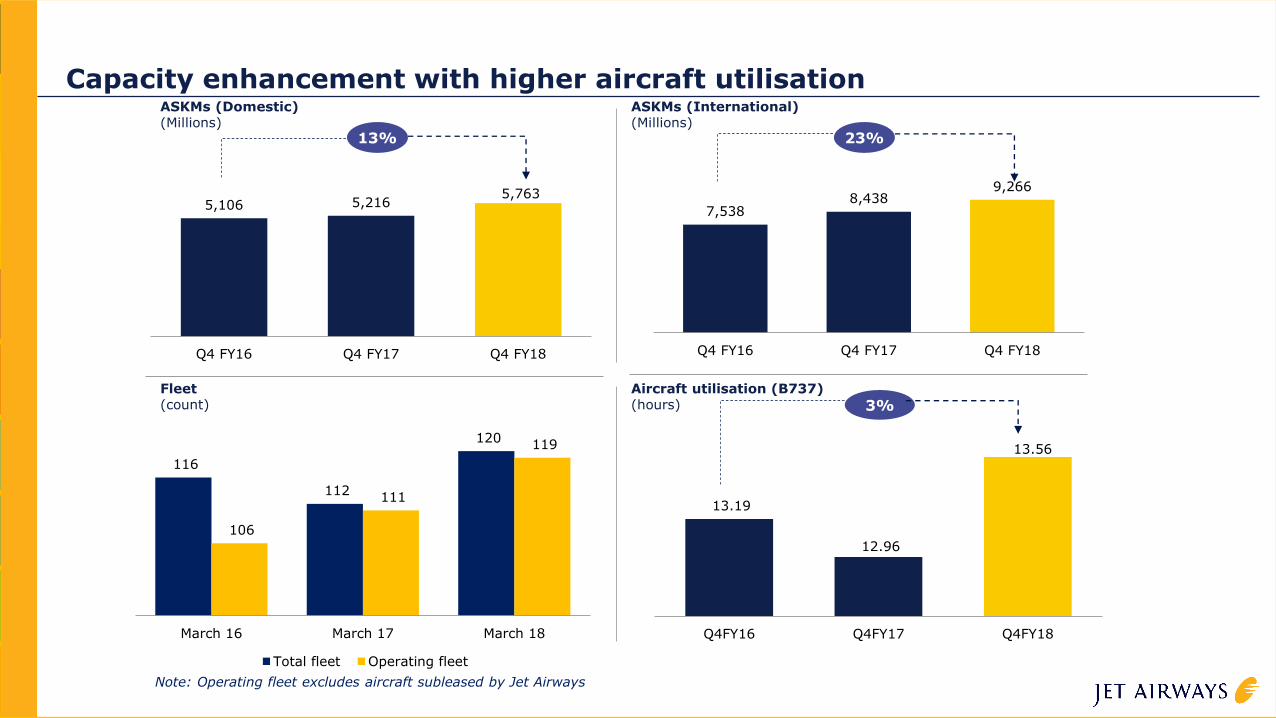
13.19
12.96
13.56
Q4FY16 Q4FY17 Q4FY18
5,106 5,216 5,763
Q4 FY16 Q4 FY17 Q4 FY18
Capacity enhancement with higher aircraft utilisationASKMs (Domestic)(Millions)
ASKMs (International)(Millions)
Fleet(count)
Aircraft utilisation (B737)(hours)
13% 23%
3%
7,538 8,438
9,266
Q4 FY16 Q4 FY17 Q4 FY18
Note: Operating fleet excludes aircraft subleased by Jet Airways
116
112
120
106
111
119
March 16 March 17 March 18
Total fleet Operating fleet

Jet Group: quarterly performanceRevenue(₹ crores)
EBT(₹ crores)
5,533
5,728
6,196
Q4 FY16 Q4 FY17 Q4 FY18
426583
(1,040)
Q4 FY16 Q4 FY17 Q4 FY18
Reconciliation of profit between previously reported (referred to as 'Indian GAAP') and Ind AS
Figures in INR Cr (Consolidated Results) Q4FY17
Net profit as per Indian GAAP 23
Exchange gain / loss and Depreciation on exchange decapitalised 391
Effect of actuarial loss on employee defined benefit plans recognised in Other Comprehensive Income 0.4
Others 169
Reversal of provision for Loss as per IGAAP on asset held for sale and additional gain on SLB of 2 B737 -
Net profit as per Ind AS 583

Quarterly Performance – Key highlights Q4FY18
15,029 mn
10.1% y-o-y
Capacity (ASKM)
₹ 6,196 cr
8.2% y-o-y
Revenue
86.8%
3.9 pts y-o-y
PLF%
₹ 4.12
0.3% y-o-y
RASK#
₹ 4.63
4.0% y-o-y
CASK*(Incl. fuel)
₹ 3.17
1.1% y-o-y
CASK (w/o fuel)
Note: Figures for Jet Group consolidated* Brent rate per Barrel at $ 66.25 in Q4FY18 vs. $ 55.48 in Q4FY17 increased by 19.4%# Excludes Non operating revenue
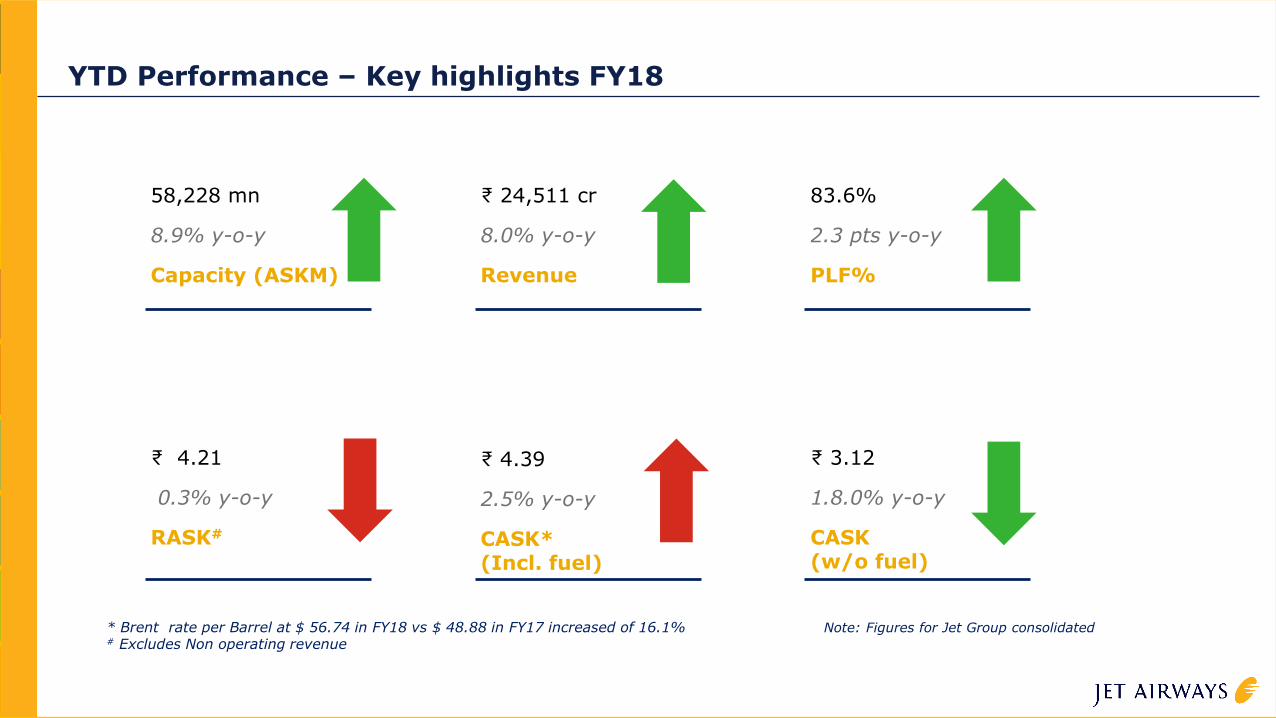
YTD Performance – Key highlights FY18
58,228 mn
8.9% y-o-y
Capacity (ASKM)
₹ 24,511 cr
8.0% y-o-y
Revenue
₹ 4.21
0.3% y-o-y
RASK#
₹ 4.39
2.5% y-o-y
CASK*(Incl. fuel)
₹ 3.12
1.8.0% y-o-y
CASK (w/o fuel)
Note: Figures for Jet Group consolidated* Brent rate per Barrel at $ 56.74 in FY18 vs $ 48.88 in FY17 increased of 16.1%# Excludes Non operating revenue
83.6%
2.3 pts y-o-y
PLF%
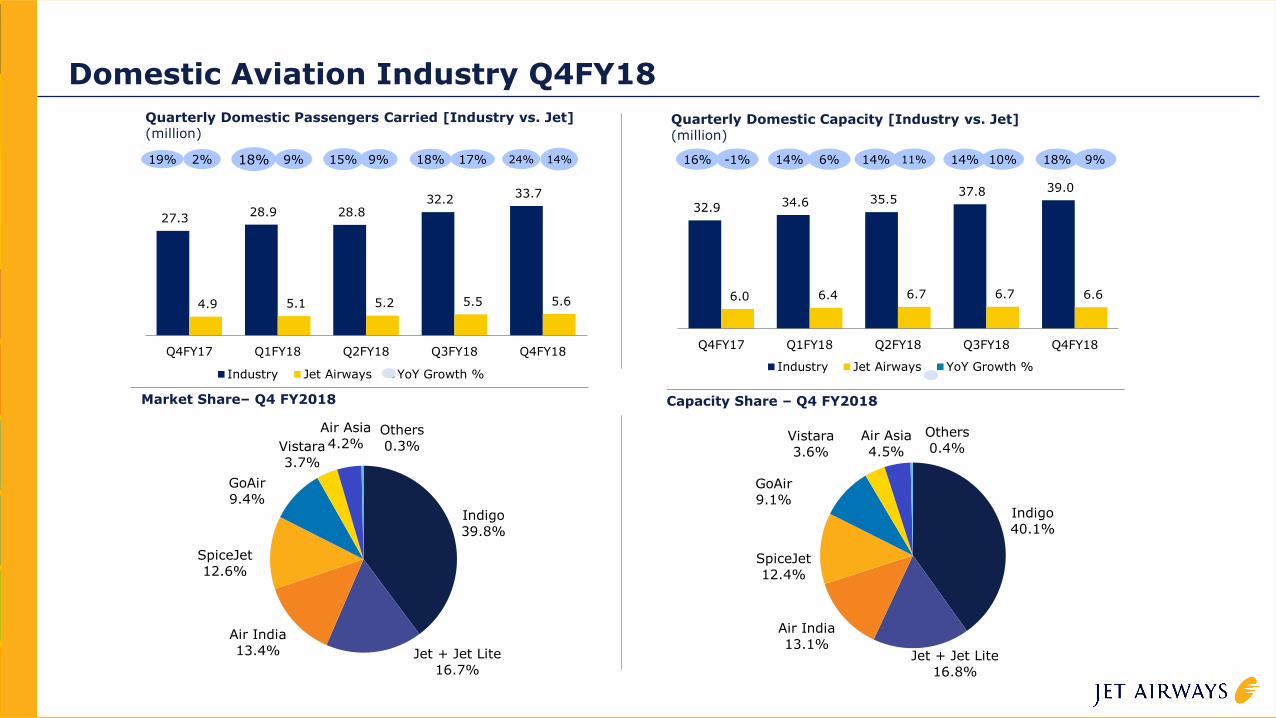
Domestic Aviation Industry Q4FY18
Indigo
40.1%
Jet + Jet Lite
16.8%
Air India
13.1%
SpiceJet
12.4%
GoAir
9.1%
Vistara
3.6%
Air Asia
4.5%
Others
0.4%
Quarterly Domestic Passengers Carried [Industry vs. Jet](million)
27.3 28.9 28.8
32.2 33.7
4.9 5.1 5.2 5.5 5.6
Q4FY17 Q1FY18 Q2FY18 Q3FY18 Q4FY18
Industry Jet Airways YoY Growth %
Capacity Share – Q4 FY2018
19% 2%
Quarterly Domestic Capacity [Industry vs. Jet](million)
32.9 34.6 35.5 37.8 39.0
6.0 6.4 6.7 6.7 6.6
Q4FY17 Q1FY18 Q2FY18 Q3FY18 Q4FY18
Industry Jet Airways YoY Growth %
16% -1%
Indigo
39.8%
Jet + Jet Lite
16.7%
Air India
13.4%
SpiceJet
12.6%
GoAir
9.4%
Vistara
3.7%
Air Asia
4.2%Others
0.3%
Market Share– Q4 FY2018
15% 9% 18% 17% 14% 11% 14% 10% 18% 9%18% 9% 14% 6%24% 14%

61.6 70.5
85.5
104.2
123.6
14.8 15.5 18.5 19.1 21.5
FY14 FY15 FY16 FY17 FY18
Industry Jet Airways YoY Growth %
Domestic Aviation Industry FY18
Indigo
39.8%
Jet + Jet Lite
18.0%
Air India
13.6%
SpiceJet
12.3%
GoAir
8.4%
Vistara
3.5%
Air Asia
4.0%
Others
0.5%
Quarterly Domestic Passengers Carried [Industry vs. Jet](million)
Capacity Share – FY2018
5% -3%
Quarterly Domestic Capacity [Industry vs. Jet](million)
89.9 94.7 107.9
127.5
146.8
22.6 21.0 23.9 24.2 26.4
FY14 FY15 FY16 FY17 FY18
Industry Jet Airways YoY Growth %
6% -2%
Indigo
39.6%
Jet + Jet Lite
17.4%
Air India
13.3%
SpiceJet
13.0%
GoAir
8.8%
Vistara
3.6%
Air Asia
4.0%Others
0.4%
Market Share– FY2018
21% 19% 22% 3% 14% 14% 18% 1% 15% 9%15% 5% 5% -7%19% 12%
Jet Group - Performance Highlights
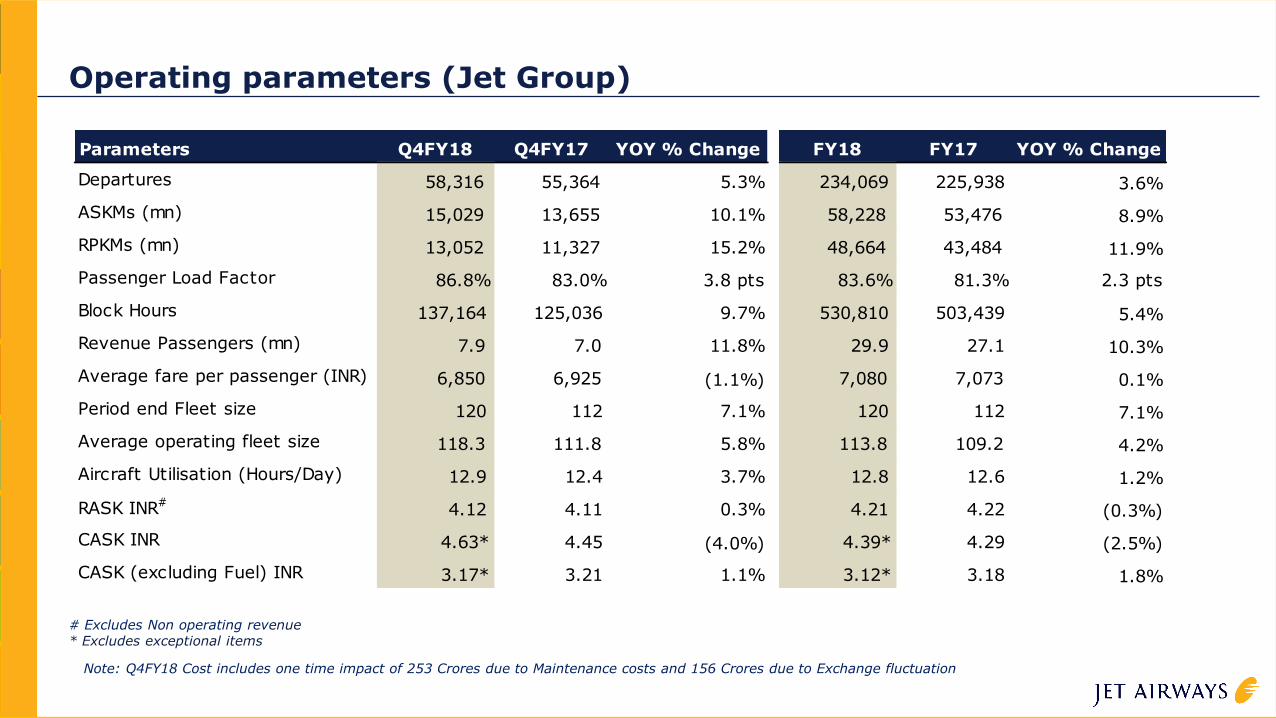
Operating parameters (Jet Group)
# Excludes Non operating revenue * Excludes exceptional items
Parameters Q4FY18 Q4FY17 YOY % Change FY18 FY17 YOY % Change
Departures 58,316 55,364 5.3% 234,069 225,938 3.6%
ASKMs (mn) 15,029 13,655 10.1% 58,228 53,476 8.9%
RPKMs (mn) 13,052 11,327 15.2% 48,664 43,484 11.9%
Passenger Load Factor 86.8% 83.0% 3.8 pts 83.6% 81.3% 2.3 pts
Block Hours 137,164 125,036 9.7% 530,810 503,439 5.4%
Revenue Passengers (mn) 7.9 7.0 11.8% 29.9 27.1 10.3%
Average fare per passenger (INR) 6,850 6,925 (1.1%) 7,080 7,073 0.1%
Period end Fleet size 120 112 7.1% 120 112 7.1%
Average operating fleet size 118.3 111.8 5.8% 113.8 109.2 4.2%
Aircraft Utilisation (Hours/Day) 12.9 12.4 3.7% 12.8 12.6 1.2%
RASK INR# 4.12 4.11 0.3% 4.21 4.22 (0.3%)
CASK INR 4.63* 4.45 (4.0%) 4.39* 4.29 (2.5%)
CASK (excluding Fuel) INR 3.17* 3.21 1.1% 3.12* 3.18 1.8%
Note: Q4FY18 Cost includes one time impact of 253 Crores due to Maintenance costs and 156 Crores due to Exchange fluctuation
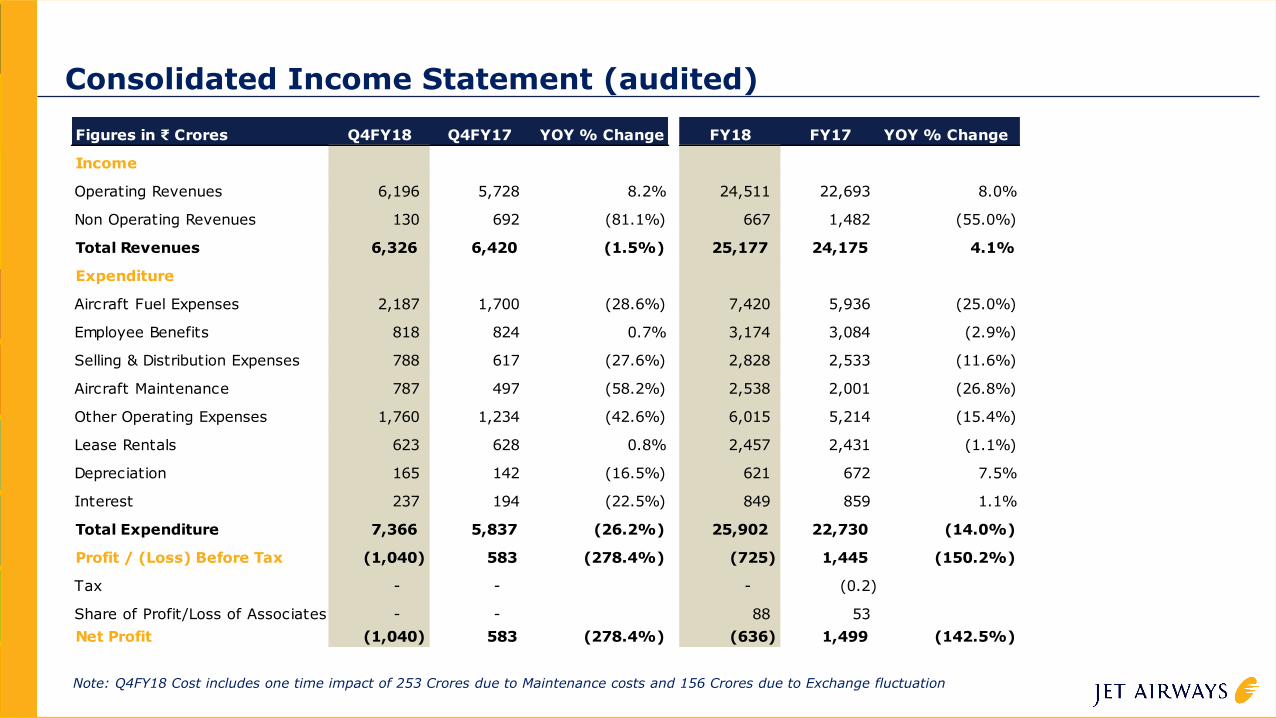
Consolidated Income Statement (audited)
Note: Q4FY18 Cost includes one time impact of 253 Crores due to Maintenance costs and 156 Crores due to Exchange fluctuation
Figures in ₹ Crores Q4FY18 Q4FY17 YOY % Change FY18 FY17 YOY % Change
Income
Operating Revenues 6,196 5,728 8.2% 24,511 22,693 8.0%
Non Operating Revenues 130 692 (81.1%) 667 1,482 (55.0%)
Total Revenues 6,326 6,420 (1.5%) 25,177 24,175 4.1%
Expenditure
Aircraft Fuel Expenses 2,187 1,700 (28.6%) 7,420 5,936 (25.0%)
Employee Benefits 818 824 0.7% 3,174 3,084 (2.9%)
Selling & Distribution Expenses 788 617 (27.6%) 2,828 2,533 (11.6%)
Aircraft Maintenance 787 497 (58.2%) 2,538 2,001 (26.8%)
Other Operating Expenses 1,760 1,234 (42.6%) 6,015 5,214 (15.4%)
Lease Rentals 623 628 0.8% 2,457 2,431 (1.1%)
Depreciation 165 142 (16.5%) 621 672 7.5%
Interest 237 194 (22.5%) 849 859 1.1%
Total Expenditure 7,366 5,837 (26.2%) 25,902 22,730 (14.0%)
Profit / (Loss) Before Tax (1,040) 583 (278.4%) (725) 1,445 (150.2%)
Tax - - - (0.2)
Share of Profit/Loss of Associates - - 88 53
Net Profit (1,040) 583 (278.4%) (636) 1,499 (142.5%)
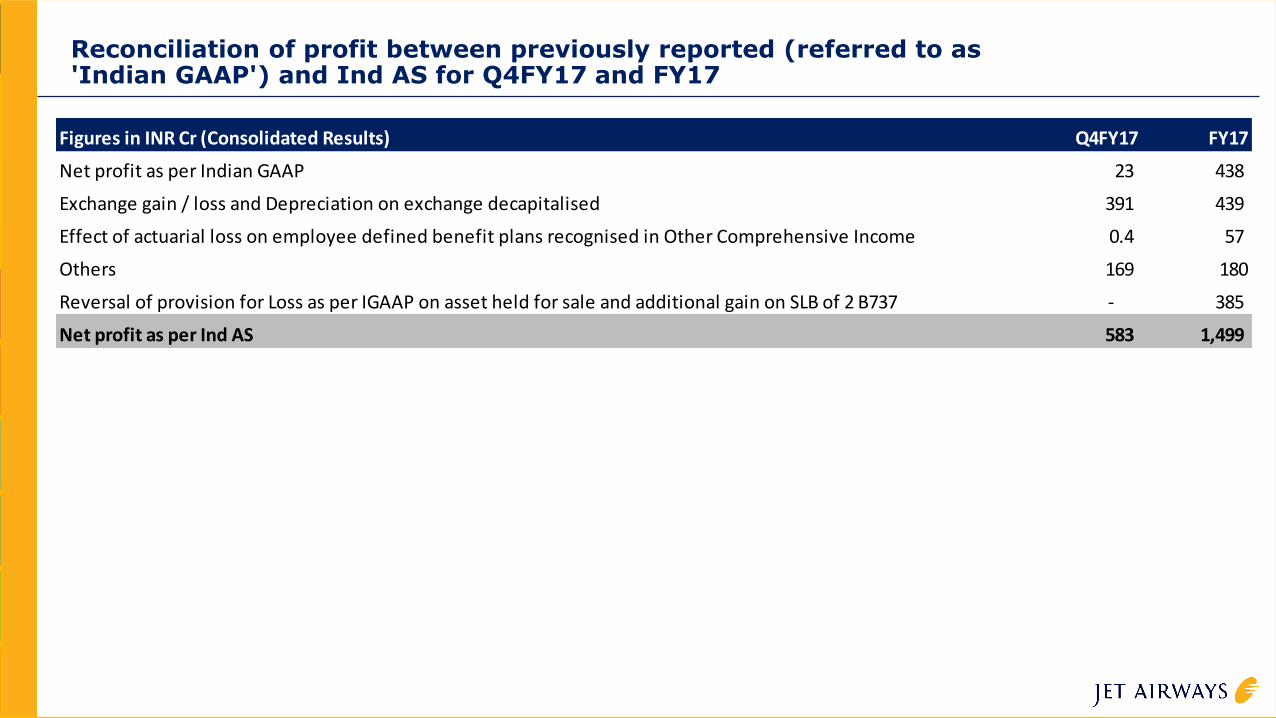
Reconciliation of profit between previously reported (referred to as 'Indian GAAP') and Ind AS for Q4FY17 and FY17
Figures in INR Cr (Consolidated Results) Q4FY17 FY17
Net profit as per Indian GAAP 23 438
Exchange gain / loss and Depreciation on exchange decapitalised 391 439
Effect of actuarial loss on employee defined benefit plans recognised in Other Comprehensive Income 0.4 57
Others 169 180
Reversal of provision for Loss as per IGAAP on asset held for sale and additional gain on SLB of 2 B737 - 385
Net profit as per Ind AS 583 1,499
Jet Airways - Standalone Performance Highlights

Standalone Jet Airways Income Statement (audited)
Figures in ₹ Crores Q4FY18 Q4FY17 YOY % Change FY18 FY17 YOY % Change
Income
Operating Revenues 5,925 5,449 8.7% 23,287 21,552 8.0%
Non Operating Revenues 130 822 (84.1%) 672 1,489 (54.9%)
Total Revenues 6,055 6,271 (3.4%) 23,958 23,041 4.0%
Expenditure
Aircraft Fuel Expenses 2,063 1,581 (30.5%) 6,953 5,474 (27.0%)
Employee Benefits 773 778 0.7% 2,995 2,890 (3.6%)
Selling & Distribution Expenses 788 617 (27.7%) 2,826 2,531 (11.7%)
Aircraft Maintenance 751 483 (55.7%) 2,375 1,944 (22.2%)
Other Operating Expenses 1,728 1,282 (34.7%) 5,796 4,920 (17.8%)
Lease Rentals 587 591 0.7% 2,316 2,278 (1.7%)
Depreciation 165 143 (15.4%) 621 671 7.5%
Interest 236 193 (22.1%) 843 851 1.0%
Total Expenditure 7,091 5,669 (25.1%) 24,726 21,559 (14.7%)
Profit / (Loss) Before Tax (1,036) 602 (272.0%) (768) 1,482 (151.8%)
Tax - - - (0.20)
Net Profit (1,036) 602 (272.0%) (768) 1,483 (151.8%)
Note: Q4FY18 Cost includes one time impact of 210 Crores due to Maintenance costs and 156 Crores due to Exchange fluctuation

Certain statements in this release concerning Jet Airways’ future growth prospects are forward-looking statements, which involve a number of risks, and uncertainties that could cause actual results to differ
materially from those in such forward-looking statements. The risks and uncertainties relating to these statements include, but are not limited to, risks and uncertainties regarding fluctuations in earnings, our ability
to manage growth, intense competition in the aviation business including those factors which may affect our cost advantage, wage increases, our ability to attract and retain professionals, time and cost overruns on
various parameters, our ability to manage our international operations, liability for damages, withdrawal of governmental fiscal incentives, political instability, legal restrictions on raising capital, and general economic
conditions affecting our industry. Jet Airways may, from time to time, make additional written and oral forward-looking statements, including our reports to shareholders. Jet Airways does not undertake to update any
forward-looking statement that may be made from time to time by or on behalf of the company.
Disclaimer