key formulation challenges of protein (mab) drugs
TRANSCRIPT
Key Formulation Challenges of protein
(mAb) drugs
Sandeep Nema, PhD
Pfizer
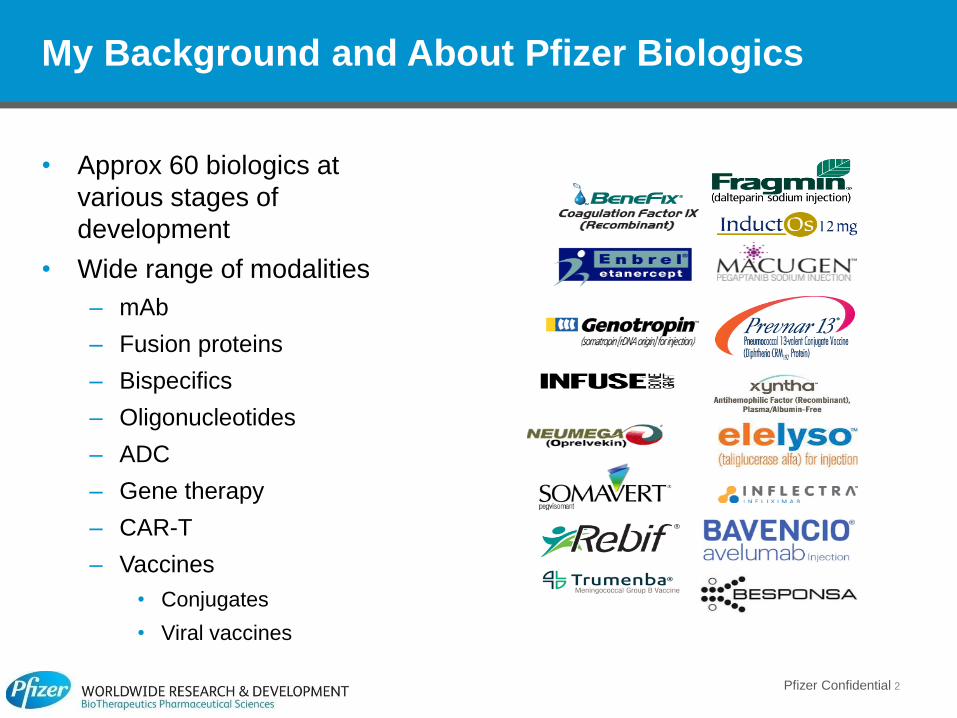
My Background and About Pfizer Biologics
• Approx 60 biologics at
various stages of
development
• Wide range of modalities
– mAb
– Fusion proteins
– Bispecifics
– Oligonucleotides
– ADC
– Gene therapy
– CAR-T
– Vaccines
• Conjugates
• Viral vaccines
Pfizer Confidential 2
Outline
Part I (Formulation)
• Components of mAb Formulation
• Key considerations
– Buffer choice
– Freezing and thawing (storage)
• Role of crystalline vs amorphous state
– Surfactant benefits (or not)
• Developing high concentration mAb formulation
Part II (Process)
• Basics of Freeze-drying
Pfizer Confidential 3

Pfizer Confidential 4
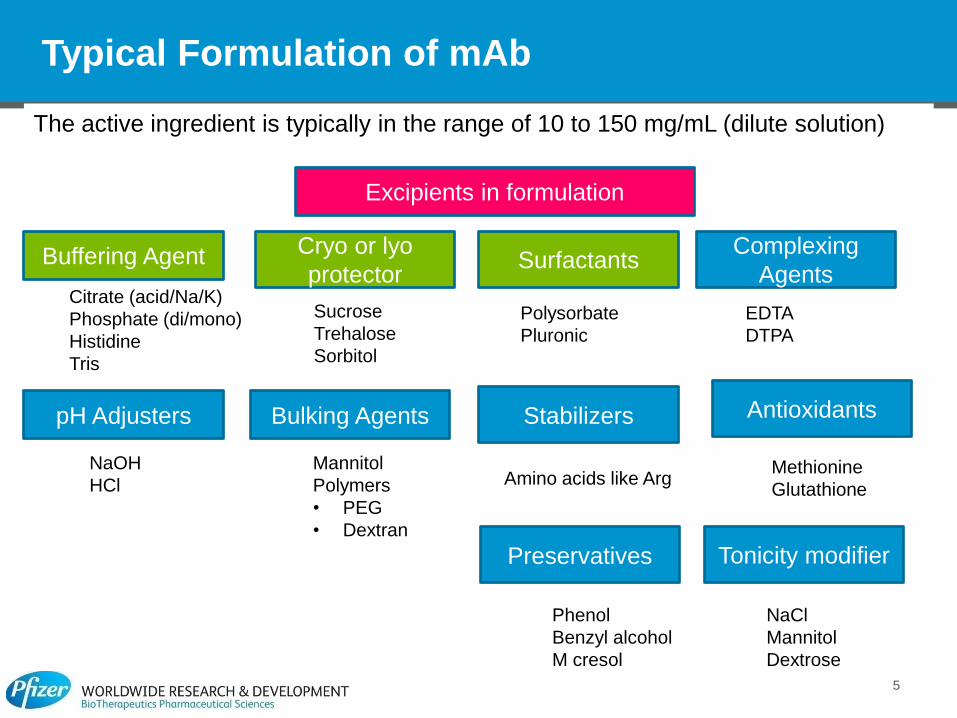
Typical Formulation of mAb
The active ingredient is typically in the range of 10 to 150 mg/mL (dilute solution)
5
Excipients in formulation
Buffering Agent
pH Adjusters
Cryo or lyo
protector
Sucrose
Trehalose
Sorbitol
Citrate (acid/Na/K)
Phosphate (di/mono)
Histidine
Tris
NaOH
HCl
Bulking Agents
Mannitol
Polymers
• PEG
• Dextran
Surfactants Complexing
Agents
Antioxidants Stabilizers
Polysorbate
Pluronic
EDTA
DTPA
Amino acids like Arg Methionine
Glutathione
Tonicity modifier
NaCl
Mannitol
Dextrose
Preservatives
Phenol
Benzyl alcohol
M cresol
11/16/2017 Parenteral Formulation 6
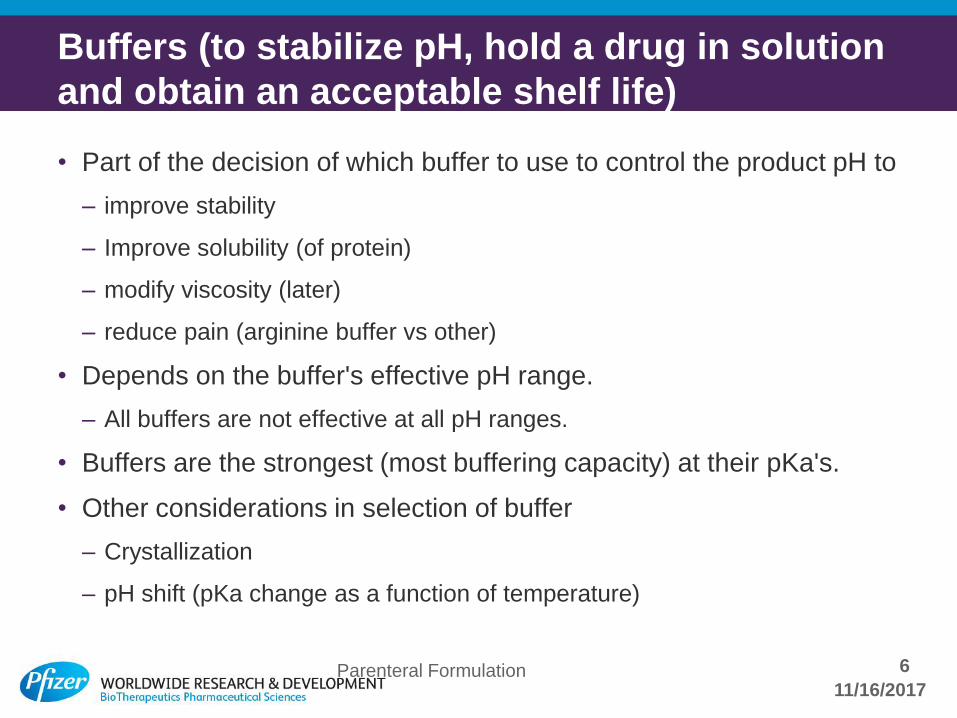
Buffers (to stabilize pH, hold a drug in solution
and obtain an acceptable shelf life)
• Part of the decision of which buffer to use to control the product pH to
– improve stability
– Improve solubility (of protein)
– modify viscosity (later)
– reduce pain (arginine buffer vs other)
• Depends on the buffer's effective pH range.
– All buffers are not effective at all pH ranges.
• Buffers are the strongest (most buffering capacity) at their pKa's.
• Other considerations in selection of buffer
– Crystallization
– pH shift (pKa change as a function of temperature)
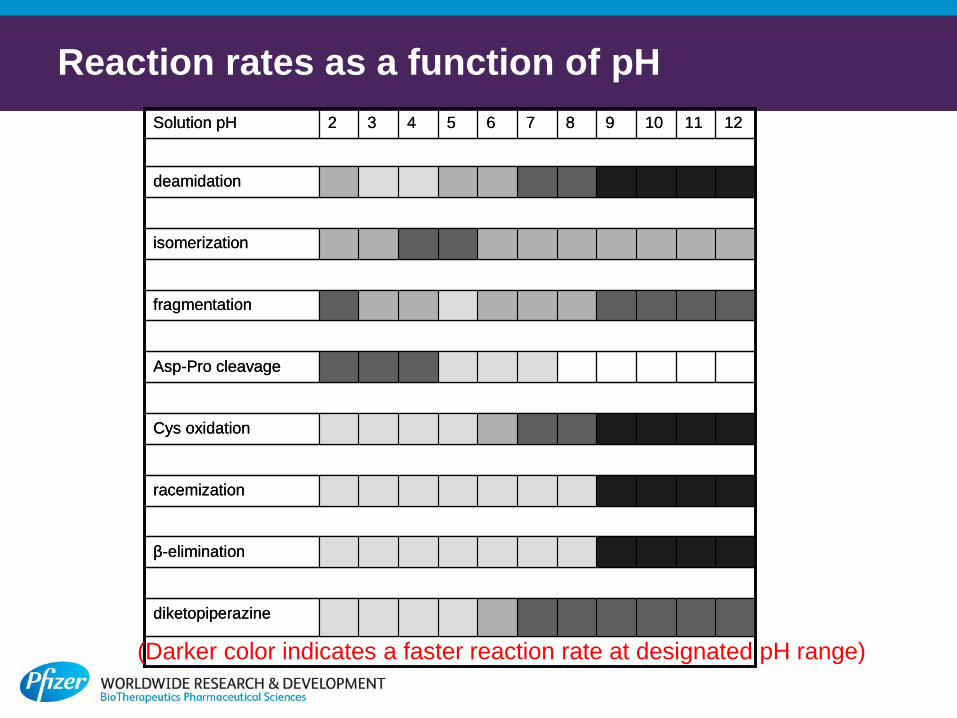
Reaction rates as a function of pH
7
diketopiperazine
β-elimination
racemization
Cys oxidation
Asp-Pro cleavage
fragmentation
isomerization
deamidation
12111098765432Solution pH
diketopiperazine
β-elimination
racemization
Cys oxidation
Asp-Pro cleavage
fragmentation
isomerization
deamidation
12111098765432Solution pH
(Darker color indicates a faster reaction rate at designated pH range)
11/16/2017 Parenteral Formulation 8
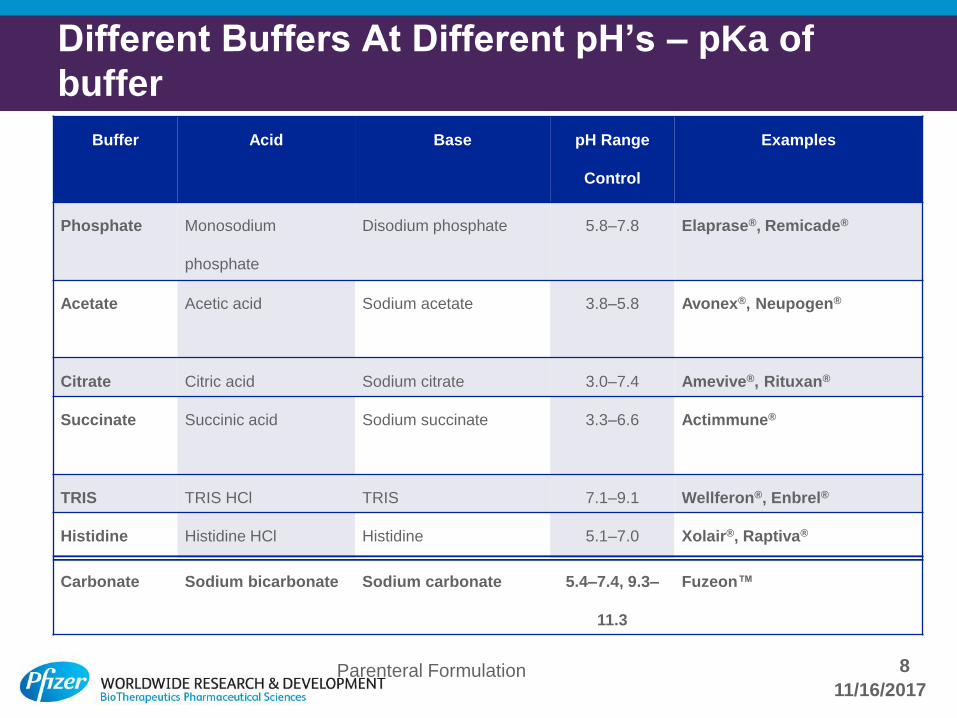
Different Buffers At Different pH’s – pKa of
buffer
Buffer Acid Base pH Range
Control
Examples
Phosphate Monosodium
phosphate
Disodium phosphate 5.8–7.8 Elaprase®, Remicade®
Acetate Acetic acid Sodium acetate 3.8–5.8 Avonex®, Neupogen®
Citrate Citric acid Sodium citrate 3.0–7.4 Amevive®, Rituxan®
Succinate Succinic acid Sodium succinate 3.3–6.6 Actimmune®
TRIS TRIS HCl TRIS 7.1–9.1 Wellferon®, Enbrel®
Histidine Histidine HCl Histidine 5.1–7.0 Xolair®, Raptiva®
Carbonate Sodium bicarbonate Sodium carbonate 5.4–7.4, 9.3–
11.3
Fuzeon™
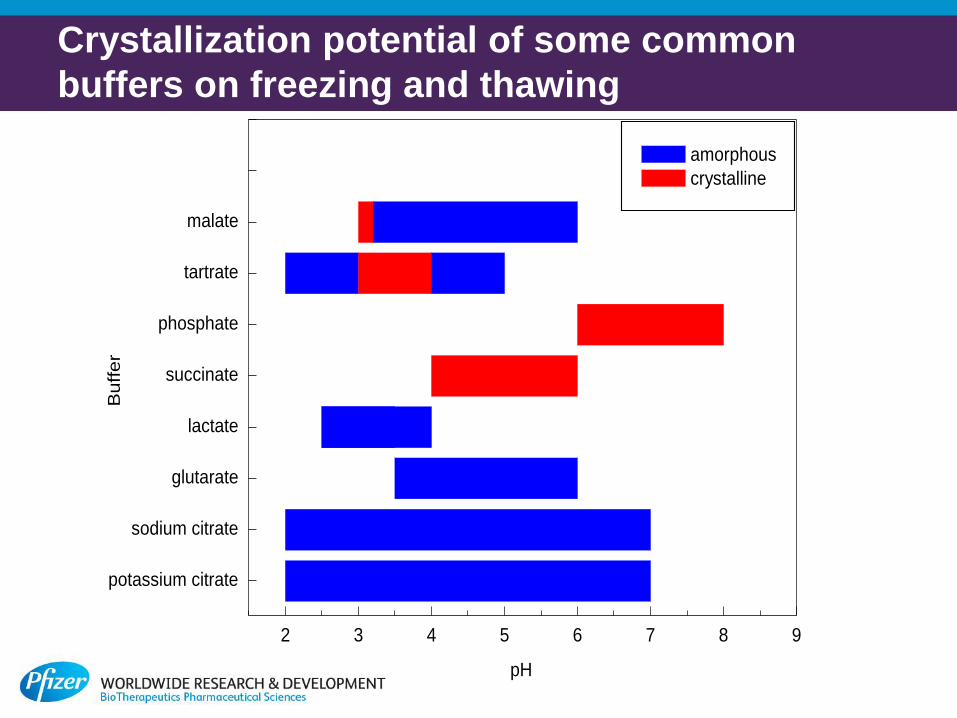
Crystallization potential of some common
buffers on freezing and thawing
9
potassium citrate
sodium citrate
glutarate
lactate
succinate
phosphate
tartrate
malate
2 3 4 5 6 7 8 9
amorphous
crystalline
pH
Buffer
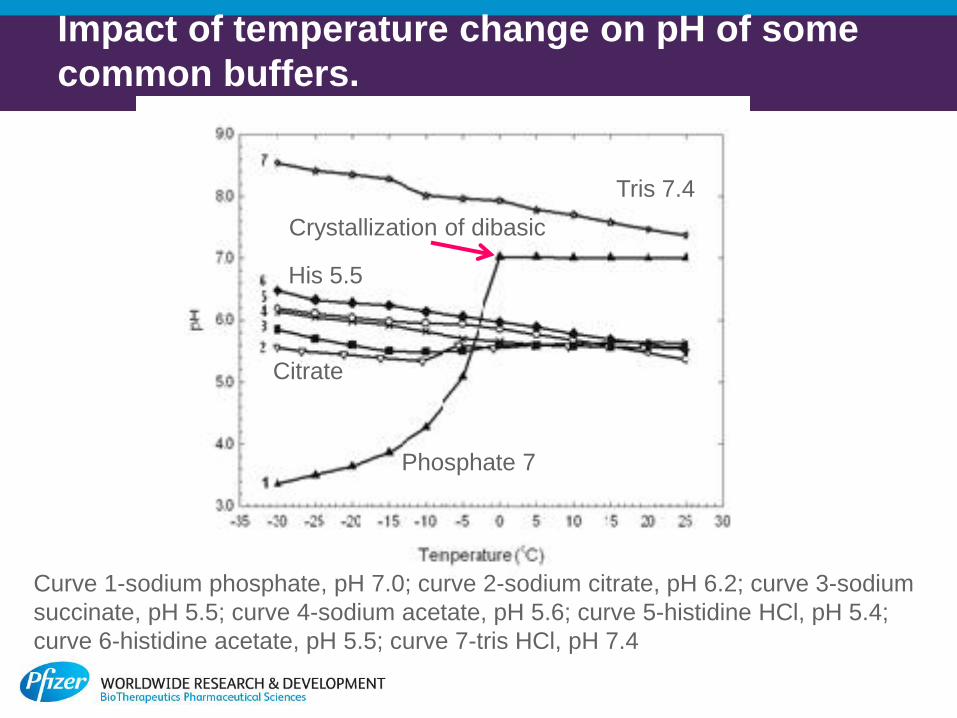
Curve 1-sodium phosphate, pH 7.0; curve 2-sodium citrate, pH 6.2; curve 3-sodium
succinate, pH 5.5; curve 4-sodium acetate, pH 5.6; curve 5-histidine HCl, pH 5.4;
curve 6-histidine acetate, pH 5.5; curve 7-tris HCl, pH 7.4
10
Impact of temperature change on pH of some
common buffers.
Crystallization of dibasic
Tris 7.4
His 5.5
Phosphate 7
Citrate
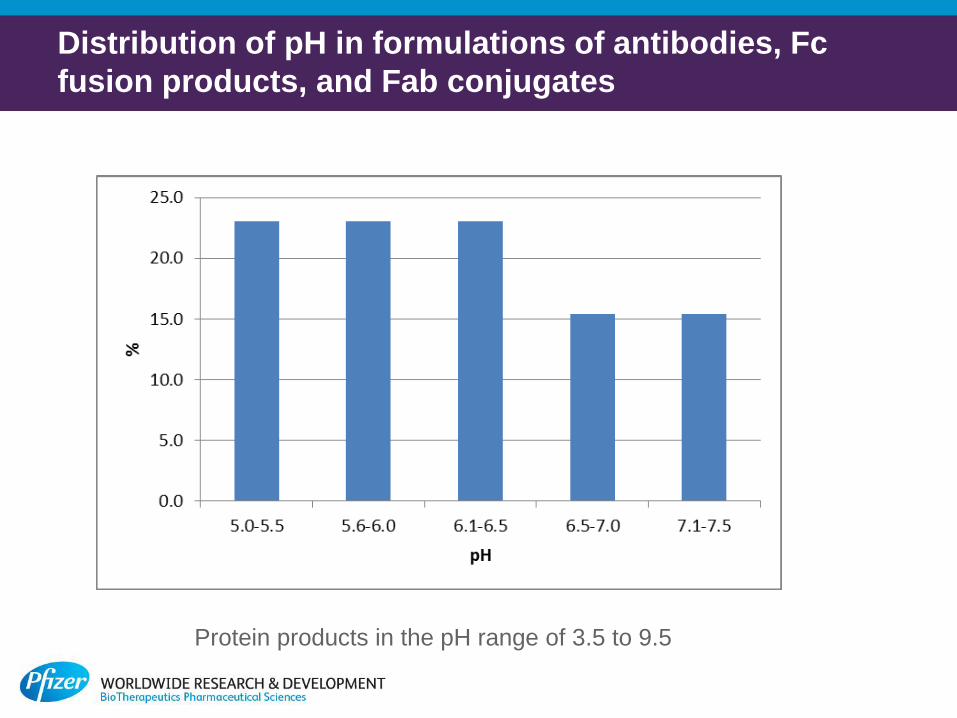
Distribution of pH in formulations of antibodies, Fc
fusion products, and Fab conjugates
11
Protein products in the pH range of 3.5 to 9.5
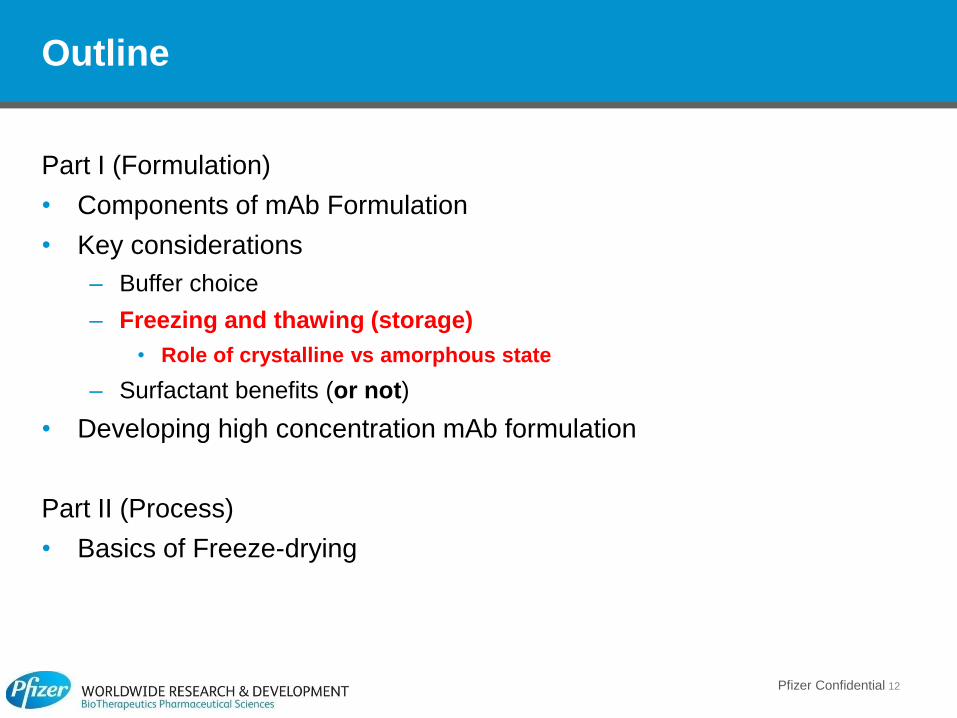
Outline
Part I (Formulation)
• Components of mAb Formulation
• Key considerations
– Buffer choice
– Freezing and thawing (storage)
• Role of crystalline vs amorphous state
– Surfactant benefits (or not)
• Developing high concentration mAb formulation
Part II (Process)
• Basics of Freeze-drying
Pfizer Confidential 12
BioTx Pharmaceutical Sciences 13
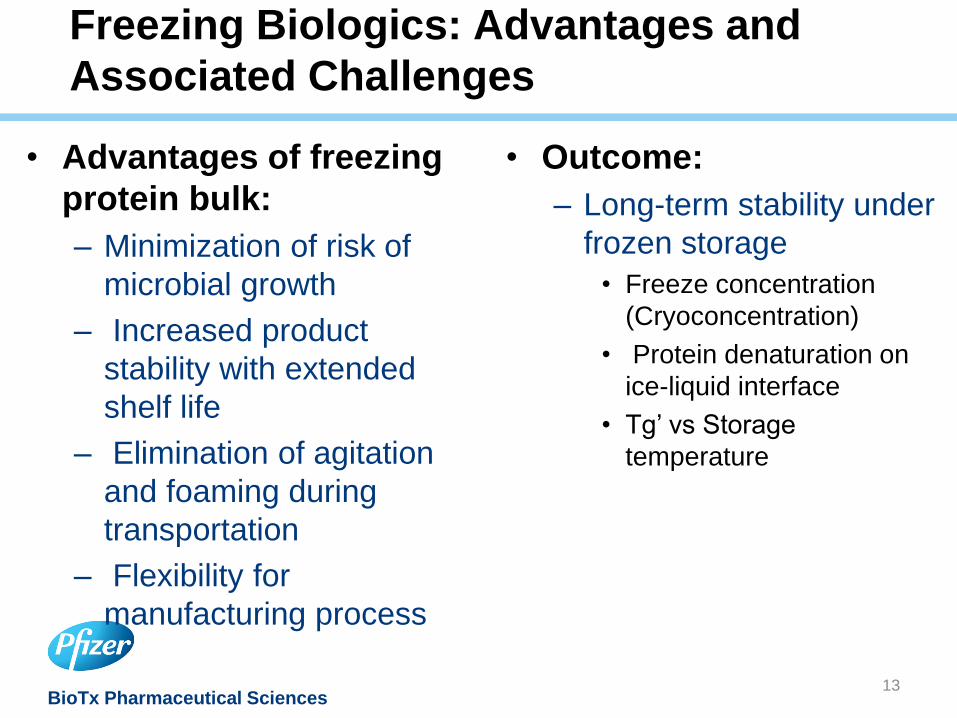
Freezing Biologics: Advantages and
Associated Challenges
• Advantages of freezing
protein bulk:
– Minimization of risk of
microbial growth
– Increased product
stability with extended
shelf life
– Elimination of agitation
and foaming during
transportation
– Flexibility for
manufacturing process
• Outcome:
– Long-term stability under
frozen storage
• Freeze concentration
(Cryoconcentration)
• Protein denaturation on
ice-liquid interface
• Tg’ vs Storage
temperature
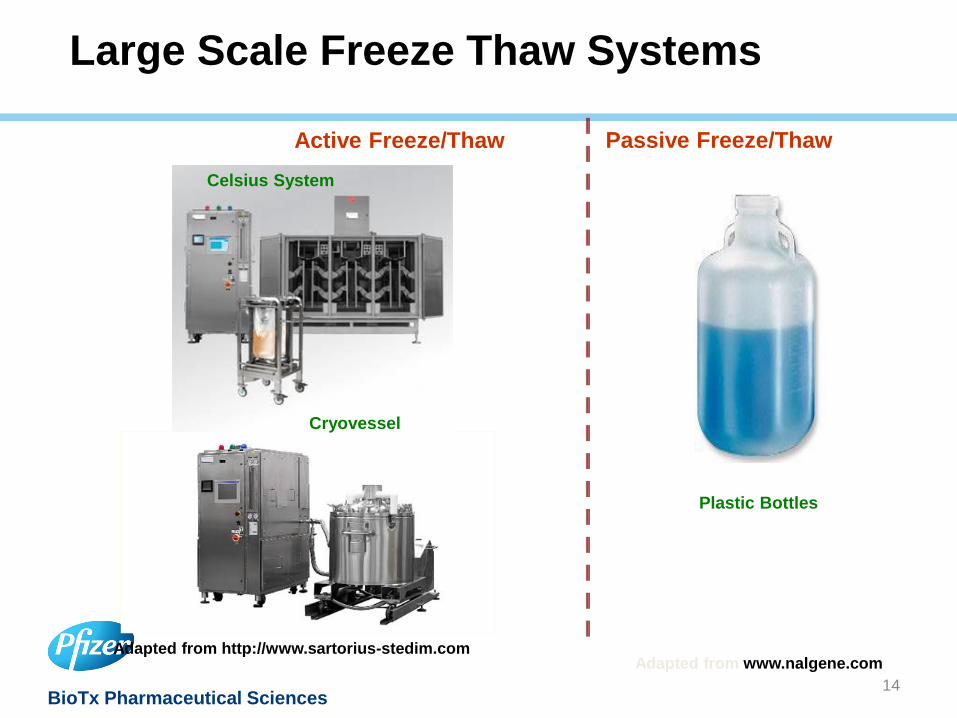
BioTx Pharmaceutical Sciences 14
Passive Freeze/Thaw Active Freeze/Thaw
Celsius System
Cryovessel
Adapted from http://www.sartorius-stedim.com
Plastic Bottles
Adapted from www.nalgene.com
Large Scale Freeze Thaw Systems
BioTx Pharmaceutical Sciences
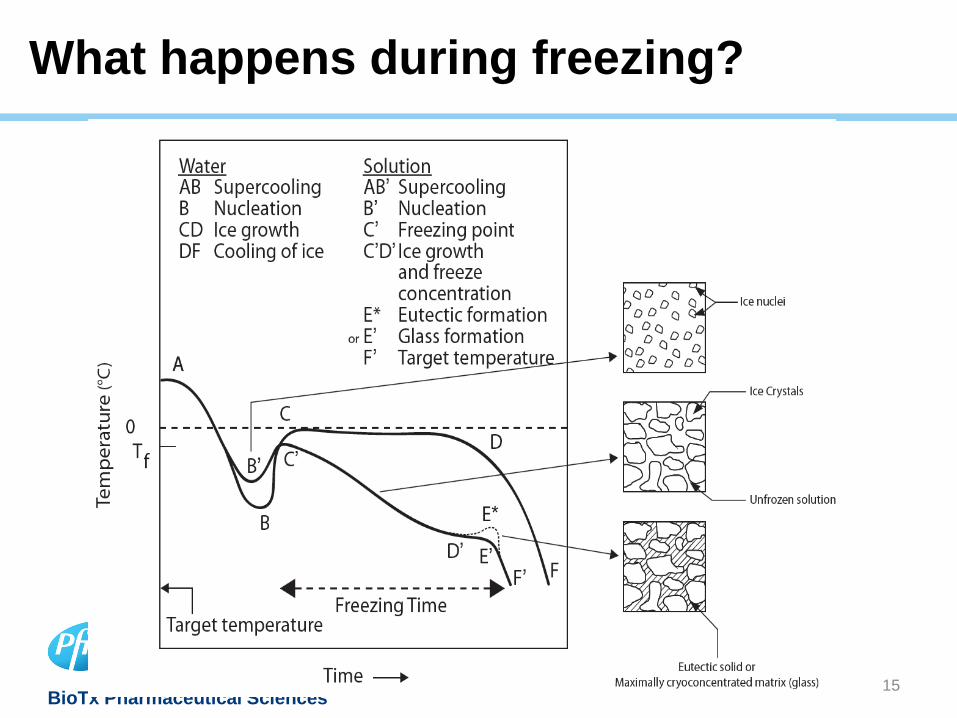
What happens during freezing?
15
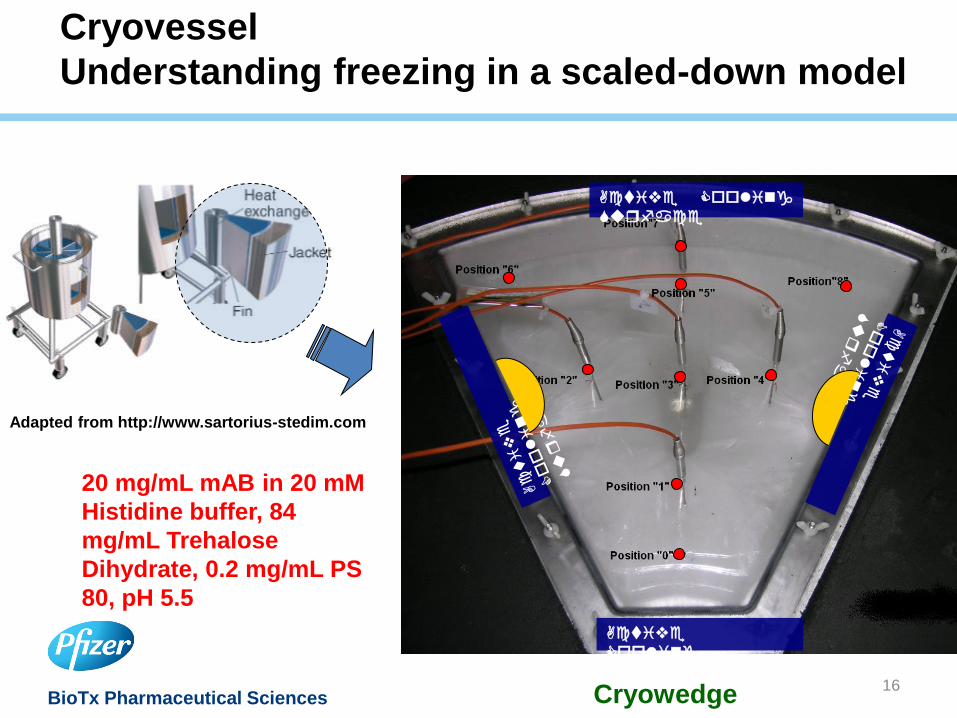
BioTx Pharmaceutical Sciences 16
Adapted from http://www.sartorius-stedim.com
Cryovessel
Understanding freezing in a scaled-down model
Active
Cooling
Surface
Active Cooling
Surface
Cryowedge
20 mg/mL mAB in 20 mM
Histidine buffer, 84
mg/mL Trehalose
Dihydrate, 0.2 mg/mL PS
80, pH 5.5
BioTx Pharmaceutical Sciences 17
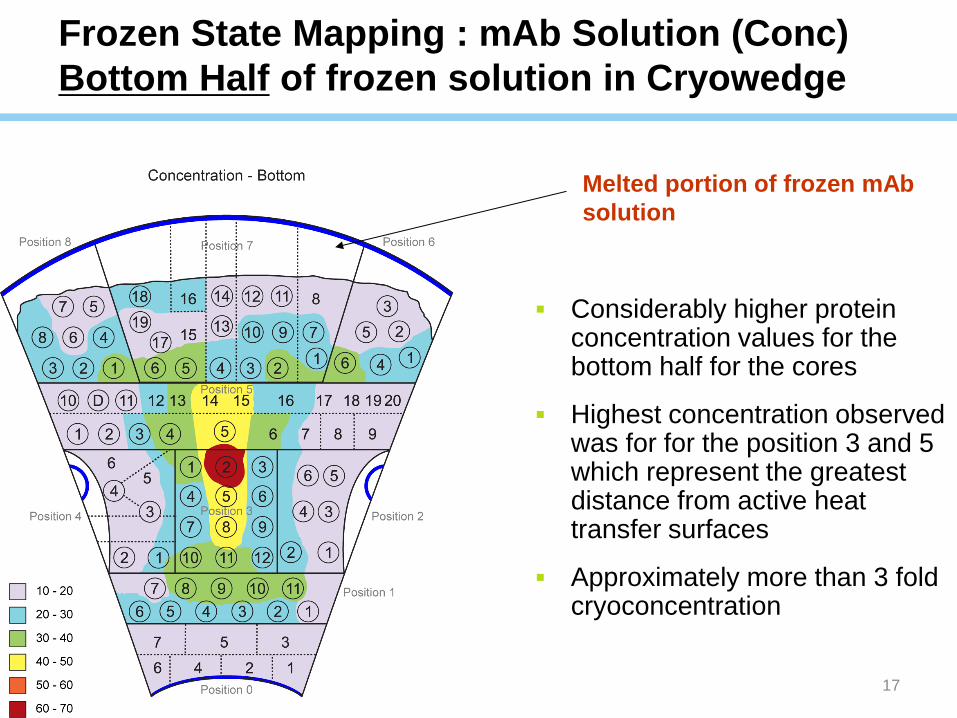
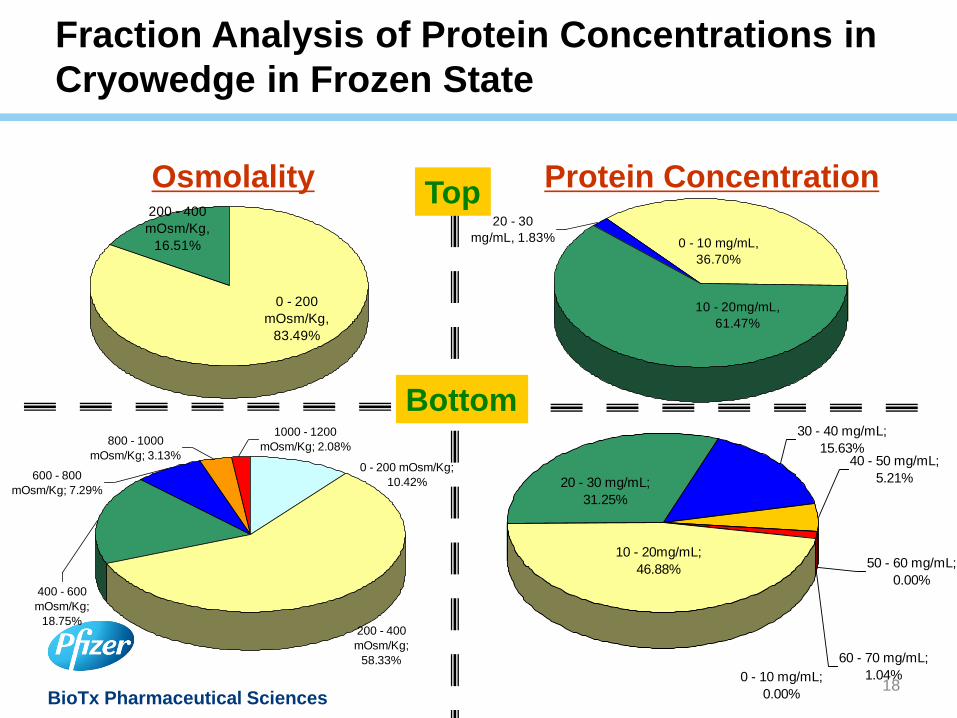
Frozen State Mapping : mAb Solution (Conc)
Bottom Half of frozen solution in Cryowedge
Considerably higher protein concentration values for the bottom half for the cores
Highest concentration observed was for for the position 3 and 5 which represent the greatest distance from active heat transfer surfaces
Approximately more than 3 fold cryoconcentration
Melted portion of frozen mAb
solution
BioTx Pharmaceutical Sciences 18
Fraction Analysis of Protein Concentrations in
Cryowedge in Frozen State
1000 - 1200
mOsm/Kg; 2.08%800 - 1000
mOsm/Kg; 3.13%
600 - 800
mOsm/Kg; 7.29%
400 - 600
mOsm/Kg;
18.75%200 - 400
mOsm/Kg;
58.33%
0 - 200 mOsm/Kg;
10.42%
40 - 50 mg/mL;
5.21%
50 - 60 mg/mL;
0.00%
0 - 10 mg/mL;
0.00%
60 - 70 mg/mL;
1.04%
30 - 40 mg/mL;
15.63%
20 - 30 mg/mL;
31.25%
10 - 20mg/mL;
46.88%
Bottom
0 - 200
mOsm/Kg,
83.49%
200 - 400
mOsm/Kg,
16.51% 0 - 10 mg/mL,
36.70%
10 - 20mg/mL,
61.47%
20 - 30
mg/mL, 1.83%
Top Osmolality Protein Concentration
BioTx Pharmaceutical Sciences 19
-10°C
Protein Conc (mg/mL)
0 10 20 30 40 50 60
Solu
ble
Aggre
gate
s (
%)
0
1
2
3
4
5
Initial
3 month
6 month
12 month
-20°C
Protein Conc (mg/mL)
0 10 20 30 40 50 60
So
lub
le A
gg
reg
ate
s (
%)
0
1
2
3
4
5
-40°C
Protein Conc (mg/mL)
0 10 20 30 40 50 60
So
lub
le A
gg
reg
ate
s (
%)
0
1
2
3
4
5
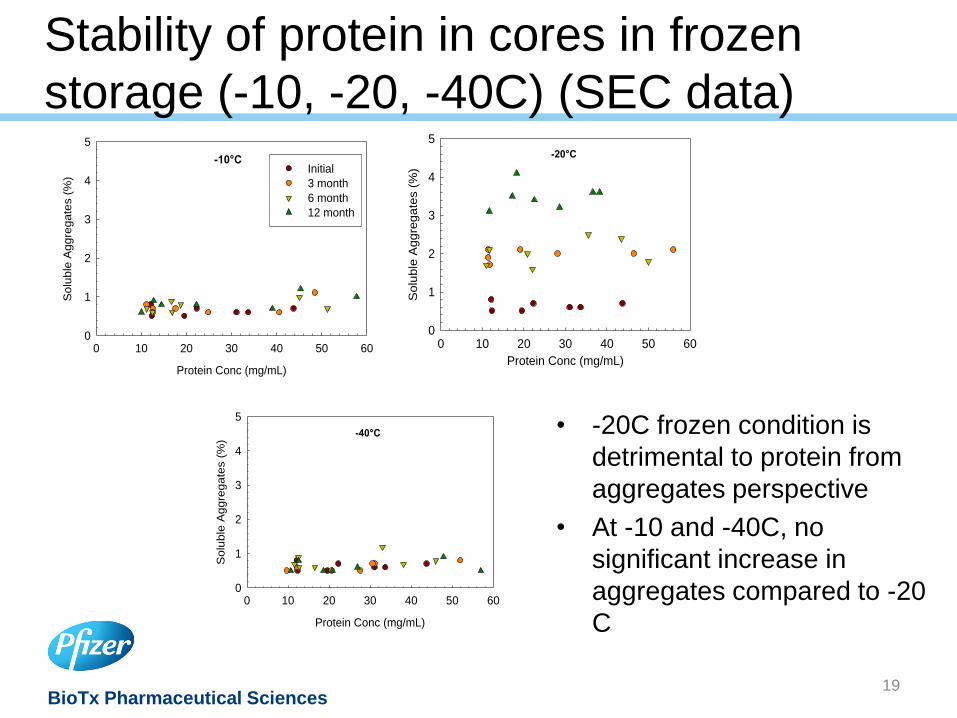
Stability Under Frozen Conditions
• -20C frozen condition is
detrimental to protein from
aggregates perspective
• At -10 and -40C, no
significant increase in
aggregates compared to -20
C
Stability of protein in cores in frozen
storage (-10, -20, -40C) (SEC data)
Worldwide Pharmaceutical Sciences
Biologics
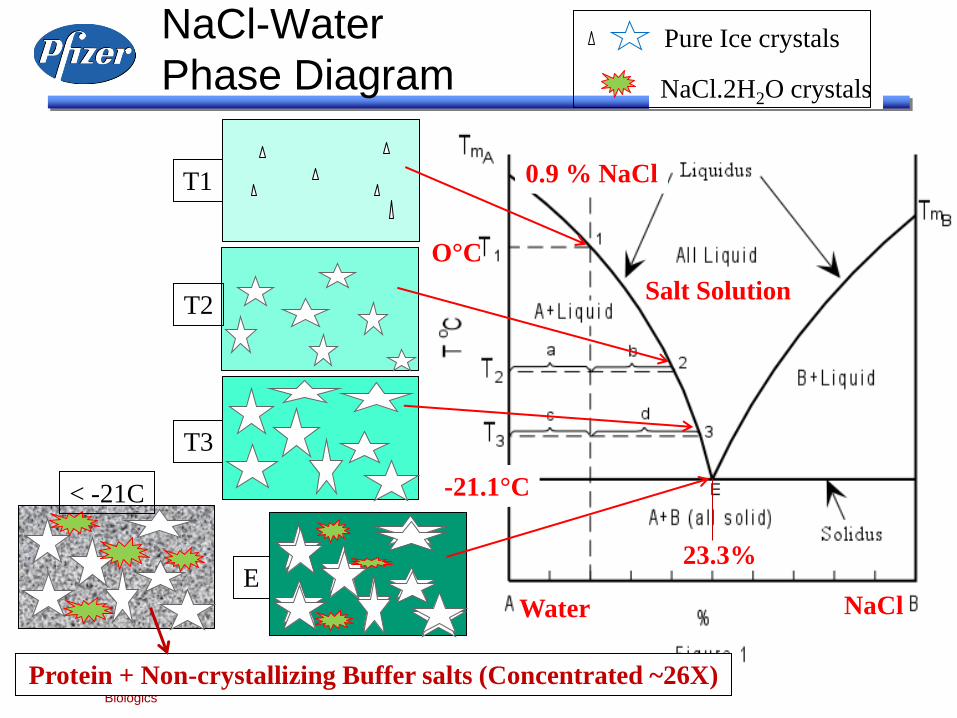
NaCl-Water
Phase Diagram
20
-21.1°C
0.9 % NaCl
23.3%
Salt Solution
Water NaCl
T2
E
T3
Pure Ice crystals
NaCl.2H2O crystals
< -21C
Protein + Non-crystallizing Buffer salts (Concentrated ~26X)
T1
O°C
Worldwide Pharmaceutical Sciences
Biologics 21
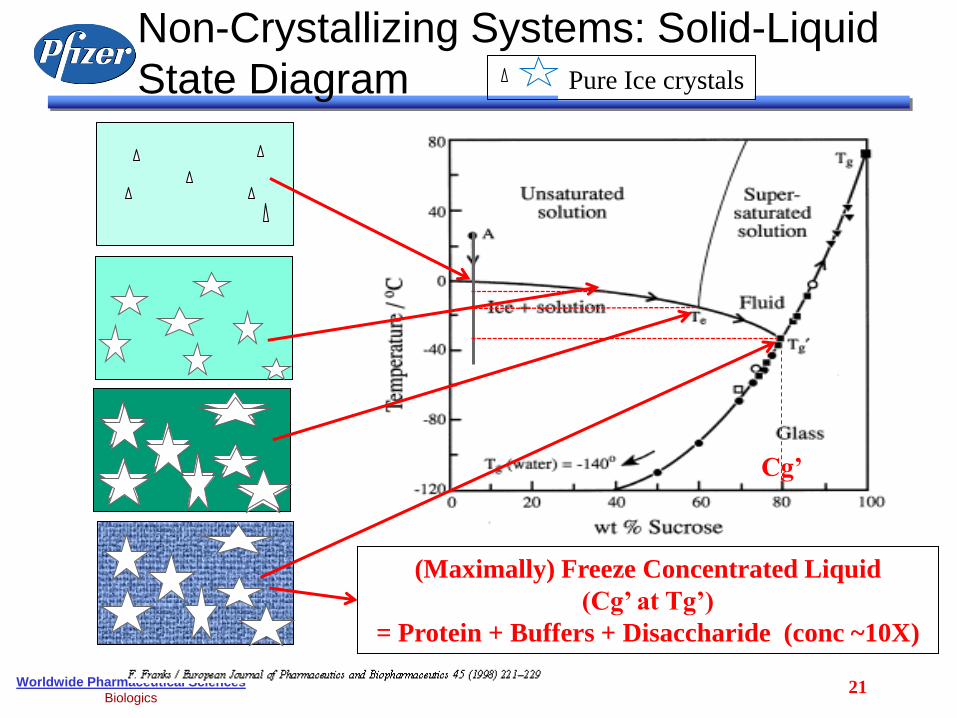
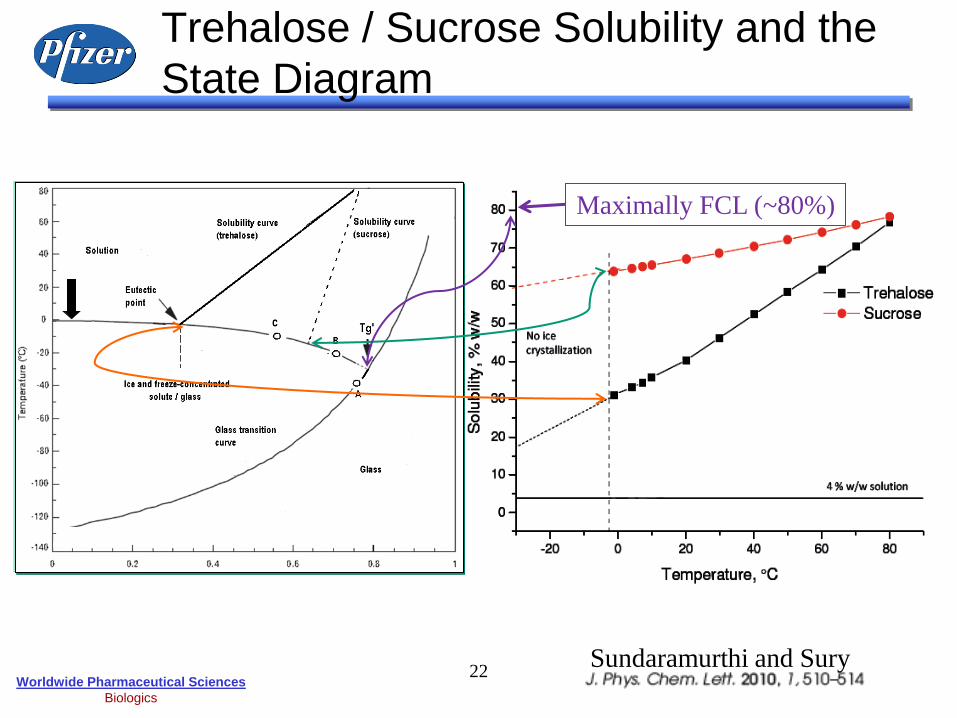
Non-Crystallizing Systems: Solid-Liquid
State Diagram
(Maximally) Freeze Concentrated Liquid
(Cg’ at Tg’)
= Protein + Buffers + Disaccharide (conc ~10X)
Cg’
Pure Ice crystals
Worldwide Pharmaceutical Sciences
Biologics
22
Trehalose / Sucrose Solubility and the
State Diagram
Maximally FCL (~80%)
Sundaramurthi and Sury
Worldwide Pharmaceutical Sciences
Biologics 23
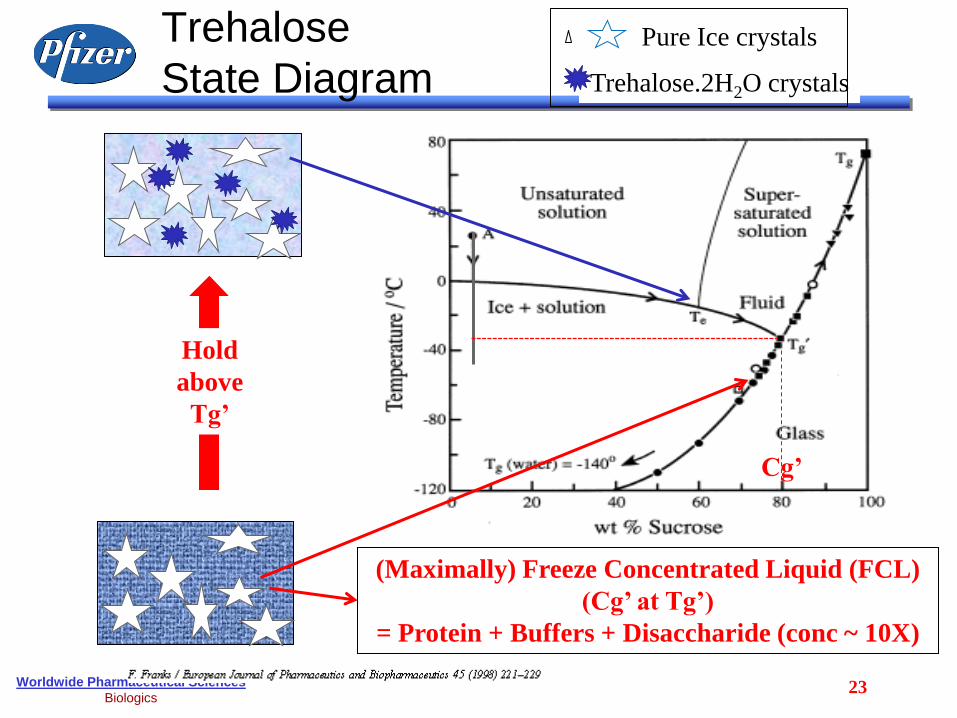
Trehalose
State Diagram
Hold
above
Tg’
(Maximally) Freeze Concentrated Liquid (FCL)
(Cg’ at Tg’)
= Protein + Buffers + Disaccharide (conc ~ 10X)
Cg’
Pure Ice crystals
Trehalose.2H2O crystals
BioTx Pharmaceutical Sciences 24
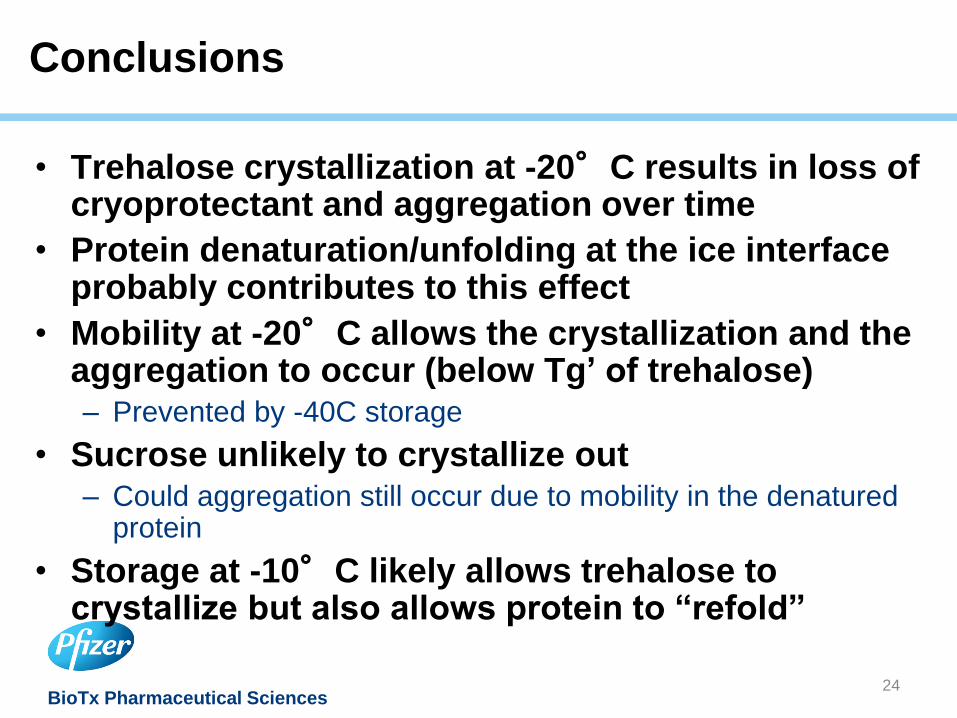
Conclusions
• Trehalose crystallization at -20°C results in loss of cryoprotectant and aggregation over time
• Protein denaturation/unfolding at the ice interface probably contributes to this effect
• Mobility at -20°C allows the crystallization and the aggregation to occur (below Tg’ of trehalose) – Prevented by -40C storage
• Sucrose unlikely to crystallize out – Could aggregation still occur due to mobility in the denatured
protein
• Storage at -10°C likely allows trehalose to crystallize but also allows protein to “refold”
BioTx Pharmaceutical Sciences 25 25
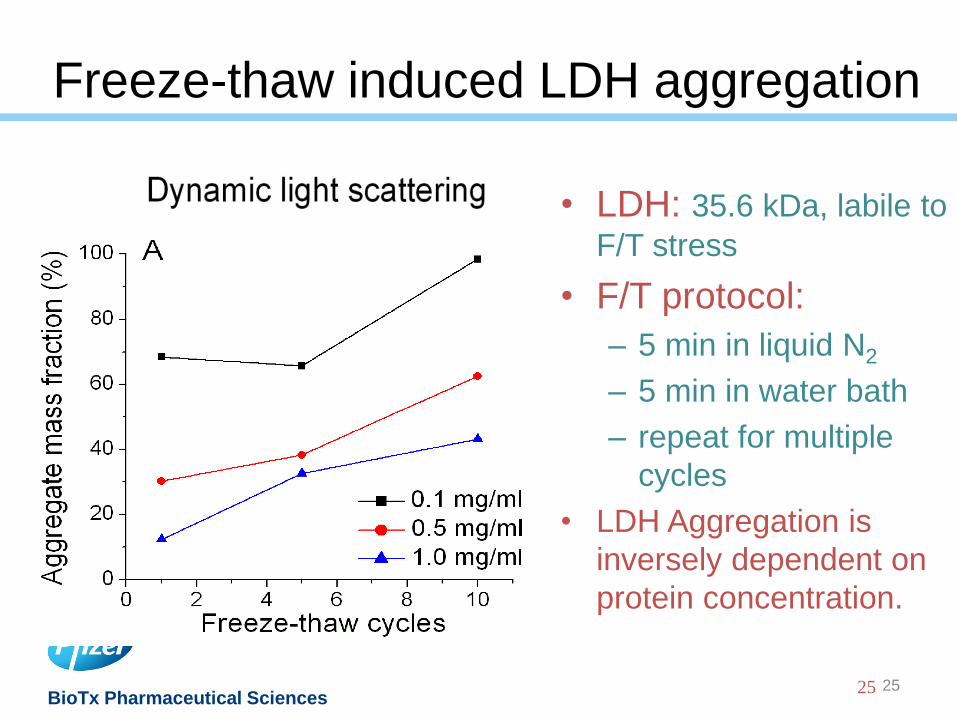
Freeze-thaw induced LDH aggregation
• LDH: 35.6 kDa, labile to
F/T stress
• F/T protocol:
– 5 min in liquid N2
– 5 min in water bath
– repeat for multiple
cycles
• LDH Aggregation is
inversely dependent on
protein concentration.
BioTx Pharmaceutical Sciences 26
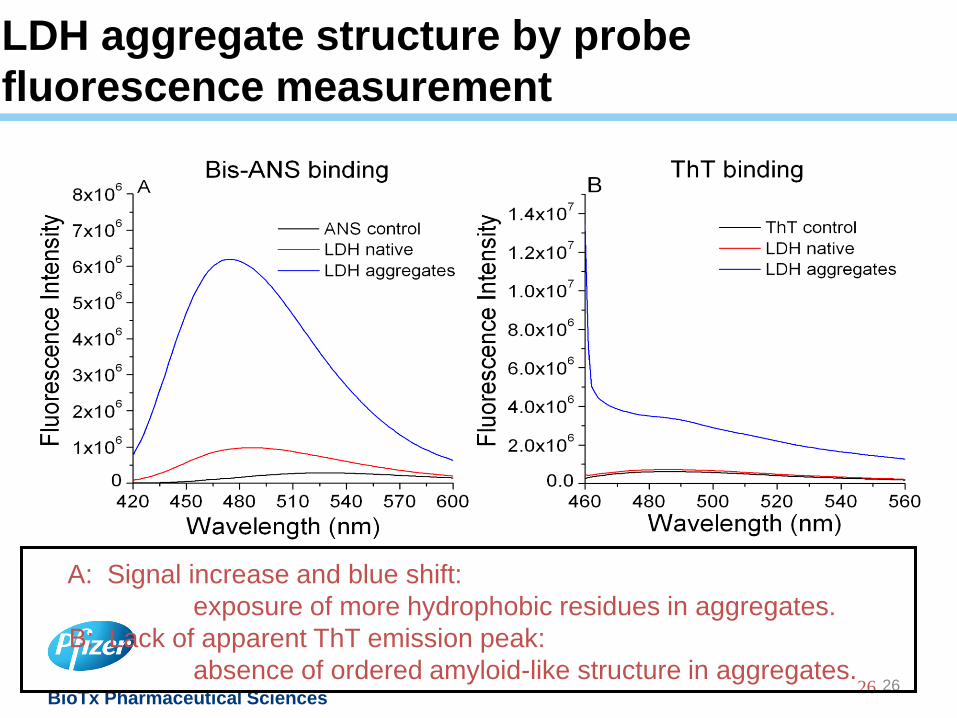
LDH aggregate structure by probe
fluorescence measurement
26
A: Signal increase and blue shift:
exposure of more hydrophobic residues in aggregates.
B: Lack of apparent ThT emission peak:
absence of ordered amyloid-like structure in aggregates.
BioTx Pharmaceutical Sciences 27
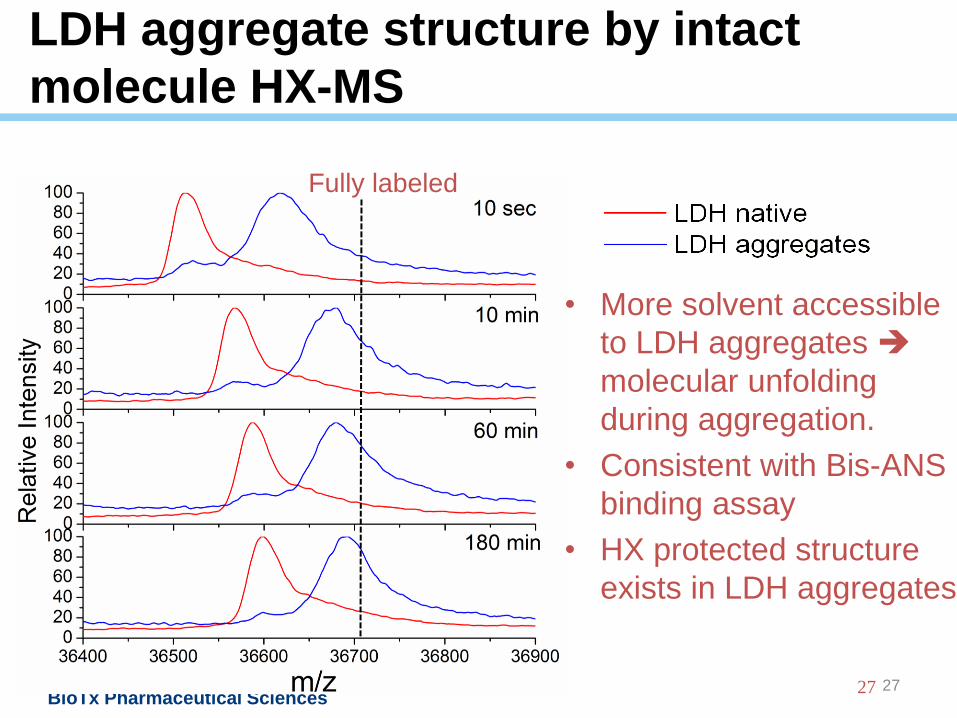
LDH aggregate structure by intact
molecule HX-MS
27
Fully labeled
• More solvent accessible
to LDH aggregates
molecular unfolding
during aggregation.
• Consistent with Bis-ANS
binding assay
• HX protected structure
exists in LDH aggregates
BioTx Pharmaceutical Sciences 28
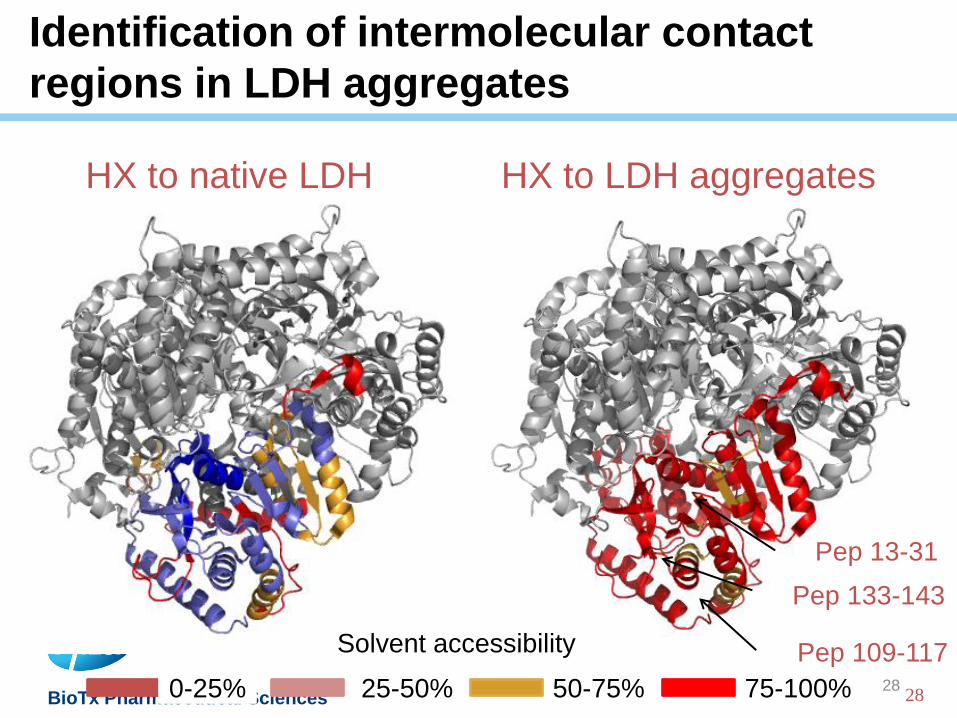
Identification of intermolecular contact
regions in LDH aggregates
28
HX to native LDH HX to LDH aggregates
0-25% 25-50% 50-75% 75-100%
Solvent accessibility
Pep 13-31
Pep 109-117
Pep 133-143
BioTx Pharmaceutical Sciences 29
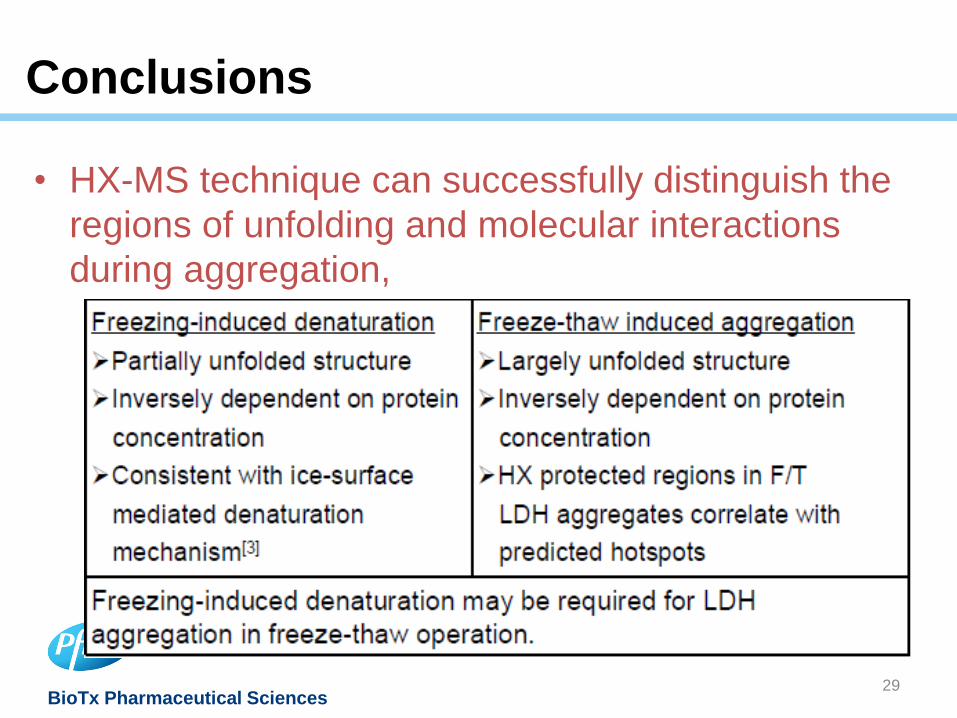
Conclusions
• HX-MS technique can successfully distinguish the
regions of unfolding and molecular interactions
during aggregation,
F-T of mAb and Fusion Protein
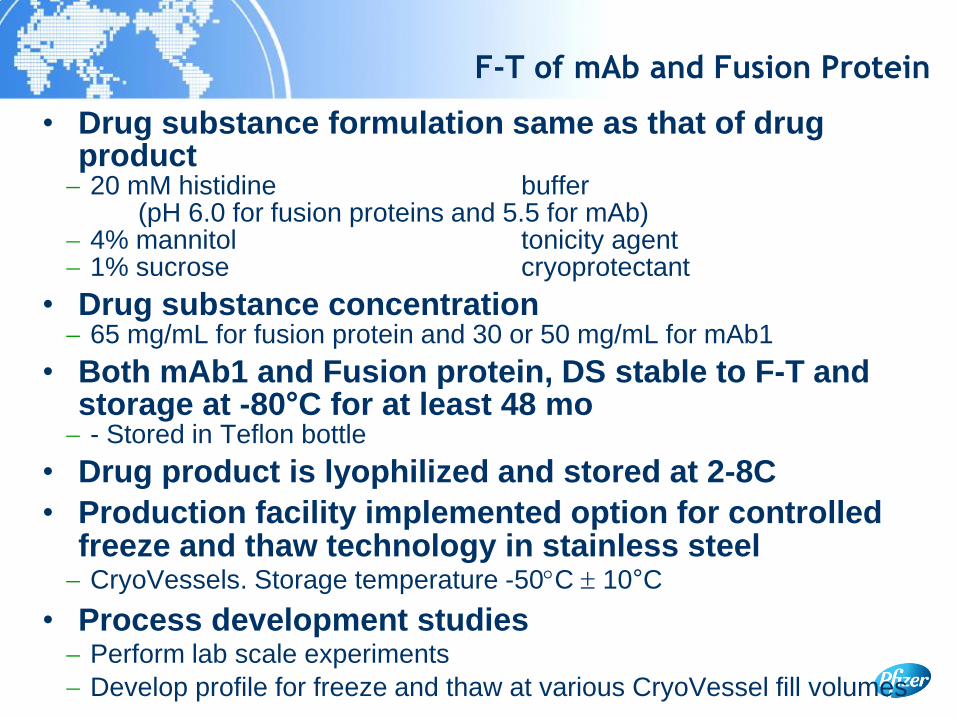
• Drug substance formulation same as that of drug product 20 mM histidine buffer (pH 6.0 for fusion proteins and 5.5 for mAb) 4% mannitol tonicity agent 1% sucrose cryoprotectant
• Drug substance concentration 65 mg/mL for fusion protein and 30 or 50 mg/mL for mAb1
• Both mAb1 and Fusion protein, DS stable to F-T and storage at -80°C for at least 48 mo - Stored in Teflon bottle
• Drug product is lyophilized and stored at 2-8C
• Production facility implemented option for controlled freeze and thaw technology in stainless steel CryoVessels. Storage temperature -50C 10°C
• Process development studies Perform lab scale experiments
Develop profile for freeze and thaw at various CryoVessel fill volumes
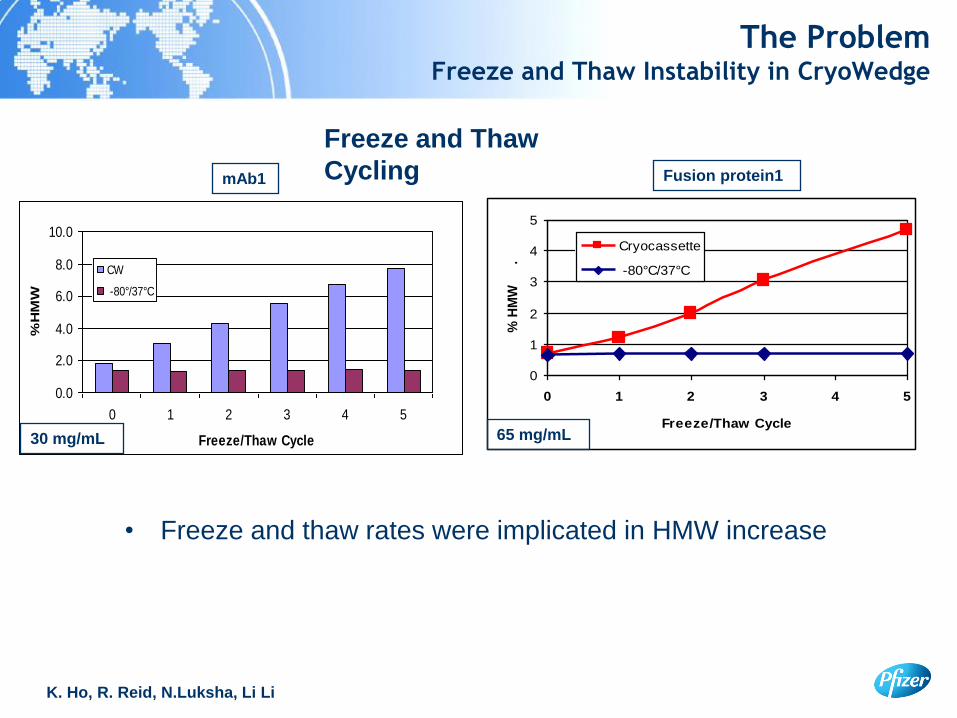
The Problem Freeze and Thaw Instability in CryoWedge
0.0
2.0
4.0
6.0
8.0
10.0
0 1 2 3 4 5
Freeze/Thaw Cycle
%H
MW
CW
-80°/37°C
K. Ho, R. Reid, N.Luksha, Li Li
• Freeze and thaw rates were implicated in HMW increase
30 mg/mL
0
1
2
3
4
5
0 1 2 3 4 5
Freeze/Thaw Cycle
% H
MW
.
Cryocassette
-80°C/37°C
65 mg/mL
Freeze and Thaw
Cycling mAb1 Fusion protein1
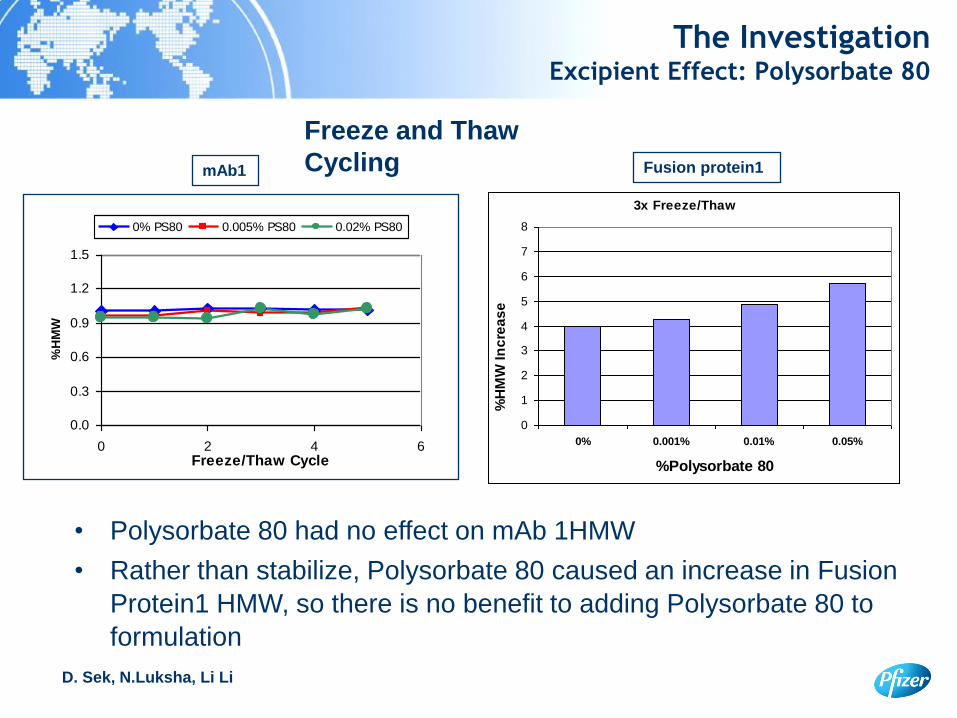
The Investigation Excipient Effect: Polysorbate 80
D. Sek, N.Luksha, Li Li
0.0
0.3
0.6
0.9
1.2
1.5
0 2 4 6Freeze/Thaw Cycle
%H
MW
0% PS80 0.005% PS80 0.02% PS80
• Polysorbate 80 had no effect on mAb 1HMW
• Rather than stabilize, Polysorbate 80 caused an increase in Fusion
Protein1 HMW, so there is no benefit to adding Polysorbate 80 to
formulation
0
1
2
3
4
5
6
7
8
0% 0.001% 0.01% 0.05%
%Polysorbate 80
%H
MW
In
cre
as
e
3x Freeze/Thaw
Freeze and Thaw
Cycling mAb1 Fusion protein1
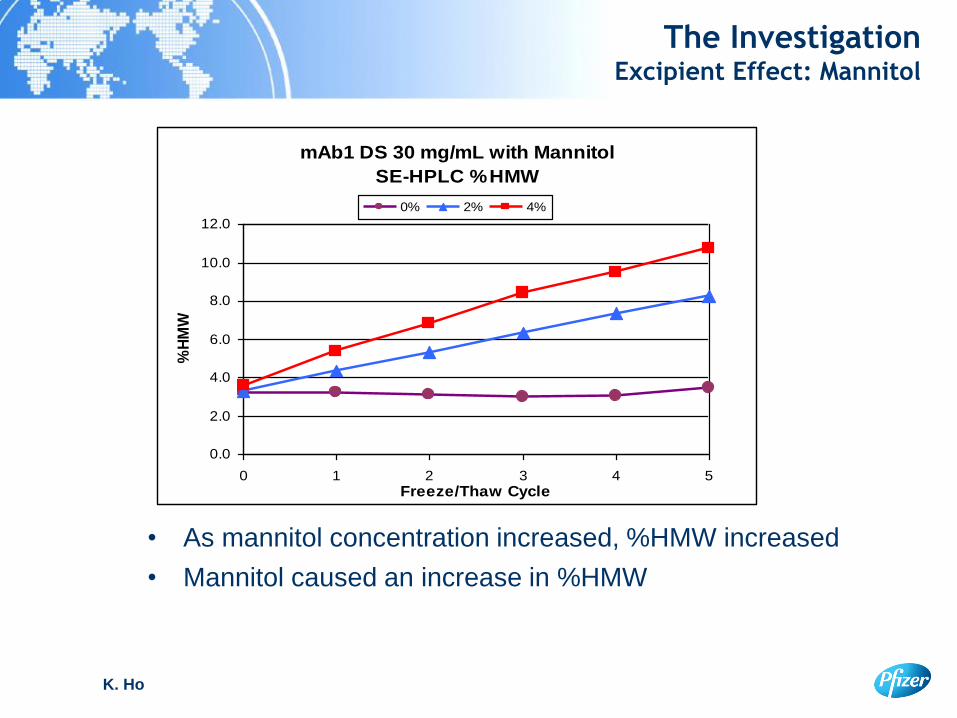
mAb1 DS 30 mg/mL with Mannitol
SE-HPLC %HMW
0.0
2.0
4.0
6.0
8.0
10.0
12.0
0 1 2 3 4 5Freeze/Thaw Cycle
%H
MW
0% 2% 4%
The Investigation Excipient Effect: Mannitol
• As mannitol concentration increased, %HMW increased
• Mannitol caused an increase in %HMW
K. Ho
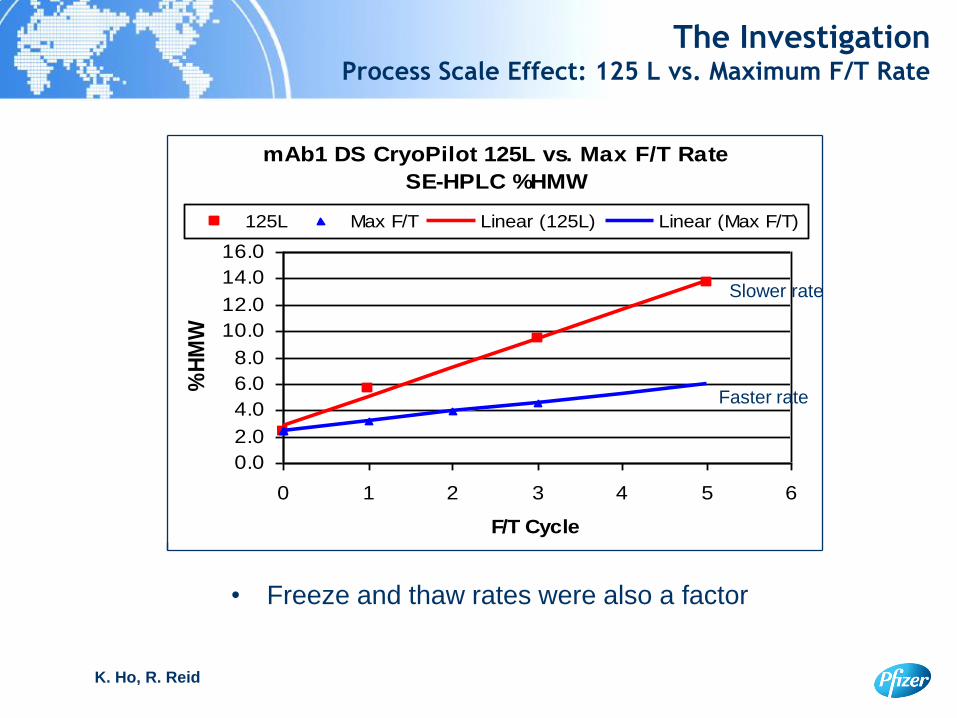
The Investigation Process Scale Effect: 125 L vs. Maximum F/T Rate
K. Ho, R. Reid
• Freeze and thaw rates were also a factor
mAb1 DS CryoPilot 125L vs. Max F/T Rate
SE-HPLC %HMW
0.0
2.0
4.0
6.0
8.0
10.0
12.0
14.0
16.0
0 1 2 3 4 5 6
F/T Cycle
%H
MW
125L Max F/T Linear (125L) Linear (Max F/T)
Slower rate
Faster rate
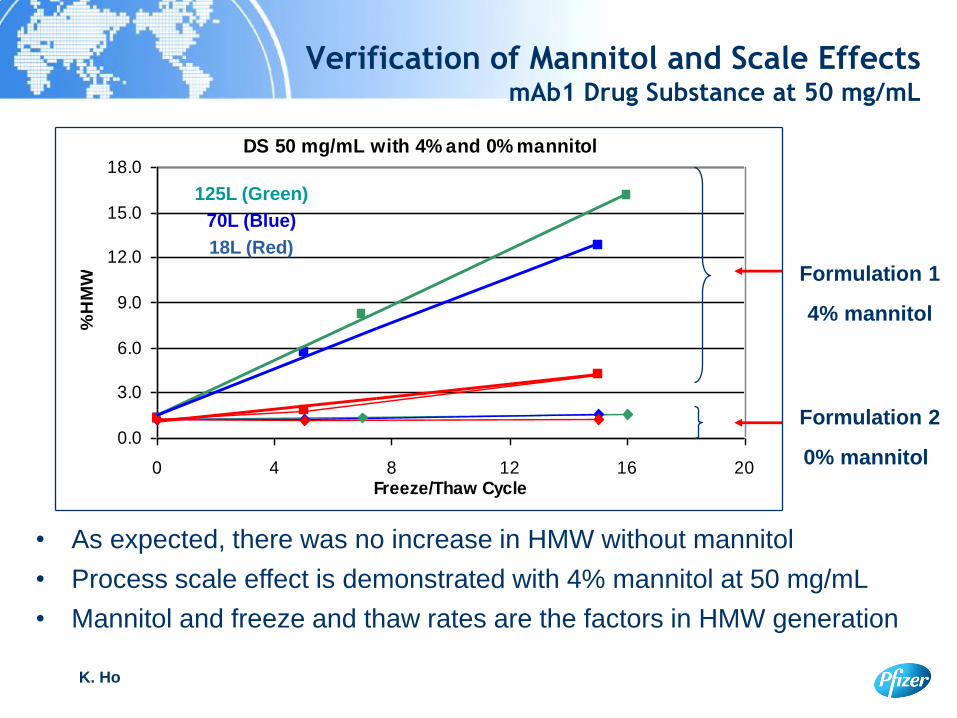
DS 50 mg/mL with 4% and 0% mannitol
0.0
3.0
6.0
9.0
12.0
15.0
18.0
0 4 8 12 16 20Freeze/Thaw Cycle
%H
MW
4% mannitol
K. Ho
Formulation 2
Formulation 1
0% mannitol
125L (Green)
70L (Blue)
18L (Red)
• As expected, there was no increase in HMW without mannitol
• Process scale effect is demonstrated with 4% mannitol at 50 mg/mL
• Mannitol and freeze and thaw rates are the factors in HMW generation
Verification of Mannitol and Scale Effects mAb1 Drug Substance at 50 mg/mL
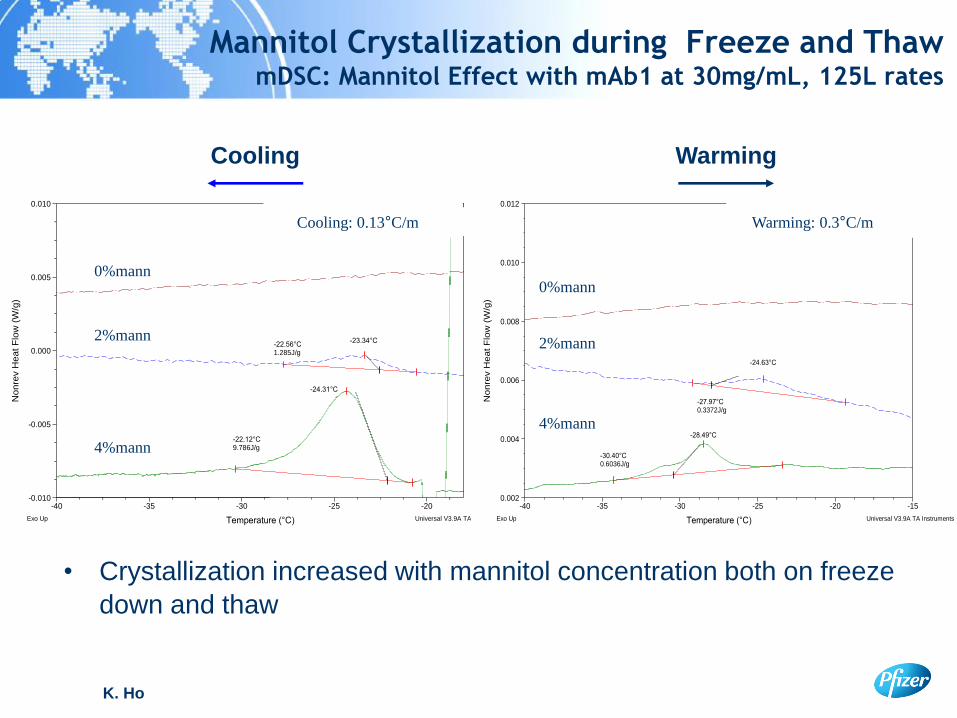
Mannitol Crystallization during Freeze and Thaw mDSC: Mannitol Effect with mAb1 at 30mg/mL, 125L rates
• Crystallization increased with mannitol concentration both on freeze
down and thaw
-24.31°C
-22.12°C
9.786J/g
-23.34°C
-22.56°C
1.285J/g
-0.010
-0.005
0.000
0.005
0.010
N
on
rev H
ea
t F
low
(W
/g)
-40
-35
-30
-25
-20
Temperature (°C)
––––––– cryo f-t aab bds 4%man-ps80 r2a.001
– – – – cryo f-t aab bds 2%man-ps80 cooling.001
––––– · cryo f-t aab bds 0%man-ps80 cooling ana.001
Exo Up
Universal V3.9A TA Instruments
0%mann
2%mann
4%mann
Cooling
-28.49°C
-30.40°C
0.6036J/g
-24.63°C
-27.97°C
0.3372J/g
0.002
0.004
0.006
0.008
0.010
0.012
No
nre
v H
ea
t F
low
(W
/g)
-40
-35
-30
-25
-20
-15
Temperature (°C)
––––––– cryo f-t aab bds 4%man-ps80 r2a.001
– – – – cryo f-t aab bds 2%man-ps80 warming ana.001
––––– · cryo f-t aab bds 0%man-ps80.001
Exo Up
Universal V3.9A TA Instruments
2%mann
0%mann
4%mann
Warming
Cooling: 0.13°C/m Warming: 0.3°C/m
K. Ho
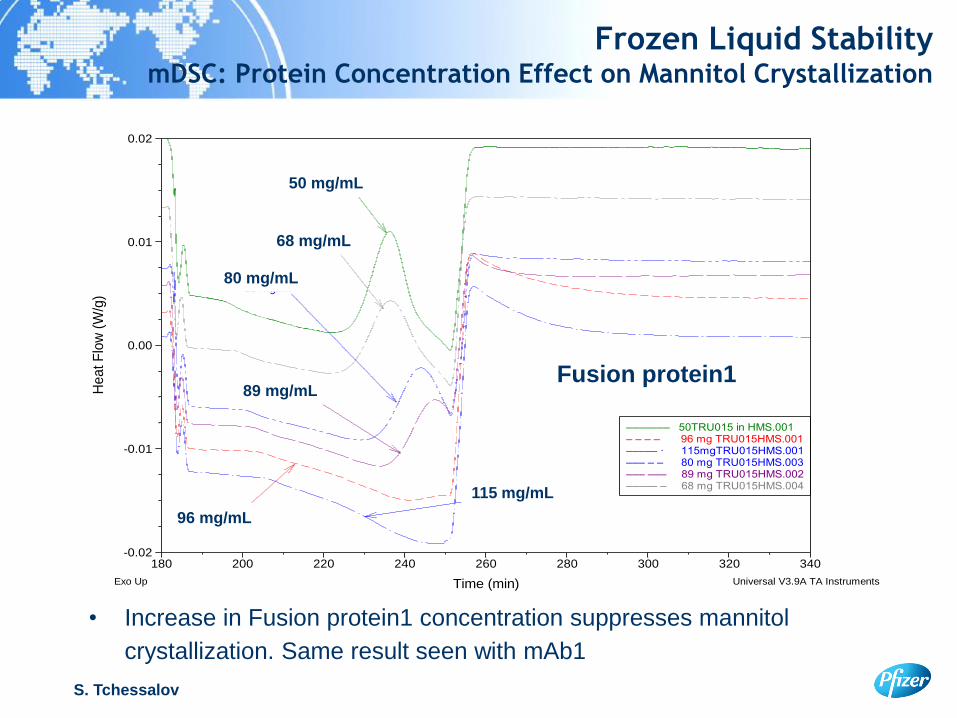
• Increase in Fusion protein1 concentration suppresses mannitol
crystallization. Same result seen with mAb1
Frozen Liquid Stability mDSC: Protein Concentration Effect on Mannitol Crystallization
S. Tchessalov
50 mg/ml
68mg/ml
80 mg/ml
89 mg/ml
96 mg/ml
115 mg/ml
-0.02
-0.01
0.00
0.01
0.02
Heat F
low
(W
/g)
180 200 220 240 260 280 300 320 340
Time (min)
––––––– 50TRU015 in HMS.001– – – – 96 mg TRU015HMS.001––––– · 115mgTRU015HMS.001––– – – 80 mg TRU015HMS.003––– ––– 89 mg TRU015HMS.002––––– – 68 mg TRU015HMS.004
Exo Up Universal V3.9A TA Instruments
Fusion protein1
50 mg/mL
68 mg/mL
80 mg/mL
96 mg/mL
115 mg/mL
89 mg/mL
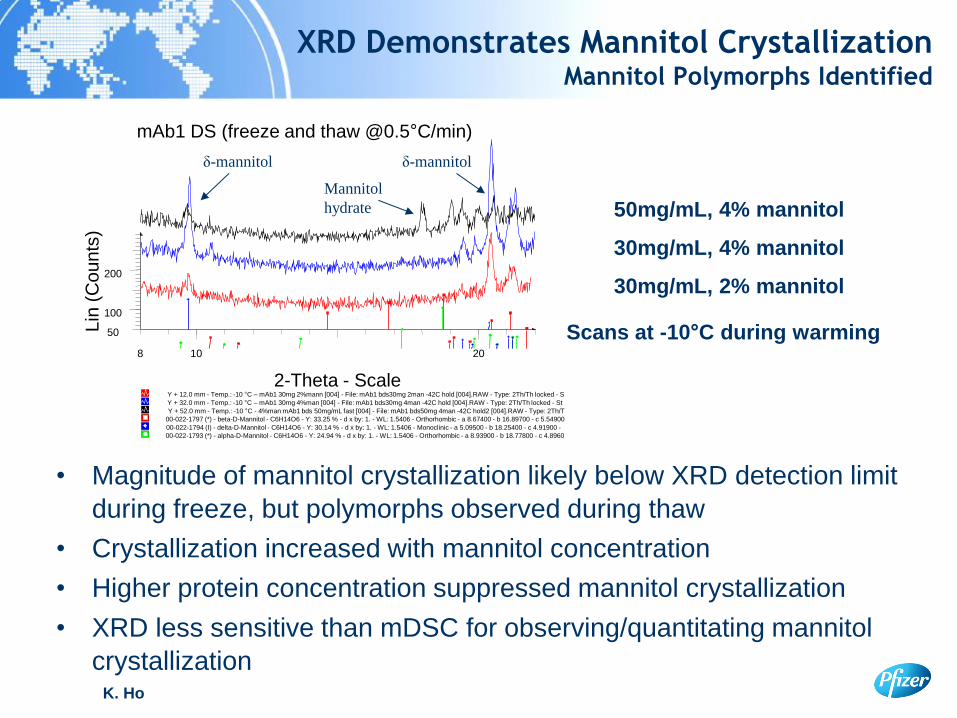
XRD Demonstrates Mannitol Crystallization Mannitol Polymorphs Identified
mAb1 DS (freeze and thaw @0.5°C/min)
00-022-1793 (*) - alpha-D-Mannitol - C6H14O6 - Y: 24.94 % - d x by: 1. - WL: 1.5406 - Orthorhombic - a 8.93900 - b 18.77800 - c 4.8960
00-022-1794 (I) - delta-D-Mannitol - C6H14O6 - Y: 30.14 % - d x by: 1. - WL: 1.5406 - Monoclinic - a 5.09500 - b 18.25400 - c 4.91900 -
00-022-1797 (*) - beta-D-Mannitol - C6H14O6 - Y: 33.25 % - d x by: 1. - WL: 1.5406 - Orthorhombic - a 8.67400 - b 16.89700 - c 5.54900
Y + 52.0 mm - Temp.: -10 °C - 4%man mAb1 bds 50mg/mL fast [004] - File: mAb1 bds50mg 4man -42C hold2 [004].RAW - Type: 2Th/T
Y + 32.0 mm - Temp.: -10 °C – mAb1 30mg 4%man [004] - File: mAb1 bds30mg 4man -42C hold [004].RAW - Type: 2Th/Th locked - St
Y + 12.0 mm - Temp.: -10 °C – mAb1 30mg 2%mann [004] - File: mAb1 bds30mg 2man -42C hold [004].RAW - Type: 2Th/Th locked - S
Lin
(C
ou
nts
)
50
100
200
2-Theta - Scale
8 10 20
δ-mannitol δ-mannitol
Mannitol
hydrate 50mg/mL, 4% mannitol
30mg/mL, 4% mannitol
30mg/mL, 2% mannitol
Scans at -10°C during warming
• Magnitude of mannitol crystallization likely below XRD detection limit
during freeze, but polymorphs observed during thaw
• Crystallization increased with mannitol concentration
• Higher protein concentration suppressed mannitol crystallization
• XRD less sensitive than mDSC for observing/quantitating mannitol
crystallization K. Ho
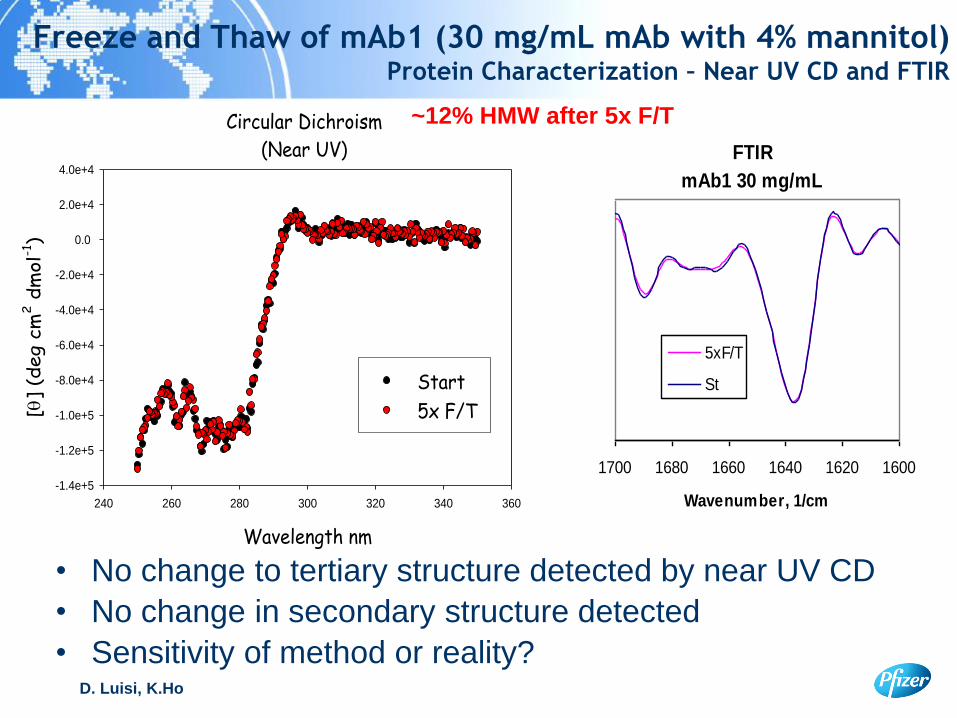
Freeze and Thaw of mAb1 (30 mg/mL mAb with 4% mannitol) Protein Characterization – Near UV CD and FTIR
D. Luisi, K.Ho
Circular Dichroism
(Near UV)
Wavelength nm
240 260 280 300 320 340 360
[]
(deg c
m2 d
mol-1
)
-1.4e+5
-1.2e+5
-1.0e+5
-8.0e+4
-6.0e+4
-4.0e+4
-2.0e+4
0.0
2.0e+4
4.0e+4
Start
5x F/T
• No change to tertiary structure detected by near UV CD
• No change in secondary structure detected
• Sensitivity of method or reality?
~12% HMW after 5x F/T
FTIR
mAb1 30 mg/mL
160016201640166016801700
Wavenumber, 1/cm
5xF/T
St
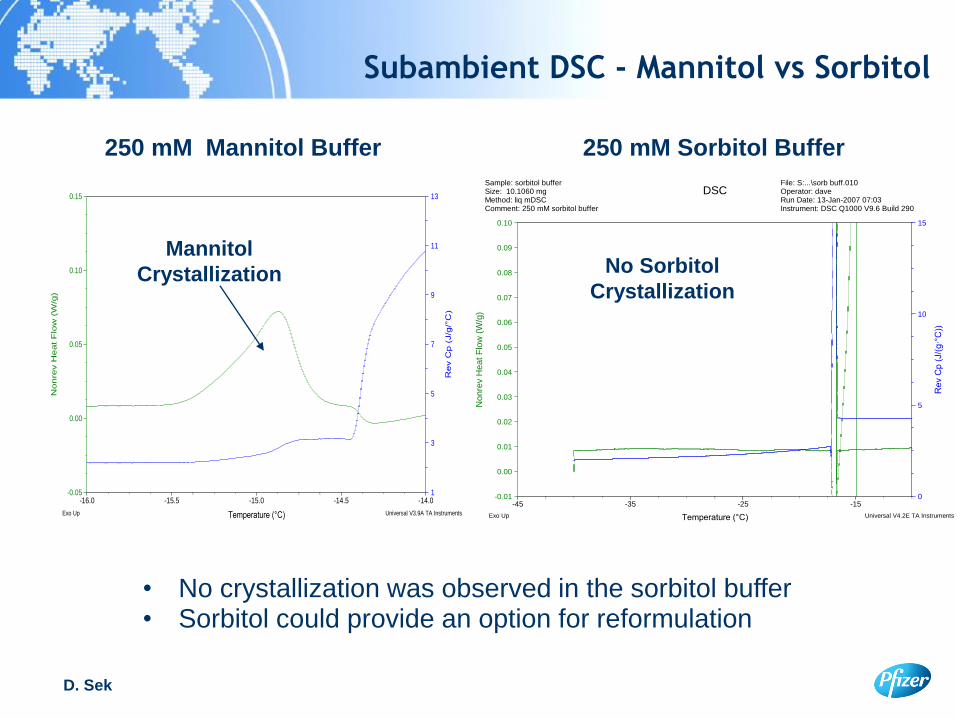
Subambient DSC - Mannitol vs Sorbitol
250 mM Mannitol Buffer 250 mM Sorbitol Buffer
1
3
5
7
9
11
13
Rev C
p (
J/g
/°C
)
-0.05
0.00
0.05
0.10
0.15
Nonre
v H
eat F
low
(W
/g)
-16.0 -15.5 -15.0 -14.5 -14.0
Temperature (°C)
Sample: 250 mM Mann bufferSize: 11.3940 mgMethod: liq mDSCComment: 250 mM mann buffer
DSCFile: S:...\250 mM mann buffer.001Operator: danRun Date: 10-Jan-07 13:23Instrument: DSC Q1000 V9.6 Build 290
Exo Up Universal V3.9A TA Instruments
Mannitol
Crystallization
D. Sek
• No crystallization was observed in the sorbitol buffer • Sorbitol could provide an option for reformulation
0
5
10
15
Re
v C
p (
J/(
g·°
C))
-0.01
0.00
0.01
0.02
0.03
0.04
0.05
0.06
0.07
0.08
0.09
0.10
No
nre
v H
ea
t F
low
(W
/g)
-45 -35 -25 -15
Temperature (°C)
Sample: sorbitol bufferSize: 10.1060 mgMethod: liq mDSCComment: 250 mM sorbitol buffer
DSCFile: S:...\sorb buff.010Operator: daveRun Date: 13-Jan-2007 07:03Instrument: DSC Q1000 V9.6 Build 290
Exo Up Universal V4.2E TA Instruments
No Sorbitol
Crystallization
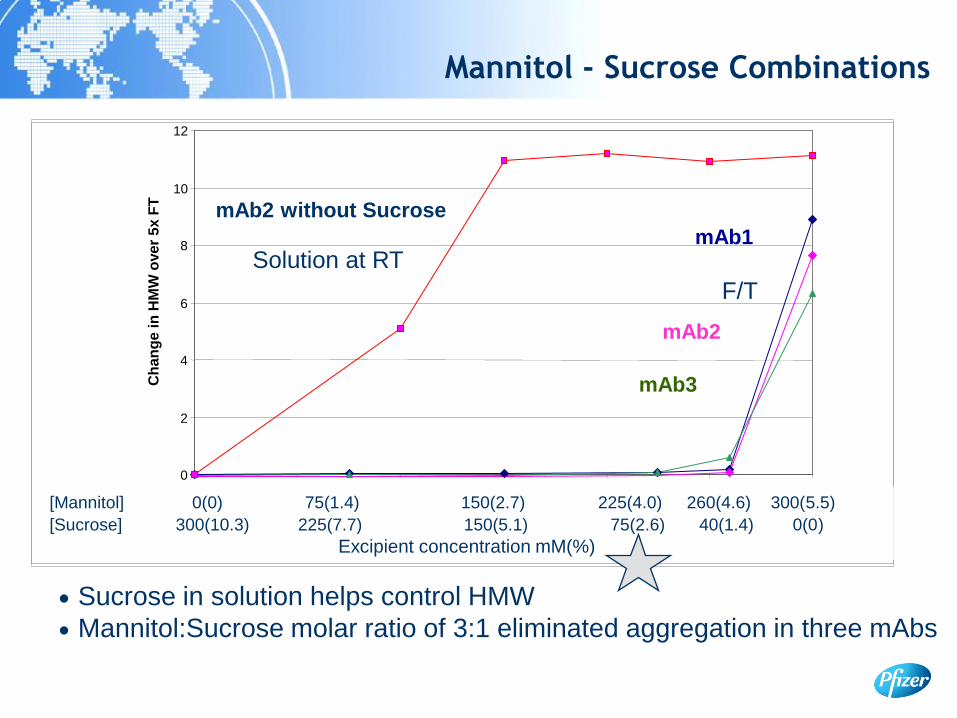
Mannitol - Sucrose Combinations
Sucrose in solution helps control HMW
0
2
4
6
8
10
12
0 50 100 150 200 250 300
Ch
an
ge
in
HM
W o
ve
r 5
x F
T
[Mannitol] 0(0) 75(1.4) 150(2.7) 225(4.0) 260(4.6) 300(5.5)
[Sucrose] 300(10.3) 225(7.7) 150(5.1) 75(2.6) 40(1.4) 0(0)
Excipient concentration mM(%)
mAb3
mAb2
mAb1
mAb2 without Sucrose
Mannitol:Sucrose molar ratio of 3:1 eliminated aggregation in three mAbs
Solution at RT
F/T
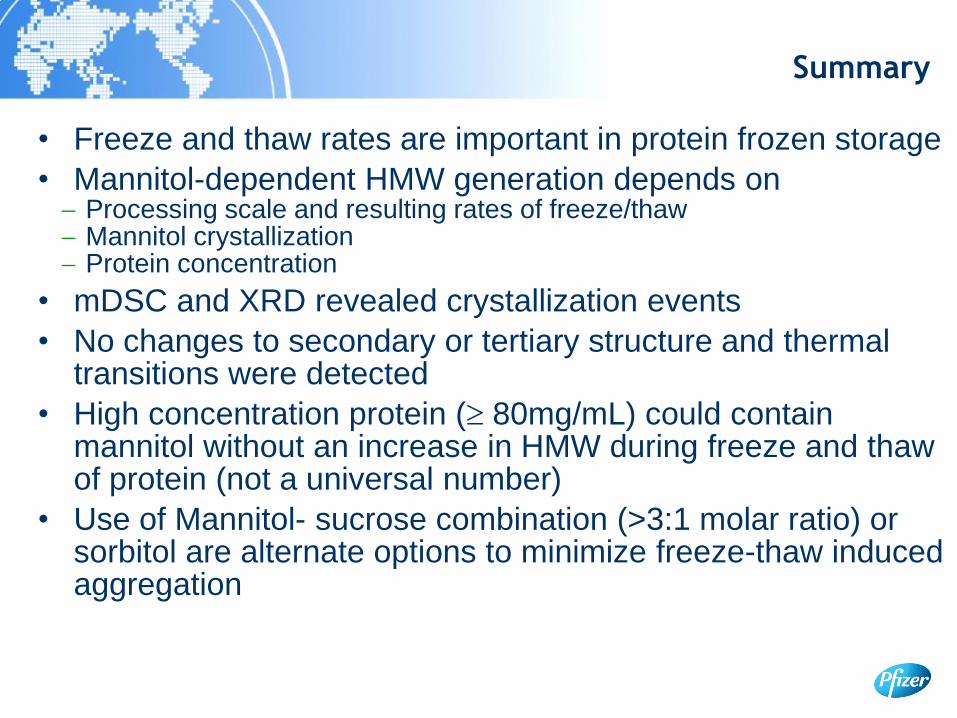
Summary
• Freeze and thaw rates are important in protein frozen storage
• Mannitol-dependent HMW generation depends on Processing scale and resulting rates of freeze/thaw Mannitol crystallization Protein concentration
• mDSC and XRD revealed crystallization events
• No changes to secondary or tertiary structure and thermal transitions were detected
• High concentration protein ( 80mg/mL) could contain mannitol without an increase in HMW during freeze and thaw of protein (not a universal number)
• Use of Mannitol- sucrose combination (>3:1 molar ratio) or sorbitol are alternate options to minimize freeze-thaw induced aggregation

Outline
Part I (Formulation)
• Components of mAb Formulation
• Key considerations
– Buffer choice
– Freezing and thawing (storage)
• Role of crystalline vs amorphous state
– Surfactant benefits (or not)
• Developing high concentration mAb formulation
Part II (Process)
• Basics of Freeze-drying
Pfizer Confidential 43
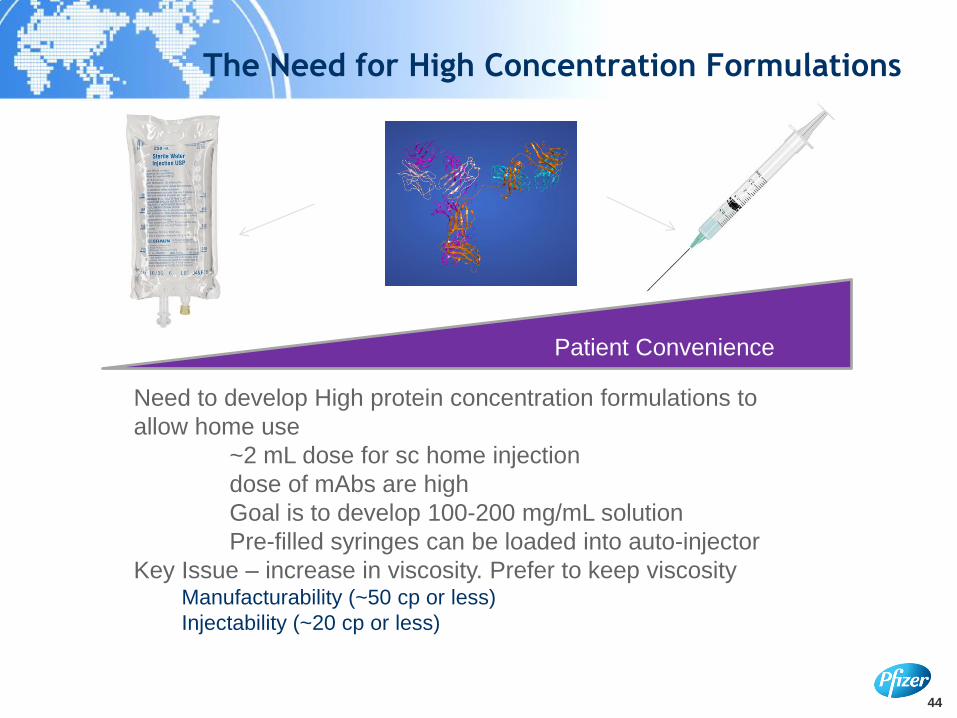
The Need for High Concentration Formulations
44
Need to develop High protein concentration formulations to
allow home use
~2 mL dose for sc home injection
dose of mAbs are high
Goal is to develop 100-200 mg/mL solution
Pre-filled syringes can be loaded into auto-injector
Key Issue – increase in viscosity. Prefer to keep viscosity Manufacturability (~50 cp or less)
Injectability (~20 cp or less)
Patient Convenience
44
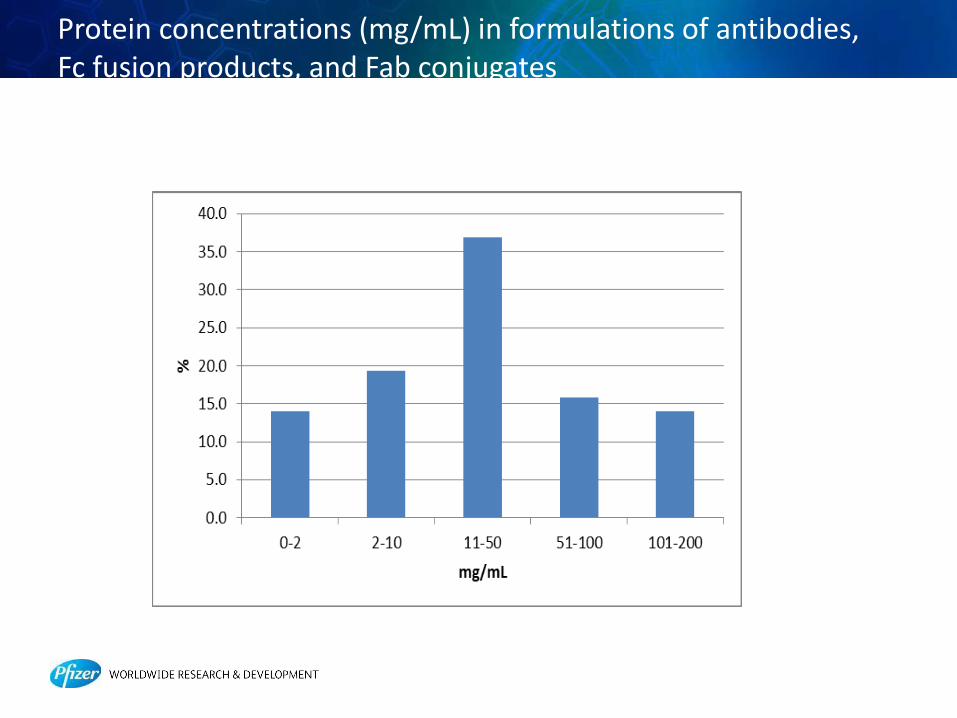
Protein concentrations (mg/mL) in formulations of antibodies, Fc fusion products, and Fab conjugates
45
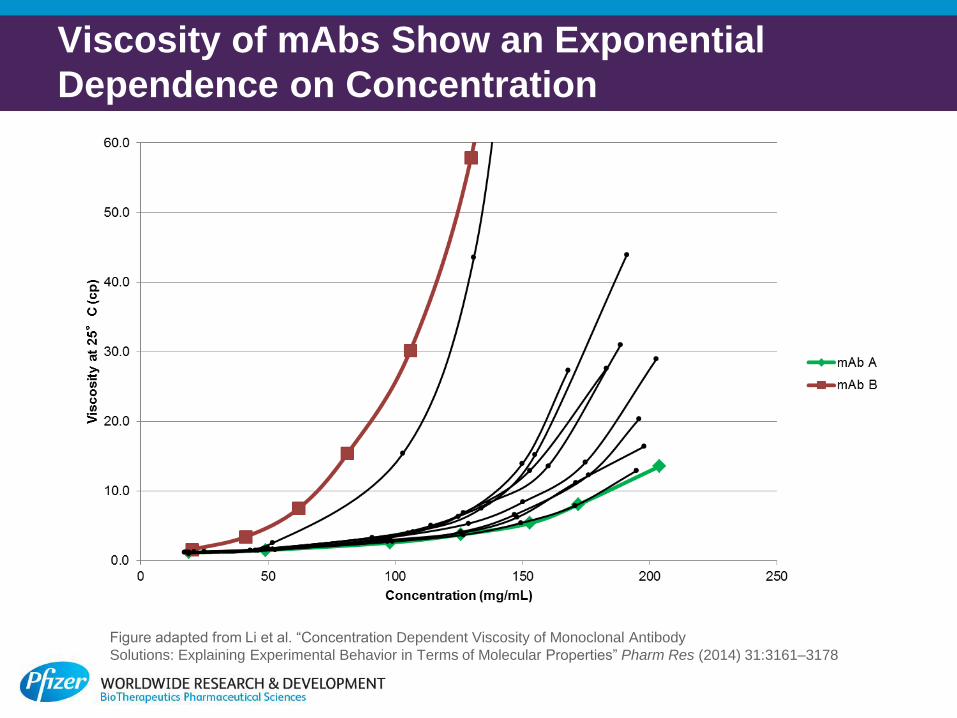
Viscosity of mAbs Show an Exponential
Dependence on Concentration
Figure adapted from Li et al. “Concentration Dependent Viscosity of Monoclonal Antibody
Solutions: Explaining Experimental Behavior in Terms of Molecular Properties” Pharm Res (2014) 31:3161–3178
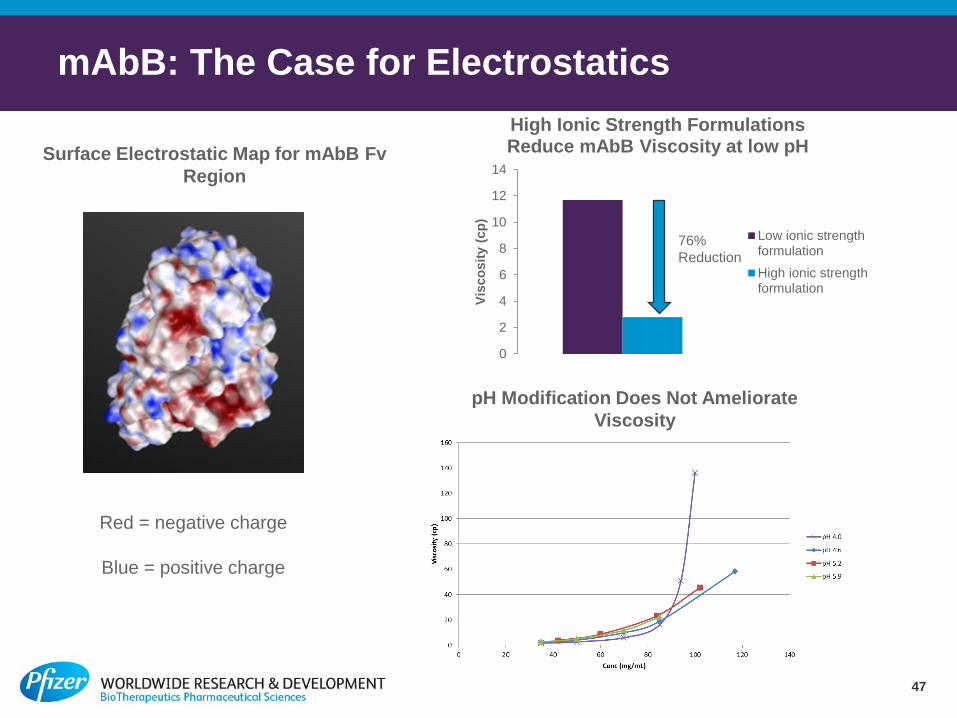
mAbB: The Case for Electrostatics
Blue = positive charge
Red = negative charge
Surface Electrostatic Map for mAbB Fv
Region
0
2
4
6
8
10
12
14
Vis
co
sit
y (
cp
)
High Ionic Strength Formulations Reduce mAbB Viscosity at low pH
Low ionic strengthformulation
High ionic strengthformulation
76%
Reduction
pH Modification Does Not Ameliorate
Viscosity
47
BioTherapeutics Pharmaceutical Sciences
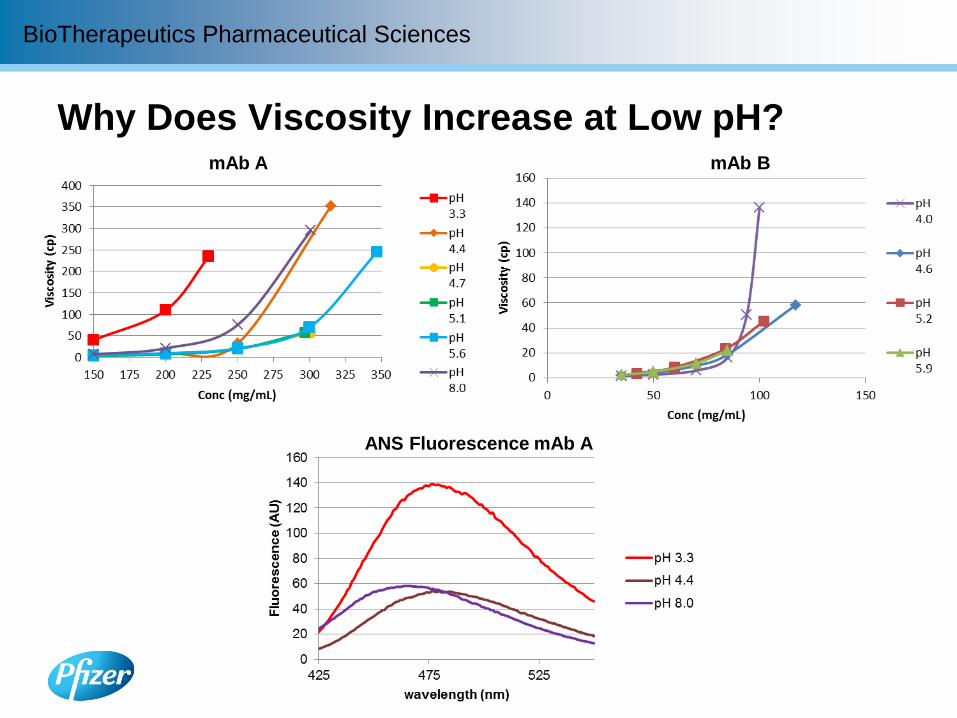
Why Does Viscosity Increase at Low pH?
ANS Fluorescence mAb A
mAb B mAb A
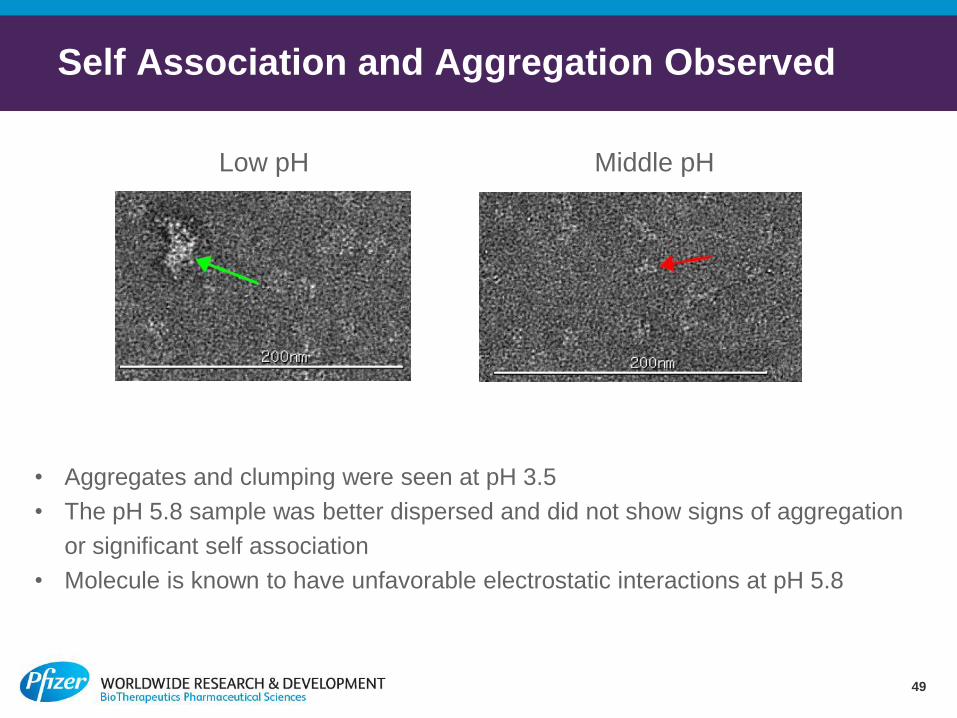
Self Association and Aggregation Observed
49
• Aggregates and clumping were seen at pH 3.5
• The pH 5.8 sample was better dispersed and did not show signs of aggregation
or significant self association
• Molecule is known to have unfavorable electrostatic interactions at pH 5.8
Low pH Middle pH
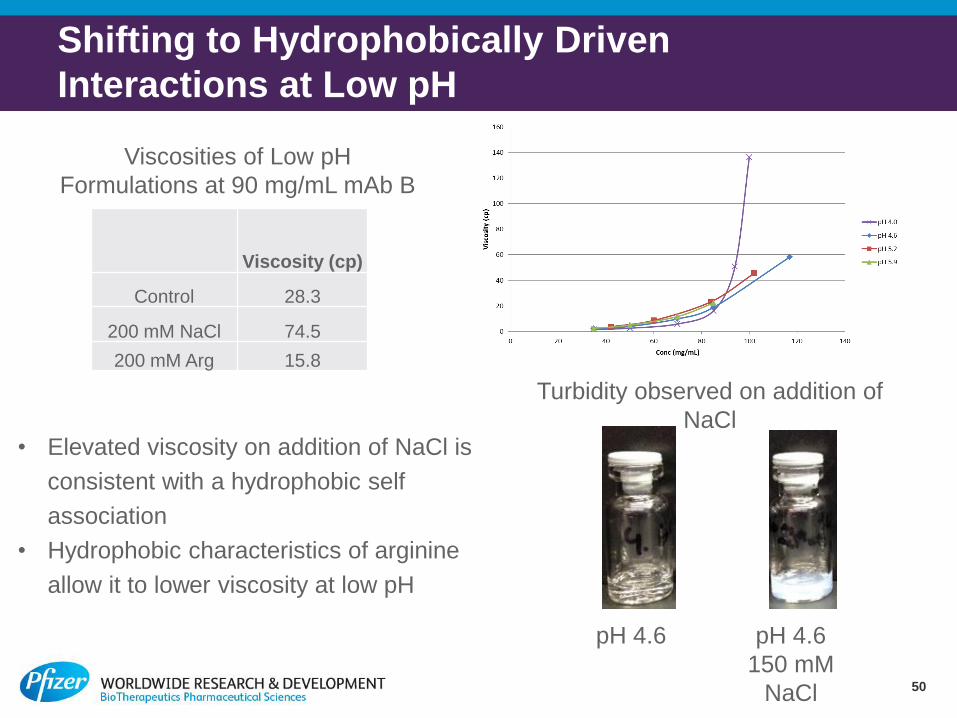
Shifting to Hydrophobically Driven
Interactions at Low pH
50
Viscosity (cp)
Control 28.3
200 mM NaCl 74.5
200 mM Arg 15.8
Viscosities of Low pH
Formulations at 90 mg/mL mAb B
• Elevated viscosity on addition of NaCl is
consistent with a hydrophobic self
association
• Hydrophobic characteristics of arginine
allow it to lower viscosity at low pH
Turbidity observed on addition of
NaCl
pH 4.6 pH 4.6
150 mM
NaCl
BioTherapeutics Pharmaceutical Sciences
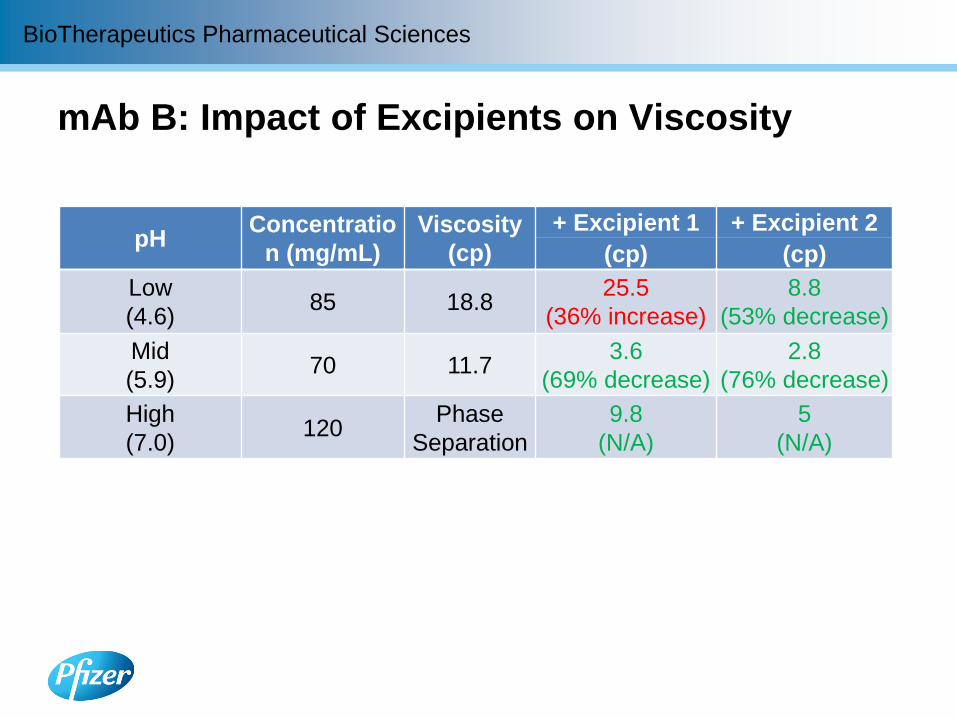
mAb B: Impact of Excipients on Viscosity
pH Concentratio
n (mg/mL)
Viscosity
(cp)
+ Excipient 1 + Excipient 2
(cp) (cp)
Low
(4.6) 85 18.8
25.5
(36% increase)
8.8
(53% decrease)
Mid
(5.9) 70 11.7
3.6
(69% decrease)
2.8
(76% decrease)
High
(7.0) 120
Phase
Separation
9.8
(N/A)
5
(N/A)
BioTherapeutics Pharmaceutical Sciences
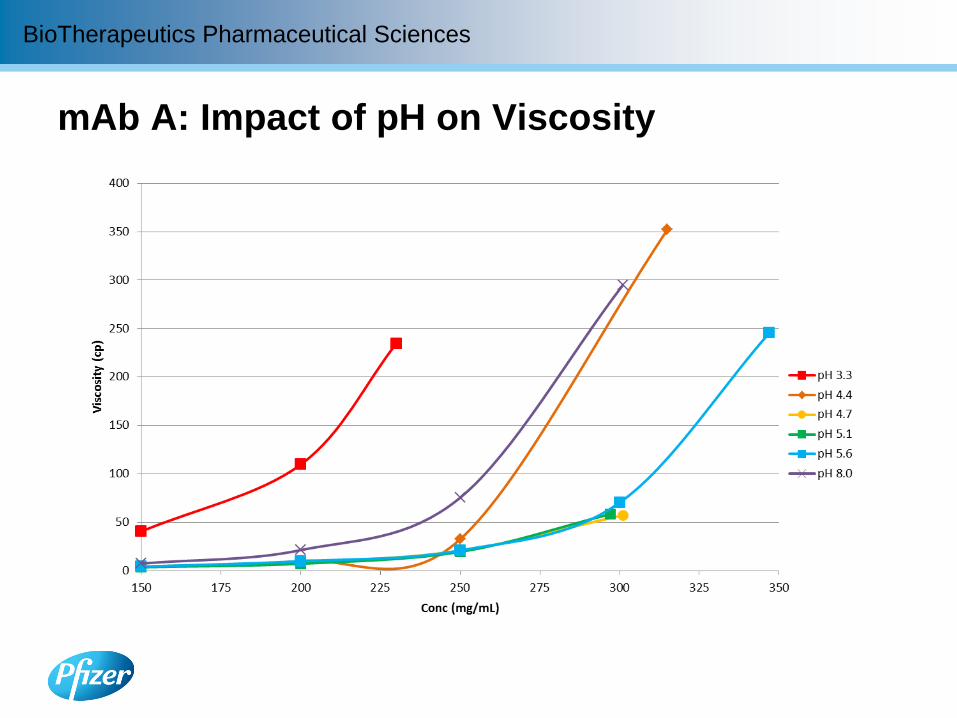
mAb A: Impact of pH on Viscosity
BioTherapeutics Pharmaceutical Sciences
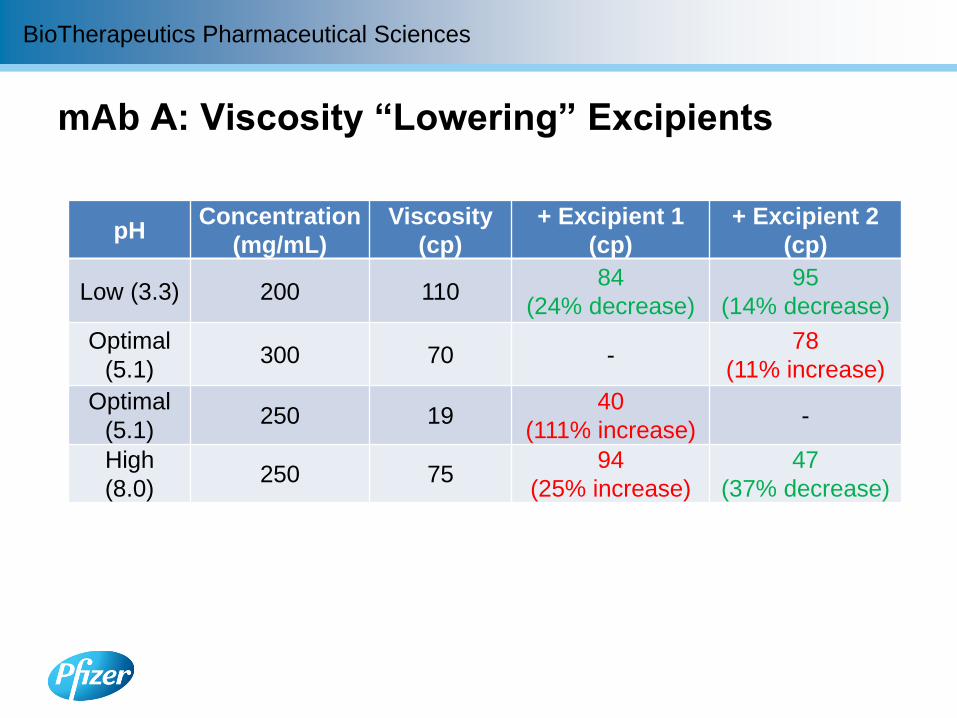
mAb A: Viscosity “Lowering” Excipients
pH Concentration
(mg/mL)
Viscosity
(cp)
+ Excipient 1
(cp)
+ Excipient 2
(cp)
Low (3.3) 200 110 84
(24% decrease)
95
(14% decrease)
Optimal
(5.1) 300 70 -
78
(11% increase)
Optimal
(5.1) 250 19
40
(111% increase) -
High
(8.0) 250 75
94
(25% increase)
47
(37% decrease)
BioTherapeutics Pharmaceutical Sciences
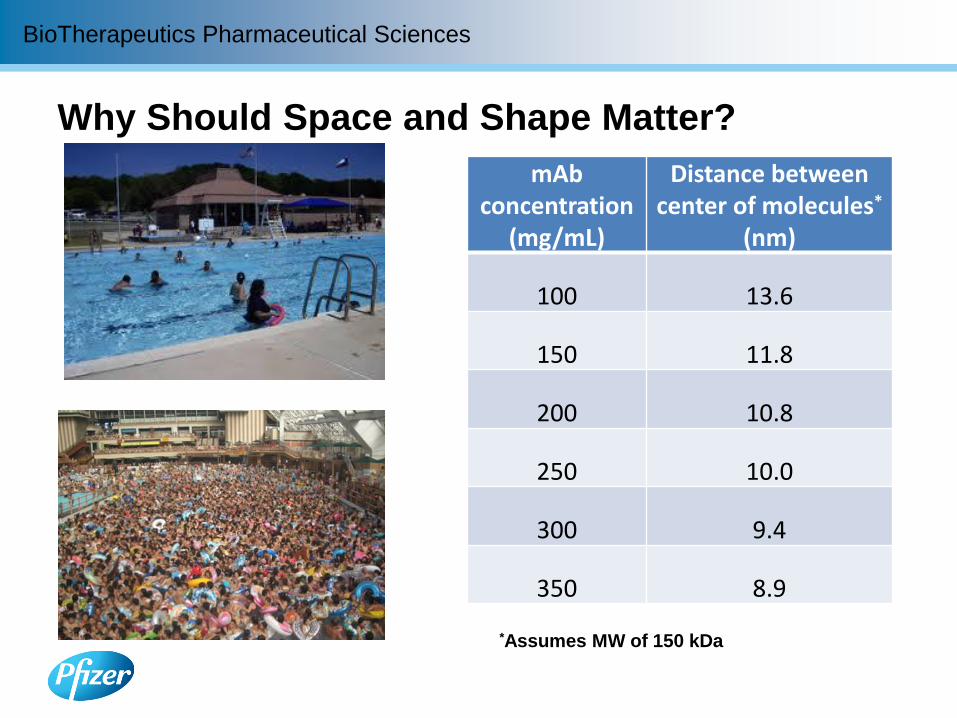
Why Should Space and Shape Matter?
mAb concentration
(mg/mL)
Distance between center of molecules*
(nm)
100 13.6
150 11.8
200 10.8
250 10.0
300 9.4
350 8.9
*Assumes MW of 150 kDa
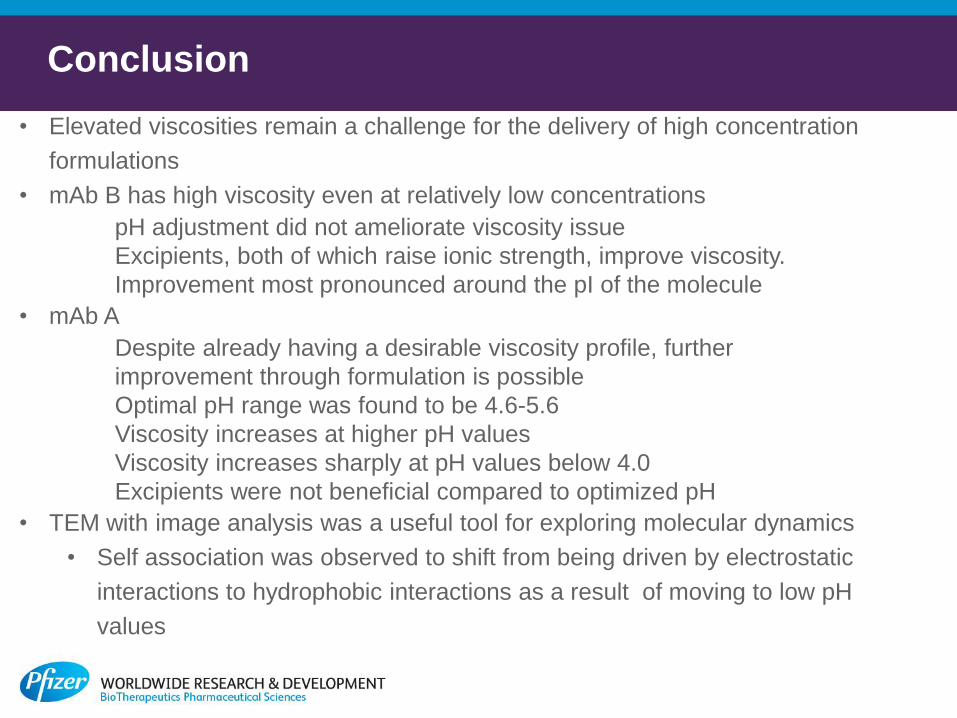
Conclusion
• Elevated viscosities remain a challenge for the delivery of high concentration
formulations
• mAb B has high viscosity even at relatively low concentrations
pH adjustment did not ameliorate viscosity issue
Excipients, both of which raise ionic strength, improve viscosity.
Improvement most pronounced around the pI of the molecule
• mAb A
Despite already having a desirable viscosity profile, further
improvement through formulation is possible
Optimal pH range was found to be 4.6-5.6
Viscosity increases at higher pH values
Viscosity increases sharply at pH values below 4.0
Excipients were not beneficial compared to optimized pH
• TEM with image analysis was a useful tool for exploring molecular dynamics
• Self association was observed to shift from being driven by electrostatic
interactions to hydrophobic interactions as a result of moving to low pH
values
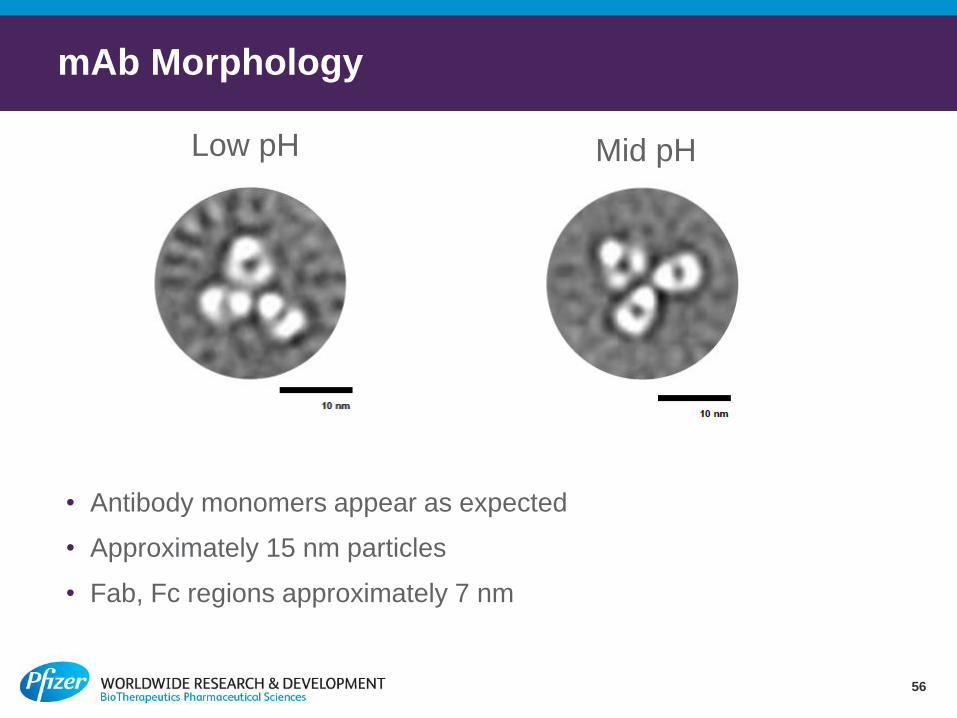
mAb Morphology
56
Low pH Mid pH
• Antibody monomers appear as expected
• Approximately 15 nm particles
• Fab, Fc regions approximately 7 nm