key data once -in a century opportunity
TRANSCRIPT

Edelweiss Research is also available on www.edelweissresearch.com, Bloomberg - EDEL, Thomson Reuters, and Factset Edelweiss Securities Limited
KEY DATA
Rating BUY Sector relative Outperformer Price (INR) 5,906 12 month price target (INR) 7,505 Market cap (INR bn/USD bn) 1,035/13.7 Free float/Foreign ownership (%) 25.3/13.3
What’s Changed Target Price
Rating/Risk Rating ⚊
QUICK TAKE
Once-in-a-century opportunity
L&T Infotech (LTI) reported a robust set of Q2FY22 numbers-—revenue grew 8.3% QoQ to USD509mn, beating our and Street’s estimates of USD499mn and USD485.8mn, respectively. EBIT margin improved by 80bp QoQ to 17.2%, slightly lower than our estimate of 17.3%, while beating Street’s estimate of 17%. Net profit increased by 11.1% QoQ to INR5.5bn.
The company reported stronger-than-expected results driven by robust demand across verticals and geographies. Management believes current demand trend is once-in-a-century opportunity. We are raising the TP to INR7,505 (from INR6,459) based on LTI”s strong earnings growth and rollover to Q4FY23E. Maintain ‘BUY’.
FINANCIALS (INR mn)
Year to March FY21A FY22E FY23E FY24E
Revenue 1,23,698 1,54,934 1,85,225 2,11,187
EBITDA 27,251 33,257 44,853 48,927
Adjusted profit 19,381 24,828 32,827 35,379
Diluted EPS (INR) 110.2 141.1 185.8 200.0
EPS growth (%) 27.6 28.0 31.7 7.7
RoAE (%) 30.5 31.8 36.4 33.9
P/E (x) 53.6 41.9 31.8 29.5
EV/EBITDA (x) 35.6 29.1 21.3 19.4
Dividend yield (%) 0.7 1.2 1.6 1.7
PRICE PERFORMANCE
Demand across the board
The unprecedented demand trend is driven by three levers: i) Higher discretionary
spending as companies across industries and geographies go through once-in-a-
century technology-led transformation of business. ii) Emergence of new areas of
spending such as ESG and cloud security, among others. iii) A fundamental shift in
supply side as demand for talent is higher than supply, which leading to a sharp
increase in wages as well as attrition across industries. To manage these supply
challenges, clients are increasingly using automation and other technologies for
better efficiencies. LTI is also facing supply-side challenges like its peers and clients,
which resulted in higher attrition of 19.6% compared with 15.2% in last quarter. LTI
hired ~4k employees in Q2FY22 to manage attrition and drive growth. Additionally,
it plans to hire 5.5k freshers in FY22.
Best-ever demand outlook
LTI maintained that demand trend continues to be robust and best-ever seen by the
company. It is confident of comfortably crossing the revenue milestone of USD2bn
in FY22. Management continues to expect FY22 PAT margin to be in the 14-15%
range. The company continues to effectively mine clients with one client addition in
USD50mn, three in USD20mn, and five each in USD10mn USD5mn buckets.
Moreover, It won a five-year deal of new logo in Europe with a TCV of USD30mn.
Explore:
Outlook and valuation: Accelerated growth; maintain ‘BUY’
Management has highlighted that demand trend they are witnessing is one of the
best-ever. We believe LTI will continue to deliver industry-leading growth. The stock
is trading at 31.8x FY23E. We maintain ‘BUY/SO’ with a revised TP of INR7,505 (40x
Q4FY23E) based on strong growth and rollover to Q4FY23E.
Financials Year to March Q2FY22 Q2FY21 % Change Q1FY22 % Change
Net Revenue 37,670 29,984 25.6 34,625 8.8
EBITDA 7,332 6,856 6.9 6,478 13.2
Adjusted Profit 5,517 4,568 20.8 4,969 11.0
Diluted EPS (INR) 31.4 26.0 21.0 28.3 11.1
Above In line Below
Profit
Margins
Revenue Growth
Overall
39,000
43,600
48,200
52,800
57,400
62,000
2,850
3,530
4,210
4,890
5,570
6,250
Oct-20 Jan-21 Apr-21 Jul-21 Oct-21
LTI IN Equity Sensex
India Equity Research IT October 18, 2021
L&T INFOTECH RESULT UPDATE
Sandip Agarwal Pranav Kshatriya Nikhil Choudhary Ayur Bohra +91 (22) 6623 3474 +91 (22) 4040 7495 [email protected] [email protected] [email protected] [email protected]
Corporate access
Financial model Podcast
Video

L&T INFOTECH
Edelweiss Securities Limited
2 Edelweiss Research is also available on www.edelweissresearch.com, Bloomberg - EDEL, Thomson Reuters, and Factset
Financial Statements
Income Statement (INR mn) Year to March FY21A FY22E FY23E FY24E
Total operating income 1,23,698 1,54,934 1,85,225 2,11,187
Cost of revenues 82,193 1,04,613 1,19,740 1,39,761
Gross Profit 41,505 50,321 65,485 71,427
SG&A 14,254 17,064 20,632 22,500
EBITDA 27,251 33,257 44,853 48,927
Depreciation 3,325 3,541 4,471 5,251
EBIT 23,926 29,715 40,382 43,676
Add: Other income 1,955 3,298 2,811 2,875
Profit before tax 25,881 33,013 43,193 46,551
Prov for tax 6,500 8,185 10,366 11,172
Less: Other adj 0 0 0 0
Reported profit 19,381 24,828 32,827 35,379
Less: Excp.item (net) 0 0 0 0
Adjusted profit 19,381 24,828 32,827 35,379
Diluted shares o/s 176 176 177 177
Adjusted diluted EPS 110.2 141.1 185.8 200.0
DPS (INR) 44.1 70.5 92.9 100.0
Tax rate (%) 25.1 24.8 24.0 24.0
Important Ratios (%) Year to March FY21A FY22E FY23E FY24E
Cost of rev. as a % of rev. 66.4 67.5 64.6 66.2
SG&A exp. as a % of rev. 11.5 11.0 11.1 10.7
Dep. as % of gross block 6.8 14.6 12.7 11.4
EBITDA margin (%) 22.0 21.5 24.2 23.2
Net profit margin (%) 15.7 16.0 17.7 16.8
Revenue growth (% YoY) 13.7 25.3 19.6 14.0
EBITDA growth (% YoY) 34.3 22.0 34.9 9.1
Adj. profit growth (%) 27.5 28.1 32.2 7.8
Assumptions (%) Year to March FY21A FY22E FY23E FY24E
GDP (YoY %) (8.0) 9.5 7.0 7.0
Repo rate (%) 4.0 4.0 4.3 4.3
USD/INR (average) 74.2 73.0 72.0 71.0
Tax rate as % of PBT 25.1 24.8 24.0 24.0
Capex (INR mn) 2,719.0 2,900.6 4,360.0 5,536.2
Receivable (days) 64.9 55.1 53.1 55.1
Payable (days) 33.8 27.8 25.8 26.0
Cash conversion cycle
(days)
31.0 27.3 27.4 29.2
Net emp addition 2,130.0 1,476.0 4,160.0 3,945.0
Valuation Metrics Year to March FY21A FY22E FY23E FY24E
Diluted P/E (x) 53.6 41.9 31.8 29.5
Price/BV (x) 14.2 12.5 10.8 9.4
EV/EBITDA (x) 35.6 29.1 21.3 19.4
Dividend yield (%) 0.7 1.2 1.6 1.7
Source: Company and Edelweiss estimates
Balance Sheet (INR mn) Year to March FY21A FY22E FY23E FY24E
Share capital 175 175 175 175
Reserves 72,859 83,163 96,786 1,11,468
Shareholders funds 73,034 83,338 96,961 1,11,643
Minority interest 37 37 37 37
Borrowings 414 414 414 414
Trade payables 8,277 7,677 9,220 10,664
Other liabs & prov 17,667 19,716 22,102 24,890
Total liabilities 1,07,091 1,18,844 1,36,396 1,55,310
Net block 3,857 4,149 4,550 5,032
Intangible assets 9,241 8,308 7,796 7,599
Capital WIP 403 403 403 403
Total fixed assets 13,501 12,860 12,749 13,034
Non current inv 1,470 1,470 1,470 1,470
Cash/cash equivalent 43,876 46,103 58,066 65,093
Sundry debtors 20,835 25,955 27,958 35,840
Loans & advances 3,753 4,344 5,037 5,852
Other assets 23,656 28,111 31,116 34,021
Total assets 1,07,091 1,18,844 1,36,396 1,55,310
Free Cash Flow (INR mn) Year to March FY21A FY22E FY23E FY24E
Reported profit 19,381 24,828 32,827 35,379
Add: Depreciation 3,325 3,541 4,471 5,251
Interest (net of tax) 0 0 0 0
Others 141 (783) (1,024) (921)
Less: Changes in WC (1,149) 8,717 1,772 7,369
Operating cash flow 23,996 18,870 34,503 32,340
Less: Capex (2,719) (2,901) (4,360) (5,536)
Free cash flow 21,277 15,969 30,143 26,803
Key Ratios Year to March FY21A FY22E FY23E FY24E
RoE (%) 30.5 31.8 36.4 33.9
RoCE (%) 40.5 42.0 47.7 44.4
Inventory days 0 0 0 0
Receivable days 65 55 53 55
Payable days 34 28 26 26
Working cap (% sales) 17.6 19.7 17.4 18.8
Gross debt/equity (x) 0 0 0 0
Net debt/equity (x) (0.6) (0.5) (0.6) (0.6)
Interest coverage (x) 0 0 0 0
Valuation Drivers Year to March FY21A FY22E FY23E FY24E
EPS growth (%) 27.6 28.0 31.7 7.7
RoE (%) 30.5 31.8 36.4 33.9
EBITDA growth (%) 34.3 22.0 34.9 9.1
Payout ratio (%) 40.0 50.0 50.0 50.0

Edelweiss Securities Limited
L&T INFOTECH
Edelweiss Research is also available on www.edelweissresearch.com, Bloomberg - EDEL, Thomson Reuters, and Factset 3
Earnings call: Key highlights
Constant currency revenue grew 8.9% QoQ/25.5% YoY. In USD terms, revenue
came in at USD509mn, up 8.3% QoQ/25.8% YoY.
The Board of Directors has declared an interim dividend of INR15 per equity
share (face value of INR1).
Management highlighted that it is the best demand environment for next three
years.
Operating margin up 80bps QoQ to 17.2%. Net income margin was at 14.6%.
Voluntary attrition in IT services stood at 19.6%. Utilisation was at 81.6%,
including trainees.
Margin walk: 70bps of SG&A leverage was offset by 70bps margin dropped due
to utilization. Tailwinds from import mix and higher working days were partially
offset by higher employee costs
During Q2FY22, LTI added 4,084 employees on net basis. At end of Q2,
headcount was 42,382. DSO stood at 61 days. Increased fresher intake in India
to 5,500 for FY22.
Among verticals, BFS grew 10.6% QoQ (in CC); insurance grew 6.1% QoQ;
Manufacturing grew 12.9% QoQ; Energy & Utilities 6.9% QoQ; CPG, Retail &
Pharma grew 2.6% QoQ; Hi-tech, Media & Entertainment grew 7% QoQ; and
Others grew 15% QoQ.
By geography, North America contributed 67.5%, Europe 16.1%, India 9.8% and
RoW 6.6% to revenue.
The revenue breakdown by service offerings stood as follows--ADM and Testing
34.2%; Enterprise Solutions 30.4%; Cloud infrastructure & Services 14%;
Analytics, AI & Cognitive 12.1%; and Enterprise Integration & Mobility 9.3%.
Added 25 new logos in quarter and opened new logo in Europe with a TCV of
USD30mn for 5-year deal.
Added one new client in USD50mn+, three in USD20mn+, five each in USD10mn+
and USD5mn+
Operating cash flow was INR4,464mn, which was 91.3% of net income for
Q2FY22.
Outlook: PAT margin guidance of 14-15% for FY22.

L&T INFOTECH
Edelweiss Securities Limited
4 Edelweiss Research is also available on www.edelweissresearch.com, Bloomberg - EDEL, Thomson Reuters, and Factset
Key financial highlights
Q2FY22 Q1FY22 QoQ (%) Q2FY21 YoY (%) FY22E FY23E FY24E
Total revenues 37,670 34,625 8.8 29,984 25.6 1,54,934 1,85,225 2,11,187
Direct costs 26,011 23,898 8.8 19,537 33.1 1,04,613 1,19,740 1,39,761
Gross profit 11,659 10,727 8.7 10,447 11.6 50,321 65,485 71,427
SG&A expenses 4,327 4,249 1.8 3,591 20.5 17,064 20,632 22,500
EBITDA 7,332 6,478 13.2 6,856 6.9 33,257 44,853 48,927
Depreciation 850 795 6.9 899 (5.5) 3,541 4,471 5,251
EBIT 6,482 5,683 14.1 5,957 8.8 29,715 40,382 43,676
Less: Interest expense
Other Income 938 1,039 (9.7) 174 439.1 3,298 2,811 2,875
PBT 7,420 6,722 10.4 6,131 21.0 33,013 43,193 46,551
Provision for taxation 1,903 1,753 8.6 1,563 21.8 8,185 10,366 11,172
Reported profit 5,517 4,969 11.0 4,568 20.8 24,828 32,827 35,379
Diluted EPS (INR) 31.4 28.3 11.1 26.0 21.0 141.1 185.8 200.0
as % of net revenues
Direct costs 69.0 69.0 65.2 67.5 64.6 66.2
Gross margin 31.0 31.0 34.8 32.5 35.4 33.8
SG&A costs 11.5 12.3 12.0 11.0 11.1 10.7
EBITDA margin 19.5 18.7 22.9 21.5 24.2 23.2
EBIT margin 17.2 16.4 19.9 19.2 21.8 20.7
Adjusted profit 14.6 14.4 15.2 16.0 17.7 16.8
Tax rate 25.6 26.1 25.5 24.8 24.0 24.0
Source: Company, Edelweiss Research
Edelweiss Securities Limited
L&T INFOTECH
Edelweiss Research is also available on www.edelweissresearch.com, Bloomberg - EDEL, Thomson Reuters, and Factset 5
Company Description
LTI is a technology consulting and digital solutions company servicing over 438
clients globally. It offers a range of IT services to enterprises in diverse industries
such as banking & financial services, insurance, energy & process, consumer
packaged goods, retail & pharmaceuticals, media & entertainment, hi-tech &
consumer electronics and automotive & aerospace. The company’s range of services
includes application development, maintenance & outsourcing, enterprise
solutions, infrastructure management services, testing, digital solutions and
platform-based solutions. It commenced operations in 1997 as information
technology arm of the Larsen & Toubro (L&T) Group and accordingly leverages the
latter’s strengths and heritage. Nasscom ranked LTI the sixth-largest Indian IT
services company and amongst the top-20 IT service providers globally.
Investment Theme
L&T Infotech (LTI), India’s sixth-largest IT services company, has held its ground in an
industry racked by transitional and macro headwinds led by dynamic leadership of
Mr. Sanjay Jalona and Mr. Sudhir Chaturvedi. Its resilience has been underpinned by
superior execution, higher digital penetration and prudent strategy of targeting
niche segments within each vertical. We perceive further growth catalysts in: i)
potential uptrend in tech spending of BFSI vertical (46% of revenues); and ii)
bottoming out of the Energy & Utilities (E&U) vertical. Moreover, digital capability
enhancing alliances, deepening client relationships focus and leveraging of parent
L&T’s technical expertise are key growth catalysts.
Key Risks
Rapid changes in technology, Intense competition in IT services, High dependence
on limited clients, Adverse exchange rate fluctuations
L&T INFOTECH
Edelweiss Securities Limited
6 Edelweiss Research is also available on www.edelweissresearch.com, Bloomberg - EDEL, Thomson Reuters, and Factset
Additional Data Management
CEO Sanjay Jalona
CFO Anil Rander
COO Nachike Deshpande
Other
Auditor B. K. Khare & Co.
Holdings – Top 10* % Holding % Holding
L&T 74.09 Invesco 0.86
UTI AMC 1.91 Vanguard 0.80
UTI Flexi Cap F 1.83 Aditya Birla SL 0.50
Blackrock 0.93 ICICI Prudentia 0.38
Wasatch Inc 0.89 Government Pens 0.19
*Latest public data
Recent Company Research Date Title Price Reco
18-Aug-21 Best-in-decade demand; Company Update
4420.25 Buy
16-Jul-21 Upcycle to continue for four-five years; Result Update
4420.25 Buy
05-May-21 Strong momentum despite challenges; Result Update
3923.6 Buy
Recent Sector Research Date Name of Co./Sector Title
14-Oct-21 Cyient Digital solutions to accelerate growth; Result Update
14-Oct-21 HCL Technologies P&P business impacts growth; Result Update
13-Oct-21 Wipro All-round outperformance; Result Update
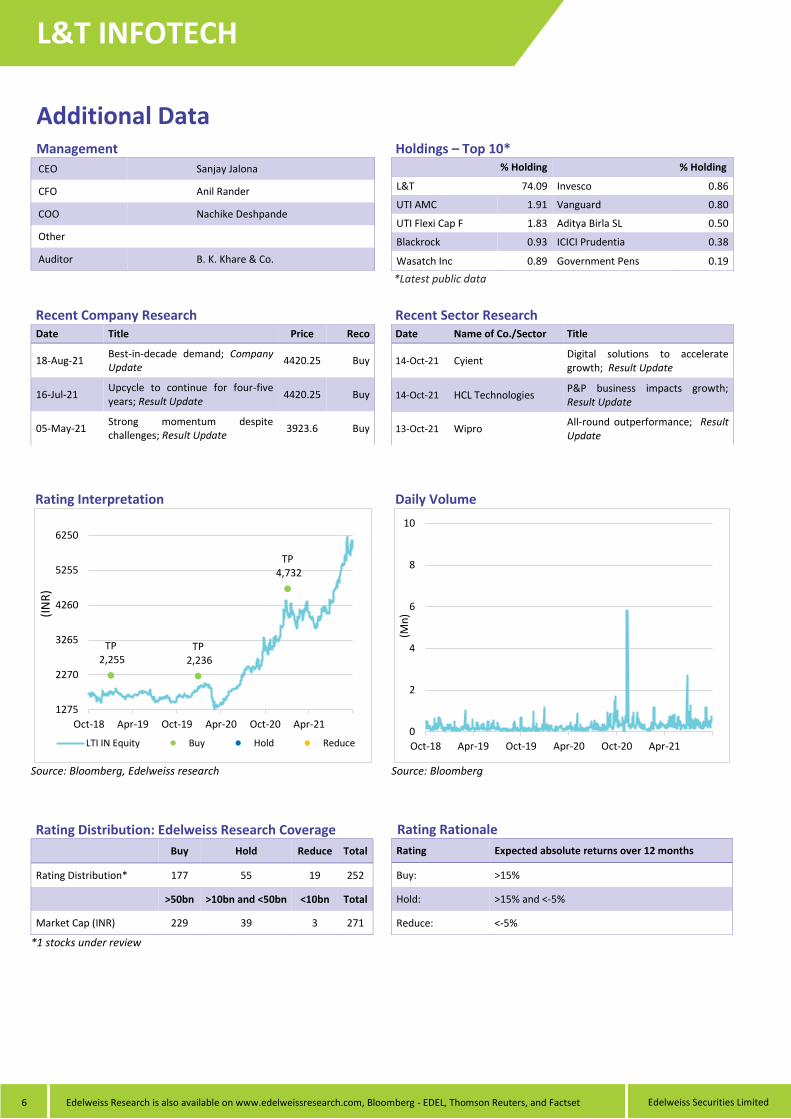
Rating Interpretation
Source: Bloomberg, Edelweiss research
Daily Volume
Source: Bloomberg
Rating Distribution: Edelweiss Research Coverage
Buy Hold Reduce Total
Rating Distribution* 177 55 19 252
>50bn >10bn and <50bn <10bn Total
Market Cap (INR) 229 39 3 271
*1 stocks under review
Rating Rationale
Rating Expected absolute returns over 12 months
Buy: >15%
Hold: >15% and <-5%
Reduce: <-5%
TP2,255
TP2,236
TP4,732
1275
2270
3265
4260
5255
6250
Oct-18 Apr-19 Oct-19 Apr-20 Oct-20 Apr-21
(IN
R)
LTI IN Equity Buy Hold Reduce0
2
4
6
8
10
Oct-18 Apr-19 Oct-19 Apr-20 Oct-20 Apr-21
(Mn
)

Edelweiss Securities Limited
L&T INFOTECH
Edelweiss Research is also available on www.edelweissresearch.com, Bloomberg - EDEL, Thomson Reuters, and Factset 7
DISCLAIMER Edelweiss Securities Limited (“ESL” or “Research Entity”) is regulated by the Securities and Exchange Board of India (“SEBI”) and is licensed to carry on the business of broking, Investment Adviser, Research Analyst and related activities.
This Report has been prepared by Edelweiss Securities Limited in the capacity of a Research Analyst having SEBI Registration No.INH200000121 and distributed as per SEBI (Research Analysts) Regulations 2014. This report does not constitute an offer or solicitation for the purchase or sale of any financial instrument or as an official confirmation of any transaction. Securities as defined in clause (h) of section 2 of the Securities Contracts (Regulation) Act, 1956 includes Financial Instruments and Currency Derivatives. The information contained herein is from publicly available data or other sources believed to be reliable. This report is provided for assistance only and is not intended to be and must not alone be taken as the basis for an investment decision. The user assumes the entire risk of any use made of this information. Each recipient of this report should make such investigation as it deems necessary to arrive at an independent evaluation of an investment in Securities referred to in this document (including the merits and risks involved), and should consult his own advisors to determine the merits and risks of such investment. The investment discussed or views expressed may not be suitable for all investors.
This information is strictly confidential and is being furnished to you solely for your information. This information should not be reproduced or redistributed or passed on directly or indirectly in any form to any other person or published, copied, in whole or in part, for any purpose. This report is not directed or intended for distribution to, or use by, any person or entity who is a citizen or resident of or located in any locality, state, country or other jurisdiction, where such distribution, publication, availability or use would be contrary to law, regulation or which would subject ESL and associates / group companies to any registration or licensing requirements within such jurisdiction. The distribution of this report in certain jurisdictions may be restricted by law, and persons in whose possession this report comes, should observe, any such restrictions. The information given in this report is as of the date of this report and there can be no assurance that future results or events will be consistent with this information. This information is subject to change without any prior notice. ESL reserves the right to make modifications and alterations to this statement as may be required from time to time. ESL or any of its associates / group companies shall not be in any way responsible for any loss or damage that may arise to any person from any inadvertent error in the information contained in this report. ESL is committed to providing independent and transparent recommendation to its clients. Neither ESL nor any of its associates, group companies, directors, employees, agents or representatives shall be liable for any damages whether direct, indirect, special or consequential including loss of revenue or lost profits that may arise from or in connection with the use of the information. Our proprietary trading and investment businesses may make investment decisions that are inconsistent with the recommendations expressed herein. Past performance is not necessarily a guide to future performance .The disclosures of interest statements incorporated in this report are provided solely to enhance the transparency and should not be treated as endorsement of the views expressed in the report. The information provided in these reports remains, unless otherwise stated, the copyright of ESL. All layout, design, original artwork, concepts and other Intellectual Properties, remains the property and copyright of ESL and may not be used in any form or for any purpose whatsoever by any party without the express written permission of the copyright holders.
ESL shall not be liable for any delay or any other interruption which may occur in presenting the data due to any reason including network (Internet) reasons or snags in the system, break down of the system or any other equipment, server breakdown, maintenance shutdown, breakdown of communication services or inability of the ESL to present the data. In no event shall ESL be liable for any damages, including without limitation direct or indirect, special, incidental, or consequential damages, losses or expenses arising in connection with the data presented by the ESL through this report.
We offer our research services to clients as well as our prospects. Though this report is disseminated to all the customers simultaneously, not all customers may receive this report at the same time. We will not treat recipients as customers by virtue of their receiving this report.
ESL and its associates, officer, directors, and employees, research analyst (including relatives) worldwide may: (a) from time to time, have long or short positions in, and buy or sell the
Securities, mentioned herein or (b) be engaged in any other transaction involving such Securities and earn brokerage or other compensation or act as a market maker in the financial
instruments of the subject company/company(ies) discussed herein or act as advisor or lender/borrower to such company(ies) or have other potential/material conf lict of interest with
respect to any recommendation and related information and opinions at the time of publication of research report or at the time of public appearance. ESL may have proprietary long/short
position in the above mentioned scrip(s) and therefore should be considered as interested. The views provided herein are general in nature and do not consider risk appetite or investment
objective of any particular investor; readers are requested to take independent professional advice before investing. This should not be construed as invitation or solicitation to do business
with ESL.
ESL or its associates may have received compensation from the subject company in the past 12 months. ESL or its associates may have managed or co-managed public offering of securities for the subject company in the past 12 months. ESL or its associates may have received compensation for investment banking or merchant banking or brokerage services from the subject company in the past 12 months. ESL or its associates may have received any compensation for products or services other than investment banking or merchant banking or brokerage services from the subject company in the past 12 months. ESL or its associates have not received any compensation or other benefits from the Subject Company or third party in connection with the research report. Research analyst or his/her relative or ESL’s associates may have financial interest in the subject company. ESL and/or its Group Companies, their Directors, affiliates and/or employees may have interests/ positions, financial or otherwise in the Securities/Currencies and other investment products mentioned in this report. ESL, its associates, research analyst and his/her relative may have other potential/material conflict of interest with respect to any recommendation and related information and opinions at the time of publication of research report or at the time of public appearance.
Participants in foreign exchange transactions may incur risks arising from several factors, including the following: ( i) exchange rates can be volatile and are subject to large fluctuations; ( ii) the value of currencies may be affected by numerous market factors, including world and national economic, political and regulatory events, events in equity and debt markets and changes in interest rates; and (iii) currencies may be subject to devaluation or government imposed exchange controls which could affect the value of the currency. Investors in securities such as ADRs and Currency Derivatives, whose values are affected by the currency of an underlying security, effectively assume currency risk.
Research analyst has served as an officer, director or employee of subject Company: No
ESL has financial interest in the subject companies: No
ESL’s Associates may have actual / beneficial ownership of 1% or more securities of the subject company at the end of the month immediately preceding the date of publication of research report.
Research analyst or his/her relative has actual/beneficial ownership of 1% or more securities of the subject company at the end of the month immediately preceding the date of publication of research report: No
ESL has actual/beneficial ownership of 1% or more securities of the subject company at the end of the month immediately preceding the date of publication of research report: No
Subject company may have been client during twelve months preceding the date of distribution of the research report.
There were no instances of non-compliance by ESL on any matter related to the capital markets, resulting in significant and material disciplinary action during the last three years except that ESL had submitted an offer of settlement with Securities and Exchange commission, USA (SEC) and the same has been accepted by SEC without admitting or denying the findings in relation to their charges of non registration as a broker dealer.
A graph of daily closing prices of the securities is also available at www.nseindia.com
Analyst Certification:
The analyst for this report certifies that all of the views expressed in this report accurately reflect his or her personal views about the subject company or companies and its or their securities, and no part of his or her compensation was, is or will be, directly or indirectly related to specific recommendations or views expressed in this report.

L&T INFOTECH
Edelweiss Securities Limited
8 Edelweiss Research is also available on www.edelweissresearch.com, Bloomberg - EDEL, Thomson Reuters, and Factset
Additional Disclaimers
Disclaimer for U.S. Persons
This research report is a product of Edelweiss Securities Limited, which is the employer of the research analyst(s) who has prepared the research report. The research analyst(s) preparing the research report is/are resident outside the United States (U.S.) and are not associated persons of any U.S. regulated broker-dealer and therefore the analyst(s) is/are not subject to supervision by a U.S. broker-dealer, and is/are not required to satisfy the regulatory licensing requirements of FINRA or required to otherwise comply with U.S. rules or regulations regarding, among other things, communications with a subject company, public appearances and trading securities held by a research analyst account.
This report is intended for distribution by Edelweiss Securities Limited only to "Major Institutional Investors" as defined by Rule 15a-6(b)(4) of the U.S. Securities and Exchange Act, 1934 (the Exchange Act) and interpretations thereof by U.S. Securities and Exchange Commission (SEC) in reliance on Rule 15a 6(a)(2). If the recipient of this report is not a Major Institutional Investor as specified above, then it should not act upon this report and return the same to the sender. Further, this report may not be copied, duplicated and/or transmitted onward to any U.S. person, which is not the Major Institutional Investor.
In reliance on the exemption from registration provided by Rule 15a-6 of the Exchange Act and interpretations thereof by the SEC in order to conduct certain business with Major Institutional Investors, Edelweiss Securities Limited has entered into an agreement with a U.S. registered broker-dealer, Edelweiss Financial Services Inc. ("EFSI"). Transactions in securities discussed in this research report should be effected through Edelweiss Financial Services Inc.
Disclaimer for U.K. Persons
The contents of this research report have not been approved by an authorised person within the meaning of the Financial Services and Markets Act 2000 ("FSMA"). In the United Kingdom, this research report is being distributed only to and is directed only at (a) persons who have professional experience in matters relating to investments falling within Article 19(5) of the FSMA (Financial Promotion) Order 2005 (the “Order”); (b) persons falling within Article 49(2)(a) to (d) of the Order (including high net worth companies and unincorporated associations); and (c) any other persons to whom it may otherwise lawfully be communicated (all such persons together being referred to as “relevant persons”). This research report must not be acted on or relied on by persons who are not relevant persons. Any investment or investment activity to which this research report relates is available only to relevant persons and will be engaged in only with relevant persons. Any person who is not a relevant person should not act or rely on this research report or any of its contents. This research report must not be distributed, published, reproduced or disclosed (in whole or in part) by recipients to any other person. Disclaimer for Canadian Persons
This research report is a product of Edelweiss Securities Limited ("ESL"), which is the employer of the research analysts who have prepared the research report. The research analysts preparing the research report are resident outside the Canada and are not associated persons of any Canadian registered adviser and/or dealer and, therefore, the analysts are not subject to supervision by a Canadian registered adviser and/or dealer, and are not required to satisfy the regulatory licensing requirements of the Ontario Securities Commission, other Canadian provincial securities regulators, the Investment Industry Regulatory Organization of Canada and are not required to otherwise comply with Canadian rules or regulations regarding, among other things, the research analysts' business or relationship with a subject company or trading of securities by a research analyst.
This report is intended for distribution by ESL only to "Permitted Clients" (as defined in National Instrument 31-103 ("NI 31-103")) who are resident in the Province of Ontario, Canada (an "Ontario Permitted Client"). If the recipient of this report is not an Ontario Permitted Client, as specified above, then the recipient should not act upon this report and should return the report to the sender. Further, this report may not be copied, duplicated and/or transmitted onward to any Canadian person.
ESL is relying on an exemption from the adviser and/or dealer registration requirements under NI 31-103 available to certain international advisers and/or dealers. Please be advised that (i) ESL is not registered in the Province of Ontario to trade in securities nor is it registered in the Province of Ontario to provide advice with respect to securities; (ii) ESL's head office or principal place of business is located in India; (iii) all or substantially all of ESL's assets may be situated outside of Canada; (iv) there may be difficulty enforcing legal rights against ESL because of the above; and (v) the name and address of the ESL's agent for service of process in the Province of Ontario is: Bamac Services Inc., 181 Bay Street, Suite 2100, Toronto, Ontario M5J 2T3 Canada.
Disclaimer for Singapore Persons
In Singapore, this report is being distributed by Edelweiss Investment Advisors Private Limited ("EIAPL") (Co. Reg. No. 201016306H) which is a holder of a capital markets services license and an exempt financial adviser in Singapore and (ii) solely to persons who qualify as "institutional investors" or "accredited investors" as defined in section 4A(1) of the Securities and Futures Act, Chapter 289 of Singapore ("the SFA"). Pursuant to regulations 33, 34, 35 and 36 of the Financial Advisers Regulations ("FAR"), sections 25, 27 and 36 of the Financial Advisers Act, Chapter 110 of Singapore shall not apply to EIAPL when providing any financial advisory services to an accredited investor (as defined in regulation 36 of the FAR. Persons in Singapore should contact EIAPL in respect of any matter arising from, or in connection with this publication/communication. This report is not suitable for private investors.
Disclaimer for Hong Kong persons
This report is distributed in Hong Kong by Edelweiss Securities (Hong Kong) Private Limited (ESHK), a licensed corporation (BOM -874) licensed and regulated by the Hong Kong Securities and Futures Commission (SFC) pursuant to Section 116(1) of the Securities and Futures Ordinance “SFO”. This report is intended for distribution only to “Professional Investors” as defined in Part I of Schedule 1 to SFO. Any investment or investment activity to which this document relates is only available to professional investor and will be engaged only with professional investors.” Nothing here is an offer or solicitation of these securities, products and services in any jurisdiction where their offer or sale is not qualified or exempt from registration. The report also does not constitute a personal recommendation or take into account the particular investment objectives, financial situations, or needs of any individual recipients. The Indian Analyst(s) who compile this report is/are not located in Hong Kong and is/are not licensed to carry on regulated activities in Hong Kong and does not / do not hold themselves out as being able to do so. Copyright 2009 Edelweiss Research (Edelweiss Securities Ltd). All rights reserved.
Aditya Narain
Head of Research
Aditya. [email protected]