key concept technology is used to map earth. · pdf filevocabulary remote sensing p. 218 ......
TRANSCRIPT
Sunshine StateSTANDARDSSC.H.3.3.4: The studentknows that technologi-cal design shouldrequire taking intoaccount constraintssuch as natural laws,the properties of thematerials used, andeconomic, political,social, ethical, and aesthetic values.SC.H.3.3.7: The studentknows that computersspeed up and extendpeople’s ability to col-lect, sort, and analyzedata; prepare researchreports; and share dataand ideas with others.
218 Unit 2: Earth’s Surface
VOCABULARYremote sensing p. 218sensor p. 219false-color image p. 220geographic information systems p. 221
BEFORE, you learned
• Contour lines are used ontopographic maps to show elevation, slope, and relief
• Contour lines follow certain rules• Map symbols show many natu-
ral and human-made features
NOW, you will learn
• How remote-sensing images canprovide detailed and accurateinformation about Earth
• How geographic data can bedisplayed in layers to build maps
KEY CONCEPT
Technology is used to map Earth.
THINK ABOUT
What can you seein this image?
Satellites can record all typesof information about Earth’ssurface. This image shows asection of Washington, D.C.The satellite that collected the data is 680 kilometers (420 mi) above Earth. Whatfamiliar items can you see in the picture? How mightimages like this be useful to scientists, mapmakers, and engineers?
Remote sensing provides detailed images of Earth.
If you have ever looked at an object through a pair of binoculars,you have used remote sensing. is the use of scientificequipment to gather information about something from a distance.Remote-sensing technology can be as simple as a camera mounted onan airplane or as complex as a satellite orbiting Earth.
To get an idea of how important remote sensing is, imagine youare a mapmaker in the 1840s. You have been asked to draw a map of astate, but you have no cameras, no photographs from airplanes, andno satellites to help you. To get a good view of the land, you have toclimb to the highest points and carefully draw every hill, valley, river,and landform below you. It will take you months to map the state.
Remote sensingVOCABULARYAdd a word triangle forremote sensing to yournotebook.
Image not available for use onthis CD-ROM. Please refer tothe image in the textbook.

Chapter 6: Views of Earth Today 219
Today, that same map would take far less time to make. Modernmapmakers use remote-sensing images from airplanes and satellites to develop highly detailed and accurate maps of Earth’s surface.
Airplane cameras use film to record data, but satellites use sensorsto build images of Earth. A is a mechanical or electrical devicethat receives and responds to a signal, such as light. Satellite sensorsdetect far more than your eyes can see. They collectinformation about the different types of energycoming from Earth’s surface. The satellites thensend that information to computers on Earth.
The computers turn the information intoimages, as shown in the illustration below. Satellitedata can be used to build an image of the entireplanet, a single continent, or a detail of your area.For example, the image on the right shows a closeupof the Jefferson Memorial in Washington, D.C.
check your reading Explain how remote sensing is used to gather information about Earth.
sensor
This satellite image includes the JeffersonMemorial, walkways, and roads. See if you canfind the memorial in the image on page 218.Satellite Imaging
Satellite Imaging
As the satellite orbitsEarth, its sensors recordthe energies reflected oremitted by the targetarea on the surface.
1The data are transmit-ted as computer codes,which are turned intoelectronic dots (calledpixels) on a screen.
2
The pixels are used toform an exact image of each section of thetarget area.
3
Objects on Earth reflect or emit different types of energy.Satellite sensors can detect and record these energies.
Image not available for use onthis CD-ROM. Please refer tothe image in the textbook.
220 Unit 2: Earth’s Surface
How do satellites send images to Earth?
WHAT DO YOU THINK?• What would happen if you accidentally skipped or repeated a row?
• If you increased or decreased the number and size of the squares,how would this affect the picture?
CHALLENGE Use a variety of colors to send other initials or an image.Your code must tell the receiver which color to use for each square.
Satellite ImagingSatellite ImagingSKILL FOCUSModeling
MATERIALS • graph paper• pen or pencil• for Challenge:
colored pens orpencils
TIME25 minutes
PROCEDURE
Work with a partner. One of youwill be the “sensor,” and the otherwill be the “receiving station.”
The sensor draws the initials of afamous person on a piece of graphpaper. The receiving station doesNOT see the drawing.
The sensor sends the picture to thereceiving station. For blank squares,
the sensor says “Zero.” For filled-in squares, the sensor says “One.”Be sure to start at the top row andread left to right, telling the receiv-ing station when a new row begins.
The receiving station transfers thecode to the graph paper. At theend, the receiver has three tries toguess whose initials were sent.
4
3
2
1
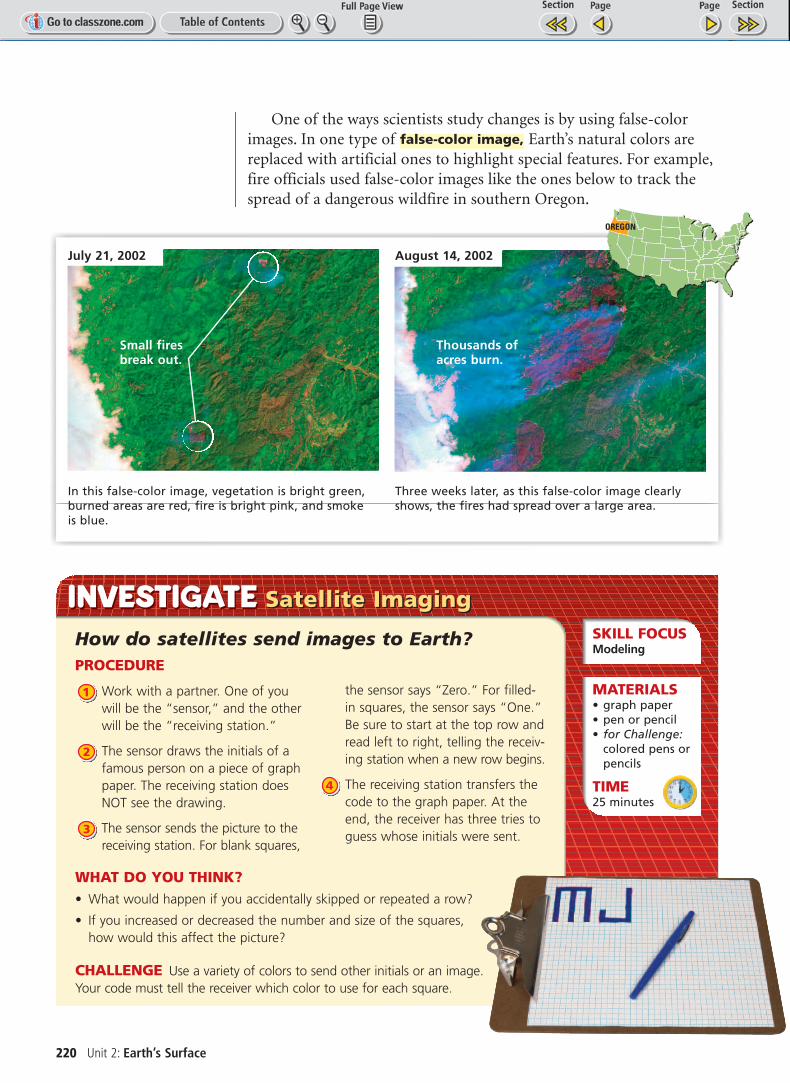
One of the ways scientists study changes is by using false-colorimages. In one type of Earth’s natural colors arereplaced with artificial ones to highlight special features. For example,fire officials used false-color images like the ones below to track thespread of a dangerous wildfire in southern Oregon.
false-color image,
July 21, 2002 August 14, 2002July 21, 2002 August 14, 2002
In this false-color image, vegetation is bright green,burned areas are red, fire is bright pink, and smoke is blue.
Three weeks later, as this false-color image clearlyshows, the fires had spread over a large area.
OREGON
Thousands ofacres burn.
Small firesbreak out.

Geographic information systems displaydata in layers.
Any good city map will show you what is on the surface—buildings,streets, parks, and other features. But suppose you need to knowabout tunnels under the city. Or maybe you want to know where the most students live. An ordinary map, even one based on remote-sensing images, will not tell you what you want to know.
Instead, you would turn to geographic information systems.(GIS) are computer systems that
can store and arrange geographic data and display the data in manydifferent types of maps. Scientists, city planners, and engineers all useGIS maps to help them make decisions. For example, suppose yourcity wants to build a new airport. It must be away from populatedareas and near major highways. The illustration below shows how city officials might use GIS to pick the best site.
Geographic information systems
Geographic Information Systems
The airport must be easily reached by roadways (all areas have good roadways).
The data are combined by a computer to produce a map showing the best sites (shaded orange) for the airport.
City officials want to build a new airport. A terrain map shows areas (shaded orange) flat enough to land airplanes.
GIS can be used to produce maps that help peoplemake decisions.
The airport must be built in one of the areas (shaded pink) with the fewest homes.
terrain
population
roadways
best sites
Chapter 6: Views of Earth Today 221
RESOURCE CENTERCLASSZONE.COM
Find out more abouthow GIS is used.

222 Unit 2: Earth’s Surface
Mammoth Mountain
Any geographic information can be entered into GIS and converted into a map. These systems are especially useful in displaying information about changes in the environment.
For example, near Long Valley in California, the volcano known as Mammoth Mountain began giving off carbon dioxide, or CO2.As the gas rose through the soil, it began killing the roots of treesnearby. Scientists measured the flow of CO2 around Horseshoe Lakeand other areas. They used computer software to build the mapsshown below.
check your reading Summarize the ways GIS maps can be helpful to engineers, cityplanners, and scientists.
KEY CONCEPTS1. How are satellites used to
make images of Earth fromouter space?
2. What are some of the types ofinformation obtained byremote sensing?
3. Explain in your own wordswhat a GIS map is.
CRITICAL THINKING4. Infer Explain how satellite
images might be used to pre-dict what a natural area mightlook like in 50 or 100 years.
5. Evaluate If you wanted tocompare a region before andduring a flood, how couldfalse-color images help you?
CHALLENGE6. Analyze Work with a small
group. Suppose you wanted toask the city to build a skate-board park. What types ofinformation would you need inorder to propose a good site?Draw a map to display eachtype of information.
HorseshoeLake
0 .25 .5 kilometer
0 .25 .5 mile
Area of tree kill
Horseshoe Lake
Area Map
A photo taken from the airshows patches of dying forestnear Horseshoe Lake.
Data from photos and CO2flow maps are used to make a map of dead anddying trees.
HorseshoeLake
CO2 flow
high
low
0
Lake Mary Road
CO2 Flow Levels
This CO2 flow map shows whythe trees are dying and whereother trees may be in danger.